SPE 113305 Methodologies and Solutions to Remediate Inter-Well Communication Problems on the SACROC CO 2 EOR Project – A Case Study Rebecca Larkin, SPE, Kinder Morgan CO2; Prentice Creel, SPE, Kinder Morgan CO2 Copyright 2008, Society of Petroleum Engineers This paper was selected for presentation by an SPE program committee following review of information contained in an abstract submitted by the author(s). Contents of the paper have not been reviewed by the Society of Petroleum Engineers and are subject to correction by the author(s). The material does not necessarily reflect any position of the Society of Petroleum Engineers, its officers, or members. Electronic reproduction, distribution, or storage of any part of this paper without the written consent of the Society of Petroleum Engineers is prohibited. Permission to reproduce in print is restricted to an abstract of not more than 300 words; illustrations may not be copied. The abstract must contain conspicuous acknowledgment of SPE copyright. Abstract This paper describes a case study of conformance problems aggravated by apparent direct communication channels between injector and offset producer(s) in certain patterns of the SACROC Unit Carbon Dioxide Enhanced Oil Recovery (CO 2 EOR) Project in Scurry County, Texas. Such communication, frequently accompanied by limited vertical injection fluid distribution, results in rapid recycling of injectant and pattern sweep inefficiency. If excessive gas production cannot be controlled by increasing the ratio of water to CO2 (WAG) injection, offset production wells must be shut-in and/or CO2 injection stopped to avoid overloading surface handling systems. Taking this action reduces the opportunity to maintain optimum pressure support and desired mobility of the hydrocarbons in affected patterns. Unwanted communication paths are difficult to remediate due to the magnitude of the volumes of commercial materials normally required to address them. Various technologies and methods were investigated and/or deployed in attempts to redistribute injection into desired intervals and reduce the recycling. Besides filling eroded near wellbore formation (as indicated by caliper arm log surveys or solid plug back material volumes), most of the injection wells would have to be treated with solutions capable of modifying fluid flow away from the wellbore to affect inter-well communication. The objectives of reducing unnecessary cycling of injectant between injectors and producers, improving sweep efficiency, increasing oil production and improving the ultimate oil recovery were the drivers in searching for possible solutions. Problem identification through well testing, well logging, and volumetric analysis were guidance for the designed remediations on poor conformance patterns. The simplest diagnostic tool is the well test; monitoring the ratios of gas to oil, water to oil, and CO2 to oil provided simple exception checks to anticipated levels. While less quantitative than inter-well tracer surveys, over time, noting the apparent breakthrough time of CO2 to an offset producer after each switch from water to CO2 injection was possible when switches were staggered between neighboring injectors. Using radioactive tracer logging technologies, injection profiles run at variable rates and indicated pressure responses were analyzed through multi-rate injectivity profile analyses. Estimated injection fluid distribution using sequential injection profiles and allocated injection volumes were determined to gauge relative vertical sweep efficiency and potential wellbore intervals to target for remediation. These diagnostics established the criteria for the physical and chemical attributes needed for conformance treatments to address the identified problems. Selection of treatments was also restricted to ones that would withstand the detrimental effects of CO 2 injection and resistance to bacterial growth potential. Rigless workovers were desired because of the availability, time involvement and cost associated in performing workovers with pulling units. Examples of the problem identification diagnostics, the selection process for the needed solution attributes and capabilities, and the placement control requirements while performing the conformance treatments are detailed. Vertical profile modifications to several of the individual injection wells using new super absorbent crystallized co- polymer systems are shown. Introduction Today, most active CO 2 -EOR projects are located in west Texas, southern Wyoming, and southern Mississippi to This paper was prepared for presentation at the 2008 SPE/DOE Improved Oil Recovery Symposium held in Tulsa, Oklahoma, U.S.A., 19–23 April 2008.
Transcript
SPE 113305
Methodologies and Solutions to Remediate Inter-Well Communication Problems on the SACROC CO2 EOR Project – A Case Study Rebecca Larkin, SPE, Kinder Morgan CO2; Prentice Creel, SPE, Kinder Morgan CO2
Copyright 2008, Society of Petroleum Engineers
This paper was selected for presentation by an SPE program committee following review of information contained in an abstract submitted by the author(s). Contents of the paper have not been reviewed by the Society of Petroleum Engineers and are subject to correction by the author(s). The material does not necessarily reflect any position of the Society of Petroleum Engineers, its officers, or members. Electronic reproduction, distribution, or storage of any part of this paper without the written consent of the Society of Petroleum Engineers is prohibited. Permission to reproduce in print is restricted to an abstract of not more than 300 words; illustrations may not be copied. The abstract must contain conspicuous acknowledgment of SPE copyright.
Abstract This paper describes a case study of conformance problems aggravated by apparent direct communication channels between injector and offset producer(s) in certain patterns of the SACROC Unit Carbon Dioxide Enhanced Oil Recovery (CO2 EOR) Project in Scurry County, Texas. Such communication, frequently accompanied by limited vertical injection fluid distribution, results in rapid recycling of injectant and pattern sweep inefficiency. If excessive gas production cannot be controlled by increasing the ratio of water to CO2 (WAG) injection, offset production wells must be shut-in and/or CO2 injection stopped to avoid overloading surface handling systems. Taking this action reduces the opportunity to maintain optimum pressure support and desired mobility of the hydrocarbons in affected patterns. Unwanted communication paths are difficult to remediate due to the magnitude of the volumes of commercial materials normally required to address them.
Various technologies and methods were investigated and/or deployed in attempts to redistribute injection into desired intervals and reduce the recycling. Besides filling eroded near wellbore formation (as indicated by caliper arm log surveys or solid plug back material volumes), most of the injection wells would have to be treated with solutions capable of modifying fluid flow away from the wellbore to affect inter-well communication. The objectives of reducing unnecessary cycling of injectant between injectors and producers, improving sweep efficiency, increasing oil production and improving the ultimate oil recovery were the drivers in searching for possible solutions.
Problem identification through well testing, well logging, and volumetric analysis were guidance for the designed remediations on poor conformance patterns. The simplest diagnostic tool is the well test; monitoring the ratios of gas to oil, water to oil, and CO2 to oil provided simple exception checks to anticipated levels. While less quantitative than inter-well tracer surveys, over time, noting the apparent breakthrough time of CO2 to an offset producer after each switch from water to CO2 injection was possible when switches were staggered between neighboring injectors. Using radioactive tracer logging technologies, injection profiles run at variable rates and indicated pressure responses were analyzed through multi-rate injectivity profile analyses. Estimated injection fluid distribution using sequential injection profiles and allocated injection volumes were determined to gauge relative vertical sweep efficiency and potential wellbore intervals to target for remediation. These diagnostics established the criteria for the physical and chemical attributes needed for conformance treatments to address the identified problems.
Selection of treatments was also restricted to ones that would withstand the detrimental effects of CO2 injection and resistance to bacterial growth potential. Rigless workovers were desired because of the availability, time involvement and cost associated in performing workovers with pulling units.
Examples of the problem identification diagnostics, the selection process for the needed solution attributes and capabilities, and the placement control requirements while performing the conformance treatments are detailed. Vertical profile modifications to several of the individual injection wells using new super absorbent crystallized co-polymer systems are shown.
Introduction
Today, most active CO2-EOR projects are located in west Texas, southern Wyoming, and southern Mississippi to
This paper was prepared for presentation at the 2008 SPE/DOE Improved Oil Recovery Symposium held in Tulsa, Oklahoma, U.S.A., 19–23 April 2008.
2 SPE 113305
exploit natural supply and available pipelines for transport. Newer attempts are underway in Kansas and Canada in proximity to industrial sources. Industry studies have indicated the ability to gain additional hydrocarbon recovery from mature units using the CO2-EOR techniques to be among the best potential methods plus the added benefit of sequestrating the chief greenhouse gas in future projects. Ref 1
Typically, continuous CO2 or CO2 alternating water, floods are conducted in both sandstone and carbonate formations ranging from 4,000 ft to 10,000 ft in depth. The upper depth limit represents reservoir pressures generally needed to maintain miscibility between CO2 and oil; the lower limit is skewed toward the bulk of the current floods being in the oil reservoirs in the Permian Basin of West Texas. However, in mature floods, particularly in previously pressure depleted zones, reservoir conditions may exist allowing for the possibility of injection outside of the desired interval if formation parting pressure dropped with drop in pore pressure and injection pressure rose precipitously before equilibrium was reestablished via an induced fracture or eroded channel within the zone. Variations in the insitu permeability due to laminations and layering often result in imbalances in injectivity; and over extended flood times and volumes of injectant, deterioration of the rock due to erosion and dissolution resulting in initially fast tracking fluid paths and eventually development into fracture like communication paths. Water and CO2 WAG flood units in areas such as the Permian Basin of West Texas often display out-of-zone- injection or eroded fast tracking channels consisting of mostly fractures that occur due to a variety of circumstances; either mechanical or from a chemical/electrolysis reaction. Ref 2
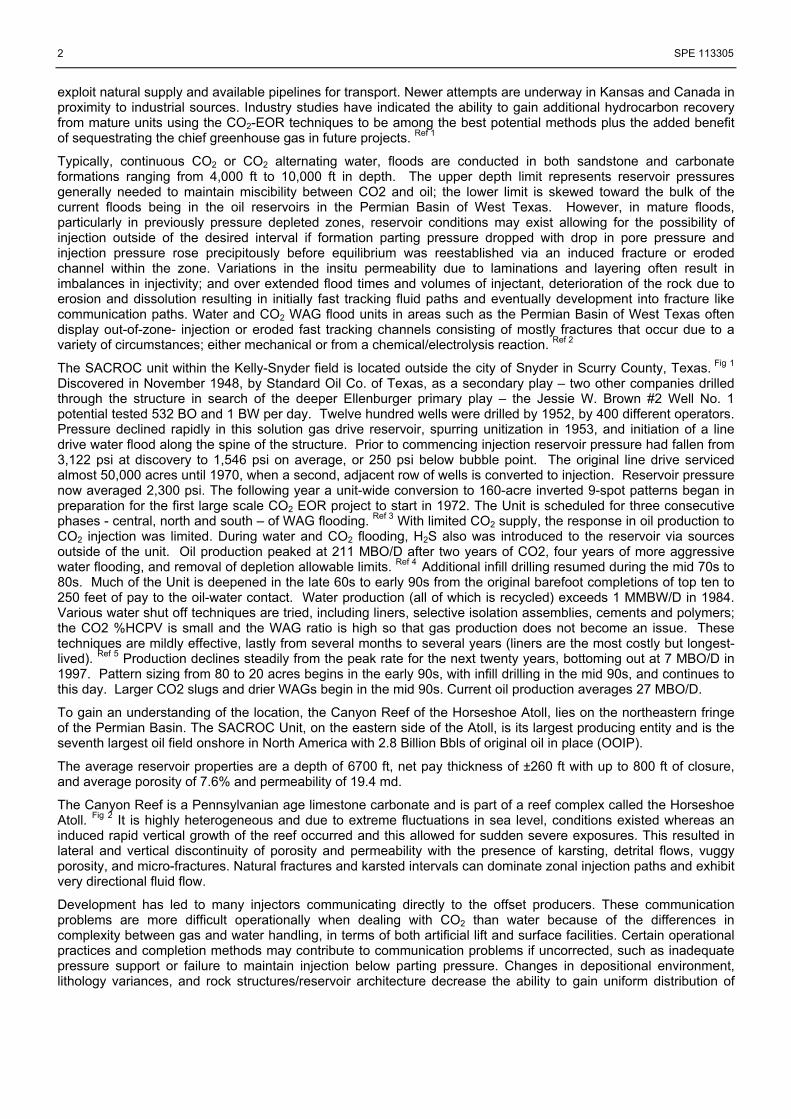
The SACROC unit within the Kelly-Snyder field is located outside the city of Snyder in Scurry County, Texas. Fig 1 Discovered in November 1948, by Standard Oil Co. of Texas, as a secondary play – two other companies drilled through the structure in search of the deeper Ellenburger primary play – the Jessie W. Brown #2 Well No. 1 potential tested 532 BO and 1 BW per day. Twelve hundred wells were drilled by 1952, by 400 different operators. Pressure declined rapidly in this solution gas drive reservoir, spurring unitization in 1953, and initiation of a line drive water flood along the spine of the structure. Prior to commencing injection reservoir pressure had fallen from 3,122 psi at discovery to 1,546 psi on average, or 250 psi below bubble point. The original line drive serviced almost 50,000 acres until 1970, when a second, adjacent row of wells is converted to injection. Reservoir pressure now averaged 2,300 psi. The following year a unit-wide conversion to 160-acre inverted 9-spot patterns began in preparation for the first large scale CO2 EOR project to start in 1972. The Unit is scheduled for three consecutive phases - central, north and south – of WAG flooding. Ref 3 With limited CO2 supply, the response in oil production to CO2 injection was limited. During water and CO2 flooding, H2S also was introduced to the reservoir via sources outside of the unit. Oil production peaked at 211 MBO/D after two years of CO2, four years of more aggressive water flooding, and removal of depletion allowable limits. Ref 4 Additional infill drilling resumed during the mid 70s to 80s. Much of the Unit is deepened in the late 60s to early 90s from the original barefoot completions of top ten to 250 feet of pay to the oil-water contact. Water production (all of which is recycled) exceeds 1 MMBW/D in 1984. Various water shut off techniques are tried, including liners, selective isolation assemblies, cements and polymers; the CO2 %HCPV is small and the WAG ratio is high so that gas production does not become an issue. These techniques are mildly effective, lastly from several months to several years (liners are the most costly but longest-lived). Ref 5 Production declines steadily from the peak rate for the next twenty years, bottoming out at 7 MBO/D in 1997. Pattern sizing from 80 to 20 acres begins in the early 90s, with infill drilling in the mid 90s, and continues to this day. Larger CO2 slugs and drier WAGs begin in the mid 90s. Current oil production averages 27 MBO/D.
To gain an understanding of the location, the Canyon Reef of the Horseshoe Atoll, lies on the northeastern fringe of the Permian Basin. The SACROC Unit, on the eastern side of the Atoll, is its largest producing entity and is the seventh largest oil field onshore in North America with 2.8 Billion Bbls of original oil in place (OOIP).
The average reservoir properties are a depth of 6700 ft, net pay thickness of ±260 ft with up to 800 ft of closure, and average porosity of 7.6% and permeability of 19.4 md.
The Canyon Reef is a Pennsylvanian age limestone carbonate and is part of a reef complex called the Horseshoe Atoll. Fig 2 It is highly heterogeneous and due to extreme fluctuations in sea level, conditions existed whereas an induced rapid vertical growth of the reef occurred and this allowed for sudden severe exposures. This resulted in lateral and vertical discontinuity of porosity and permeability with the presence of karsting, detrital flows, vuggy porosity, and micro-fractures. Natural fractures and karsted intervals can dominate zonal injection paths and exhibit very directional fluid flow.
Development has led to many injectors communicating directly to the offset producers. These communication problems are more difficult operationally when dealing with CO2 than water because of the differences in complexity between gas and water handling, in terms of both artificial lift and surface facilities. Certain operational practices and completion methods may contribute to communication problems if uncorrected, such as inadequate pressure support or failure to maintain injection below parting pressure. Changes in depositional environment, lithology variances, and rock structures/reservoir architecture decrease the ability to gain uniform distribution of
SPE 113305 3
injectant both vertically and laterally, or total sweep efficiency, within the reservoir. Permeability ranges from less than 10 md, “slow perm or slow processing streaks”, to hundreds of millidarcies, “fast perm or fast processing streaks”. Zonal porosity and pay thickness can also vary drastically between adjacent wells.
Using local knowledge of inter-well communication from well tests, injection log profiles, and reservoir characterization studies, a pilot project was launched to make a change in the flood performance. A conformance enhanced flood management design using any solution capable of economically modifying the path most injectant was taking in inter-well communications was studied. Scrutinizing a variety of options in solutions ranging from cement products, chemical systems, and mechanical means – a decision was made to use an emerging solution showing promise and capability in other areas of the Permian Basin to control inter-well communication problems.
A dehydrated crystallized copolymer (material consisting of dehydrated super absorbent copolymer crystals) was selected over other past attempted selections such as performing foamed cement squeezes or gel material options for the purpose of modifying fast tracking inter-well communication. The ongoing project and newly developed processes and methods now used in this flood are detailed in the paper. However, the profile modification and diversion project was planned for and kept open to all methods or solutions that might be developed in future to address improving reservoir performance cost effectively.
Flooding Problems
The Unit’s Reef Formation is characterized as highly heterogeneous and due to extreme fluctuations in sea level, conditions existed whereas an induced rapid vertical growth of the reef occurred and this allowed for sudden severe exposures. This resulted in lateral and vertical discontinuity of porosity and permeability with the presence of karsting, detrital flows, touching vuggy porosity, and micro-fractures. Often problems displaying out-of-zone injection or preferential paths within the interval are first noticed because of excessive production of CO2 or water with one or more of the injector’s offsetting producers. The direct communication between injectors and producers is referred to as breakthrough and appears as a very rapid spike in injectant production volumes in the producers shortly after the injection cycle starts. Without corrective action this increase in injectant production is usually accompanied by a decrease in oil production, as miscible contact time is diminished or injectant literally bypasses oil. The other criteria that is used in identifying problems is monitoring offset wells that are not performing based on pressure support if the injection is lost to another zone which is not connected to the desired interval. Ref 6 Conditions of the in-zone rapid breakthrough are characterized by the offset producers freezing up due to the rapid throughput of CO2. SACROC has mitigated freezing in recent years with staged pressure surface separation systems.
For the Permian Basin in general, wellbore losses of integrity and casing usually display similar conditions with a potential of water influxes and cross-flows prevalent within the producing intervals. Often observed are injection patterns that are following natural fracture paths that lead across the flooded units and cause dynamic interference and dilution to any solution meant to remedy the inter-well communication conditions. Hazardous conditions also exist with the presence of H2S and iron sulfide content. Understanding the inter-well communication conditions needs to be addressed in defining and characterizing a solution’s attributes and capabilities to obtain any treatment success. Ref 7, 8
Capabilities desired to remediate the identified problems were based on:
• High probability of success • Return on investment potential • Amount of data available to give better understanding • Past workovers • Corrosion problems that exist • Facilities capabilities • Required treatments for paraffin and scale removal via acidizing, etc. • Disposal needs and cost, regulatory requirements, and environmental issues • Rapid communication conditions leading to additional problems such as increased near-wellbore corrosion,
loss of wellbore integrity, and difficulty in maintaining a packer seal.
• Performing both reservoir and individual well evaluation, which can be influenced by mechanical or near-wellbore problems, should be used to define the benefit in addressing problems with injection losses or inefficiencies. Any resulting solutions engineered to remediate the problems can then address reservoir sweep problems and inter-well communications. The anticipated outcome still is directed toward the goals of increased production and recovery with an associated reduction in operating costs.
4 SPE 113305
• Historical injection profiles, completion and stimulation details, and well tests are obtained on the subject wells.
Candidate wells are selected for treatment according to a prioritized list of injector/producer pairs or combinations of associated wells that result from sub-par flood performance, including reserve recovery and total gas-oil ratio. These wells are reviewed again to eliminate those with known mechanical problems or restrictions.
Annual injection profiles are run on each SACROC injection well under normal injection rates and pressures to track vertical injection distribution over time. The profile survey logs are obtained on both the water and CO2 cycles to determine whether injection is entering the same intervals similarly regardless of the injection fluid. These injection profiles are used for designing and placing the conformance treatments, which were tailored to each well’s requirements. After a conformance candidate is selected, a well bore clean out followed by one or more injection profiles is then obtained on the subject wells before a final design treatment is made.
Multi-rate injection profiles are utilized to gain an understanding of the injectant fluid distribution under different conditions to simulate operational changes over time or aid in treatment design. These multi-rate analyses are conducted with a logging tool in the hole that is equipped with a release device capable of placing a specified amount of radioactive material, normally I-131, into the flow stream above the logging tools. A required base log gamma ray is used for determining variations. The testing is performed with releases of isotopes placed in planned segments through the wellbore, or velocity shots, followed with a large shot of isotope placed above the pay zone, or intensity shot. The logging tool then tracks or traces the relative percentage and exit path(s) taken by the isotope from the wellbore. Combining these analyses with a temperature analysis also provides a better understanding of injection a short distance away from the wellbore. The process is started at a reduced rate below the daily injection rate. The subsequent runs for multi-rates are taken at incremented increased rates after time is allowed for the previously shot isotopes to clear and for fluid flow to stabilize. Static cross-flows between intervals can also be checked to estimate potential pressure differential. The rate steps are performed by increasing the injection rate and ensuring that the bottom hole injection pressure (BHIP) does not exceed the fracture gradient if not already fractured. The focus is to determine if exit distribution varies at the different rates and accompanying changes in BHIP, if any, on each injection phase with water and/or CO2. Ref 9
Armed with the multi-rate injection analysis, various placement techniques exist and can be planned for in selecting the best available procedure. Maximum injection pressure can be determined for bullheading the treatment fluids based on the communication problems identified. Differential pressure responses may indicate the tortuosity aspects of fluid entry into specific portions of the reservoir. When rates exceed certain velocities, such solutions as cement slurries, gels, or particulates can be pumped into a specific portion of the formation. With permeabilities ranging up to a darcy in the Unit’s reservoir, reduces the chance of injecting a gelled fluid with the placement rate at matrix flow. This analysis helped us determine if a treatment could be placed where it develops a blocking and diverting effect without entering other undesired portions of the formation. Further investigation may show that a specific pressure developed from varying injection rate could cause undesired entry; this information is useful in limiting the treatment pressure. In developing a solution for the identified problem, it needs to have the capability to successfully be placed at the right part of a reservoir without becoming an obstruction to beneficial production and fluid displacement. Ref 10, 11
The nature of the architecture that accepts high rates of injection over relatively short vertical sections, particularly if not evident on conventional porosity logs, are characteristic of naturally occurring low porosity, high permeability erosional surfaces or weaker rock being leached out and eroded from years of water and CO2 injection creating fracture-like structures. Frequently, the reservoir pressure is increased in CO2 floods to a desired pore pressure (to assure miscibility), multi-rate injection profiles can see these features, but the pressure responses may be “masked” and hidden because of the pressures maintained on the reservoir by operations. Assumptions can be made that the problems lay within a permeability feature and not those of a fractured system, leading operations to pick the wrong technique and product to address the problem. Combining core, log, and multiple type test data may help distinguish the difference.
Choosing and designing the proper conformance solution based on the needs of the subject wells also leads to a successful and long-term remedy for the problems. Many solutions are available that have properties such as (a) liquid systems with in-situ polymerization post placement, (b) fibrous materials giving a flexible blockage, (c) crystallized copolymer systems capable of entering and modifying highly leached out and fissured - rapid fluid transient fissures and fractures, (d) reactive chemicals with both internal and external catalysis, and (e) high strength - highly efficient displacement materials capable of blocking off or modifying fracture systems with rapid communication between well-pairings. Ref 10.11
SPE 113305 5
Performing post-treatment evaluations for modifications or changes in the well performance is needed to insure that the problem has been successfully remedied. Reflection on what may be discovered and learned, without making judgmental assumptions, is incorporated into the investigation for a solution and placement mechanism.
Inter-well Communication – A Solution is Chosen
Foamed Slurry:
Cement squeezes were considered as an option if the fracture feature was identified as potentially very open and not tortuous. Foamed cement would also be a good selection if concerns on influxes of gas and water were noted. With a high amount influxing water, all cements can be diluted and dispersed, causing a failure if not highly viscous and bound with the energy contained in foamed slurry. Past successes using foamed slurry in shutting off fracture communication and CO2 breakthrough in over 30 producers (1998) in the SACROC Unit was successful in placement and remediation of the production problems for several years.
Crystallized Polymers (CP):
Production engineering decided to attempt to squeeze off the first candidate injection well’s inter-well communication with a crystallized copolymer super absorbent system (CP) as a first step with a 1,000 sacks foamed cement squeeze to follow if needed.
The first candidate with a highly defined communication aspect treated with a sufficient pressure build and witnessed profile modification (by follow-up profile survey) such that only a 100 sacks conventional cement squeeze behind for near wellbore matrix strength was pumped. It was noted later that this cement squeezing step could most likely have been eliminated.
Successive wells were then treated based on their diagnosed problems with the CP with designs based on their injection rates, profiles, and aspects of offset communication. No tail-in cement was utilized. Twelve treatments in total were performed in the 4th quarter of 2006. Nine treatments resulted in sustained post treatment improvement to vertical injection profile; two treatments showed little change in profile; and, one treatment failed as CP flash-set in placement water being too fresh - for a success ratio of 75% during the first six months following treatment.
Placements using these materials was made down the current injection tubulars working rigless; a practice that can save expense by avoiding the need for a workover unit. Removal of the crystallized copolymer if desired could be obtained by reactions from bleaches or oxidizers once squeezed into the CP’s mass. No CP-related damage to offset production wells or production facilities has occurred to date.
Crystal Polymer Process:
CP materials are water-swellable but not water-soluble, 100% crystalline synthetic polymer. They absorb hundreds of times their own weight in water ranging from 10 to 800 times based on their particular grind, carrier and available aqueous fluid, and the specific manufactured base material. These CP materials initially were intended in the oil and gas industry for use primarily as a lost circulation material and to address near wellbore remediation problems and reservoir architectural features needing modification by cementing zonal isolation and conformance.
These materials were chosen based on their attributes and capabilities in creating a blockage in the inter-well communicating systems. Their use also needed to be favorable economically.
The superabsorbent copolymers (CP) currently used are sodium acrylate-based polymers which have a three dimensional network-like molecular structure. The polymer chains are formed from the joining of millions of identical units of acrylic acid monomer, which has been substantially neutralized with sodium hydroxide (caustic soda). Ref 13
Crosslinking chemicals tie the chains together to form a three-dimensional network – 100% crosslinked. This enables CP's to absorb water or water-based solutions into the spaces in the molecular network, forming a gel and locking up the liquid. The chemicals tie the chains together to form a three-dimensional network. This enables CP's to absorb water or water-based solutions into the spaces in the molecular network, forming a gel like solution and locking up the liquid in suspension.
As the polyacrylamide is being developed [manufactured] under temperature, it is put into a reactor and crosslinked still under temperature until a certain viscosity is reached. It is then run through an extruder and out on a mesh belt where it hardens and then to the chopper where it is cut to a specific size and bagged. The crosslinked process will help keep it insoluble.
The crystallized copolymers are resistant to degradation by CO2, bacteria, and temperature below 275 °F. Ref 13
6 SPE 113305
Crystal Polymer Process Steps:
The time in which the crystallized copolymers will start to hydrate is over 20 minutes if in fresh water and at temperatures less than 110°F. Use of produced brines (8.9–9.2 lb/gal) will have a delay of around 45 minutes before the crystals initiate their swelling. Placement may be controlled around this feature. Once placed into the injectant stream, wells may be closed in for a period of 30 minutes to allow the crystallized copolymers to thoroughly swell. The material will swell from 10 to 800 times its crystal weight in fresh water and 5 to 100 times its crystal weight in produced water (salinity effect). The wells can then be placed back on injection and analyzed for profile if desired or evaluated for pressure responses. They can also be tested for control of out-of-zone injection losses and influxes. Ref 11, 12, 13
If desired, a follow-up stimulation process can be performed to remove damage from other portions of the wellbore.
Treatment volumes are adjusted per ongoing injection and placement trials in stages of injecting a volume of materials and displacing – then testing with pressure fall-off or another profile prior to determining if other steps of placement are required. Once the post-placement period of the material has ended, a measured and observed pressure increase indicating a change in fluid losses via the fracture systems or near-wellbore losses would indicate changes. An extended stabilized pressure would indicate enough material had been placed to stop injection or production from the offending interval(s).
Quality Control
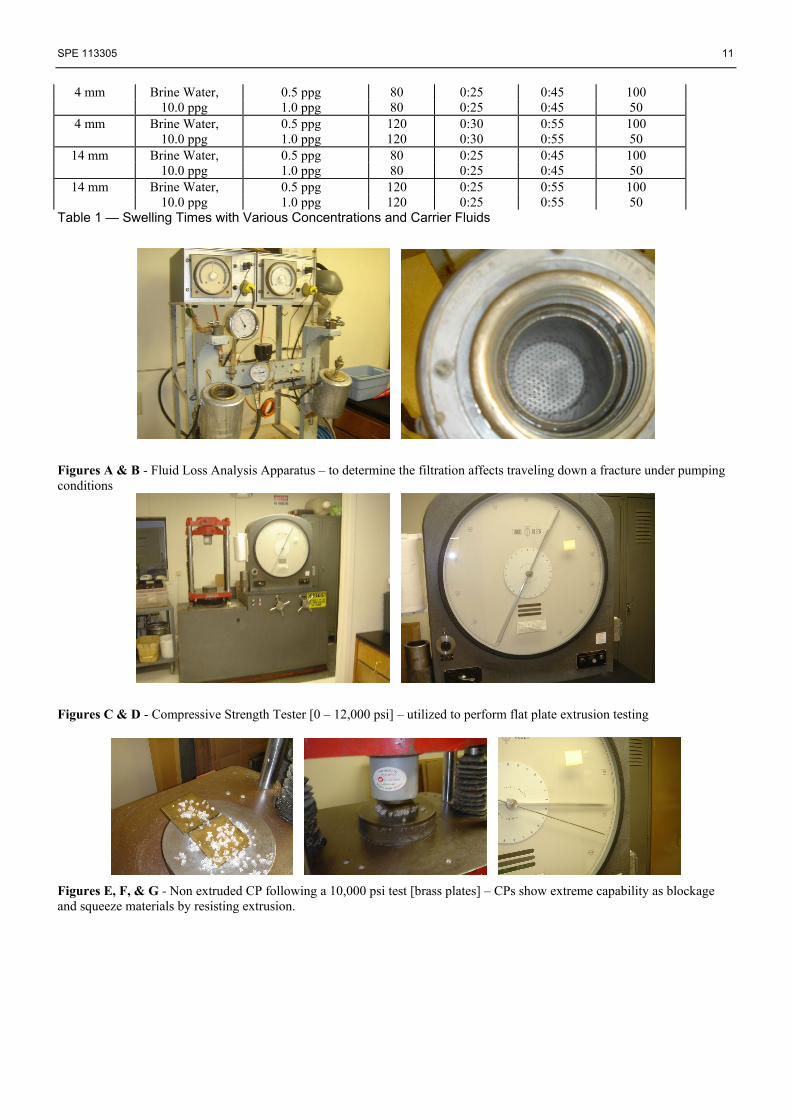
Laboratory analysis is performed to determine the set times and viscosity performance for the CP treatments based on down hole injection temperature. The crystals were mixed with a variety of carrier fluids to determine the best for the particular well’s placement requirements. Table 1 shows some of the analysis on the various carrier fluids and their swelling time ranges. Determining the capabilities of a CP to control the inter-well communication problems, an extrusion analysis was conducted and shown in Figures A-J.
Placement Considerations
The treatments in the SACROC Unit were performed using placement down the current injection string and packer. The majority of the injection problems were going into an array of communicating systems identified by the ‘Multi-Rate Injectivity Analysis with Profiles’ run in the pretreatment diagnostics and for evaluation after each treatment step for notation of modification.
The technique considered for placement of the PC treatments on the wells with inter-well communication were performed using this “Bullheading Placement” technique whereas an acceptable rate and pressure restriction is used to determine the placement down the current injection or production string. Using the current tubulars and relying on rate/pressure determined from profiles, the rigless placement on injecting a solution were identified in the diagnostics used to determine the problem. Ref 11, 12 Methods and techniques in performing a rigless workover on an injection well were also developed to address several needed requirements and regulatory stipulations. Performing rigless treatments reduced the typical squeeze technique for communication damage time spent doing these workovers from 10-30 days down to 2-3 days with the CP Process, giving savings as high as $250,000 per well. The ability to treat the well without having to utilize a workover unit, pull the well following killing it, and take a chance in not being able to gain a packer seat following the squeezing of the loss interval were some of the operator’s needs and desires. The ability to modify and control vertical injection distribution without needing a post drill-out or additional steps of stimulation and perforating were also desired.
Note that mechanical packer placement techniques are also an option if the treatment solution is determined to need this for the best placement control. Using a packer and retrievable bridge plug to isolate perforations, or expandable packers to isolate a portion of an open hole completion into which the treatment is to be placed gives selective placement control.
Additional steps of injecting these crystals were made following profiles run immediately thereafter or can be made later if determined from a pressure transient fall-off test that indicates remaining communication. Step rate tests were made to set injection rate and pressure limits below apparent parting pressure as indicated immediately following treatment.
Due to the physical nature of the CP – their placement would only be into this void space and not into any of the rock structure. This selective placement was utilized to minimize the damage to the rock matrix while having a solution capable of filling and blocking off the high transmission of fluids via the communication network. Design was to place enough blockage and restrictive materials into these open and conductive paths into the formation to prevent future re-entry in order to divert injection into other portions of the reservoir currently not receiving fluid
SPE 113305 7
movement and possibly never having received any. Depth of penetration is dependent upon particle size of CP chosen – the smaller the particle, the greater potential depth into the communication path. SACROC CP Pilot - Case Histories
Since 2001, the current operator has implemented eight expansion projects with plans to reactivate fully two-thirds of the Unit acreage. Fig 3 These expansion projects entail infill drilling and pattern regularization with construction of surface facilities to meet increasing processing volume demands. This work has increased production by approximately 30MBOE/D. To this point, the strategy has been to open all net pay horizons for reflooding by larger CO2 slugs and drier WAGs. While successful, previously isolated inter-well communication networks may have been activated and/or new communication channels opened.
The risk in inter-well profile modification is three-fold: identifying the offending zones correctly, choosing the right blocking material, and sizing the chosen treatment volume accurately. Treating the wrong zone or using the wrong material may result in unwanted formation damage and lost production. Too large a treatment is costly. It may damage offset production equipment and/or surface facilities if treatment solution is produced. Too small a treatment may shorten its effective life as injectant breaks around it to resume along the path of least resistance. Fig
4
Before the first job on SU well no. 51-2, an inter-well tracer, fluorescene dye, was injected with a fluorometer set up on offset producer, SU well no. 51-6. Well no. 51-6 was known from well tests and pulse testing to be in direct communication with well no. 51-2. The objective of the tracer test was to estimate the volume of blocking material needed to shut-off the channel. Fig 5 The tracer material was detected within twenty days of injection; however, interruptions occurred in data recording on both the injector and the producer and the fluorometer installation required daily maintenance. Because of the uncertainty in the volume measurement and the field labor commitment, no further tracer surveys were conducted. Instead, multiple injection profiles were relied upon to estimate volume requirements.
The initial pilot tests targeted an underperforming expansion project area. The BullsEye project commenced at the start of 2003; oil production did not achieve forecast levels and CO2 injection had to be curtailed prematurely to reduce excessive gas production. Wetting the WAG accelerated the oil decline rate. Fig 7 Less CO2 also meant less energy to flow producers. Between the summer of 2005 and the fall of 2006, sixty producers were retrofitted with electric submergible pumps or existing pumps were upsized to restore production. Production did improve but with little change in oil decline rate. Fig 8 By the summer of 2006, thirty of the project’s patterns had three or more producers with total gas-oil ratios in excess of 30,000 SCF/BO. These patterns provided the basis for the pilot candidate selection. Three additional criteria were considered: relatively low water-oil ratio (to improve oil response time), injection-withdrawal ratio at or near unity (to minimize the risk of added complications), and no tailpipe below the injection packer (to allow bullheading of material and rigless work). These added criteria cut the candidate list to fourteen injectors. One was eliminated because of a logging tool stuck in the tubing, and a second because of a casing leak (since repaired with a conventional rig). The remaining twelve candidate wells are shown on Figure 6. Nine of them are concentrated in the southern end of the project – five of which are detailed below. Because of the nature of inter-well communication, the treated well may affect more than the immediate pattern. Post treatment BullsEye project oil decline rate has improved because of treating these twelve wells and restoring some of the curtailed CO2 injection. Fig 8
Five of the treated injectors in the southern BullsEye project are included in this review to illustrate the variability between adjacent patterns, the effect of pattern realignments, and the differences in post treatment performance. Chronologically, these jobs are nos. 4 (Pattern no. 143-2), 6 (Pattern no. 177-3), 9 (Pattern no. 143-4), 11 (Pattern no. 143-1) and 12 (Pattern no. 178-2) that occurred between November 9 and December 5, 1006. Fig 9
Prior to 1971, all water flood injection support for the focus area was supplied by the center line drive to the west, depicted in yellow on Figure 10. Please note that all well symbols shown on this and succeeding figures are current. As mentioned earlier, conversion to 160-acre inverted nine spots began in 1971, in preparation for CO2 injection that began the following year. Only one of the five wells, SU well no. 143-2, was an injector prior to the BullsEye project, the remainders were producing wells. A second injection well was added to most of these patterns in the early 1980s to boost reservoir pressure to maintain miscibility; however, this did not occur in Pattern no. 143-2. That situation changed between the mid 80s to mid 90s, as Pattern no. 143-2 became an inverted 7-spot with adjoining inverted 6-spot patterns. Fig 11 The current pattern realignment occurred in 2003, with the five review patterns shown in green and the four other treated patterns shown in blue on Figure 12.
As part of the analysis, an estimate of cumulative injection by vertical interval was made using the injection profiles and allocated monthly volumes to monitor processing rates and decide when intervals were theoretically swept. In the past at SACROC, this was done using the designated net pay intervals, reallocating profile data to fit these
8 SPE 113305
zones when needed. Unfortunately, current analysis suggests it may be necessary to reallocate as much as thirty percent of the profile data, potentially masking problems or overestimating sweep in net pay intervals. Consequently, pore volume instead of hydrocarbon pore volume is used in estimating cumulative injection by vertical interval. The relative difference in hydrocarbon pore volume verse total pore volume is shown in Figures 13 and 14, respectively; both are scaled from 0 to 40. Creating a cumulative profile of injection by foot over time may help quantify near well bore sweep and aid in profile modification design. Cumulative injection as a percentage of pore volume means the total quantity over time of injectant per foot divided by the pore volume of that foot as calculated from the pattern pore volume. For example, if ten pore volumes of injection occur over time, then that “foot” has been swept 1000%. If one pore volume of injection, then 100% swept. To be cost effective, one assumes 100% swept should trigger elimination of a zone, especially on CO2, by profile modification.
Pattern no. 143-1
Sidetracked injector well no. 143-1, exhibited significant declining oil production and well failures prior to initial treatment. Fig 15 Post workover results are mediocre and not unexpected given the treatment and post treatment profiles. The logs for the sidetrack demonstrate the variability of the pay over short distances within the Reef. Fig 17 Fortunately, the sidetrack captured U, Th, K curves which may be relogged later to observe apparent fluid movement as the Th/U ratio changes. The potential of the ROZ, or residual oil saturation zone, beneath the oil-water contact may also be determined in future. The cross-section also shows the cumulative CO2 (pink) and water (light blue) injection curves as a percentage of pore volume. Both are scaled 0 to 10, suggesting the Cisco was completed water flooded and the top of the Canyon was completely CO2 flooded. Furthermore, the middle Canyon in the sidetrack does not appear to have been flooded. Before treating with CP, the well was cleaned out with coiled tubing and acidized with 1,000 gals. of 15% HCl and profiled prior to treatment with 1,100 lbs. of 2 mm CP - squeezing off w/ 715 lbs. on formation at 4,000 psig surface. Low water salinity was suspected for the early setup. After clean out by coiled tubing and second profile, a second batch of 2,000 lbs. 2mm & 4 mm CP was pumped with a maximum surface pressure of 1,626 psig. A third profile suggested an additional treatment, and 3,000 lbs. of 4 mm CP at maximum treating pressure of 1,869 psig ensued. A fourth profile still suggested that the majority of the fluid was exiting through the same twelve-foot interval in the Cisco in the Upper Reef. A fourth treatment followed with 3,000 lbs. 4mm CP at maximum surface pressure of 2,435 psig. A fifth and final profile now showed all of the losses occurring in this same zone. A final treatment of 4,000 lbs. 4mm CP at maximum 3,084 psig was pumped. Unfortunately, the pump truck suffered diesel engine malfunction three minutes into flush. All four CP profiles are depicted, scaled from 0-1. Following cleanout the well was returned to injection. A step rate test, on each of the CP treated wells, established maximum rate and tubing pressure targets to observe. Pressure regulation was achieved manually; however, a rate increase in October 2007, suggests the Cisco channel may have worsened or a new interval began taking fluid. Fig 16 Subsequent profiles show this interval 70% of the injectant. A second CP job was performed in January 2008; this time using the CP as a block agent for a large acid stimulation: 8,195 lbs. 2mm CP and 5,000 gals. 15% HCL at a maximum WHP of 3,646 psig. Follow-up profile reveals 90% of the fluid exiting this interval. A cemented liner may be necessary to eliminate loss to this zone. CO2 injection has not resumed pending resolution of this problem. The column shows the cumulative water injection over time with the same 0-10 scale.
Pattern no. 143-2
This is the oldest pattern in the review, having been converted to injection in 1976. Fig 18, 19, 20 Like the previous pattern, this too exhibited significant declining oil production and well failures prior to initial treatment The BullsEye project is the second period of CO2 injection in the life of this well. The well was deepened and logged in 2003; the changes in gamma ray and neutron are presented as reference. Fig 22 At the time of this writing, only injection profiles from 2000 forward were discovered, even though earlier profiles are known to have been run. Obtaining the early year surveys may have helped determine which intervals to expose for the BullsEye project. The prior cumulative injection curves are plotted from 0 to 5, for the pre-BullsEye water and pretreatment CO2 and 0-20 for the pretreatment water. The low porosity, apparently high permeability streak direct above the Cisco-Canyon erosion contact stands out. CP appears to have sealed it off. Very high injection rates, in excessive of 4,500 B/D, were observed prior to treatment, using this streak as a major thoroughfare for water. Two batch treatments of CP were used: 1,000 lbs. 2 mm CP & 1,000 lbs. 4 mm CP at maximum TP of 1,615 psig and 1,000 lbs. 2 mm CP & 1,000 lbs. 4 mm CP at maximum TP of 2,048 psig with tracking profiles as shown. This well could have benefited from an automated choke to regulate injection. Fig 21 Rates progressively increase to pretreatment levels and higher in the case of CO2. Water profiles taken before and after August 2007, show degradation in vertical injection distribution (green to blue curves). More rate is not always better sweep. The total cumulative CO2 and water curves are shown in the last two columns, respectively, with no change in scale.
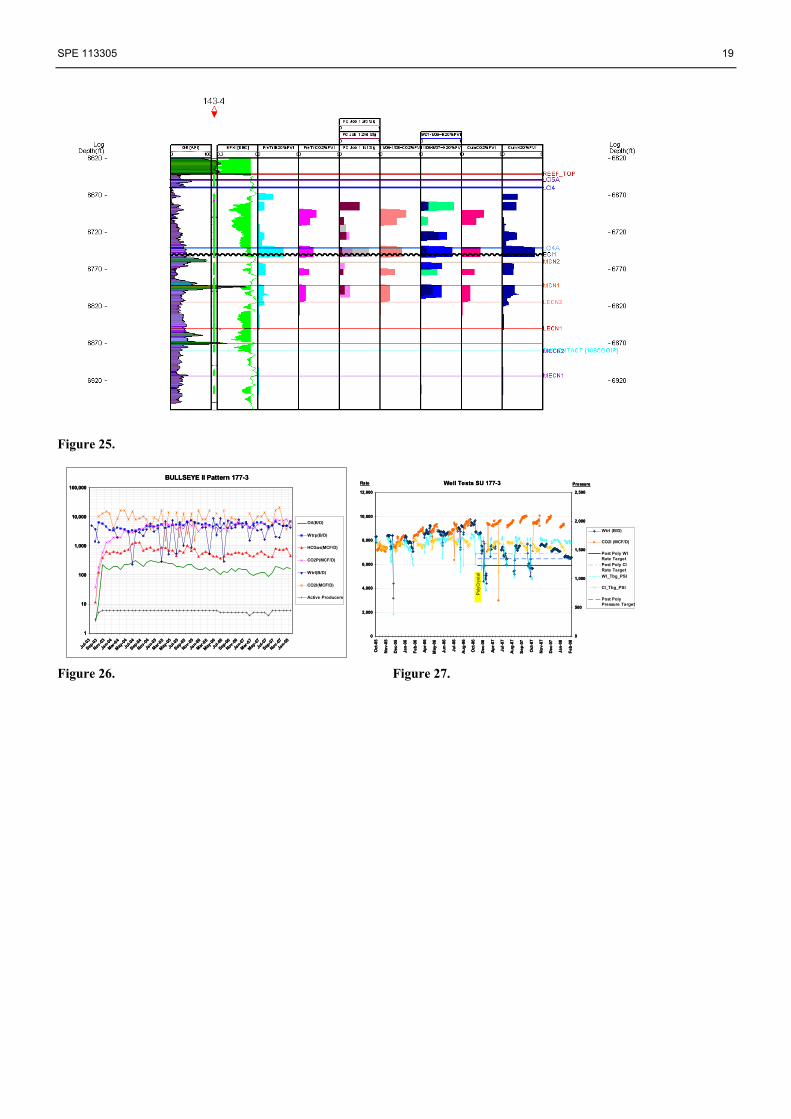
Pattern no. 143-4 This pattern is newer and had similar before treatment performance and better distribution than the previous
SPE 113305 9
pattern; however, it too would have benefited from an automated choke. Fig 23, 24, 25 The cumulative before and after scales on both injectants are 0-5. It has treated with three stages of CP with intervening profiles shown: 825 lbs. 2mm CP at maximum TP of 2,403 psig, stage 2 - 220 lbs. 2mm CP at maximum TP of 2,303 psig and stage 3 – 1,375 lbs. 2mm CP at maximum TP of 3,028 psig.
Pattern no. 177-3
Pattern no. 177-3 is the only inverted 7-spot of the five in the review, the rest being inverted 5-spots. It was deepened during conversion to injection in 2003, and the pre and post logs show significant change in porosity log character. Fig 28 It demonstrated the least oil production decline and the fewest well failures. Fig 26 It has failed to maintain injection below target, although water injection rate is lower than before treatment, and the profile did not improve despite pumping 11,500 lbs. of 2 & 4 mm CP in four stages to a maximum TP of 4,729 psig. Fig 27, 28 Yet, the post treatment performance suggests it is an economic if not technical success. The cumulative injection curves are scaled an outrageous 0-40 for CO2 and 0-30 for water. The Cisco at the base of the overlying shale is an exceptional conduit for fluid flow and a steady supporter for 200 BO/D at present.
Pattern no. 178-2
The final pattern in this review is also the best post treatment performer in the five wells chosen. For two key reasons: the vertical fluid distribution was good before treatment and improved with treatment, and the injection rates and pressures have been maintained reasonably well since treatment. Fig 29, 30, 31 The before and after cumulative injection scales are 0-5 for both fluids. The well was treated with 1,000 lbs. 2mm CP at maximum TP of 2,775 psig.
` Conclusions
1. Crystal polymer applied by rigless placement is a cost effective profile modification option.
2. Understanding vertical injection distribution over the entire pore volume through time from profile and volume data can help mitigate inter-well communication issues.
3. Maintaining injection below established limits can extend the effective life of profile modification treatments.
Acknowledgments
The authors of this paper thank the management of Kinder Morgan CO2 for permission to prepare and present this paper and Halliburton for internal data.
References 1. Melzer, S., “Overview of EOR Techniques, The History and Current Status of CO2 Flooding,” presented at the
2008 APTA CO2 Flooding School held in Midland, Texas, USA, 28-31, 2008.
2. Creel, P.G., Garvin, T.R., Carlisle, B., Pappas, J., Hirth, B., Comer, L.,: "Database assemblage of Engineer's Reports, Treatment Designs & Performances, Diagnostic and Analysis Data, Post Treatment Appraisals, and Operator's Evaluations on Conformance Treatments in the Permian Basin, West Texas (1965-1998)," paper and presentation at the MoBPTeCh Produced Water Management - Best Practices for the Permian Basin, Midland, Texas, November 17 & 18, 1998.
3. Graue, D.J., and Blevins, T.R., “SACROC Tertiary CO2 Pilot Project,“ paper SPE 7090, presented at the Fifth Symposium on Improved Methods for Oil Recovery of the Society of Petroleum Engineers of AIME, Tulsa, Oklahoma, April 16-19, a978.
4. Langston, M.V., Hoadley, S.F. and Young, D.N., “Definitive CO2 Flooding Response in the SACROC Unit,” SPE/DOE 17321 paper presented at the SPE/DOE Enhanced Oil Recovery Symposium, Tulsa, Oklahoma, April 17-20, 1988.
5. Hawkins, J.T., et al., “SACROC Unit CO2 Flood: Multidisciplinary Team Improves Reservoir Management and Decreases Operating Costs,” SPE RE (August 1996) 141.
6. Azari, M. & Soliman, M.F., “Reservoir Engineering Applications to Control Excess Water and Gas Production,” paper SPE 37810 presented at 1997 SPE Middle East Oil Show held in Bahrain on March 15-18, 1997
7. Creel, P.G., Honnert, M., Kelley, R., Tate, R., Dalrymple, E.D.: “Conformance Water-Management Team Developments and Solutions on Projects in the Permian Basin,” paper SPE 70068,presented at the 2001 Permian Basin Oil and Gas Recovery Conference, Midland, Texas, 14-16 May.
10 SPE 113305
8. Green, C., Creel, P., McDonald, S., Ryan, T.: “Utilization of a Crystallized Hydrating Copolymer to Modify an Injectivity Problem in a Horizontal CO2 WAG Injector in the South Cowden Unit, Ector County, Texas – Post Treatment Coil Tubing Acidizing Stimulation – Case History,” paper SWPSC 2003 SWPSC, Lubbock, Texas April 2003
9. Cardinal Surveys Website, www.cardinalsurveys.com library giving detailed diagnostics tests and procedures. Actual profile logging performed by Production Logging, Inc.
10. Creel, P.G., Honnert, M., Tate, R., Everett:,: “Five Years of On-Going Conformance Work in the Central Mallet Unit CO2 Flood in West Texas Yields Improved Economics for Operator;” paper SPE 101701, presented at the 2006 First International Oil Conference and Exhibition in Mexico held in Cancun, Mexico, 31 August–2 September 2006.
11. Creel, P.G., Honnert, M., Tate, R., Everett: ”Central Mallett and Slaughter CO2 WAG Units Conformance Project,” paper presented at the 54th Annual Southwestern Petroleum Short Course, Lubbock, Texas, April 25-26, 2007
12. Creel, P.G. & Booker, J., “Correcting out-of-Zone Injection Problems on a Waterflood in SE New Mexico,” paper presented at the 54th Annual Southwestern Petroleum Short Course, Lubbock, Texas, April 25-26, 2007
13. Laboratory Analysis Investigations and Reports [Confidential] - Baroid, Houston Technical Center and Halliburton Laboratory Facilities, Duncan, Oklahoma and Odessa, Texas, May 1998, April 2000, July 2002, Sept. 2004, November 2006, February 2007.
Table 1. Listing various Swelling Expansions
Crystal Polymer
Grind Size
Carrier Fluid Concentration of CP in Carrier Fluid
Temp., °F
Initial Swelling
Time, hr.:min.
Final Swelling
Time, hr.:min.
Swelling Increase, Weight to
Weight Ratio 1 mm Fresh Water 0.05 ppg 80 0:14 0:20 500
Table 1 — Swelling Times with Various Concentrations and Carrier Fluids
Figures A & B - Fluid Loss Analysis Apparatus – to determine the filtration affects traveling down a fracture under pumping conditions
Figures C & D - Compressive Strength Tester [0 – 12,000 psi] – utilized to perform flat plate extrusion testing
Figures E, F, & G - Non extruded CP following a 10,000 psi test [brass plates] – CPs show extreme capability as blockage and squeeze materials by resisting extrusion.
Fresh Water Carrier Solution Swelling Time @ 100º F20 – 25 mins
Produced Brine Water Carrier Solution Swelling Time @ 100º F40 – 50 minutes (generally)
Swelling affect following the introduction to water at the swelling times shown above
20 min in FW
45 min in Brine
Figure H: Effect of the Carrier Fluid on the swelling potential
Core Flow Experiments(Synthetic cores with simulated fractures)
Long-term test
0
500
1000
1500
0 8 16 24Time at temperature, days
Diff
eren
tial P
ress
ure,
psi
4mm PolyCrystal25% w/w Fracture Capacity
0
500
1 000
1 500
0 1 0 2 0 30
Time , minu te s
Dif
fere
ntia
l Pre
ssu
re, p
si
135oF 275oF
Figure J: Core Flow Experiments and Pressure Resistance to Extrusion
SPE 113305 13
Figure 1. Figure 2.
Hockley Lubbock Crosby Dickens
Terry Lynn Garza Kent
Gaines
ScurryDawson Borden
S. BrownfieldField
S. BrownfieldField
500'
500'
WellmanField
WellmanField
Adair FieldAdair FieldMungerville FieldMungerville Field
Good Fld.Good Fld.
OceanicField
OceanicField
VealmoorField
VealmoorField
Hobo Fld.Hobo Fld.Von Roeder Fld.Von Roeder Fld.
Diamond M UnitDiamond M Unit
Salt CreekUnit
Salt CreekUnit
CogdellUnit
CogdellUnit
Kelly SnyderField
Kelly SnyderField
SACROC UnitSACROC Unit
Sharon Ridge UnitSharon Ridge UnitS. Von Roeder Fld.S. Von Roeder Fld.
Reinecke UnitReinecke Unit
E. VealmoorFld.
E. VealmoorFld.Oklahoma
Texas
Anadarko BasinFort Worth Basin
Midland Basin
Delaware Basin
Modified from Vest (1970)Modified from Vest (1970)
Hockley Lubbock Crosby Dickens
Terry Lynn Garza Kent
Gaines
ScurryDawson Borden
S. BrownfieldField
S. BrownfieldField
500'
500'
WellmanField
WellmanField
Adair FieldAdair FieldMungerville FieldMungerville Field
Good Fld.Good Fld.
OceanicField
OceanicField
VealmoorField
VealmoorField
Hobo Fld.Hobo Fld.Von Roeder Fld.Von Roeder Fld.
Diamond M UnitDiamond M Unit
Salt CreekUnit
Salt CreekUnit
CogdellUnit
CogdellUnit
Kelly SnyderField
Kelly SnyderField
SACROC UnitSACROC Unit
Sharon Ridge UnitSharon Ridge UnitS. Von Roeder Fld.S. Von Roeder Fld.
Reinecke UnitReinecke Unit
E. VealmoorFld.
E. VealmoorFld.Oklahoma
Texas
Anadarko BasinFort Worth Basin
Midland Basin
Delaware Basin
Oklahoma
Texas
Anadarko BasinFort Worth Basin
Midland Basin
Delaware Basin
Modified from Vest (1970)Modified from Vest (1970)
SNYDER, TX
SACROC Unit
14 SPE 113305
Figure 3. Figure 4. Figure 5. Figure 6. Figure 7.
Gross Pay, Ft.
Treated BullsEyeProject Injectors
SU BullsEye Project
10
100
1,000
10,000
100,000
J-02
A-02 J-02
O-02J-0
3A-03 J-0
3O-03
J-04
A-04 J-04
O-04J-0
5A-05 J-0
5O-05
J-06
A-06 J-06
O-06J-0
7A-07 J-0
7O-07
J-08
10,000
100,000
1,000,000
Oil(B/D) - L HCGas(MCF/D) - L Active Producers - L Wtrp(B/D) - RCO2P(MCF/D) - R WtrI(B/D) - R CO2I(MCF/D) - RGross Pay, Ft.
Treated BullsEyeProject Injectors
Gross Pay, Ft.Gross Pay, Ft.
Treated BullsEyeProject Injectors
SU BullsEye Project
10
100
1,000
10,000
100,000
J-02
A-02 J-02
O-02J-0
3A-03 J-0
3O-03
J-04
A-04 J-04
O-04J-0
5A-05 J-0
5O-05
J-06
A-06 J-06
O-06J-0
7A-07 J-0
7O-07
J-08
10,000
100,000
1,000,000
Oil(B/D) - L HCGas(MCF/D) - L Active Producers - L Wtrp(B/D) - RCO2P(MCF/D) - R WtrI(B/D) - R CO2I(MCF/D) - R
Risk in Interwell
Modification
Large Treatment
Small Treatment
Fluorescene Dye Well Couplet 51-2 & 51-6
Risk in Interwell
Modification
Large Treatment
Small Treatment
Risk in Interwell
Modification
Large Treatment
Small Treatment
Fluorescene Dye Well Couplet 51-2 & 51-6
Fluorescene Dye Well Couplet 51-2 & 51-6
Current Projects• 1 – Original Centerline• 2 – Centerline Ex pansions• 3 – Bulls Eye• 4 – Center Ring I• 5 – Center Ring II • 6 – Southw est Center line
Current Projects• 1 – Original Centerline• 2 – Centerline Ex pansions• 3 – Bulls Eye• 4 – Center Ring I• 5 – Center Ring II • 6 – Southw est Center line