SPE 124477 Intelligent Upscaling of Static and Dynamic Reservoir Properties V.Gholami, SPE and S.D.Mohaghegh, SPE, West Virginia University Copyright 2009, Society of Petroleum Engineers This paper was prepared for presentation at the 2009 SPE Annual Technical Conference and Exhibition held in New Orleans, Louisiana, USA, 4–7 October 2009. This paper was selected for presentation by an SPE program committee following review of information contained in an abstract submitted by the author(s). Contents of the paper have not been reviewed by the Society of Petroleum Engineers and are subject to correction by the author(s). The material does not necessarily reflect any position of the Society of Petroleum Engineers, its officers, or members. Electronic reproduction, distribution, or storage of any part of this paper without the written consent of the Society of Petroleum Engineers is prohibited. Permission to reproduce in print is restricted to an abstract of not more than 300 words; illustrations may not be copied. The abstract must contain conspicuous acknowledgment of SPE copyright. Abstract Rock typing is an essential part of building geological model for an asset. Millions of dollars are invested in logs, core measurements, SCAL studies and geological interpretation that result in definition of different rock types. In most caes rock types that are identified in a reservoir do not have crisp boundaries and display overlapping characteristics. During the upscaling process, multiple rock types that have been identified in a high resolution geological (geo-cellular) model are approximated into a dominant rock type for any grid block in a reservoir simulation flow model.This defeats the original purpose of performing detail geological and petrophysical studies as far as reservoir flow models are concerned. The objective of this study is to develop a new upscaling methodology based on fuzzy set theory principles . Fuzzy rock typing refers to taking into account the inherent uncertainties and vagueness associated with rock typing in hydrocarbon bearing reservoirs. In this paper a numerical simulator has been used as the control environment in order to set up multiple studies that would demonstrate the difference between using conventional approach of implementation of geological models in the reservoir flow simulation studies and the new approach that is the subject of this study. By using the numerical reservoir simulator as the control environment it is intended to study the complexities that exist in geological model at much higher resolution and then compare simulation in large grid blocks using two different approaches. The problem has been set up in the form of upscaling study. First, the study was performed using conventional upscaling practices and then it was carried out using the proposed technique. The results then have been analyzed in order to demonstrate the difference between the two techniques and the advantages and disadvantages o f each have been identified. This manuscript has been organized in several sections. In the literature review section the current practices in upscaling dynamic reservoir properties such as relative permeability and capillary pressure are reviewd as well as basic definitions of rock typing. A brief section on fuzzy set theory is also presented in this section. The problem is defined in more details and some background information is presented in the “Introduction” Section. The approaches used to perform the study are presented in the “Methodology” section. Details results are presented and discussed in the “Results & Discussion” section and the manuscript is completed providing some concluding remarks. Literature Review Upscaling Dynamic Reservoir Characteristics- A variety of approaches for upscaling high resolution geocellular models for flow simulation are reviewed. The number of cells which can be handled in a typical reservoir simulator are highly dependent on the type of simulation to be performed and are usually between 105 to 106 cells. On the other hand geological models which are referred to as geocellular models, geostatistical models or fine grid models contain 107 to 108 cells. Computing time, cost and capabilities all restrict our ability to use high resolution geocellular models for reservoir fluid flow simulation. As a result there is a need to cluster data into smaller sets of characteristics that represent the most significant aspects of reservoir. This process is called upscaling. Depending on the situation, different upscaling procedures might be appropriate. The simulation question being addressed, production mechanism and level of details which can be considered in the coarse model, will define the idyllic process to use (1).
Transcript
SPE 124477
Intelligent Upscaling of Static and Dynamic Reservoir Properties V.Gholami, SPE and S.D.Mohaghegh, SPE, West Virginia University
Copyright 2009, Society of Petroleum Engineers This paper was prepared for presentation at the 2009 SPE Annual Technical Conference and Exhibition held in New Orleans, Louisiana, USA, 4–7 October 2009. This paper was selected for presentation by an SPE program committee following review of information contained in an abstract submitted by the author(s). Contents of the paper have not been reviewed by the Society of Petroleum Engineers and are subject to correction by the author(s). The material does not necessarily reflect any position of the Society of Petroleum Engineers, its officers, or members. Electronic reproduction, distribution, or storage of any part of this paper without the written consent of the Society of Petroleum Engineers is prohibited. Permission to reproduce in print is restricted to an abstract of not more than 300 words; illustrations may not be copied. The abstract must contain conspicuous acknowledgment of SPE copyright.
Abstract Rock typing is an essential part of building geological model for an asset. Millions of dollars are invested in logs, core
measurements, SCAL studies and geological interpretation that result in definition of different rock types. In most caes rock
types that are identified in a reservoir do not have crisp boundaries and display overlapping characteristics. During the
upscaling process, multiple rock types that have been identified in a high resolution geological (geo-cellular) model are
approximated into a dominant rock type for any grid block in a reservoir simulation flow model.This defeats the original
purpose of performing detail geological and petrophysical studies as far as reservoir flow models are concerned. The objective
of this study is to develop a new upscaling methodology based on fuzzy set theory principles . Fuzzy rock typing refers to
taking into account the inherent uncertainties and vagueness associated with rock typing in hydrocarbon bearing reservoirs.
In this paper a numerical simulator has been used as the control environment in order to set up multiple studies that would
demonstrate the difference between using conventional approach of implementation of geological models in the reservoir flow
simulation studies and the new approach that is the subject of this study. By using the numerical reservoir simulator as the
control environment it is intended to study the complexities that exist in geological model at much higher resolution and then
compare simulation in large grid blocks using two different approaches. The problem has been set up in the form of upscaling
study.
First, the study was performed using conventional upscaling practices and then it was carried out using the proposed
technique. The results then have been analyzed in order to demonstrate the difference between the two techniques and the
advantages and disadvantages o f each have been identified.
This manuscript has been organized in several sections. In the literature review section the current practices in upscaling
dynamic reservoir properties such as relative permeability and capillary pressure are reviewd as well as basic definitions of
rock typing. A brief section on fuzzy set theory is also presented in this section. The problem is defined in more details and
some background information is presented in the “Introduction” Section. The approaches used to perform the study are
presented in the “Methodology” section. Details results are presented and discussed in the “Results & Discussion” section and
the manuscript is completed providing some concluding remarks.
Literature Review
Upscaling Dynamic Reservoir Characteristics- A variety of approaches for upscaling high resolution geocellular models
for flow simulation are reviewed. The number of cells which can be handled in a typical reservoir simulator are highly
dependent on the type of simulation to be performed and are usually between 105 to 106 cells. On the other hand geological
models which are referred to as geocellular models, geostatistical models or fine grid models contain 107 to 108 cells.
Computing time, cost and capabilities all restrict our ability to use high resolution geocellular models for reservoir fluid flow
simulation. As a result there is a need to cluster data into smaller sets of characteristics that represent the most significant
aspects of reservoir. This process is called upscaling.
Depending on the situation, different upscaling procedures might be appropriate. The simulation question being addressed,
production mechanism and level of details which can be considered in the coarse model, will define the idyllic process to use
(1).
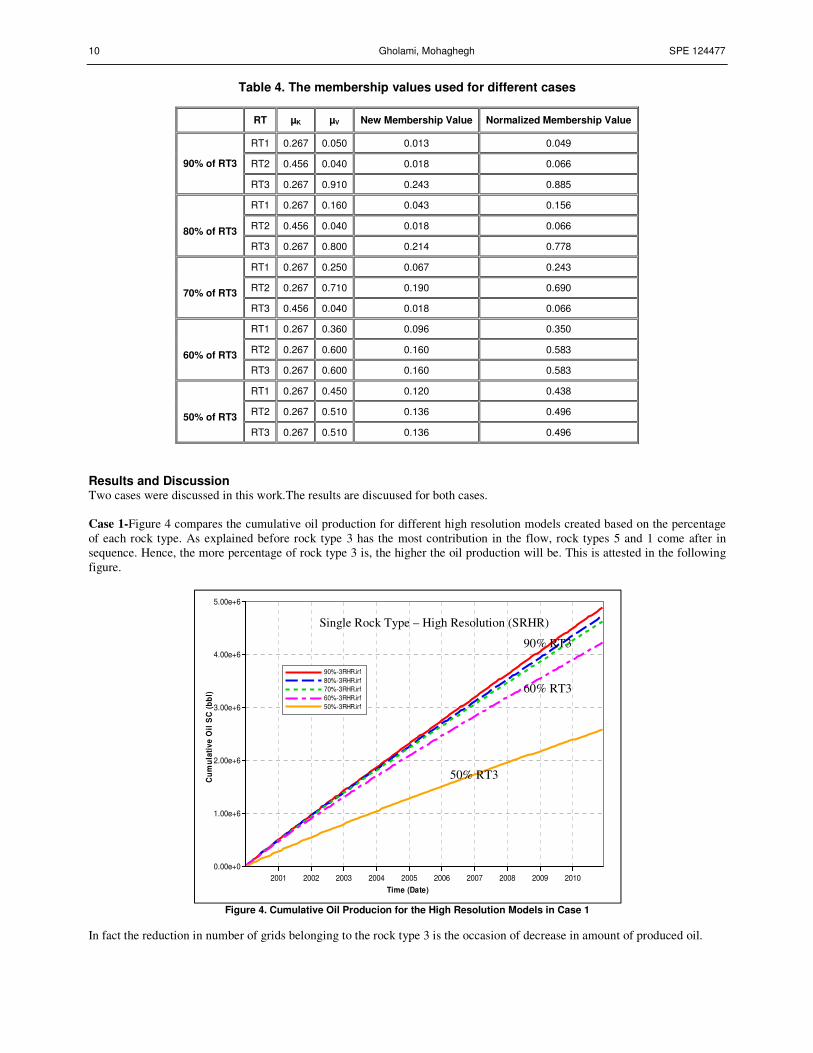
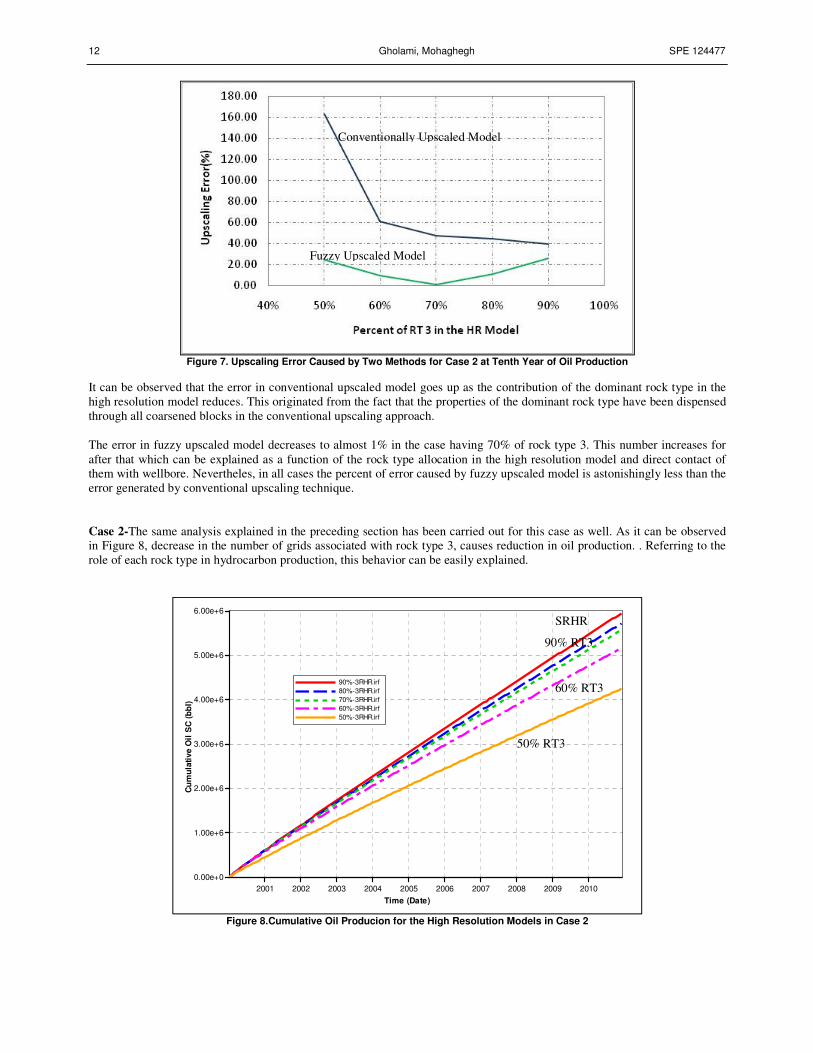
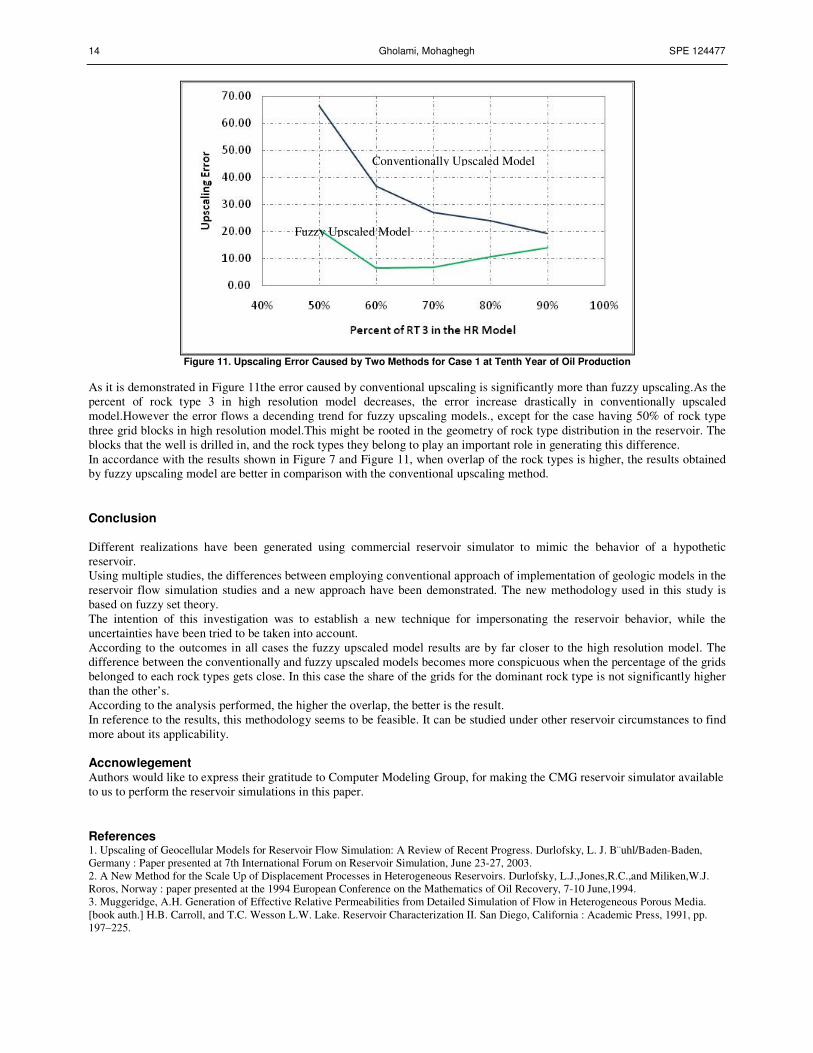
2 Gholami, Mohaghegh SPE 124477
Upscaling techniques can be categorized based on different factors.
One classification is based on the types of parameters upscaled. This category contains single phase upscaling used for
moderate degrees of coarsening and two phases upscaling usually used for higher degrees of coarsening. Upscaling the relative
permeability and capillary pressure data are usually reflected on high degrees of coarsening. The second classification is in
accordance with the way in which the abovementioned parameters are computed.
Under the third classification, the upscaling methods are divided into analytical and numerical according to the method used.
The only parameters to be upscaled in the single phase flow are porosity, absolute permeability (or transmissibility). However,
in two phase flow case, relative permeability can be upscaled as well.
Nevertheless some engineers have always believed in simulating the low resolution two phase models only by taking into
account the absolute permeability (or transmissibility) and porosity. This approach is referred to as single phase upscaling. In
models of this type, the geocellular scale relative permeabilities are used directly on the coarse scale (1).
Some publications have shown that this is not enough to capture the effects of heterogeneity on two phase fluid simulation
using upscaling only permeability particularly if the correlation length of the heterogeneity not represented on the fluid flow
simulation grid is significant compared with the well spacing (2; 3). This often happens when long, thin, high-permeability
channels, thin, high-permeability layers, or extensive, but thin, shale barriers are present in the reservoir (4).
With reference to pressure and saturation equation, it can be said that single phase upscaling only the pressure equation is
modified while in two phase upscaling parameters in both pressure and saturation equations are altered.
In the second type of classification, two different approaches of purely local procedure and global upscaling techniques can be
defined. In purely local procedure only the fine scale area equivalent to the coarse block parameters are considered for
upscaling. Conversely in the global upscaling technique the coarse model parameters are computed after simulating the high
resolution model.
Baker and Thibeau have summarized different dynamic pseudo relative permeability methods, their properties and limitations
in their work (4).The role of pseudo relative permeabilities is determining the output flow rate of each phase from each grid
block.The flow rate and pressure gradient between each grid block and its neighbor is related using the pseudo relative
permeabilities.If the flow is dominated by gravity forces, vertical equilibrium pseudo can be calculated (5). On the other hand,
if the capillary pressure is dominated, the pseudo may be calculated by upscaling the permeability of each phase and dividing
by the scaled up absolute permeability (6).
One of the well known methods for calculating the pseudo relative permeability curves is Kyte and Berry method (7). In this
method the values of average pressure for each coarse gridblock and total flow rates of each phase between each pair of
neighboring coarse gridblocks are computed from the fine-grid simulation Results. These values are substituted in the coarse-
grid Darcy equations to conjecture the coarse-grid (pseudo) relative permeability values that would be required to reproduce
the fine-grid flows.Some problems can happen if the net flow of a phase is in the opposite direction to the average pressure
gradient (7).
Stone used the total mobility as a way to overcome the problems with Kyte and Berry method (8).He suggested calculating
average mobility and net fractional flow. His method is not valid when the effect of capillary pressure and gravity is not
neglected (4).
The other method which is widely used is the weighted relative permeability method. This method is used in the upscaling
program sold ECLIPSE reservoir simulation software, and gives smooth pseudos with values between 0 and 1. In this method,
the pseudo relative permeability of a phase is simply calculated by averaging the relative permeabilities of that phase in certain
blocks of the fine grid model. There is not enough validation of reproducing the same results as fine scale model, using this
method, despite its popularity (4).
Rock types and Flow Units- A need to define quasi geological/engineering units to shape the description of reservoir zones
as storage containers and reservoir conduits for fluid flow have been recognized by petroleum geologists, engineers, and
hydrologists. “Flow units” are resultant of depositional the depositional environment and digenetic process, and different
authors have defined them in different words (9).
Understanding complex variation in pore geometry within different lithofacies rock types is the key to improving reservoir
description and exploitation. Core data provide information on various depositional and diagenetic controls on pore geometry.
Variation in pore geometrical attributes in turn defines the existence of distinct zones (hydraulic units) with similar fluid-flow
characteristics. Hear et al. defined flow unit as a reservoir zone that is laterally and vertically continuous, and has similar
permeability, porosity, and bedding characteristic. Gunter et al. defined flow unit as a stratigraphically continuous interval of
similar reservoir process that honors the geologic framework and maintains the characteristic of the rock type (10).