SPE SPE 15765 Practical Limitations in Obtaining PVT Data for Gas Condensate Systems by D.G.P. Eyton, British Petroleum Exploration Co. Ltd. SPE Member Copyright 1987. Society of Petroleum Engineers This paper was prepared for presentation at the Fifth SPE Middle East Oil Show held in Maname. Bahrain. March 7-10. 1987. This paper was selected for presentation by an SPE Program Committee following review of information contained in an abstract submitted by the author(s). Contents of the paper. as presented. have not been reviewed by the Society of Petroleum Engineers and are subject to correction by the author(s). The material. as presented. does not necessarily reflect any position of the Society of Petroleum Engineers. its officers. or members. Papers presented at SPE meetings are subJect to publication review by Editorial Committees of the Society of Petroleum Engineers. PermissIon to copy is restricted to an abstract of not more than 300 words. Illustrations may not be copied. The abstract should contain consp'cuous acknowledgment of where and by whom the paper IS presented. Write PublicatIons Manager. SPE. P.O. Box 833836. Richardson. TX 75083-3836. Telex. 730989 SPEDAL. ABSTRACT This paper examines the accuracy of laboratory generated PVT data for gas condensate reservoir fluids. Although there are recognised difficulties in obtaining representative samples from such reservoirs, there are also significant uncertainties in the results of laboratory studies performed using the samples. The largest uncertainties are associated with the measurements of small liquid volumes, dewpoints and chemical compositions. Reservoir engineers should be aware of these uncertainties and should weight PVT data accordingly, when used as input parameters to reservoir models. INTRODUCTION The choice of the most profitable development scheme for any gas condensate reservoir is dependent upon various factors, including: • field size and location • local market for separated gas and condensate • tax regime • phase behaviour of reservoir fluid Development schemes vary in the degree of pressure maintenance 1 and in the pressure maintenance medium, which can be recycled gas, nitrogen or even water. Compositional simulation models are being used increasingly to study gas condensate reservoir depletion processes 2 ,3, particularly References and illustrations at end of paper. when gas injection and recycling are used for pressure maintenance. Prediction of the phase behaviour of petroleum systems using the traditional cubic equation of state (EOS) is inherentlyunreliable 4 Inaccuracies in the phase behaviour prediction may be attributed to a poor theoretical baSis of the model and to a lack of detail in the reservoir fluid analysis and heavy end (heptanes-plus) characterisationS. If experimental PVT data are not used to tune the 20S, then the quantitative prediction is of little value. Hence, the development of reservoir simulation mOdels is critically dependent on the quality of experi- mental PVT data. PVT data-are generated in the laboratory using samples taken in the field during well testing. Frequently, the users of EOS packages do not appreciate the practical limitations in both obtaining samples from a gas condensate reservoir and, subsequently, measuring the physical and chemical properties of the samples. This paper discusses briefly the methods for obtaining samples from gas condensate reservoirs and then examines uncertainties in the results of standard PVT studies, with specific reference to a study carried out at the BP Research Cen.tre at Sunbury (RCS). Quantification of these uncertainties is extremely important because it allows correct weighting to be put on the experimental results used when tuning the EOS. It is not possible to make general statements concerning the accuracy of PVT data, because different laboratories perform studies in different ways and no two reservoir fluid systems or studies are identical.
Transcript
SPE SPE 15765
Practical Limitations in Obtaining PVT Data for Gas Condensate Systems by D.G.P. Eyton, British Petroleum Exploration Co. Ltd.
SPE Member
Copyright 1987. Society of Petroleum Engineers
This paper was prepared for presentation at the Fifth SPE Middle East Oil Show held in Maname. Bahrain. March 7-10. 1987.
This paper was selected for presentation by an SPE Program Committee following review of information contained in an abstract submitted by the author(s). Contents of the paper. as presented. have not been reviewed by the Society of Petroleum Engineers and are subject to correction by the author(s). The material. as presented. does not necessarily reflect any position of the Society of Petroleum Engineers. its officers. or members. Papers presented at SPE meetings are subJect to publication review by Editorial Committees of the Society of Petroleum Engineers. PermissIon to copy is restricted to an abstract of not more than 300 words. Illustrations may not be copied. The abstract should contain consp'cuous acknowledgment of where and by whom the paper IS presented. Write PublicatIons Manager. SPE. P.O. Box 833836. Richardson. TX 75083-3836. Telex. 730989 SPEDAL.
ABSTRACT
This paper examines the accuracy of laboratory generated PVT data for gas condensate reservoir fluids. Although there are recognised difficulties in obtaining representative samples from such reservoirs, there are also significant uncertainties in the results of laboratory studies performed using the samples. The largest uncertainties are associated with the measurements of small liquid volumes, dewpoints and chemical compositions. Reservoir engineers should be aware of these uncertainties and should weight PVT data accordingly, when used as input parameters to reservoir models.
INTRODUCTION
The choice of the most profitable development scheme for any gas condensate reservoir is dependent upon various factors, including:
• field size and location
• local market for separated gas and condensate
• tax regime
• phase behaviour of reservoir fluid
Development schemes vary in the degree of pressure maintenance 1 and in the pressure maintenance medium, which can be recycled gas, nitrogen or even water. Compositional simulation models are being used increasingly to study gas condensate reservoir depletion processes2 ,3, particularly
References and illustrations at end of paper.
when gas injection and recycling are used for pressure maintenance.
Prediction of the phase behaviour of petroleum systems using the traditional cubic equation of state (EOS) is inherentlyunreliable4
Inaccuracies in the phase behaviour prediction may be attributed to a poor theoretical baSis of the model and to a lack of detail in the reservoir fluid analysis and heavy end (heptanes-plus) characterisationS. If experimental PVT data are not used to tune the 20S, then the quantitative prediction is of little value. Hence, the development of reservoir simulation mOdels is critically dependent on the quality of experimental PVT data.
PVT data-are generated in the laboratory using samples taken in the field during well testing. Frequently, the users of EOS packages do not appreciate the practical limitations in both obtaining samples from a gas condensate reservoir and, subsequently, measuring the physical and chemical properties of the samples. This paper discusses briefly the methods for obtaining samples from gas condensate reservoirs and then examines uncertainties in the results of standard PVT studies, with specific reference to a study carried out at the BP Research Cen.tre at Sunbury (RCS). Quantification of these uncertainties is extremely important because it allows correct weighting to be put on the experimental results used when tuning the EOS. It is not possible to make general statements concerning the accuracy of PVT data, because different laboratories perform studies in different ways and no two reservoir fluid systems or studies are identical.
2 Practical Limitations in Obtaining PVT Data for Gas Condensate Systems SPE 15765
GAS CONDENSATE RESERVOIRS
Gas condensate reservoirs are generally defined as those reservoirs which contain single phase gas at initial reservoir temperature and pressure, but in which a liquid phase will form when the pressure is reduced, at constant t~mperature1. :hiS Phgse behaviour phenomenon, f1rst observed 1n 1892 , is termed retrograde condensation. Figure 1 shows the phase envelope for a typical gas condensate system. Initial reservoir conditions can lie anywhere on or outside the envelope, between the critical temperature and the cricondentherm. If a sample of reservoir fluid is expanded at constant temperature, two phases will be formed at the upper dewpoint, and the volume of liquid phase present will increase up to a maximum value. Upon further expanding the sample, the liquid phase will re-evaporate until the lower dewpoint is reached, when the system becomes again a single phase gas. Reservoir fluid samples are subjected to the same thermodynamic path in the laboratory during a constant composition expansion (CCE) experiment.
Consider the depletion of a gas condensate reservoir without pressure maintenance. Once the pressure falls below dewpoint, at any point in the reservoir, differential mobility of the two phases will result in the production of fluid which differs in composition from that of the original reservoir fluid. Constant volume depletion (CVD) studies are carried out in the laboratory to model an extreme case, in which it is assumed that the reservoir can be treated as a Single cell; the liquid phase has zero mobility and, therefore, only single phase gas is produced.
WELL TESTING AND SAMPLING
Gas condensate systems are difficult to sample reliably because:
Large quantities of gas are small quantities of liquid. behaviour of the system may sensitive to the amount and liquid phase.
associated with The phase
be highly composition of the
The flowing system invariably becomes twophase before reservoir fluid reaches the surface, and frequently before it enters the wellbore.
Sampling during gas condensate well testing is usually carried out at surface. Downhole samples are sometimes taken but their validity is often dubious. Irrespective of the sampling location, the following criteria must be met in order to obtain a representative sample from the flowing system:
Effective unloading of the wellbore7,
All soluble contaminants removed from the 3ystem (e.g. oil-based mud, hydrate inhibitor, etc.), and
Reservoir fluid flowing into the wellbore.
The most common way of obtaining reservoir fluid is to recombine samples taken from the test separator streams. These samples have the advantage of being comparatively inexpensive and plentiful.
It is often the case that samples are taken when the above criteria are not satisfied completely and PVT studies are carried out using unrepresentative samples. Assuming, however, that these criteria are satisfied, the major sources of uncertainty in obtaining representative reservoir fluid by recombining separator samples are:
Separator design and efficiency,
Gas and liquid flowrate measurements, and
Sampling technique.
Of the above, it is likely that the liquid flowrate measurement is the largest source of uncertainty. The accuracy of the volumetric condensate-gas-ratio (CGR) is generally in the range! 5 to 10%.
STANDARD PYT STUDY
The form of a standard gas condensate PVT study, as carried out at BP RCS, is summarised in Table 1. More detailed descriptions of experimental procedures are contained in service company brochures and other documents 1 ,8,9,10,11. It is most common for reservoir fluid to be obtained by recombining pressurised separator gas and condensate samples. This paper concentrates on PVT studies performed using reservoir fluid obtained by this method only.
The following are baSic data requirements, prior to conducting a PVT study:
Reservoir conditions,
Separator conditions, and
CGR at metering conditions.
After validation of separator gas and condensate samples, these fluids are recombined in the corrected field CGR to obtain reservoir fluid. The field-measured gas flowrate is corrected using laboratory measured gas properties at metering conditions. From the choke equation~2 it can be shown that the field measured flowrate must be multiplied by a factor (F):
z y ( g field g F (1)
lab
SPE 15765 D.G.P. Eyton
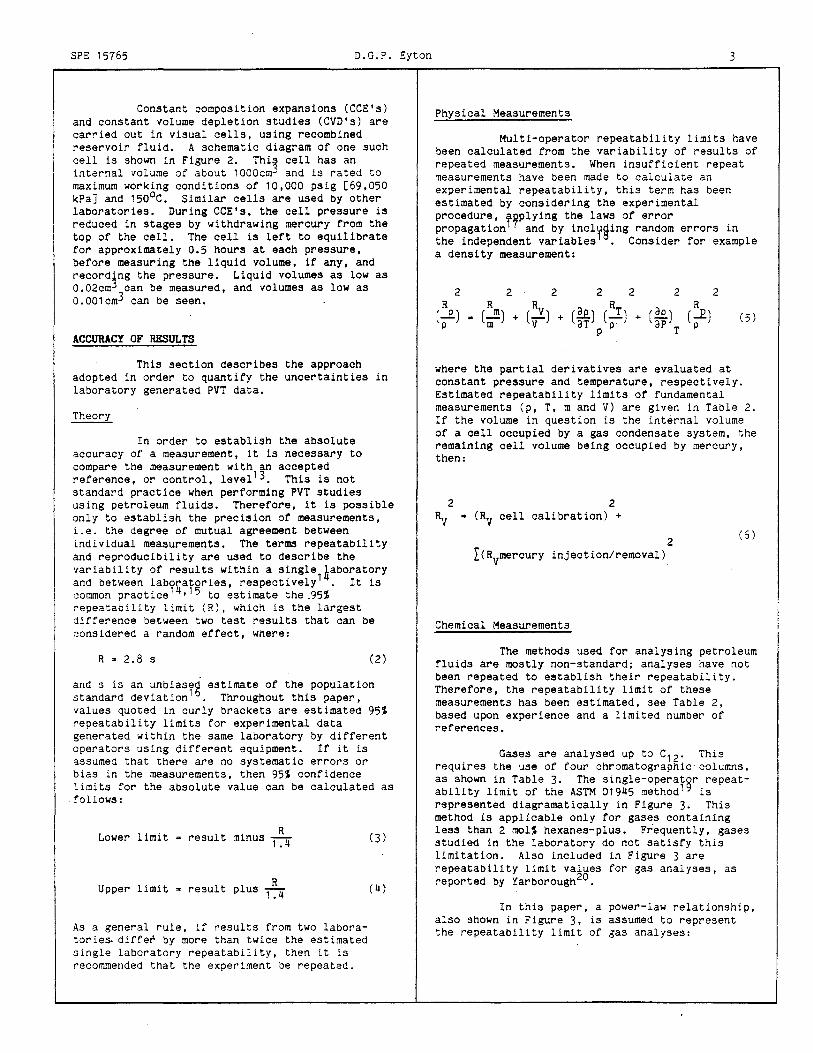
Constant composition expansions (CCE's) and constant volume depletion studies (CVD's) are carried out in visual cells, using recombined reservoir fluid. A schematic diagram of one such cell is shown in Figure 2. This cell has an internal volume of about 1000cm3 and is rated to maximum working conditions of 10,000 psig [69,050 kPa] and 1500 C. Similar cells are used by other laboratories. During CCE's, the cell pressure is reduced in stages by withdrawing mercury from the top of the cell. The cell is left to equilibrate for approximately 0.5 hours at each pressure, before measuring the liquid volume, if any, and recording the pressure. Liquid volumes as low as 0.02cm3 can be measured, and volumes as low as 0.001cm3 can be seen.
ACCURACY OF RESULTS
This section describes the approach adopted in order to quantify the uncertainties in laboratory generated PVT data.
Theory
In order to establish the absolute accuracy of a measurement, it is necessary to compare the measurement with an accepted reference, or control, level13 • This is not standard practice when performing PVT studies using petroleum fluids. Therefore, it is possible only to establish the precision of measurements, i.e. the degree of mutual agreement between individual measurements. The terms repeatability and reproducibility are used to describe the variability of results within a single haboratory and between labo4atories, respectivelyl . It is common practice1 .15 to estimate the _95% repeatability limit (R). which is the largest difference between two test results that can be considered a random effect, where:
R ~ 2.8 s (2)
and s is an unbiased estimate of the,poPulation standard deviation 16 • Throughout thIS paper. values quoted in curly brackets are estimated 95% repeatability limits for experimental data generated within the same laboratory by different operators using different equipment. If it is assumed that there are no systematic errors or bias in the measurements, then 95% confidence limits for the absolute value can be calculated as
- follows:
, R Lower limit = result mInus 1:4
R Upper limit ~ result plus 1:4
As a general rule. if results from two laboratories. differ by more than twice the estimated single laboratory repeatability. then it is recommended that the experiment be repeated.
(3)
(4 )
3
Physical Measurements
Multi-operator repeatability limits have been calculated from the variability of results of repeated measurements. When insufficient repeat measurements have been made to calculate an experimental repeatability, this term has been estimated by considering the experimental procedure, a~plYing the laws of error propagation1 and by incluging random errors in the independent variables' • Consider for example a density measurement:
2 2 R R
(...E.) .. (-!!!) + p m
2 2 R
+ (~) (2.) aT p p
2 2
(5)
where the partial derivatives are evaluated at constant pressure and temperature, respectively. Estimated repeatability limits of fundamental measurements (p, T, m and V) are given in Table 2. If the volume in question is the internal volume of a cell occupied by a gas condensate system, the remaining cell volume being occupied by mercury, then:
2 2 RV • (RV cell calibration) +
2 (6)
L(Rvmercury injection/removal)
Chemical Measurements
The methods used for analysing petroleum fluids are mostly non-standard; analyses have not been repeated to establish their repeatability. Therefore, the repeatability limit of these measurements has been estimated, see Table 2, based upon experience and a limited number of references.
Gases are analysed up to C12 • This requires the use of four chromatographic'columns, as shown in Table 3. The Single-operator repeatability limit of the ASTM 01945 method1,;! is represented diagramatically in Figure 3. This method is applicable only for gases containing less than 2 mol% hexanes-plus. Frequently, gases studied in the laboratory do not satisfy this limitation. Also included in Figure 3 are repeatability limit values for gas analyses. as reported by YarborOugh20 .
In this paper, a power-law relationship. also shown in Figure 3. is assumed to represent the repeatability limit of gas analyses:
4 Practical Limitations in Obtaining PVT Data for Gas Condensate Systems SPE 15765
0.43 R .
Xl 0.07 xi (7)
Eq. (7) gives a repeatability limit of 0.5 mol% as the component proportion approaches 100 mol%, and 0.01 mol% as the component proportion approaches 0.01 mol%.
The analysis of hydrocarbon liquids, stabilised,at atmospheric pressure, comprises two parts, as shown in Table 3. The whole liquid is characterised by a simulated true boiling point (TBP) distillation by gas liquid chromatography (GLC). These data are used to provide an analysis for the heptanes-plus fraction. The repeatability limit of component proportIons from C, to C'2 is estimated to be 7% of the value, and of the C'3 fraction 4% of the value. +
Table 4 shows the results of repeated TBP distillations by GLC on residual condensate samples, obtained by flashing to atmospheric pressure two consecutive separator condensate samples. A full distillation23 was also carried out on a gauge tank congensate sample, taken at the same time. Whitson reported that an increase of 15.5% in the flame ionisation detector response to the internal standard (n-hexane) was necessary to give a good match between true distillation data and simulated TBP data by GLC. This has not been found necessary. The repeatability limit of the C13+ average molecular weight calculated from the simulated TBP data is estimated to be 12 g/mol. Any residual condensate not recovered below 5250 C (boiling pOint of nC40) is assumed to have an average molecular weight equal to 632 glmol (that of nC 45 ).
RESULTS
An analysis of the uncertainties associated with experimental PVT data is specific to each individual study. In this paper, the results of one reservoir fluid study are presented; repeatability limits have been included with all data except those obtained by measurements which are known to include systematic errors. The study was chosen, because it exhibits clearly some of the problems associated with gas condensate PVT studies. From an analysis of the errors it is possible to make some general observations concerning the accuracy of PVT data and their use in EOS modelling.
Table 5 lists experimental PVT data for the moderately rich, naturally occurring gas condensate reservoir fluid. Reservoir pressure and temperature are 9040 psig [62 430 ka] and 148.90 C, respectively. Dewpoint at reservoir temperature was observed at 7660 pSig [52 920 kPa]. Separation during testing at 778 psig [5360 kPa] and 48.90 C gave a liquid yield of 108 bbl [17.17m3] condensate per 1 x 10⁶ scf
.[28 320 std m3] gas. The visual cell was charged with 55.0jO.31 g reservoir fluid before conducting the eCE and eVD experiments.
DISCUSSION
Reservoir Fluid Analysis
The calculation of reservoir fluid analysis requires laboratory measurements of both phYSical and chemical properties. Of the physical measurements, liquid densities are the most accurate and the CGR, obtained when separator condensate is flashed to atmospheric pressure, is the least accurate: it is found, in the laboratory, that the single flash CGR for separator condensates can be highly dependent on the rate at which the experiment is performed.
Uncertainties in the analysiS of separator gas and residual condensate are such that a variation in the field~measured CGR of ! 5% would not have a significant effect on the computed reservoir fluid analysis.
Constant Composition Expansion Study (CCE)
In Table 5, repeatability limits have been estimated for all CCE data, except relative liquid volumes. It is known that liquid volume measurements are systematically low (as discussed later). The repeatability limits for gas densities, in the Single phase region, and for relative volumes are within 1% of the value; however the repeatability limit for measured gas Z-factors is larger, apprOXimately 1.5% of the value, due to high uncertainties in reservoir fluid composition.
Studies have been performed to establish the amount of liquid which .is not· 'seen' during CCE's, due to wetting of the internal walls of the cell. For the cell deSign shown in Figure 2, the amount varies between 0.1 and 0.2 cm3 , depending upon the hydrocarbon system studied. It has been found that the amount of liquid seen also depends upon the time the cell is left to stabilise. This is assumed to be due to drainage. The cell is normally left to stabilise for about 0.5 hours between readings. It has been found that an additional amount of liquid drains to the base of the cell after the normal 0.5 hours, equal to no more t~an half of the increase in liquid volume or '.0 cm , whichever is the lesser. Most of the liquid drains to the base of the cell within about the first 2.5 hours.
Figure 4 shows half-hourly measured liquid volumes, expressed as a percentage of the total volume, together with estimated maximum values. The true value probably Hes between these limiting values.
Figure 4 also shows a detail which is often observed during gas condensate PVT studies, namely a liquid 'tail' close to dewpoint. Although the cause of this phenomenon is not known, it has been observed that:
The m~asurements are repeatable,
SPE 15765 D.G.P. Eyton
The length of the tail is increased markedly by adding small quantities of C13 + components to the system, and
The effect is not predicted by EOS models.
When tuning EOS models to experimental PVT data, it should be remembered that the measurement of low liquid volumes has a high associated uncertainty. At lower pressures below the maximum retrograde liquid volume, measurements are more accurate. The data should be weighted accordingly. Although exact specification of gas condensate dewpoints is of considerable academic interest, it has to be asked whether the presence of small (less than 1% by volume) amounts of liquid has a significant effect on reservoir flow processes.
Constant Volume Depletion Study (CVD)
It is extremely important to include a comparison of fluid charged to the cell with that recovered, including residual fluid, in the results of a CVD. The comparison should be carried out on both molar and mass bases as the values indicate the amount and type of fluid lost during the study. Values for the CVD shown in Table 5 are 98.1 and 95.5%, respectively. It is concluded from these two parameters that fluid was lost with an average molecular weight higher than that of reservoir fluid. Repeatability limits have not been included with the experimental. CVD data in Table 5, due to the known presence of systematic errors: a Similar approach has been adopted to that outlined in the previous section in order to estimate the maximum amount of liquid phase present in the cell.
Figure 5 shows how the density of the gas phase at cell conditions varies with pressure, during depletion. These data have been calculated by dividing the total mass of fluid evolved at each stage by the volume of gas depleted at cell conditions. It can be seen that values obtained for the first two stages, in the single phase region, are considerably less than those measured during the CCE. From a comparison of the mass and molar recoveries for these stages, which should have been identical, it is concluded that liquid was lost due to wetting of the internal surfaces of the catchment system. Small variations in the measured amount of liquid condensing from the gas at each stage have a disproportionately large effect on the calculated gas Z-factor: losses of liquid result in the Z-factor being underestimated.
When tuning to the results of a CVD, it should be remembered that, on average, liquid volumes, gas densities and gas Z-factors will be underestimated. Some liquid will be lost during the study on the walls of the catchment system and some will remain trapped in the cell at the end of the study. The accuracy of CVD results is increased by increasing the Size of charge.
5
Retrograde liquid densities, calculated by mass balance, have not been included in Table 5 because the values have an extremely high associated uncertainty and can be misleading.
T~e Use of Correlations
It is common practice for laboratories to use correlations for calculating gas Z-factors and viscosities. The accuracy of t~~ mgre often used correlations has been reviewed ,2. Ninety five percent confidence limits for calculated gas viscosities are no better than ~ 10% of the value.
The average deviation of measured gas Zfactors from calculated values, for the most reliable correlation, is 0.95%. Therefore, 95% of calculated gas Z-factors lie within 2.8% of the true value. If a correlation is used to calculate the Z-factor of a separator gas, prior to charging a gas condensate visual cell, then the accuracy of the reported physical properties of reservoir fluid is Significantly decreased.
CONCLUSIONS AND RECOMMENDATIONS
1. Reservoir engineers should be aware of the precision of experimental gas condensate PVT data which are used to tune EOS models. Some data are more accurate than others and these should be weighted accordingly. If increased accuracy is required, then studies can be modified, at increased cost to the client.
2. It is impractical for a single laboratory to establish the absolute accuracy of the PVT data it generates; however a laboratory can either estimate the repeatability of the data or, at least, highlight the presence of systematic errors. Repeatability data are specific to an individual study and should be reported along with the experimental results.
3. There are invariably systematic losses of liquid in PVT eqUipment, due to wetting of the walls. As a direct result, the measurement of small liquid volumes and dewpoints has a high associated uncertainty: it is not possible to achieve 100% mass balance during constant volume depletion studies, although molar balances can approach this value.
4. There are significant uncertainties in the chemical analysis of reservoir fluids. Analytically undetectable variations in the amount and properties of the neavy end (heptanes-plus) fraction are known to have a large effect upon both the observed and predicted phase behaviour.
5. If, during a PVT study, correlations are used to estimate the physical properties of the gas condensate system, then this should be clearly stated along with the reported accuracies of the correlations.
6 Practical Limitations in Obtaining PVT Data for Gas Condensate Systems SPE 15765
NOMENCLATURE
F
m
M
P
R
s
T
V
xi
y g
p
Correction to field-measured gas flowrate
Liquid volume expressed as a percentage of the total volume
Cumulative mass recovered expressed as a percentage of the total mass charged
Cumulative moles recovered expressed as a percentage of the total moles charged
mass, g
Average molecular weight, glmol
Average molecular weight of reservoir fluid, glmol
Average molecular weight of C13+ fraction, g/mol
Pressure, psig
95% single laboratory multi-operator repeatability limit
Unbiased estimate of population standard deviation
Temperature, °c
Volume, cm3
Volume at reservoir conditions, cm3
Molar percentage of component "i"
Gas compressibility factor
Condensate specific gravity, (water = 1)
Gas specific gravity, (air 2 1)
Density, g/cm3
ACKNOWLEDGEMENTS
The author would like to thank the management of British Petroleum Company for permission to publish this paper and colleagues at the Research Centre Sunbury, especially Mr. B. Penny, for their technical support and guidance in preparing the paper.
REFERENCES
1. Eilerts, C.K. et al.: Phase Relations of GasCondensate Fluids, Monograph 10, Bureau of Mines, American Gas Association, New York (1957) 1.
2. Coats, K.H. and Smart, G.T.: "Application of a Regression-Based EOS PVT Program to Laboratory Data", Soc. Pet. Eng. Res. Eng. (May 1986) 277-299.
3.
4.
5.
6.
7.
8.
9.
Coats, K.H.: "Simulation of Gas Condensate Reservoir Performance", J. Pet. Tech. (Oct. 1985) 1870-1886.
Clancy, M. et al.: "Estimating the Properties of Hydrocarbon Mixtures at High Pressures -Data and Methods Available", paper presented at the 1983 I. Chem. E. Offshore Gas Technology Seminar, November 10.
Whitson, C.H.: "Effect of C7+ Properties on Equation-of-State Predictions", Soc. Pet. Eng. (Dec. 1984) 685-696.
Turner, R.G., Hubbard, M.G. and Dukler, U.: "Analysis and Prediction of Minimal Flow Rate for the Continuous Removal of Liquids from Gas Condensate Wells", Petroleum Transactions, AIME (Nov. 1969) 1475-1482.
Whitson, C.H.: "Practical Aspects of Characterising Petroleum Fractions", paper presented at the 1983 North Sea Condensate Reservoirs and Their Development Conference, London, May 24-25.
Williams, J.M.: "PVT (Pressure-VolumeTemperature) Measurements on Gas Condensate Fluids", paper number 5 presented at the 1983 North Sea Reservoirs and Their Development Conference~ London, May 24-25.
10. Whitson, C.H. and Torp, S.B.; "Evaluating Constant-Volume Depletion Data", J. Pet. Tech. (Mar. 1983) 610-620.
11. Kilgren, K.H.: "Visual Phase Study of a Condensate Reservoir Fluid". paper SPE 1277 presented at the 1965 Annual Fall Meeting. Denver. Oct. 3-6.
12. Katz, D.L. et al.: Handbook of Natural Gas Engineering, McGraw-Hill (1959).
13. ASTM E177-71: "Use of Terms Precision and Accuracy as Applied to Measurement of a Property of a Material". reapp~oved 1980.
14. ASTM E456-83a: "Standard Terminology for Statistical Methods".
15. IP: Methods for Analysis and Testing. Volume 2. Heyden and Son Ltd. (1978) Appendix E.
16. ASTM E691-79: "Standard Practice for Conducting an Interlaboratory Test Progra~ to Determine the Precision of Test Methods".
SPE 15765 D.G.P. Eyton
17. IUAPC: Experimental Thermodynamics, Volume 2, Butterworths, London (1975) 511-514.
18. Ku, H.K.: Precision Measurement and Calibration, National Bureau of Standards, Special Publication 300, Volume 1, Washington (1969) 331-341.
19. ASTM 01945-81: "Standard Method for Analysis of Natural Gas by Gas Chromatography".
20. Yarborough, L.: "Vapor-Liquid Equilibrium Data for Multicomponent Mixtures Containing Hydrocarbon and Nonhydrocarbon Components", J. Chem. and Eng. Data, Vol. 17 No.2 (1972) 129-133.
21. ASTM 02887-84: "Standard Test Method for Boiling Point Distribution of Petroleum Fractions by Gas Chromatography".
22. McTaggart; N.G. and Glaysher, P.: "Simulated True Boiling POints of Total Crude Oils by Gas Chromatography", D.R. Hodges (ed) Recent Analytical Developments in the Petroleum Industry, Wiley, New York (1974) 79-95.
23. ASTM 02892-84: "Standard Test Method for Distillation of Crude Petroleum (15-Theoretical Plate Column)".
24. Sutton, R.P.: "Compressibility Factors for High-Molecular-Weight Reservoir Gases", paper SPE 14265 presented at the 1985 Annual Technical Conference, Las Vegas, Sept. 22-25.
25. Reid, R.C., Prausnitz, J.M. and Sherwood, T.K.: The Properties of Gases and Liquids, Third Edition, McGraw-Hill (1977) ·391-435.
SI Metric Conversion Factors
psig (psig + 14.7) x 6.894 E +00 ~ kPa bbl x 1.590 E -01 ~ m3 scf x 2.832 E -02 2 m3