SPE-191778-18ERM-MS Contribution of Hydraulic Fracture Stage on the Gas Recovery from the Marcellus Shale Mohamed El sgher, Kashy Aminian, and Samuel Ameri, West Virginia University Copyright 2018, Society of Petroleum Engineers This paper was prepared for presentation at the SPE Eastern Regional Meeting held in Pittsburgh, Pennsylvania, USA, 7 - 11 October 2018. This paper was selected for presentation by an SPE program committee following review of information contained in an abstract submitted by the author(s). Contents of the paper have not been reviewed by the Society of Petroleum Engineers and are subject to correction by the author(s). The material does not necessarily reflect any position of the Society of Petroleum Engineers, its officers, or members. Electronic reproduction, distribution, or storage of any part of this paper without the written consent of the Society of Petroleum Engineers is prohibited. Permission to reproduce in print is restricted to an abstract of not more than 300 words; illustrations may not be copied. The abstract must contain conspicuous acknowledgment of SPE copyright. Abstract The natural gas from Marcellus Shale can be produced most efficiently through horizontal wells stimulated by multi-stage hydraulic fracturing. The objective of this study is to investigate the impact of the geomechanical factors and non-uniform formation properties on the gas recovery for the horizontal wells with multiple hydraulic fractures completed in Marcellus Shale. Various information including core analysis, well log interpretations, completion records, stimulation design and field information, and production data from the Marcellus Shale wells in Morgantown, WV at the Marcellus Shale Energy and Environment Laboratory (MSEEL) were collected, compiled, and analyzed. The collected shale petrophysical properties included laboratory measurements that provided the impact of stress on core plug permeability and porosity. The petrophysical data were analyzed to estimate the fissure closure stress. The hydraulic fracture properties (half-length and conductivity) were estimated by analyzing the completion data with the aid of a commercial P3D fracture model. In addition, the information from the published studies on Marcellus Shale cores plugs were utilized to determine the impact of stress on the propped fracture conductivity and fissure permeability. The results of the data collection and analysis were utilized to generate a base reservoir model. Various gas storage mechanisms inherent in shales, i.e., free gas (matrix and fissure porosity), and adsorbed gas were incorporated in the model. Furthermore, the geomechanical effects for matrix permeability, fissure permeability, and hydraulic fracture conductivity were included in the model. A commercial reservoir simulator was then employed to predict the gas production for a horizontal well with multi-stage fracture stimulation using the base model. The production data from two horizontal wells (MIP-4H and MIP-6H), that were drilled in 2011 at the site, were utilized for comparison with the model predictions. The model was then also used to perform a number of parametric studies to investigate the impact of the geomechanical factors and non-uniform formation properties on hydraulic fractures and the gas recovery. The matrix permeability geomechanical effect was determined by an innovative method using the core plug analysis results. The results of the modeling study revealed that the fracture stage contribution has a more significant impact on gas recovery than the fracture half-length. Furthermore, the predicted production by the model was significantly higher than the observed field production when the geomechanical effects were excluded from the model. The inclusion of the geomechanical factors, even though it reduced the
Transcript
SPE-191778-18ERM-MS
Contribution of Hydraulic Fracture Stage on the Gas Recovery from theMarcellus Shale
Mohamed El sgher, Kashy Aminian, and Samuel Ameri, West Virginia University
Copyright 2018, Society of Petroleum Engineers
This paper was prepared for presentation at the SPE Eastern Regional Meeting held in Pittsburgh, Pennsylvania, USA, 7 - 11 October 2018.
This paper was selected for presentation by an SPE program committee following review of information contained in an abstract submitted by the author(s). Contentsof the paper have not been reviewed by the Society of Petroleum Engineers and are subject to correction by the author(s). The material does not necessarily reflectany position of the Society of Petroleum Engineers, its officers, or members. Electronic reproduction, distribution, or storage of any part of this paper without the writtenconsent of the Society of Petroleum Engineers is prohibited. Permission to reproduce in print is restricted to an abstract of not more than 300 words; illustrations maynot be copied. The abstract must contain conspicuous acknowledgment of SPE copyright.
AbstractThe natural gas from Marcellus Shale can be produced most efficiently through horizontal wells stimulatedby multi-stage hydraulic fracturing. The objective of this study is to investigate the impact of thegeomechanical factors and non-uniform formation properties on the gas recovery for the horizontal wellswith multiple hydraulic fractures completed in Marcellus Shale.
Various information including core analysis, well log interpretations, completion records, stimulationdesign and field information, and production data from the Marcellus Shale wells in Morgantown, WV at theMarcellus Shale Energy and Environment Laboratory (MSEEL) were collected, compiled, and analyzed.The collected shale petrophysical properties included laboratory measurements that provided the impact ofstress on core plug permeability and porosity. The petrophysical data were analyzed to estimate the fissureclosure stress. The hydraulic fracture properties (half-length and conductivity) were estimated by analyzingthe completion data with the aid of a commercial P3D fracture model. In addition, the information fromthe published studies on Marcellus Shale cores plugs were utilized to determine the impact of stress onthe propped fracture conductivity and fissure permeability. The results of the data collection and analysiswere utilized to generate a base reservoir model. Various gas storage mechanisms inherent in shales, i.e.,free gas (matrix and fissure porosity), and adsorbed gas were incorporated in the model. Furthermore, thegeomechanical effects for matrix permeability, fissure permeability, and hydraulic fracture conductivitywere included in the model. A commercial reservoir simulator was then employed to predict the gasproduction for a horizontal well with multi-stage fracture stimulation using the base model. The productiondata from two horizontal wells (MIP-4H and MIP-6H), that were drilled in 2011 at the site, were utilized forcomparison with the model predictions. The model was then also used to perform a number of parametricstudies to investigate the impact of the geomechanical factors and non-uniform formation properties onhydraulic fractures and the gas recovery.
The matrix permeability geomechanical effect was determined by an innovative method using the coreplug analysis results. The results of the modeling study revealed that the fracture stage contribution has amore significant impact on gas recovery than the fracture half-length. Furthermore, the predicted productionby the model was significantly higher than the observed field production when the geomechanical effectswere excluded from the model. The inclusion of the geomechanical factors, even though it reduced the
2 SPE-191778-18ERM-MS
differences between the predictions and field results to a large degree, was sufficient to obtain an agreementwith field data. This lead to the conclusion that various fracture stages do not have the same contributionto the total production. Based on well trajectory, variation in instantaneous shut-in pressure ISIP along thehorizontal length, shale lithofacies variation and natural fracture (fissure) in the reservoir, it is possible toestimate the contribution of different stages to the production for both wells MIP-4H and MIP-6H.
IntroductionThe Marcellus Shale play is estimated to contain over 140 trillion cubic feet of recoverable natural gas.The Marcellus play has developed into the largest natural gas play in the United States. Furthermore, theMarcellus Shale is one of the largest unconventional gas shale plays in the United States. It underliesmuch of West Virginia, Pennsylvania, and New York state, and extends under Lake Erie and into Canada.Additionally, the energy demand is increasing dramatically in the United States and internationally. Theproduction of natural gas is gaining importance since it is considered to be a cleaner source of energycompared to other sources. There are much natural gas plays across the United States, with the MarcellusShale play being the largest resource. The Marcellus Shale plays a vital role in the future of gas productionand encompasses several states in the eastern United States.
Hydraulic fracture propagation in the naturally fractured reservoir is significantly different from hydraulicfracture propagation in non-fractured reservoirs. In naturally fractured reservoirs, the fracture may propagateasymmetrically due to hydraulic fracture interaction with the natural fractures. However, hydraulic fracturepropagates symmetrically perpendicular to the minimum stress in non-fractured reservoirs because rockproperties are homogenous. Furthermore, natural fracture and hydraulic interaction may cause substantialdiversion of hydraulic fracture paths due to the intersection with natural fractures, which causes difficultiesin proppant transport and, finally, job failure.
This paper investigates the contribution of different stages to the total production for both of the wells(MIP-4H and MIP-6H). Using analysis based on well trajectory, variation in ISIP along the horizontallength, shale lithofacies variation and natural fracture (fissure) in the reservoir, it is possible to know whichstage contributes to the total production.
BackgroundShale gas reservoirs have become a growing source of natural gas reserves across the United States. Theuse of horizontal drilling and hydraulic fracturing are key aspects of successfully developing this importantnatural gas resource. A horizontal well with multiple hydraulic fractures improves the contact area andcreates a conductive pathway for the flow of hydrocarbon into the wellbore (Boosari, Eshkalak, and Aybar2015). This technique significantly improves hydrocarbon recovery in shale reservoirs. The horizontal wellsare completed in stages, and each stage is fractured. Diagnostic data in the field, however, has shown that inmost cases not all stages create dominant fractures (Fisher et al. 2004; Molenaar et al. 2011). Many studieshave investigated production variability from the horizontal length. Miller et al. (2011) and Slocombe etal. (2013) analyzed production logs for over 100 horizontal shale-gas wells and concluded that there isproduction variability along the horizontal length and only about 64% of perforation clusters contributedto the total production. Cipolla et al. (2011) applied a statistical analysis on 100 production logs fromgeometrically completed horizontal wells, and their results indicated that only 60% of perforation clusterscontribute to production. Chorn et al. (2014) studied production performance for 100 wells drilled in theBarnett Shale and observed significant production variability. Also, Spain et al. (2015) discovered that40-60% of perforation clusters are either producing minimum amounts of gas or not producing at all. Uguetoet al. (2016) found that only 50-60% of the perforation clusters were properly stimulated or produced atsignificant rates based on the fiber optic diagnostics.
SPE-191778-18ERM-MS 3
Lateral heterogeneity of the reservoir properties (reservoir mineralogy, rock quality, and facies changeover a short distance) has an impact on the fracture propagation. Furthermore, natural fractures (fissure)distribution within shale have significant effects on horizontal stimulation. Many researchers have observedthat significant variation in reservoir properties is present along the lateral interval. This variation couldaffect the initiation and propagation of hydraulic fractures, as well as the productivity of the well.Researchers observed the variation by using image logs, sonic logs, and microseismic data along thehorizontal wellbore. Hydraulic fractures propagate in the path of least resistance; consequently, it is essentialto isolate high-stress zones from low-stress zones, as well as naturally fractured zones from un-fracturedzones to maximize stimulation effectiveness (Baihly et al., 2010; Wutherich et al. 2012). Furthermore,Figure 1 illustrates hundreds of fracture stages which are disturbed from left to right, showcasing deepestto shallowest. It is noticeable that the hydraulic fracture extends upward rather than downward becausethe Onondaga Limestone below the Marcellus Shale acts as fracture barriers (Fisher et al. 2010). Serajianand Ghassemi (2011) and Suarez-Rivera et al. (2011) revealed that shale intervals, which have low claycontent, have proven easier to hydraulically fracture, both during drilling and during stimulation. This isbased on borehole image data and fracture initiation pressures encountered during stimulation. Furthermore,Waters et al. (2006) observed that clay-rich intervals are likely to show higher horizontal stresses. Therefore,hydraulic fracture initiation and proppant placement become more difficult in these zones.
Figure 1—Illustrates the Vertical Extension of the Hydraulic Fracture in Marcellus Shale (Fisher et al. 2010)
Reservoir GeomechanicsWhen gas is produced from the reservoir, net stress increases due to the decrease in pore (gas) pressure,while the overburden pressure remains constant. This results in a reduction in the size of pores in thematrix and fissure, as well as the proppant embedment in the propped fracture. Many researchers have beenincorporated impact of stress dependent permeability (matrix, fissure and Hydraulic fracture) in reservoirmodeling (El Sgher et al. 2018; and Sina Hosseini Boosari, Aybar, and Eshkalak 2016)
Naturally fractured reservoirs are characterized by matrix and fractures systems and tend to be moresensitive to stress variations than non-fractured formations (Lian et al., 2012). Dong et al. (2010) measuredthe stress-dependent matrix permeability of fine-grained silty-shale. They suggested that the dependencyof gas permeability to stress can be better expressed using a power law function. Additionally, Shi andDurucan (2016) measured matrix permeability as a function of net pressure. Heller et al. (2014) measuredshale matrix permeability as a function of net pressure by using helium under various pore pressures. The sixcore samples analyzed in Heller et al.'s study were from the Barnett, Marcellus, Eagle Ford, and Montney
4 SPE-191778-18ERM-MS
formations. Most of the studies mentioned above, including Dong et al. (2010), Shi and Durucan (2016)and Heller et al. (2014), considered the entire range of the data representing matrix permeability.
Elsaig et al. (2017) measured the absolute permeability of Marcellus Shale core plugs at four different gaspressures and seven different net stress values. The absolute permeability was determined at each net stresslevel by the application of the double slippage correction. Figure 2 shows the impact of net stress on theabsolute permeability determined during these experiments. Fissures that are more sensitive to stress closedown as stress increases. The closure of fissures causes a major reduction in the measured permeability of thecore plug. After all the fractures close, the permeability reduction is related only to the matrix compression.Walsh (1981) suggested that when (k/ko)1/3, where k is the permeability measured at a specific stress (P),and ko is the permeability measured at the lowest stress (Po) values, is plotted against ln (P/Po), a lineartrend is observed. Figure 3 illustrates this plot for the above-mentioned Marcellus Shale core plug (Elsaiget al. 2016). The difference in the compressibility of the fissures and the matrix resulted in two straightlines on this plot. The net stress value at which these two lines intersect represents the point that fissuresare closed (closure stress).
Figure 2—The Impact of net stress on the Absolute Permeability (after SPE 184042)
Figure 3—Evaluation of Fissure Closure Stress (after SPE 184042)
SPE-191778-18ERM-MS 5
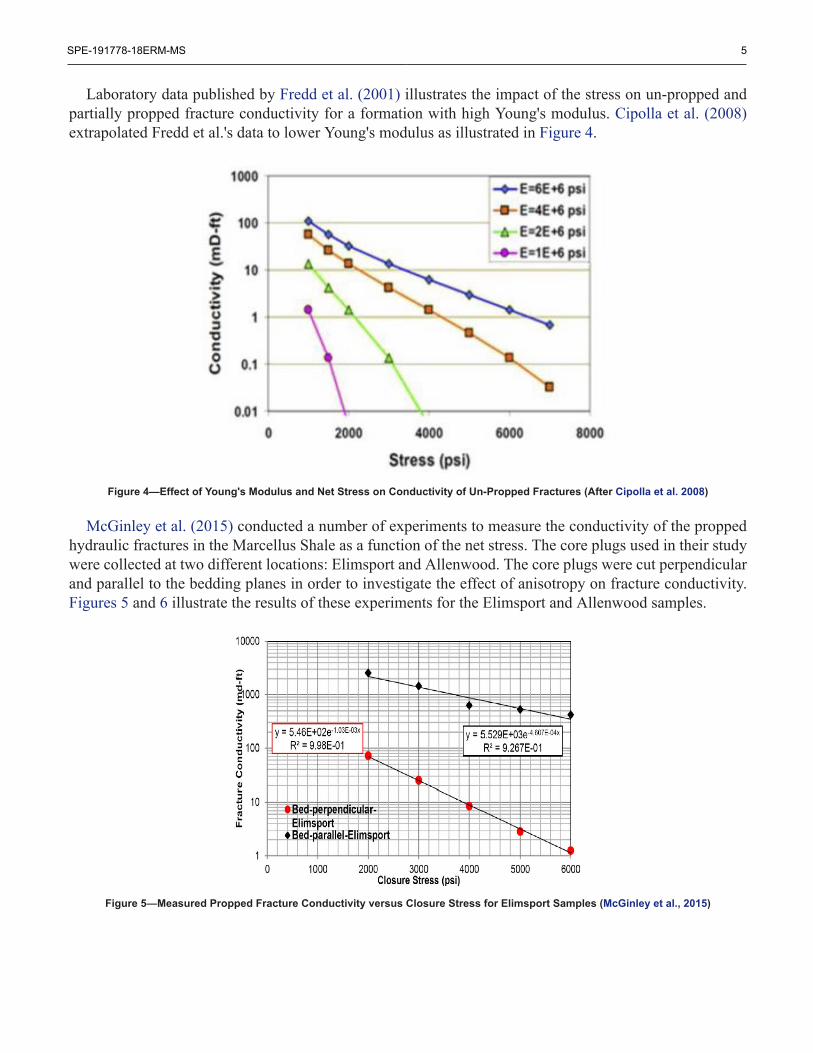
Laboratory data published by Fredd et al. (2001) illustrates the impact of the stress on un-propped andpartially propped fracture conductivity for a formation with high Young's modulus. Cipolla et al. (2008)extrapolated Fredd et al.'s data to lower Young's modulus as illustrated in Figure 4.
Figure 4—Effect of Young's Modulus and Net Stress on Conductivity of Un-Propped Fractures (After Cipolla et al. 2008)
McGinley et al. (2015) conducted a number of experiments to measure the conductivity of the proppedhydraulic fractures in the Marcellus Shale as a function of the net stress. The core plugs used in their studywere collected at two different locations: Elimsport and Allenwood. The core plugs were cut perpendicularand parallel to the bedding planes in order to investigate the effect of anisotropy on fracture conductivity.Figures 5 and 6 illustrate the results of these experiments for the Elimsport and Allenwood samples.
Figure 5—Measured Propped Fracture Conductivity versus Closure Stress for Elimsport Samples (McGinley et al., 2015)
6 SPE-191778-18ERM-MS
Figure 6—Measured Propped Fracture Conductivity versus Closure Stress for Allenwood Samples (McGinley et al., 2015)
Objective and MethodologyThe objective of this study was to investigate the impact of the geomechanical factors and non-uniformformation properties on the gas recovery for the horizontal wells with multiple hydraulic fractures completedin Marcellus Shale. In this study, numerical reservoir simulation techniques were used to predict productionperformance of the horizontal wells with multiple hydraulic fractures completed in Marcellus Shale. In orderto accomplish the objective of this study, a methodology consisting of the following steps were implemented:
Data CollectionThe data used in this study was acquired from the Marcellus Shale Energy and Environment Laboratory(MSEEL), which is located in the Morgantown Industrial Park (MIP) site in the state of West Virginia.MSEEL is a field laboratory operated by Northeast Natural Energy (NNE). This site includes two horizontalwells (MIP-4H and MIP-6H) that were drilled in 2011. Moreover, two horizontal wells (MIP-3H andMIP-5H) and a vertical science observation well (MIP-SW) were drilled in 2015. The science well providedan opportunity for collecting subsurface samples and microseismic monitoring.
1. The results of the core analysis performed through the Precision Petrophysical Analysis Laboratory(Elsaig et al. 2016) discussed earlier were used in this study.
2. The geomechanical rock properties including the minimum horizontal stress, Young's modulus, andPoisson's ratio were estimated from the logs.
3. Completion and production data for two horizontal wells, MIP-4H and MIP-6H, were obtained fromthe MSEEL project. Well MIP-4H was stimulated with eleven fractures over a lateral of 3800 ft. WellMIP-6H was stimulated with eight fracture stages over a lateral length of 2,380 ft. The productionrecords included 1473 days of production for both wells.
4. The fracture treatment for both wells, MIP-4H and MIP-6H, used a pump rate of 80 bpm. 339,172gallons of a slick water; 1500 gallons of acid; 36,175 gallons linear 2000; and 400,000 lb of sand whichincluded 100,000 lb of 100 lb of mesh and 300,000 lb of 40/100 mesh were used in each stage. Thehydraulic fracture properties were estimated from the completion data by employing a P3D fracturemodeling software (FRACPRO) which assumes isotropic rock properties for estimating the fractureproperties.
5. Information on the magnitude of minimum horizontal stress (Shmin) for both wells MIP-4H andMIP-6H at a given depth are available from the pumping records for each fracture stage, which isinstantaneous shut-in pressure (ISIP). Figures 7 and 8 show the variation of instantaneous shut-inpressure (ISIP) along the well as well as Gamma Ray log readings.
SPE-191778-18ERM-MS 7
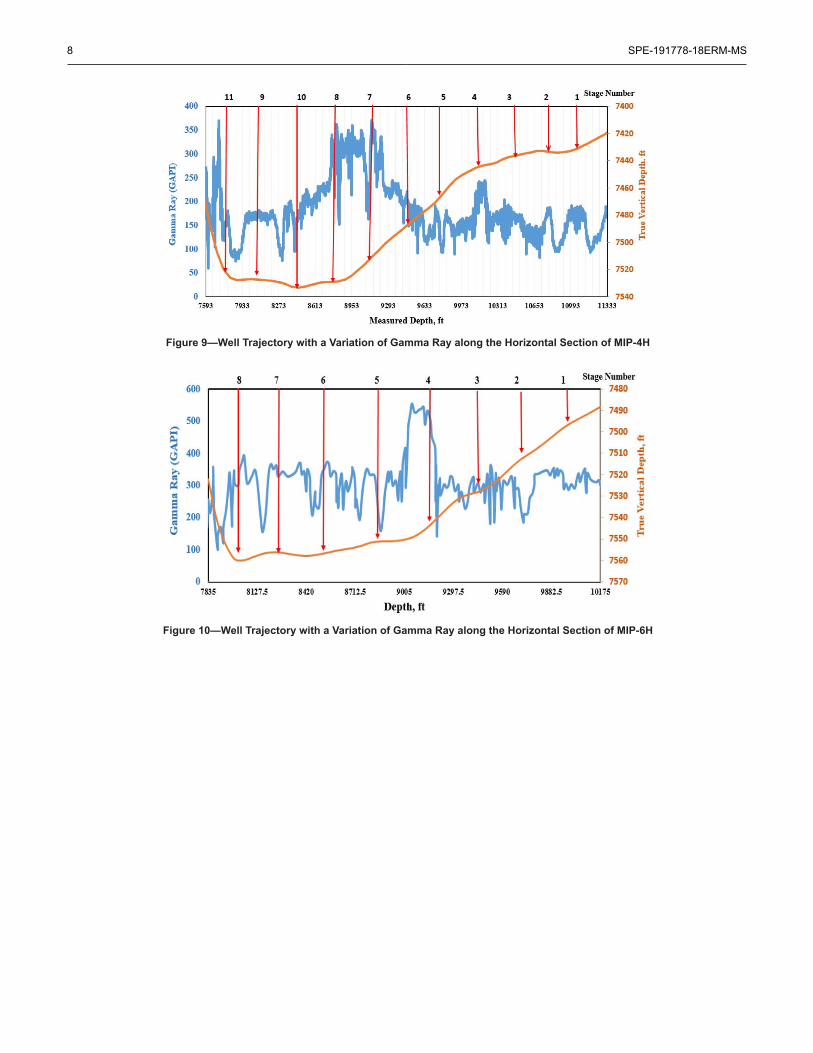
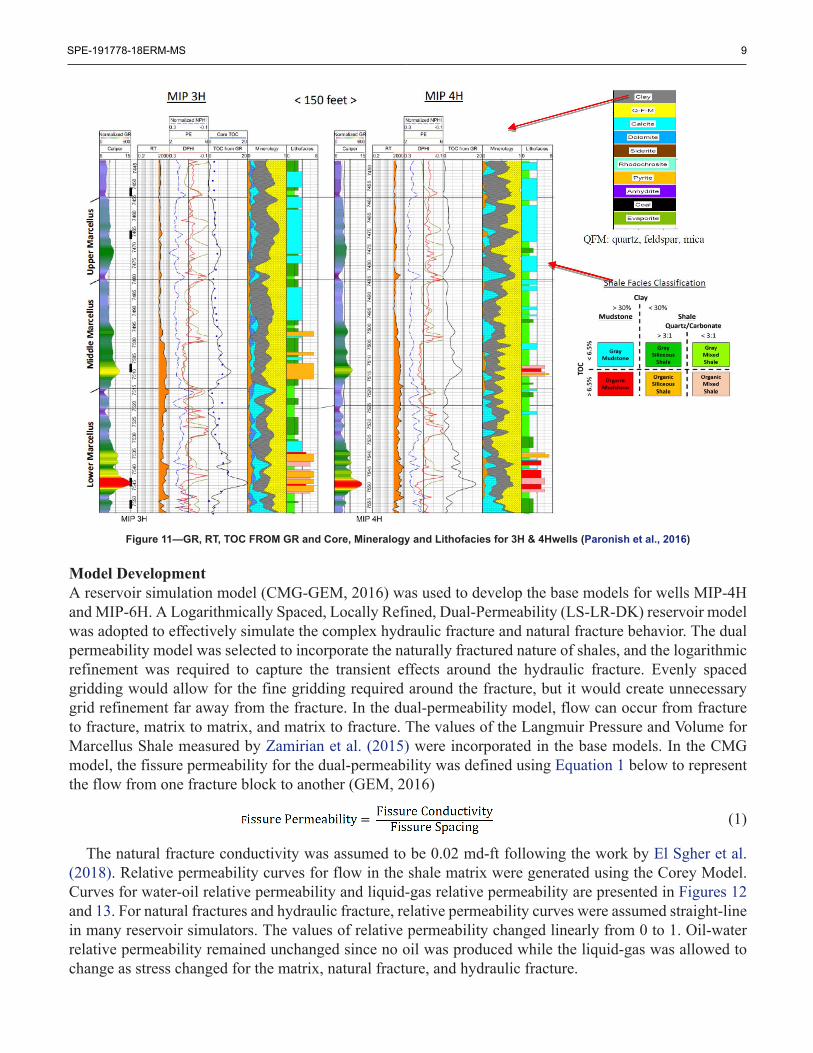
6. Figures 9 and 10 show a variation of Gamma Ray along the horizontal section of both wells MIP-4Hand MIP-6H with well trajectory in the vertical direction. The thickness of the pay zone of theMarcellus shale is around 90 feet, starting from 7460 ft. to 7555 ft., as it seen in Figure 11.
7. Marcellus interval is composed of six shale lithofacies based on the mineralogy and organic content(Paronish et al., 2016) as it can be seen in Figure 11 for both wells MIP-3H and MIP-4H. Thesex different facies units are Organic Siliceous Shale, Organic Mudstone, Organic Mixed Shale,Gray Siliceous Shale, Gray Mixed Shale and Gray Mudstone. Furthermore, mineralogy controls thebrittleness in Shale lithofacies. Gray Mudstone and Organic Mudstone facies are more ductile due toan increase in clay content, and Gray Siliceous and Organic siliceous shale are more brittle due toan increase in quartz content. Lateral variation in facies is notable between the two wells based onlateral mineralogy changes.
Figure 7—Instantaneous Shut-in Pressure (ISIP) per Stage for Well MIP-6H
Figure 8—Instantaneous shut-in pressure (ISIP) per stage for well MIP-4H
8 SPE-191778-18ERM-MS
Figure 9—Well Trajectory with a Variation of Gamma Ray along the Horizontal Section of MIP-4H
Figure 10—Well Trajectory with a Variation of Gamma Ray along the Horizontal Section of MIP-6H
SPE-191778-18ERM-MS 9
Figure 11—GR, RT, TOC FROM GR and Core, Mineralogy and Lithofacies for 3H & 4Hwells (Paronish et al., 2016)
Model DevelopmentA reservoir simulation model (CMG-GEM, 2016) was used to develop the base models for wells MIP-4Hand MIP-6H. A Logarithmically Spaced, Locally Refined, Dual-Permeability (LS-LR-DK) reservoir modelwas adopted to effectively simulate the complex hydraulic fracture and natural fracture behavior. The dualpermeability model was selected to incorporate the naturally fractured nature of shales, and the logarithmicrefinement was required to capture the transient effects around the hydraulic fracture. Evenly spacedgridding would allow for the fine gridding required around the fracture, but it would create unnecessarygrid refinement far away from the fracture. In the dual-permeability model, flow can occur from fractureto fracture, matrix to matrix, and matrix to fracture. The values of the Langmuir Pressure and Volume forMarcellus Shale measured by Zamirian et al. (2015) were incorporated in the base models. In the CMGmodel, the fissure permeability for the dual-permeability was defined using Equation 1 below to representthe flow from one fracture block to another (GEM, 2016)
(1)
The natural fracture conductivity was assumed to be 0.02 md-ft following the work by El Sgher et al.(2018). Relative permeability curves for flow in the shale matrix were generated using the Corey Model.Curves for water-oil relative permeability and liquid-gas relative permeability are presented in Figures 12and 13. For natural fractures and hydraulic fracture, relative permeability curves were assumed straight-linein many reservoir simulators. The values of relative permeability changed linearly from 0 to 1. Oil-waterrelative permeability remained unchanged since no oil was produced while the liquid-gas was allowed tochange as stress changed for the matrix, natural fracture, and hydraulic fracture.
10 SPE-191778-18ERM-MS
Figure 12—Relative Permeability Curve for the Water Phase
Figure 13—Relative permeability Curve for the Gas Phase
Additionally, wellbore pressures for wells MIP-6H and MIP-4H were calculated from tubing pressureand used as constraints in the simulation model for history matching. Figures 14 and 15 show wellborepressures for wells MIP-6H and MIP-4H.
Figure 14—Wellbore pressure for well MIP-6H
SPE-191778-18ERM-MS 11
Figure 15—Wellbore pressure for well MIP-6H
The results of data collection and analysis were used as inputs to develop the base models for wellsMIP-6H, and MIP-4H are summarized in Table 1.
Table 1—Basic Model Parameters for MIP-4H and 6H
To incorporate the stress-dependent matrix permeability in the model, the permeability measurementsillustrated in Figure 2 were utilized. As discussed earlier, the permeability values at stress values higherthan the closure pressure represent only the matrix permeability. These permeability values were utilized todevelop the relation between matrix permeability and the net stress using a logarithmic equation, followingthe work by El Sgher et al. (2018). To incorporate the stress-dependent fissure permeability in the model,the curve for Young's modulus of 2E+6 psi in Figure 4 was used. Young's modulus of 2E+6 psi was used in
12 SPE-191778-18ERM-MS
this study because Marcellus Shale is a relatively soft formation (Stegent et al. 2010). The initial net stressin the formation was estimated to be 2600 psi and the maximum net stress was estimated to be 6800 psi. Thematrix and fissure permeability values between 2600 psi and 6800 psi were then normalized and convertedto permeability multipliers as a function of the reservoir pressure (pore pressure). The matrix and fissurepermeability multipliers that were used in the reservoir model are provided in Figure 16. This is the sameprocedure that was employed by El sgher et al. (2018)
Figure 16—Matrix and Fissure Permeability Multiplies
To incorporate stress-dependent propped fracture conductivity into the model, only the results from theElimsport sample were utilized, shown in Figure 5. This is because the stress and anisotropy impacts weremore pronounced in this case (El sgher et al. 2018). The conductivity values at 2600 psi in Figure 5 wereconsidered to be the initial conductivity of propped fracture. Propped fracture conductivity multiplierswere obtained based on the same method used for matrix and fissure permeability multipliers. Figures 17illustrates propped fracture conductivity multipliers.
Figure 17—Fracture Conductivity Multiplier for Elimsport Sample
Contribution of Hydraulic Fracture Stage to Total ProductionTo investigate the contribution of hydraulic fracture stage to total production, production data for MIP-4Hand MIP-6H were used for history matching. Four different cases were modeled for each horizontal wellto achieve a match. These cases are as follows:
1. Non-fractured reservoir, all hydraulic fractures were assumed to have the same length, and otherproperties included geomechanical (matrix and hydraulic fracture).
SPE-191778-18ERM-MS 13
2. Naturally fractured reservoir, all hydraulic fractures were assumed to have the same length, and otherproperties included geomechanical (matrix, fissure and hydraulic fracture). Furthermore, uniformfissure distribution was considered along the horizontal well length with 20-ft horizontal spacing (Elsgher et al. 2017).
3. One stage was assumed to be non-productive based on well trajectory and variation in instantaneousshut-in pressure (ISIP) along the horizontal well length.
4. Two stages were assumed to be non-productive based on well trajectory and variation in instantaneousshut-in pressure (ISIP) along the horizontal well length.
History matching for water production was performed for both wells. Relative permeability curves wereassumed straight-line for natural fracture and hydraulic fracture. Before the history matching, initial watersaturation in the hydraulic fracture was assumed to be 100%, initial water saturation in the natural fracturewas about 100% near the hydraulic fracture, and to be 10% far away from a hydraulic fracture. After theseassumptions were made, the model produced more water than the production data. To achieve the historymatch, the endpoint of the relative permeability was reduced to change the shape of the relative permeabilitycurves. Furthermore, initial water saturation for hydraulic fracture and natural fracture were changed duringhistory matching.
Result and DiscussionThe results of the fracture-modeling software are provided in Table 2 and 3 for MIP-4H and MIP-6H. Itshould be noted that even with good quality input data, the fracture properties in shale cannot be accuratelyestimated because of complex interactions of rock, stress, and natural fracture characteristics. Furthermore,the large fracture height growth was suspected because of low in-situ stress contrast between the payzone and its adjacent zones for both wells MIP-4H and MIP-6H. Fracture barriers are necessary in thestratigraphic section to control the fracture height. Consequently, the stimulation energy is conducted awayfrom the shale, which reduces the efficiency of well stimulation and causes the induced fractures to intersectany nearby water-bearing zone. As it can be seen in Figures 7, 8, 9, and 10, some sections of both horizontalwells are out of the pay zone, and there is variation in ISIP along the horizontal length for both wells.Therefore, it is very likely that some of the stages are non-contributing. Furthermore, Gray Mudstone andOrganic Mudstone facies are more ductile due to higher clay content. As it is seen in Figure 11, GrayMudstone is more abundant at the top of the pay zone, and Organic Mudstone is more abundant at thebottom of the pay zone for MIP-4H.
14 SPE-191778-18ERM-MS
Table 2—Hydraulic Fracture Properties for MIP-6H
Table 3—Hydraulic Fracture Properties for MIP-4H
For Case 1, non-fractured reservoir, the history match was obtained by adjusting the fracture half-length.The fracture half-length and fracture conductivity predicted for both of the wells (MIP-4H and MIP-6H)by P3D fracture model matches fracture half-length and fracture conductivity obtained from reservoirsimulation. The values of the hydraulic fracture half-length acquired from history matching for case 1 forboth wells are provided in Tables 4. Figure 18 show Production history matching for Wells MIP-6H &MIP-4H.
SPE-191778-18ERM-MS 15
Table 4—Hydraulic Fracture Half-length for MIP-6H & MIP-4H
Figure 18—Production History matching for Wells MIP-6H & MIP-4H
Case 2, naturally fractured reservoirs, the history match was obtained by adjusting the fracture half-length. The fracture half-length and fracture conductivity predicted for both of the wells (MIP-4H andMIP-6H) by P3D fracture model resulted in significantly higher production than observed from the fielddata. Figure 19 illustrates the match between the simulation results and the actual field production data fromwell MIP-4H and MIP-6H for 1473 days. Fracture half-lengths predicted from P3D model are higher thanthose predicted by the production history matching for a naturally-fractured reservoir.
Figure 20 illustrates the final match between the simulation results and the field water flow rates forMIP-4H and MIP-6H wells. History matching was achieved by reducing initial water saturation from 100%to 60% for hydraulic fracture and natural fracture. Additionally, the endpoint of the relative permeability towater was reduced from 1 to 0.8 for hydraulic fracture and natural fracture.
Table 5—Hydraulic Fracture Half-length for MIP-6H & MIP-4H
16 SPE-191778-18ERM-MS
Figure 19—Production History matching for Wells MIP-6H & MIP-4H
Figure 20—Production History matching for water rate Wells MIP-6H & MIP-4H
Figure 21 compares the cumulative production, by the model, for well MIP-6H in naturally fracturedreservoirs and non-fractured reservoirs. According to Figure 21, non-fractured reservoirs have highercumulative production than naturally fractured reservoirs.
Figure 21—Cumulative gas production for Well MIP-6H in naturally fractured reservoirs and non-fractured reservoir.
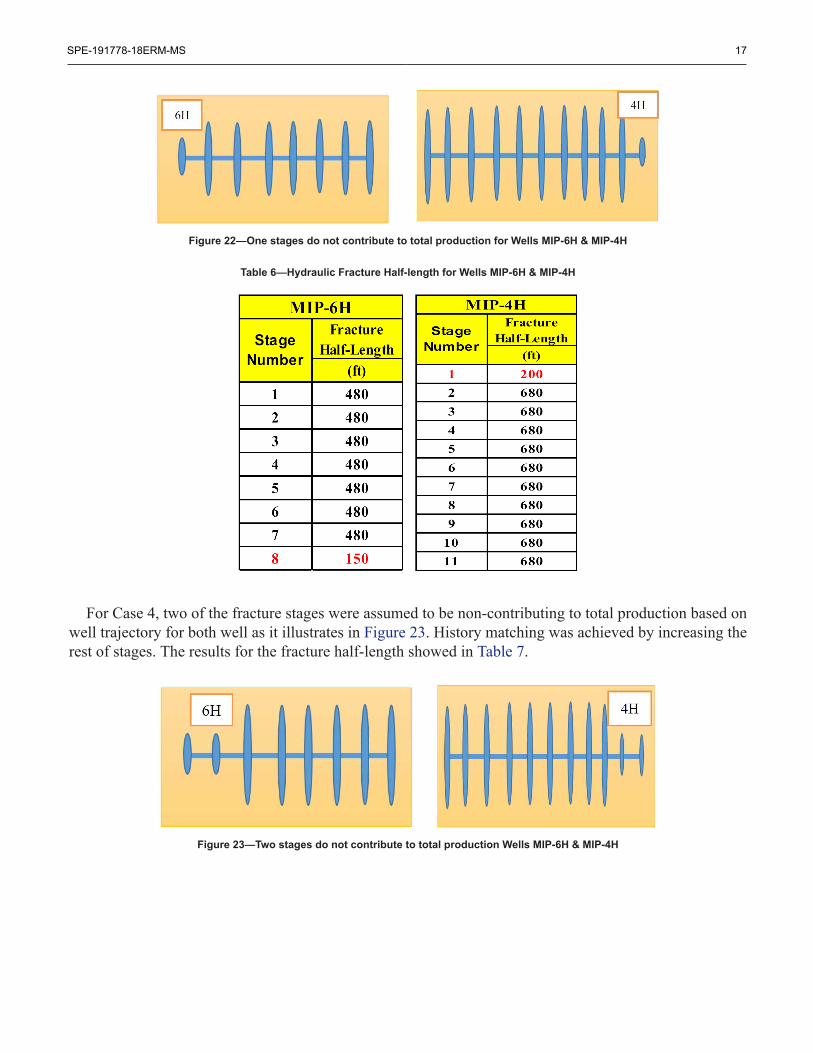
For Case 3, one of the fracture stages were assumed to be non-contributing to total production based onwell trajectory for both wells as it seen in Figure 22. History matching was achieved by increasing the restof the stages. The results for the fracture half-length showed in the Table 6.
SPE-191778-18ERM-MS 17
Figure 22—One stages do not contribute to total production for Wells MIP-6H & MIP-4H
Table 6—Hydraulic Fracture Half-length for Wells MIP-6H & MIP-4H
For Case 4, two of the fracture stages were assumed to be non-contributing to total production based onwell trajectory for both well as it illustrates in Figure 23. History matching was achieved by increasing therest of stages. The results for the fracture half-length showed in Table 7.
Figure 23—Two stages do not contribute to total production Wells MIP-6H & MIP-4H
18 SPE-191778-18ERM-MS
Table 7—Hydraulic Fracture Half-length for Wells MIP-6H & MIP-4H
Conclusion1. Low in-situ stress contrast between the pay zone and its adjacent zones for both well (MIP-4H and
MIP-6H) indicated that fracture stimulation was primarily focused above and below the MarcellusShale, which makes some of the stages non-contributing to total production. Furthermore, MIP-4Hand MIP-6H produce water which is entering the shale formation from adjacent stratigraphic due tothe height of the fracture out of the pay zone.
2. Variation of instantaneous shut-in pressure (ISIP) along the horizontal well length for both of the wells(MIP-4H and MIP-6H) impacted the hydraulic fracture propagation. The higher instantaneous shut-in pressure (ISIP) and the higher the clay content, it becomes more difficult to propagate the hydraulicfracture. Furthermore, Gray Mudstone and Organic Mudstone facies are more ductile due to higherclay content. Gray Mudstone and Organic Mudstone facies are more abundant at the top and bottom ofthe pay zone for MIP-4. Therefore, it can be concluded that various fracture stages do not contributeuniformly to total production.
3. Fracture half-length and fracture conductivity predicted for both of the wells (MIP-4H and MIP-6H)by P3D model match fracture half-length and fracture conductivity in the non-fractured reservoir.However, they do not match in the naturally-fractured reservoir.
4. Hydraulic fracturing propagation in the presence of natural fractures will cause the reduction ofhydraulic fracture properties (fracture half-length and fracture conductivity) due to the migration of theinjection fluid. Therefore, it can be concluded that various fracture stages do not contribute uniformlyto the total production.
5. It is essential to determine natural fracture distribution along a horizontal well length which canimprove the hydraulic fracture treatment design.
ReferenceBaihly, J. D., Altman, R. M., Malpani, R., & Luo, F. (2010, January 1). Shale Gas Production Decline Trend Comparison
over Time and Basins. Society of Petroleum Engineers.Boosari, S. Sina Hosseini, Mohammad O. Eshkalak, and Umut Aybar. 2015. "The Effect of Desorption-Induced Porosity-
Permeability Changes and Geomechanics on Production from U.S. Shale Gas Formations." 49th U.S. Rock Mechanics/Geomechanics Symposium.
Boosari, S. S. H., Aybar, U., & Eshkalak, M. O. (2016). Unconventional resource's production under desorption-inducedeffects. Petroleum, 2(2), 148–155.
SPE-191778-18ERM-MS 19
Cipolla CL Weng X, Mack M, et al. Integrating microseismic mapping and complex fracture model to characterize fracturecomplexity. In: SPE hydraulic fracturing technology conference, The Woodlands, Texas, USA. 2011.
Cipolla, C.L., Warpinski, N.R., Mayerhofefr, M.J., and Lolon, E.P., and Vincent, M.C.2008. The Relationship betweenFracture Complexity, Reservoir Properties, and Fracture Treatment design. Presented at the 2008 SPE TechnicalConference and Exhibition. Denver, Colorado, USA, 21-24 September. SPE 115769-MS.
Chorn, L., N. Stegent, and J. Yarus, 2014, Optimizing Lateral Lengths in Horizontal Wells for a Heterogeneous ShalePlay: Presented at the SPE/EAGE European Unconventional Resources Conference and Exhibition
Civan, F., 2018a. Effect of stress shock and Pressurization/Depressurization Hysteresis on Petrophysical Properties ofNaturally-Fractured Reservoir Formations, paper SPE-190081-MS, the SPE Western Regional Meeting held in GardenGrove, California, USA, 22-27 April 2018.
Dong, J-J.; Hsu, J-Y.; Wu, W-J.; Shimamoto, T.; Hung, J-H.; Yeh, E-C.; Wu, Y-H.; Sone, H., 2010. of the permeabilityand porosity of sandstone and TCDP Hole-A, International Journal of Rock Mechanics and Mining Sciences, Vol.47(7), pp.1141–1157.
Elsaig, M. Aminian, K., Ameri, S., and Zamirian, M. 2016. Accurate Evaluation of Marcellus Shale PetrophysiclProperties.presented at the SPE Eastern Regional Meeting, Canton, Ohio, USA, 13-15 September 2016. SPE-184042-MS.
El sgher, M., Aminian, K., Ameri, S. 2018. The Impact of the Net Stress on Gas Recovery from the Marcellus Shale. SPEEastern Regional Meeting to be held 7-11 October 2018 in Pittsburgh, PA, USA. SPE-191799-MS.
El sgher, M., Aminian, K., Ameri, S. 2018. Geomechanical Impact on Gas Recovery from Marcellus Shale. Presented atthe SPE Western Regional Meeting held in Garden Grove, California, USA, 22-27 April 2018. SPE-190054-MS.
El sgher, M., Aminian, K., Ameri, S. 2018. The Impact of Stress on Propped Fracture Conductivity and Gas Recoveryin Marcellus Shale. Presented at the SPE Hydraulic Fracturing Technology Conference held in The Woodlands, TX,USA, 23-25 January. SPE-191799191799-MS.
El sgher, M., Aminian, K., Ameri, S. 2017. The Impact of the Hydraulic Fracture Properties on the Gas Recovery fromMarcellus Shale. presented at the 2017 SPE Western Regional Meeting held in Bakersfield, California, USA, 23 AprilSPE-185628-MS.
Fisher, M., Heinze, J., Harris, C., 2004. Optimizing horizontal completion techniques in the Barnett shale usingmicroseismic fracture mapping. In: SPE Annual Technical Conference and Exhibition.
Fisher, K. and Warpinski, N., Pinnacle- A Halliburton Service, Hydraulic Fracture-Height Growth: Real Data, Societyof Petroleum Engineers Paper, SPE 145949, 201.
Fredd, C.N., McConnell S.B., Boney C.L. and England K.W. 2001. Experimental Study of Fracture Conductivity forWater-Fracturing and Conventional Fracturing Application. SPE J. 6 (3): 288–298. SPE-74138-PA
Heller, R., Vermylen, J., Zoback, M., 2014. Experimental Investigation of Matrix Permeability of Gas Shales, AAPG Bull.,98 (5), 975–995.
Lian, P., & Cheng, L. 2012. The Characteristics of Relative Permeability Curves in Naturally Fractured CarbonateReservoirs. Society of Petroleum Engineers.
Molenaar, M., Hill, D., and Koelman, V. 2011. Downhole Tests Show Benefits of Distributed Acoustic Sensing Oil GasJ. 109 (1): 82–85.
Miller, C. et al.: "Evaluation of Production Log Data from Horizontal Wells Drilled in Organic Shales" paper SPE 144326presented at North American Unconventional Gas Conference and Exhibition, 2011.
McGinley, M., Zhu, D., Hill, A.D 2015. The effects of fracture orientation and anisotropy on hydraulic fractureconductivity in the Marcellus Shale. Presented at the SPE Annual Technical Conference and Exhibition, Houston,Texas, USA, 28–30 September 2015. SPE-174870-MS.
Suarez-Rivera, R., Deenadayalu, C., Gathogo, P., Chertov, M. and Kunjir, R. 2011. Improving Horizontal Completionson Heterogeneous Tight Shales. Paper CSUG/SPE 146998 presented at the Canadian Unconventional ResourcesConference, Calgary, Alberta, Canada, 15- 17 November.
Serajian, V. and Ghassemi, A. 2011. Hydraulic Fracture Initiation from a Wellbore in Transversely Isotropic Rock. PaperARMA 11-201 presented at the 45th U Rock Mechanics/Geomechanics symposium, San Francisco, Califrnia,usa,26-29- june.
Spain, D.R., I. Gil, H. Sebastian, P.S. Smith, J. Wampler, S. Cadwallader, M. Graff. 2015. Geo-Engineered completionoptimization: an integrated, multidisciplinary approach to improve stimulation efficiency in unconventional shalereservoirs. SPE 172921. Presented at the SPE Middle East Unconventional resources conference and exhibition heldin Muscat, Oman, 26-28 January.
Shi, J-Q. and Durucan, S., 2016. Near-exponential relationship between effective stress and permeability of porous rocksrevealed in Gangi's phenomenological models and application to gas shales, International Journal of Coal Geology154–155, 111–122.
20 SPE-191778-18ERM-MS
Slocombe, R., A. Acock, K. Fisher, A. Viswanathan, C. Chadwick, R. Reischman, and E. Wigger, 2013, Eagle Fordcompletion optimization using horizontal log data: Presented at the Annual Technical Conference and Exhibition. NewOrleans, Louisiana, USA 30 September-2 October, 2013SPE-166242-MS.
Stegent, N. A., Wagner, A. L., Mullen, J. and Borstmayer, R. E. 2010. Engineering a Successful Fracture-SimulationTreatment in the Eagle Ford Shale. presented at the SPE Tight Gas Completion Conference held in San Antonio, Texas,USA, 2–3 November. SPE-136183-MS
Paronish, Thomas J., Shuvajit Bhattacharya, and Timothy Carr. Integrated Geologic Analysis from Two Marcellus ShaleScience Wells in Northeastern West Virginia. Poster presentation given at AAPG 2016 Annual Convention andExhibition, Calgary, Alberta, Canada, June 19-22, 2016.
Ugueto, G. A., R.T. Huckabee, M.M. Molenaar, et al. 2016. Perforation cluster efficiency of cemented plug and perflimited entry completions: insights from fiber optics diagonstics. SPE-179124-MS. Presented at the SPE HydraulicFracturing Technology Conference held in The Woodlands, Texas, 9-11 February.
Wutherich, K. D., and Walker, K. J., 2012. Designing Completions in Horizontal Shale Gas Wells – Perforation Strategies.Paper SPE 155485 presented at the Americas Unconventional Resources Conference, Pittsburgh, Pennsylvania, 5–7 June.
Waters G., H. J. 2006. Use of Horizontal Well Image Tools To Optimize Barnett Shale Reservoir Exploitation. Paper SPE103202. Presented at the SPE Annual Technical Conference and Exhibition, San Antonio, Texas, September 24-27.
Walsh, J.B. 1981. Effect of pore pressure and confining pressure on fracture permeability. International Journal of RockMechanics and Mining Sciences& Geomechanics Abstracts 18 (5): 429–435.
Zamirian. M, 2015. New Experimental Approach to Measure Petrophysical Properties of Organic-Rich Shales. Ph.D.Dissertation, West Virginia University, Morgantown, WV (2015).