USMS 020988 Gas Condensate Flow Through Chokes M.E. Osman, United Arab Emirates U.; M.E. Dokla, United Arab Emira tes U. Copyright 1990 Society of Petroleum Engineers This manuscript was provided to the S9ciety of Petroleum Engineers for distribution and possible pUblication in an SPE journal. The material is subject to correction by the author(s). Permission to copy is restricted to an abstract of not more than 300 words. Write SPE Book Order Dept., Library Technician, P.O. Box 833836, Richardson, TX 75083-3836 U.S.A. Telex 730989 SPEDAL.
Transcript
USMS020988 Gas Condensate Flow Through Chokes
M.E. Osman, United Arab Emirates U.; M.E. Dokla, UnitedArab Emira tes U.
Copyright 1990 Society of Petroleum EngineersThis manuscript was provided to the S9ciety of Petroleum Engineers for distributionand possible pUblication in an SPE journal. The material is subject to correctionby the author(s). Permission to copy is restricted to an abstract of not more than300 words. Write SPE Book Order Dept., Library Technician, P.O. Box 833836,Richardson, TX 75083-3836 U.S.A. Telex 730989 SPEDAL.
.R'~G'lJ
APR 2 3 1990
SPEPUBLICATIONS
ABSTRACT
UNSOLICITEDGAS CONDENSATE FLOW THROUGH CHO~ES
ByMohammed E. Osman and Mahmoud E. Dakla
University of United Arab Emirates
In this study, field data from a gas condensate reservoir located in the MiddleEast are used to develop some empiricial correlations that describe thebehaviour of gas condensate flow through chokes. The data cover wide rangesof flow rates and choke sizes. Four forms of correlation are checked againstdata. One of the forms is to correlate choke upstream pressure with liquidproduction rate, gas liquid ratio and choke size. The second form is developedby using gas production rate instead of the liquid rate in the previous form.The other two forms are developed by using the pressure drop across the chokeinstead of upstream pressure. These correlations are presented in graphicalforms. Five error parameters are used to check accuracy of the different forms.Namely: root mean square error, mean absolute error, simple mean error, meanpercentage absolute error and mean percentage error. It was found that thecorrelation is most accurate when using pressure drop data instead of chokeupstream pressure in the correlation. The importance of the developedcorrelations lies in the fact that correlations for gas-condensate systems are notavailable. Also such correlations will help the production engineer to a greatextent in selecting choke sizes to control production of gas-condensate wells andpredicting the performance of flowing wells under different conditions.
INTRODUCTION
There are two surface conditions under which a flowing well is produced, eitherusing a choke or no restrictions at all. The majority of flowing wells areproduced against chokes. The main reasons of using chokes are to control flowrate and thus to produce reservoirs at the most efficient rate and to preventwater and/or gas coning and sand problems. In the critical-flow region, themass flow rate becomes independent of pressure drop across the chokes.Therefore, chokes are also used to isolate the reservoir from pressuredisturbances by surface production facilities. The problem of multiphase flowthrough chokes has not been satisfactorily solved for all cases. Most solutionsare offered only for the case of critical flow. Surbey et all discussed theapplications of multiple-orifice valve chokes in critical flow conditions. Wallis2
developed a correlation to predict the sonic velocity in a two-phasehomogeneous system. A different correlation was developed by Fortunati3
under no-slip condition between different phases. Fortunati3 also proposed a
SPE 2 0988
-2-
correlation for flow rates under critical flow conditions. Ashford and Pierce4
developed an equation to predict the flow rates. They stated that uncertaintyis introduced in their model due to the difficulty of measuring downstreampressure precisely. Their work was extended by Sachdeva' et al to develop acorrelation to predict the critical pressure ratio. Surbey6 et al developed a newcorrelation to predict performance of multiple-orifice valve chokes undercritical flow conditions. They used experimental data collected for ahigh-pressure air/water system. Many investigators offered empiricalcorrelations based on field and laboratory data. One of the early chokecorrelations is that developed by Gilbert7 using production data of ten sectionfield in California. This was followed by the theoretical correlation, developedby RosS. Poettmann and Beck9 converted the Ros correlation to oil field unitsand reduced it to a graphical form. Omana10 used data obtained from TigreLagon field in Louisiana to check the existing correlations and to develop a newone. The data were gathered from a natural gas-water system using 4 to 14/64in choke sizes, upto 800 bpd flow rate, 400 to 1000 psig upstream pressure.The limited range of data used in his correlation are the main reasons of itslimited use. Achong ll derived a choke correlation similar to that of Gilbert foruse in the Lake Maracaibo field in Venezuela. He presented his correlation in anomograph form. Similar correlations were developed by Boxende1l12 andPilehrari13.
Several empirical equations were developed using field data. None of thesecorrelations is based on data from gas-condensate systems. The productionengineer should be careful in using such correlations as they should be appliedwithin the ranges of fluid properties, flow rates, upstream pressures, gas liquidratios and choke sizes of field data from which they were developed. In thisstudy eightyseven data points of gas condensate flow through chokes of eightdifferent wells producing from a gas-condensate field located in the Middle Eastwere used to develop the best correlation that will describe the flow behaviourof gas condensate flow through chokes. The data cover wide ranges of chokesizes, flow rates and fluid properties.
Multiohase Choke Flow
Th~ general form of multiphase flow through chokes can be written as:
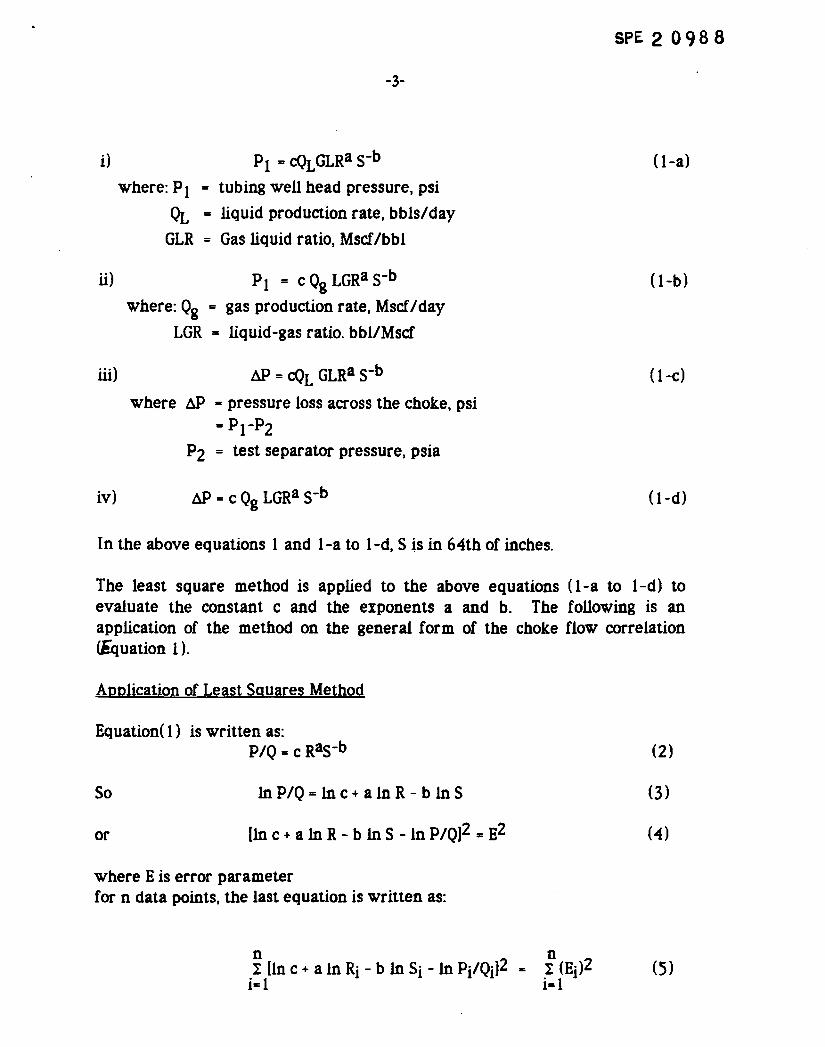
P .. cQRa S-b (0
where c is a constant and a and b are exponents to be determined from fielddata. The above equation takes one of the following four forms:
SPE 2 0988
-3-
i) PI ... COLGLRa S-b
where: PI'" tubing well head pressure, psi
Or. = liquid production rate, bbls/day
GLR = Gas liquid ratio, Mscf/bbl
ii) PI = c Qg LGRa S-b
where: Qg = gas production rate, Mscf/day
LGR = liquid-gas ratio. bbl/Mscf
iii) M> = COL GLRa S-b
where M> - pressure loss across the choke, psi
- PI-P2P2 = test separator pressure, psia
iv) M> = c Qg LGRa S-b
In the above equations I and I-a to I-d, S is in 64th of inches.
( I-a)
(I-b)
( I-c)
(I-d)
The least square method is applied to the above equations (I-a to I-d) toevaluate the constant c and the exponents a and b. The following is anapplication of the method on the general form of the choke flow correlation(Equation O.
Application of Least Squares Method
Equation( I) is written as:P/Q ... c RaS-b (2)
So
or
In PIQ = In c + a In R - binS
[In c + a In R - binS - In PIQ)2 = E2
(3)
(4)
where E is error parameterfor n data points, the last equation is written as:
n nI [In c + a In Ri - b In Si - In Pi/Qi)2.. I (Ei)2 (5)
i... 1 i-I
SPE 2 0988
-<f-
as the right hand side of eq. (5) is minimum, the differentials of the lefthandside of the equation with respect to c, a & b are equal to zeros. Thus
n2 I [in c + a in Ri - b in Si -in (Pi/Qi» - 0 (6-a)
i=l
n2I ([in c + a in Ri - b in Srin Pi/Qi lin Ri) = 0 (6-b)
i-I
n2I ([inc + a In Ri - bin Si-in PlQi ) lnSi) - 0 (6-c)
i= 1deviding the equations (6-a to 6-c) by n to get the average values of their termsas:
in c + a in R - binS - in (P/Q) - 0 (7-a)
in c in R + a ( in R)2 -b in S 1nR in (P/Q)in R - 0 (7-b)
in c in S + a in R in S -b (in S)2_in P/Q in S - 0 (7-c)
Equations 7-a to 7-c are then solved to obtain values of c, a and b. The sameapproach is applicable to different forms of multiphase flow through chokes(equation I-a to I-d).
Evaluation of Multiphase Choke Flow
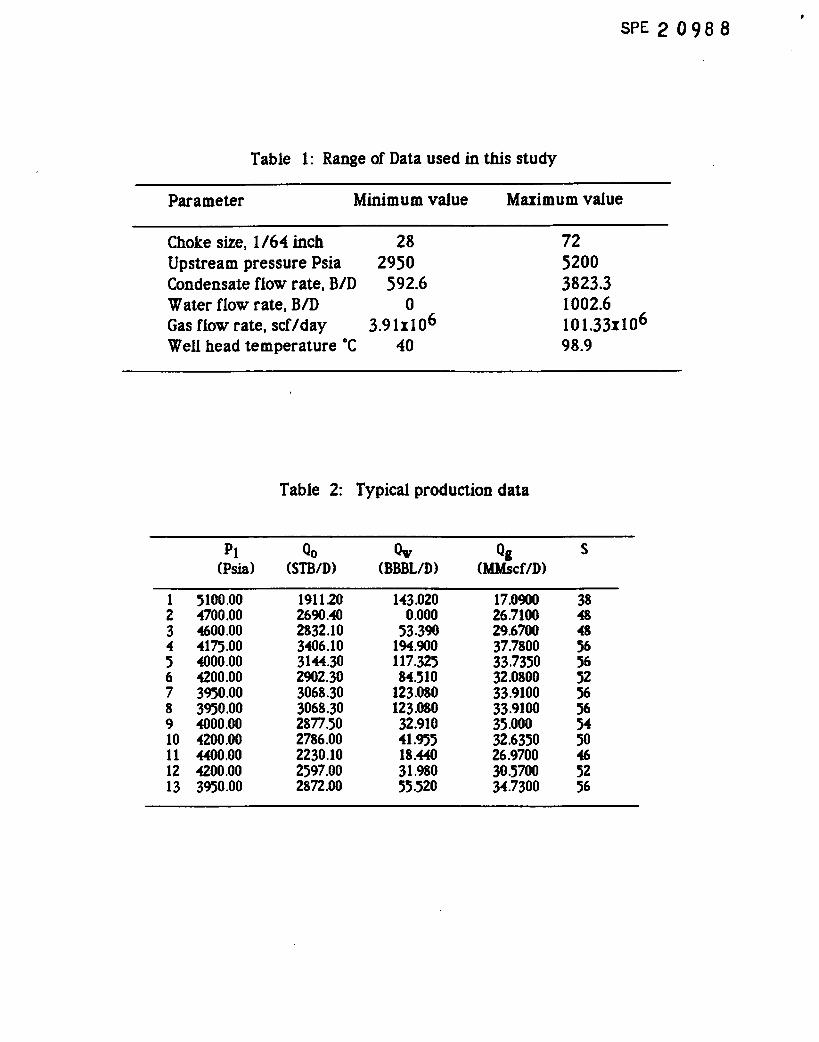
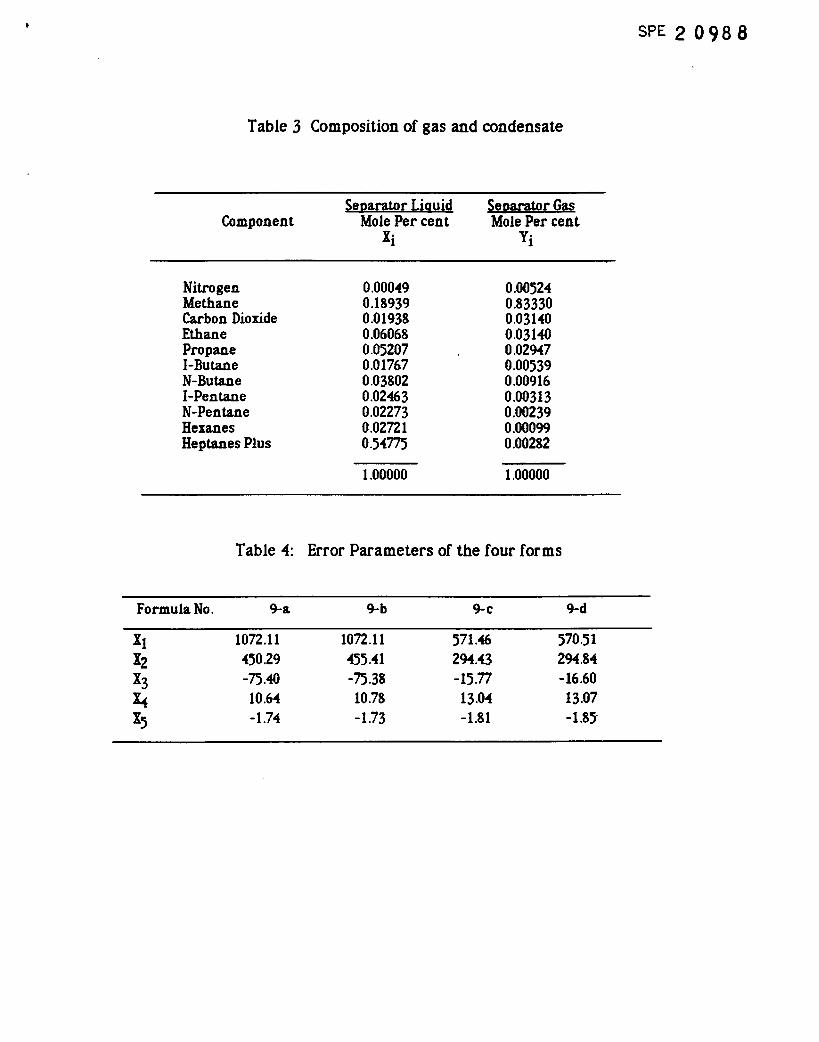
The four forms of choke flow equation (eqns. I-a to I-d) were evaluated usingfield data. The data were collected from eight different wells producing from agas condensate reservoir located in the Middle East. Table 1 shows a sampleof field data gathered from one of the wells. Also Table 2 shows thecomposition of both gas and condensate for the purpose of calculations, thewater production is added to the oil production to obtain the liquid productionrate from the well. The total number of data points used in this study is eightyseven. They were used to evaluate different constants and exponenets ofEquation 7-a to 7-c for different forms of equation 1 (Equation I-a to I-d).
SPE 2 098 8
Thus
lnc + 2.2909 a - 3.8771 b - 0.5527'" 0.0 (8-a)
2.2908 In c + 5.2975 a - 8.9073 b - 1.2398 = 0.0 (8-b)
3.8772 In c + 8.9073 a - 15.0962 b - 2.0335 - 0.0 (8-c)
Solving equations 8-a to 8-c give values of a, b and cas:a ... 0.4344, b ... 1.8478 and c ... 829.7
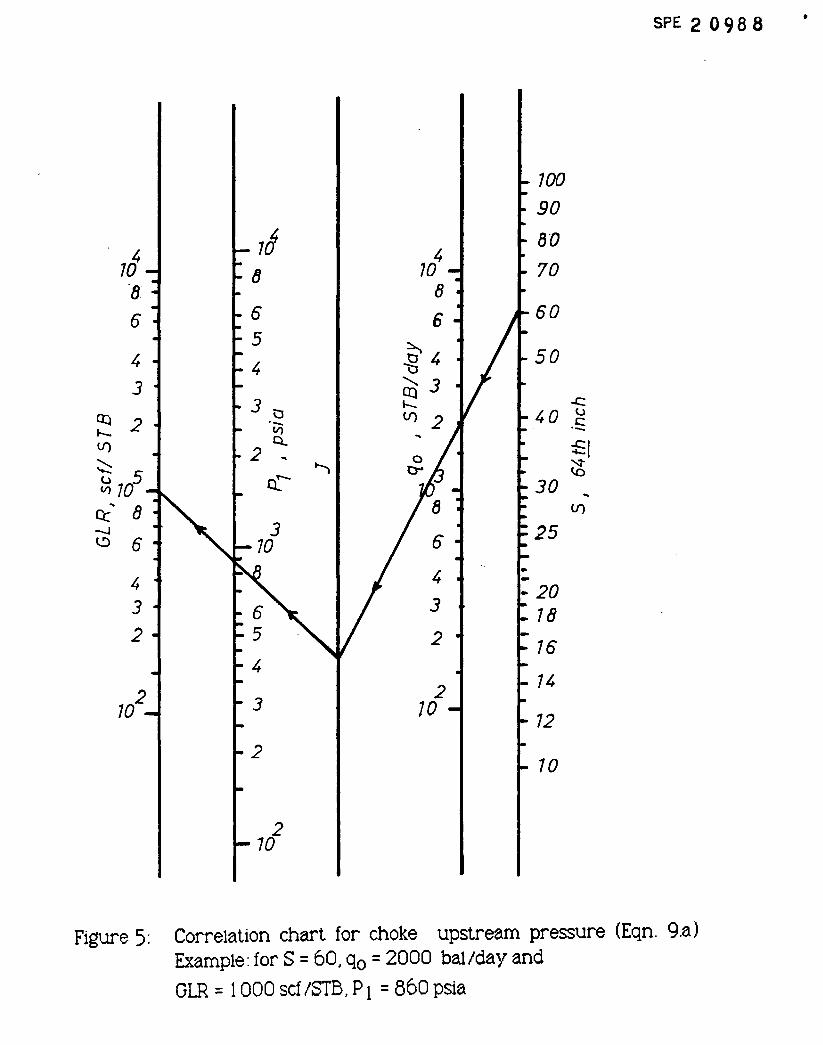
Thus, the first form of equation 1 for gas condensate can be written as:
(9-a)
Similarly, the other three forms of equations (l) are evaluated using the samefield data and least square method. These forms can be written as:
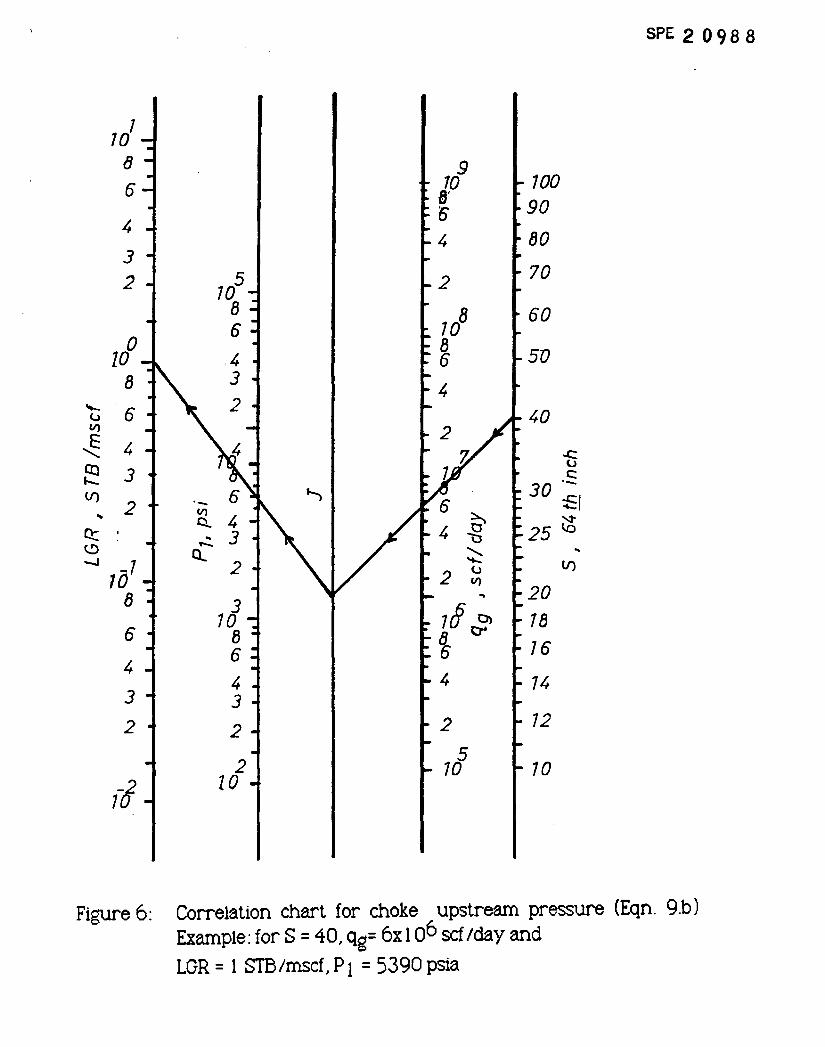
PI 767.2 Qg LGRO.5598/S1.8298
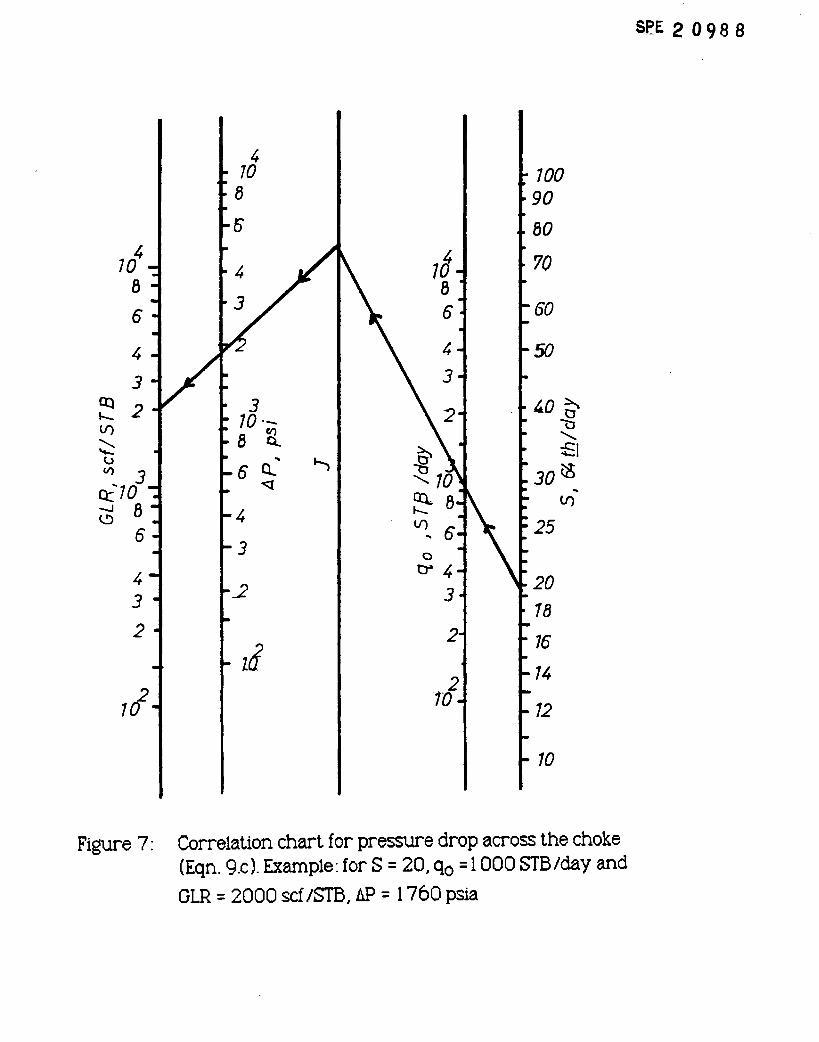
~P 310.01 QL GLRO.5919 IS 1.8626
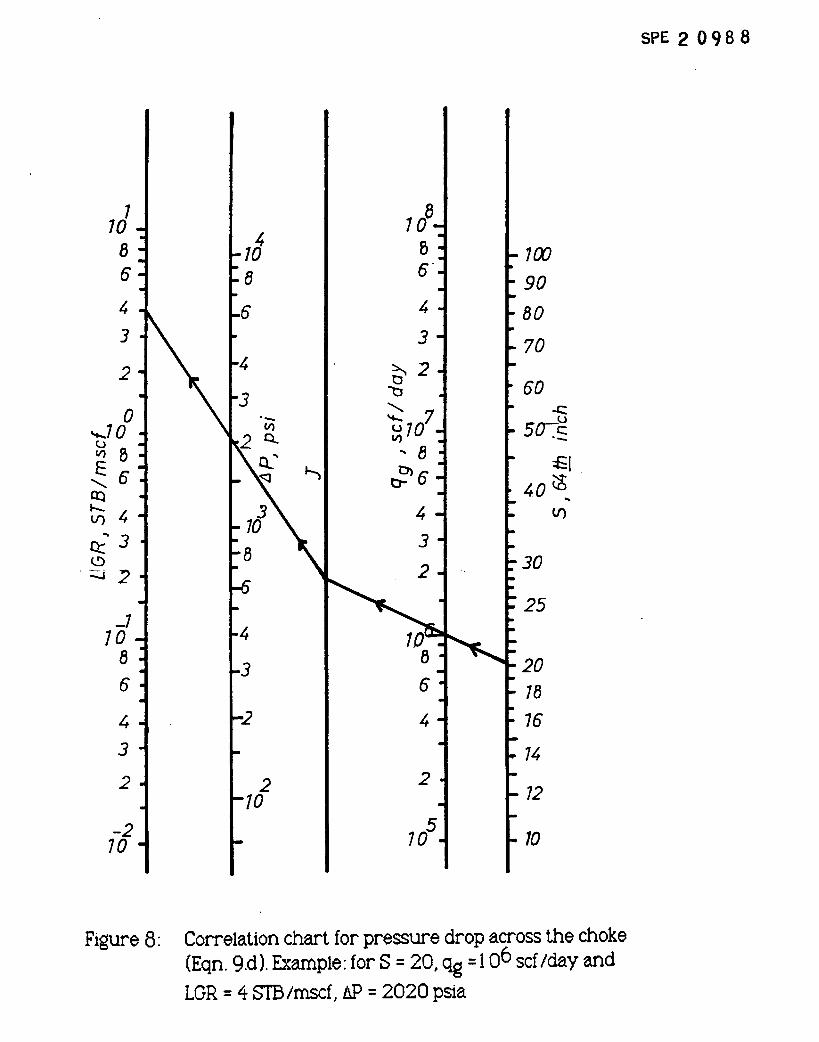
~ - 302 Qg LGR0.4038 /S1.8587
Critical evaluation of gas-condensate flow Correlation
(9-b)
(9-c)
t9-d)
The production engineer would be confused and a question would be raised,
which form of equation 9 should be used? To avoid such confusion, further
study was carried out to evaluate the accuracy of each form of equation 9 using
five different error parameters. These error parameters are as follows:
XI - root mean square errorn
- (lIn I y2i )0.5i-I
(10-a)
SPE 2 0988
-6-
in
ill)
iv)
v)
~here;
X2 - mean absolute error
z: 1/n f lYili-I
X3 = simple mean error
- 1/nf Yii= I
X4 = mean percentage absolute error
so 100/n f I(Yi/Pact)!i= I
x5 - mean percentage error
(lO-b)
(lO-c)
(lO-d)
(lO-e)
Yi - Pact - Peal
Pact so actual WHP from field data, psia
Peal so calculated WHP for each formula, psia data point
i-data point
n - total number of data points
Equations 9-a to 9-d are evaluated using these error parameters represented
by equations (I O-a to IO-e). The final results are presented in Table 3. One can
conclude that eq. 9-c would fit best with the field data while eq. 9-d is the
second to the best. Thus equation 9-c is recommended to predict the pressure
drop across the choke. Both forms, 9-a and 9-b are expected to give the same
results in predicting well head pressures.
SPE 2 098 8-7-
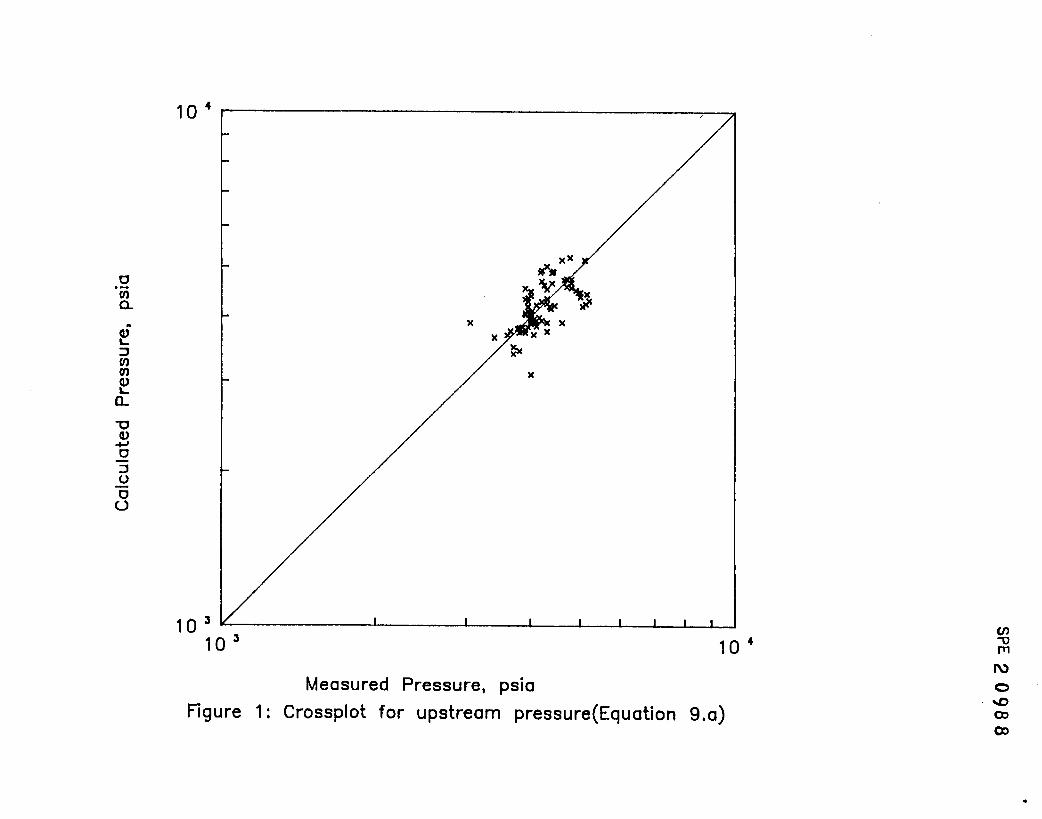
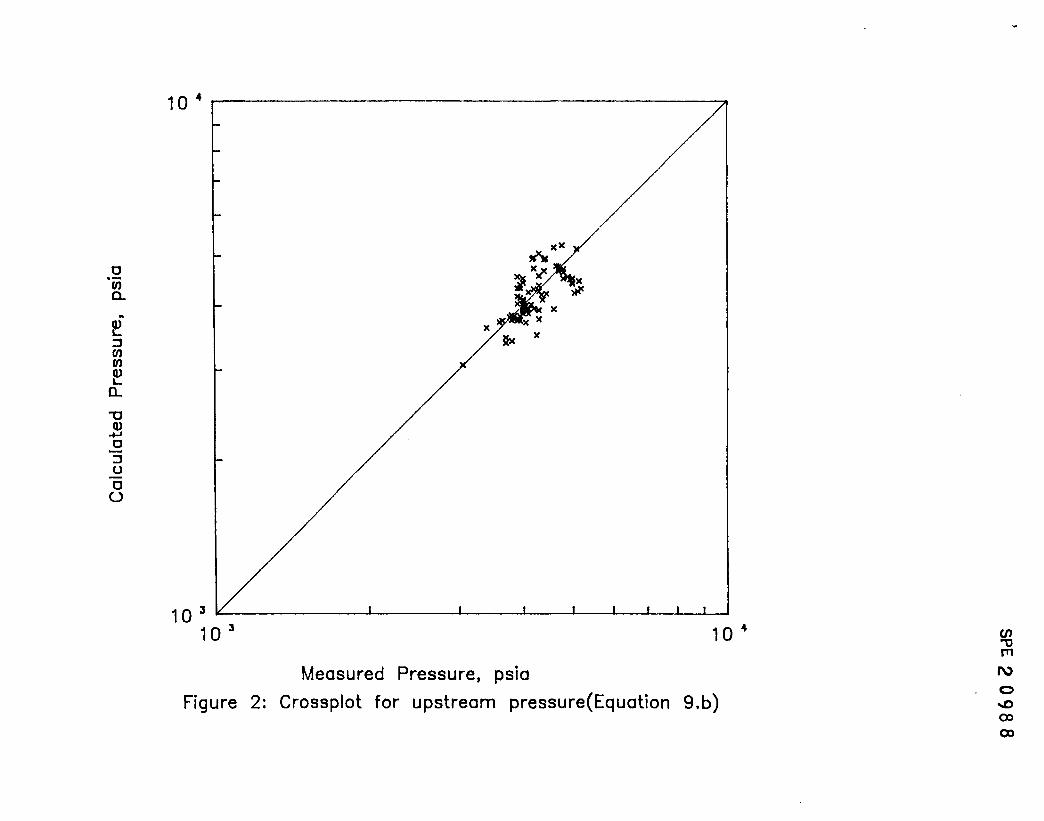
Crossplots: The crossplots of measured upstream pressure versus the estimated
values using equations 9.a and 9.b are presented in Figures I and 2 respectively.
Most of plotted points fall very close to the perfect correlation of 4S° line.
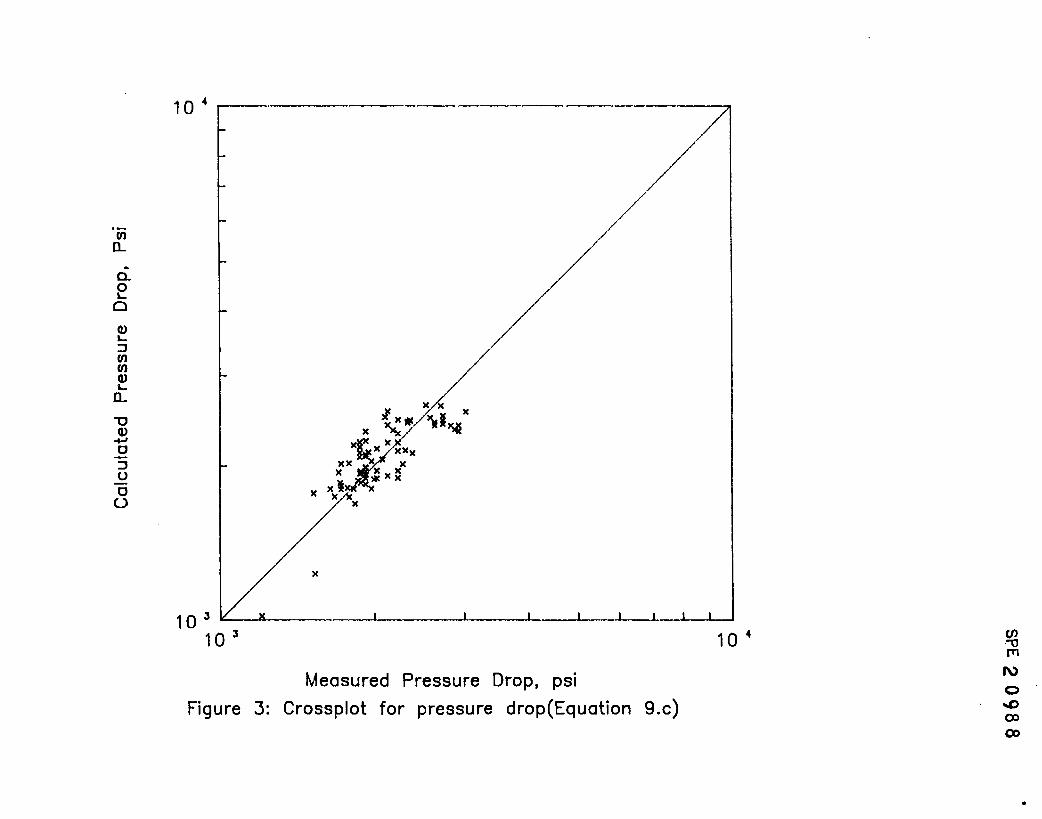
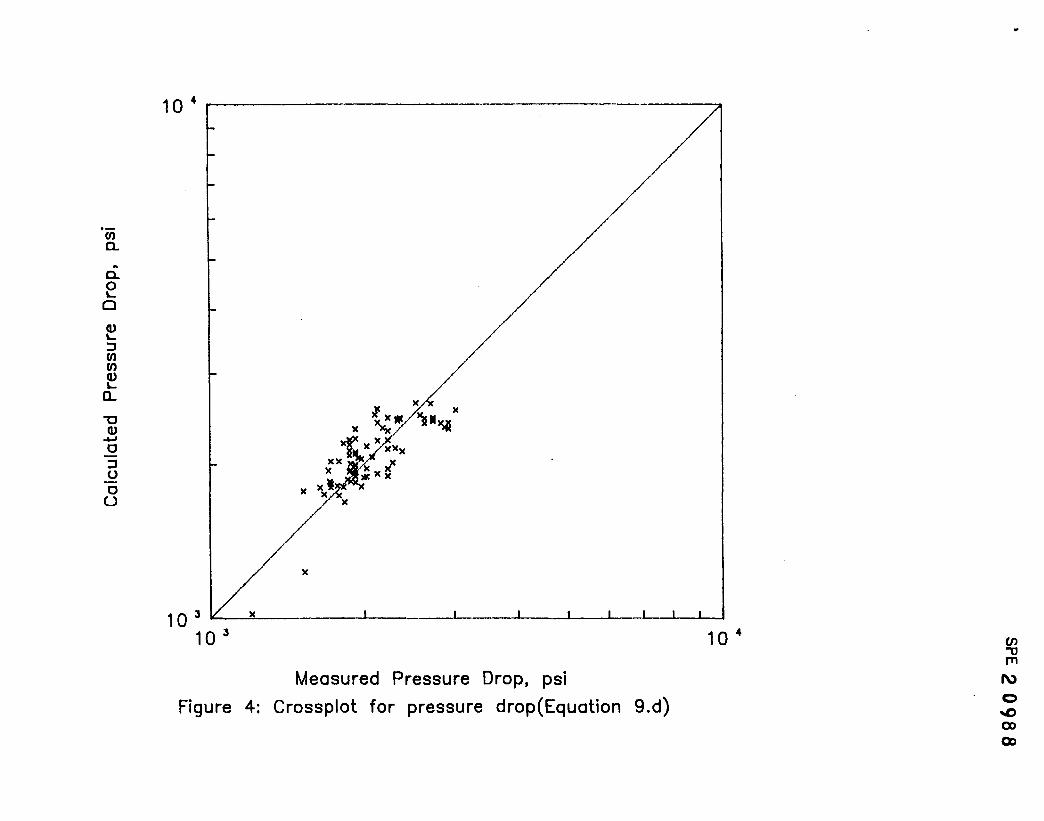
Similar crossplots for pressure drop across the choke are presented in Figures 3and 4 for the purpose of evaluating the performance of equations 9.c and 9.d.
Again, most of plotted points fall very close to the perfect correlation of the
4S°line.
Graphical presentation of gas-condensate flow correlation
The four forms of equation 9 (9-a t09-d) are presented by the nomographshown in in Figures S to 8 respectively. These figures are considered as designcharts. Such charts would help the production engineer to monitor gascondensate production from gas-condensate reservoirs. These charts are usedas follows:
,a- Connect choke size to the flow rate (liquid or gas rate) and extend to
intersect with the reference line ].
b- From the intersection with the reference line] connect to the value of (LGRor GLR) and at the intersection with the pressure axis read the upstreampressure or pressure drop across the choke.
Knowing any three of the four parameters (flow rate, choke size, GLR or LGR andwell head or pressure drop) the fourth parameter can be easily obtained fromthe design charts (Nomographs)
CONCLUSIONS
Data from some wells in a gas-condensate reservoir located in the Middle Eastwas analysed for the purpose of developing correlations to describe thegas-condensate flow through chokes. Several forms of correlation equationswere tested. Based on the data used in this study, the following conclusions aremade.
SPE 2 0988
-8-
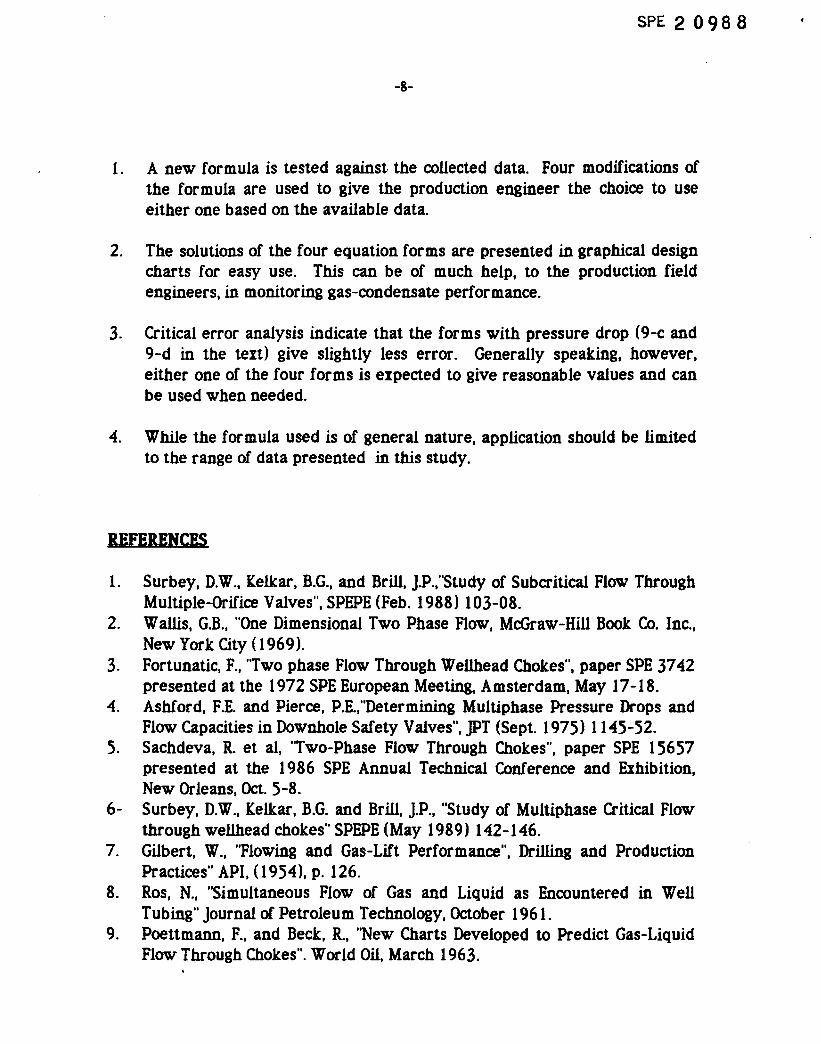
1. A new formula is tested against the collected data. Four modifications ofthe formula are used to give the production engineer the choice to useeither one based on the available data.
2. The solutions of the four equation forms are presented in graphical designcharts for easy use. This can be of much help, to the production fieldengineers, in monitoring gas-condensate performance.
3. Critical error analysis indicate that the forms with pressure drop (9-c and9-d in the text) give slightly less error. Generally speaking, however,either one of the four forms is expected to give reasonable values and canbe used when needed.
4. While the formula used is of general nature, application should be limitedto the range of data presented in this study.
REFERENCES
1. Surbey, D.W., [elkar, B.G., and Brill, j.P.,"Study of Subcritical Flow ThroughMUltiple-Orifice Valves", SPEPE (Feb. 1988) 103-08.
2. Wallis, G.B., "One Dimensional Two Phase Flow, McGraw-Hill Book Co. Inc.,New York City (1969).
3. Fortunatic, F., "Two phase Flow Through Wellhead Chokes", paper SPE 3742presented at the 1972 SPE European Meeting, Amsterdam, May 17-18.
4. Ashford, F.E. and Pierce, P.E.,"Determining Multiphase Pressure Drops andFlow Capacities in Downhole Safety Valves", JPT (Sept. 1975) 1145-52.
5. Sachdeva, R. et al, 'Two-Phase Flow Through Chokes", paper SPE 15657presented at the 1986 SPE Annual Technical Conference and Exhibition,New Orleans, Oct. 5-8.
6- Surbey, D.W., [elkar, B.G. and Brill, j.P., "StUdy of Multiphase Critical Flowthrough wellhead chokes" SPEPE (May 1989) 142-146.
7. Gilbert, W., "Flowing and Gas-Lift Performance", Drilling and ProductionPractices" API, (1954), p. 126.
8. Ros, N., "Simultaneous Flow of Gas and Liquid as Encountered in WellTUbing" Journal of Petroleum Technology, October 1961.
9. Poettmann, F., and Beck, R., "New Charts Developed to Predict Gas-LiquidFlow Through Chokes". World Oil, March 1963.
SPE 2 0988
-9-
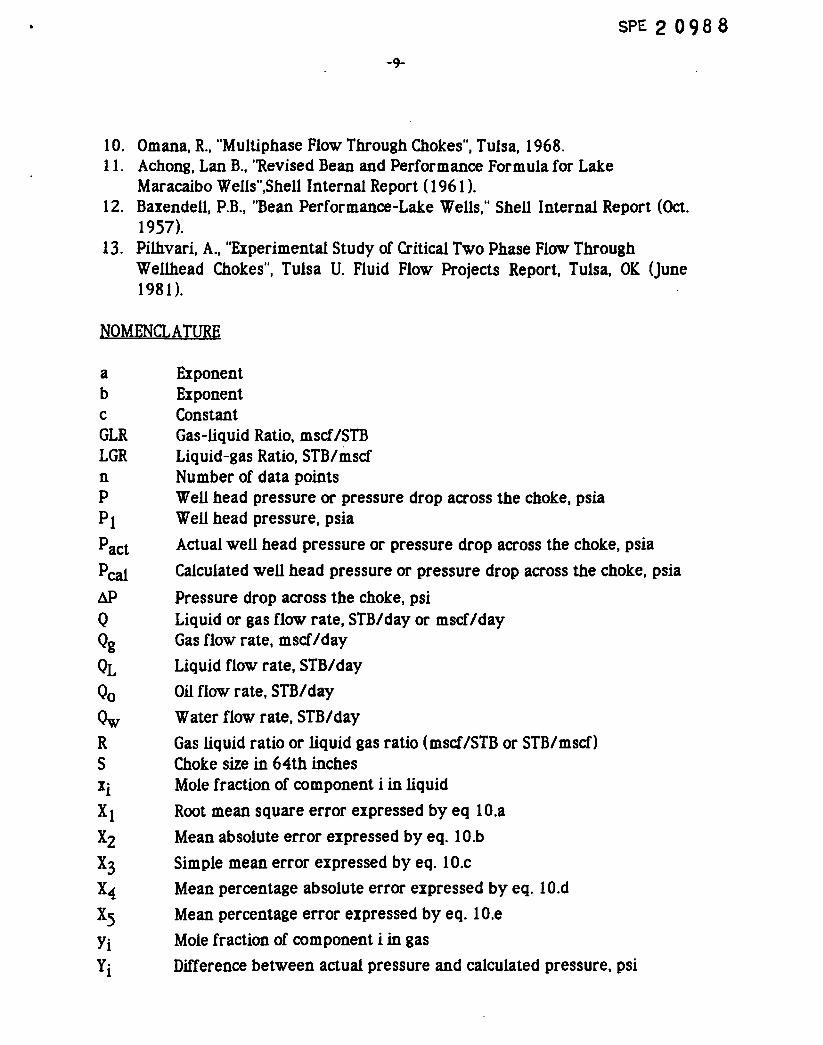
10. Omana, R., "Multiphase Flow Through Chokes", Tulsa, 1968.11. Achong, Lan B., ''Revised Bean and Performance Formula for Lake
1957).13. Pilhvari, A., "Experimental Study of Critical Two Phase Flow Through
Wellhead Chokes", Tulsa U. Fluid Flow Projects Report, Tulsa, OK (June1981).
NOMENCLATURE
a Exponentb Exponentc ConstantGLR Gas-liquid Ratio, mscf/STBLGR Liquid-gas Ratio, STB/mscfn Number of data pointsP Well head pressure or pressure drop across the choke, psiaPI Well head pressure, psia
Pact Actual well head pressure or pressure drop across the choke, psia
Peal Calculated well head pressure or pressure drop across the choke, psia
aP Pressure drop across the choke, psiQ Liquid or gas flow rate, STB/day or mscf/dayQg Gas flow rate, mscf/day
OL Liquid flow rate, STB/day
Qo Oil flow rate, STB/day
Ow Water flow rate, STB/day
R Gas liquid ratio or liquid gas ratio (mscf/STB or STB/mscf)5 Choke size in 64th inchesXi Mole fraction of component i in liquid
X1 Root mean square error expressed by eq IO.a
X2 Mean absolute error expressed byeq. IO.b
X3 Simple mean error expressed byeq. IO.c
X4 Mean percentage absolute error expressed by eq. lO.d
X5 Mean percentage error expressed by eq. IO.e
Yi Mole fraction of component i in gas
Yi Difference between actual pressure and calculated pressure, psi
SPE 2 0988
Table 1: Range of Data used in this study
Parameter Minimum value Maximum value
Choke size, 1/64 inchUpstream pressure PsiaCondensate flow rate, B/DWater flow rate, B/DGas flow rate, set/dayWell head temperature ·C