SPE Distinguished Lecturer Program
The SPE Distinguished Lecturer Program is funded principally through a grant from the SPE Foundation.
The society gratefully acknowledges the companies that support this program by allowing their professionals to participate as lecturers.
Special thanks to the American Institute of Mining, Metallurgical, and Petroleum Engineers (AIME) for its contribution to the program.
Society of Petroleum Engineers Distinguished Lecturer Programwww.spe.org/dl
Injectivity Impairment and Well & Water Management
Prof. Pavel Bedrikovetsky
Australian School of Petroleum, U of Adelaide
PETROBRAS, Brazil
Society of Petroleum Engineers Distinguished Lecturer Programwww.spe.org/dl
1
ContentsIntroduction1. Formulation of the problem
2. Deep bed filtration & External filter cake formation
3. Erosion of external cake
4. Early effect of varying oil-water mobility ratio
5. Damage characterisation and prediction
6. Taking advantage of formation damage: IORConclusions
2
Injectivity index II = q/Δp decreased 10 times during 15-year waterflooding in giant offshore field
(Campos Basin, Brazil)
INJECTIVITY INDEX vs TOTAL WATER INJECTED
0102030405060708090
100
0 500 1000 1500 2000 2500 3000Wi
II fin
al / I
I inic
ial
(%)
POÇO A POÇO B POÇO CPOÇO D POÇO E POÇO FPOÇO G POÇO H PÇO H_ PD GPo t ência ( PÇO H_ PD G)
1. Formulation of the problem
103 m3 water injected
3
OIL RESERVOIR
NON-PRODUTION FORMATION
OIL (+WATER)
SURFACE TREATMENT
FRACTURE INJECTION
LOSS OF INJECTIVITY
SUB-SEA RAW WATER INJECTION
DOWNHOLE OIL-WATER
SEPARATION
SUB-SEA OIL-WATER SEPARATION
UNDERGROUND DISPOSAL
DUMP FLOODING
ON-LINE MONITORING
LOW BSW: DIRECTLY TO TERMINALS
PRODUCED WATER
REINJECTION
DISPOSAL IN SEA
Water management cycle
AQUIFER OILY PARTICLE CONCENTRATION
4
What can you do about injectivity decline
• Water filtering: filter choice?
• Chemical treatment: what type of chemical?
• Acidizing: when? acid volume?
• Fracturing: when?
• Add perforation holes: when? size?
Decisions !!!
Decisions !!!
5
2. Deep bed filtration and external cake formation
Particles filtrate deep into formation, fill in the inlet, stop filtration and form external filter cake
6
Filtration coefficient λ
λ- particle capture probability per unit of its path; c - suspended concentrations; σ - retained concentrations; U - velocity
cσ
( ,U )Uctσ λ σ∂
=∂
7
Darcy’s law accounting for permeability
damage
( )∇0kU = - p
μ 1+ βσ
1
0 σ
k( )σk0
Formation damage coefficient β
U – velocity, σ - retained concentrations; k - permeability; μ - viscosity; p - pressure
9
( ) ( )( )
( )( )
( )( )
( )D DD
cD D
w
Δp t S tII 0 q 0j t = = = 1+ RII t q t Δp 0 ln
r
c
0 w
Rqp ln S2 k rμΔπ
⎛ ⎞= +⎜ ⎟
⎝ ⎠
Skin factor S characterises formation damage
Expression of impedance j via skin factor
q - rate; Rc – drainage radius; rw – well radius 10
( )D Dj t 1 mt= +
( )0 Lm c 1 e λφ β −= −
Impedance (dimensionless pressure drop) grows linearly with time
m – impedance filtration growth coefficientSharma et al., SPE 28489, 1994, SPE 38181, 1997, Ochi et al, 1998 11
φασ =tr
Transition time
α– critical porosity fraction
- deep bed filtration stops, - external cake formation starts,- retained particles fill α–th fraction of porosity
12Sharma et al., SPE 28489, 1994
•particle balance in the cake accounting for cake porosity
•Darcy’s law inside cake
Barkman, Davidson, JPT, 1972; M Sharma et al., SPE 28489, 1994, 38181, 1997; Z Khatib, SPE 28488, 1994, Ochi, 1998
( ) 1 ( )D Dtr c D Dtrj t m t m t t= + + −
00
cc c
k cm =
k (1 - )φφ
Mathematical model for external filter cake formation:
kc – cake permeability, mc –impedance cake growth coefficient
13
Stages of core / well impairment
M Sharma et al., SPE 28489, 1994, 38181, 1997; Z Khatib, SPE 28488, 1994
01
j(t )DExternal cakedevelopment Cake erosion
Deep bedfiltration
t , p.v.i.D
arctg mc
arctg m
tDtr tDe
14
3. Erosion of external cakeMoment forces F and arms l:
cf – crossflow, g- gravity,
p – permeate, e – electric,
l- lifting, n – normal, t - tangentln
lt
Fe
Fp
Fgreservoircake well
injected water
Fl
Fcf
Fn=Fp+Fe-FlFt=Fcf+Fg
F Civan, 2007, M Sharma et al., SPE 26323, 1993, Al-Abduwani et al., 2005 15
Normal and tangent forces:
4. Accounting for oil-water mobility variation during waterflooding
0.0
20.0
40.0
60.0
80.0
100.0
120.0
140.0
0 0.02 0.04 0.06 0.08
tD, p.v.i.
II(T)
17
Combined Effect of Formation Damage and Mobility Variation
( )( )
( ) ( )
,
,
BL D D D Dtr
Dc
BL D Dtr D Dtr D Dtr
mj t t t tMj t
mmj t t t t t tM M
⎧ + <⎪⎪= ⎨⎪ + + − >⎪⎩
m – impedance filtration growth coefficient; mc – impedance filtration growth coefficient; jBL – impedance decrease from Buckley-Leverett solution;
M – oil-water mobility ratio
To monitor injectivity decline – multiply initial II by M !!
19Bedrikovetsky, et al., SPE 88501, 90083, 93885
Impedance curves 1,2 and 3 for severe formation damage (M=1, 3 and 25); curves 4,5,6 – low damage
If II at the beginning of waterflood in heavy oil reservoir, and 2-4 months later, is the same -> expect injectivity decline soon!!!
Effect of waterflood on j-curve
12 3
4
56
1.0
t , p.v.i.D
j(t )D
0 0.007 0.014
20
Δp(t)q(t)
c(L,t)
λ, β, α, kc,
Er
From Lab to Wells
From Well History to Wells
5. Characterisation of injectivity damage system
λ- filtration coefficient; β - formation damage coefficient; α - critical porosity fraction; kc – cake permeability;ER – erosion coefficient 21
Recalculation from core to well
23
•Vertical well:axi symmetric flow
•Horizontal injector:rate/damage distribution along the well
•Fractured injector:almost linear geometry, fracture growth
•Perforated injector:holes filling instead of cake formation
Simulation Prediction of INjectivity (SPIN) Main Results
Initial data tDVinj
(m³)time (d)
Vpart
(m³) JB
Qdbf
(m³/s)Rate (m³/s) Jc J Jd S II
Rc (m) 500 Pinj (Pa) 29000000 1E-06 5 0,0015 0 0,868 0,037 0,037 0 0,868 1 28 1,153
rw (m) 0,1 Pres (Pa) 27000000 0,005 22153 5,9647 0 0,64 0,043 0,043 0 0,742 1,169 23 1,348
Hf (m) 30 Krwor 0,2 0,009 44301 12,605 0 0,623 0,039 0,039 0 0,826 1,338 27 1,211
Hr (m) 15 Krowi 0,7 0,014 66449 19,982 0 0,613 0,035 0,035 0 0,917 1,507 31 1,09
λ (1/m) 1,9 Swi 0,2 0,019 88598 28,119 0 0,606 0,032 0,032 0 1,012 1,677 35 0,988
β 500 Sor 0,25 0,024 110746 37,029 0 0,601 0,029 0,029 0 1,108 1,846 39 0,902
φ 0,2 n 3 0,028 132894 46,72 0 0,596 0,026 0,026 0 1,205 2,015 43 0,83
k (m²) 4,E-12 m 1,3 0,033 155042 57,197 0 0,592 0,024 0,024 0 1,303 2,184 47 0,767
c0 1E-06 Co (Btu/ft³.oF) 23 0,038 177191 68,465 0 0,589 0,023 0,023 0 1,401 2,353 51 0,714
ρ o (kg/l) 0,90 μο i (Pa.s) 0,0072 0,042 199339 82,548 0,0023 0,586 0,021 0,018 0,426 1,752 2,941 66 0,571
α 0,10 μο i (Pa.s) 0,0072 0,047 221487 110,75 0,0577 0,584 0,021 0,009 3,355 3,507 5,871 141 0,285
kc (m²) 5,E-16 Cw (Btu/ft³.oF) 62,35 0,052 243635 138,94 0,113 0,582 0,021 0,009 3,359 3,507 5,874 141 0,285
φc 0,6 ρ w (kg/l) 1,03 0,056 265783 167,14 0,1684 0,58 0,021 0,009 3,363 3,507 5,878 141 0,285
rmin (m) 3,0E-06 salinity (v/v) 0,1 0,061 287932 195,35 0,2238 0,578 0,021 0,009 3,366 3,507 5,882 141 0,285
ρ c (kg/m³) 2450 Cr (Btu/ft³.oF) 52,45 0,066 310080 223,55 0,2792 0,576 0,021 0,009 3,369 3,507 5,885 141 0,285
Ti (oC) 82 ρ r (kg/l) 2,6 0,071 332228 251,75 0,3345 0,574 0,021 0,009 3,372 3,507 5,887 141 0,285
Tj (oC) 20 Er 6 0,075 354376 279,95 0,3899 0,573 0,022 0,009 3,375 3,507 5,89 141 0,285Table for partial calculations of SPIN 0,08 376525 308,15 0,4453 0,571 0,022 0,009 3,377 3,508 5,892 141 0,285q initial (m³/s) 0,0318818 s2 0,55 0,085 398673 337,41 0,5006 0,57 0,022 0,009 3,599 3,639 6,114 146 0,275
ΔP (Pa) 2000000 D2 2,31 0,089 420821 366,68 0,556 0,569 0,022 0,009 3,601 3,639 6,117 146 0,275
Δρ (kg/m³) 1420 s3 0,748 0,094 442969 397,2 0,6114 0,568 0,022 0,008 3,865 3,797 6,381 Sharma (sim
μwi pure (Pa.s) 0,00036 D3 0,107 0,00 15551 226,13 0 0,616 1,103 1,811 1
μwj pure (Pa.s) 0,00100 s4 0,748 0,008 37901 232,16 0 0,6 0,743 1,239 1
μwi (Pa.s) 0,00046 D4 0,052 0,013 61766 238,34 0 0,591 0,714 1,205 1
μwj (Pa.s) 0,00123 D2=tD; xD=1 0,432 0,017 81962 245,44 0 0,585 0,969 1,64 1,1
μο j (Pa.s) 0,03707 D3=tD; xD=1 9 0,021 98893 252,15 0 0,58 1,091 1,85 1,1
M 1,6662533 D4=tD; xD=1 19 0,024 115083 256,19 0 0,577 0,687 1,184 1,1
1/M 0,6001488 API 25,2 0,028 130769 261,88 0 0,573 1 1,711 1,1
VP (m³) 4712389 0,031 143930 267,42 0 0,573 1,16 1,978 1,2
`-ht 0,48 `-bt 13,03 0,035 163116 277,17 0 0,573 1,399 2,375 1,2
Deep bed filtration m 4,E+01 0,037 174257 283,18 0 0,573 1,486 2,522 1,3out { } -7E-03 4ª exp -0,00087 0,04 189909 293,3 0 0,572 1,783 3,017 1,3
xw 4,E-08 2ª exp 4,E+03 0,043 202902 304,2 0,0112 0,572 2,309 3,895 1,3Transition to external cake 0,045 214245 320,47 0,0396 0,572 3,953 6,634 1,4
TDtr 0,0421053 vol inj (m³) 198416 0,048 226026 333,16 0,069 0,571 2,967 4,993 1,4Qtr (m³/s) 0,0126752 Jtr 3,E+00 0,05 236899 346,28 0,0962 0,571 3,322 5,584 1,4integral 1201,6155 vol. part. (m³) 0,4960409 0,052 246492 356,26 0,1202 0,571 2,865 4,823 1,51ª exp -1,067E-84 3ª exp 2,305E-88 0,054 252315 363,12 0,1347 0,57 3,247 5,459 1,5
External cake 0,055 259922 371,83 0,1538 0,57 3,155 5,306 1,5hmax (m) 2,975E-05 Je 1 0,058 274261 393,52 0,1896 0,57 4,167 6,993 1,6hmin (m) 0 TDe 0,043 0,061 286109 410,32 0,2192 0,57 3,906 6,56 1,7
GOM (SHARMA,1994)
0
1
2
3
4
5
6
7
8
9
10
0 0,02 0,04 0,06 0,08 0,1tD (pvi)
J d
SPIN predictionObservedSimulated by SPE 28429
J2 J2TJ1
Modelling by commercial software
Paiva, Bedrikovetsky, et al., SPE 100334, 2006SPE 107866, 2007
SPIN: Simulation & Prediction of Injectivity
24
Column filling
Cake erosion
Deep bed filtration
Cake formation
Treatment of field data (Gulf of Mexico) by SPIN and by commercial simulator
25
Shumbera, D. A. et.al, 2003, SPE 84416
Treatment of raw well data, field case
( )( )
( ) ( )
,BL D D D Dtr
Dc
BL D Dtr D Dtr
mj t t t tMj t
mmj t t t tM M
⎧ + <⎪⎪= ⎨⎪ + + −⎪⎩
26
0.00%5.00%
10.00%15.00%20.00%25.00%30.00%35.00%40.00%45.00%
10 30 60 90 120
150
180
210
240
270
300
Lambda (1/m)
Freq
uenc
y
Lambda-3 PointLambda-Cor
Injectivity impairment parameters
Well data Coreflood data
Formation damage coefficient
0.00%5.00%
10.00%15.00%20.00%25.00%30.00%35.00%40.00%45.00%
200 400 600 800 1000 1200 1400 1600
Beta
Freq
uenc
yBeta-3 PointBeta-Cor
Formation damage coefficient
Filtration coefficient, 1/m Filtration coefficient, 1/m
3-point
correlation
3-point
correlation
27
Fractured injector: fracture propagation
due to increasing leakage of untreated water and increasing formation damage; increase of areal
sweep
6. IOR & Waterflood management by fracture propagation
Unfavourable stress environment: low sweep
Favourable stress environment: high sweep
Perforation density along the column :
N(x) = ?
Non-uniformal perforation homogenizes injectivity profile and increases sweep efficiency
Injectivity damage also homogenizes injectivity profile and increases sweep for any “unpredictable” heterogeneity
P. Dore, P. Bedrikovetsky et al., 2005, SPE 99343
Injector Producer Sweep increase due to formation damage and non-uniform perforation
Sweep improvement due to precipitation/sorption
High Permeability Zone
Injector Producer
Water sweep front without skin
Water sweep front with skin
Induced skin Low
Permeability Zone
Polymer flooding –adsorption of polymer CO2 flooding – precipitation of asphaltenesCold waterflood of waxy oil - precipitation of paraffins
Idea of oil recovery increase by injection of water with particles: The damage is high where the injection rate is high, i.e. the injectivity profile becomes more uniform and sweep efficiency increases
Khambharatana, Faruq Ali et al. (1998) – poor sweep increase with vertical injectorsSoo, Radke, (1999) – less SorPresent work (2009) – the same effect with horizontal wells
High Permeability Zone
Injector Producer
Water sweep front without skin
Water sweep front with skin
Induced skin
Minor effect of sweep increase at the very beginning of water injection
Water Oil
With skin (0.1 p.v.i) Without skin (0.1 p.v.i)
Small saturation difference can be observed near to injector in low permeable zone
Water Oil
Skin results in high increase of the final sweep from low permeability zone
With skin (2.0 p.v.i) Without skin (2.0 p.v.i)
P. Bedrikovetsky et al., 2009, SPE 122843
Implementation of damage option S(tD) into waterflood simulators (IMEX, Eclipse)
An accurate prediction of injectivity allows to plan well stimulation - fracturing, acidification, etc.
Applications
28
Filtration coefficient determines the size of the damaged zone
-prediction of required perforation length to bypass the damage-calculation of required acid volume to remove damage
'1λ
σ += wd rr
P. Bedrikovetsky et al., 2009, SPE 122844
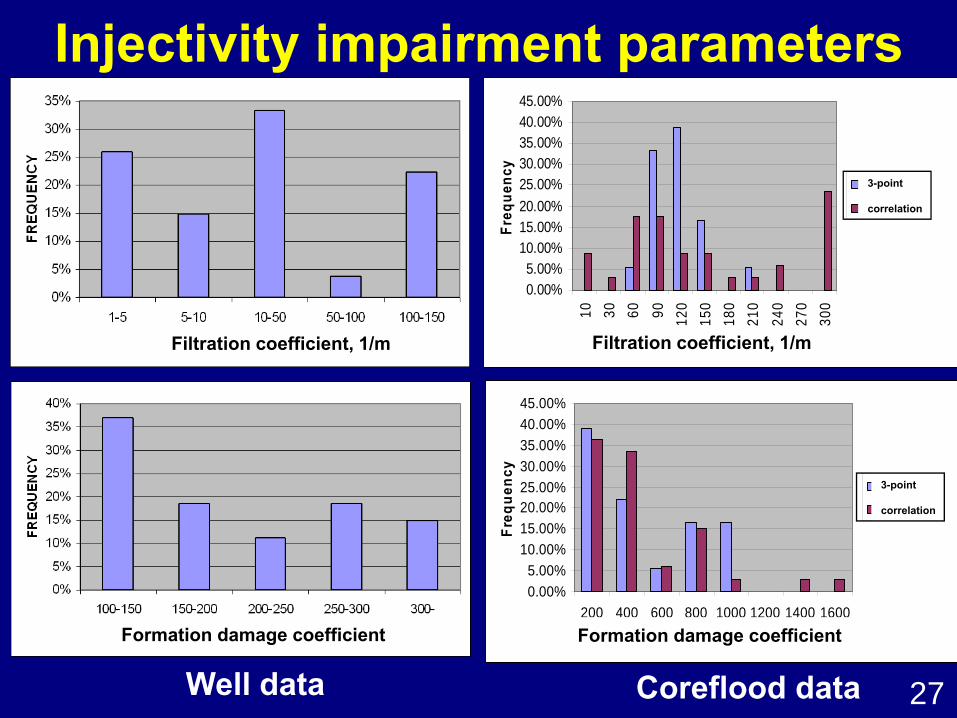
Database of injectivity damage parameters from lab tests and well history
Prediction of injector behaviour for “new” fields, not yet submitted to waterflooding, based on basic data on permeability, porosity, pore size distribution
The developed theory can be applied for •drilling-fluid-invasion-induced formation damage, •fines migration and damage of producers, •gravel pack impairment, •sand screen design
Applications
29
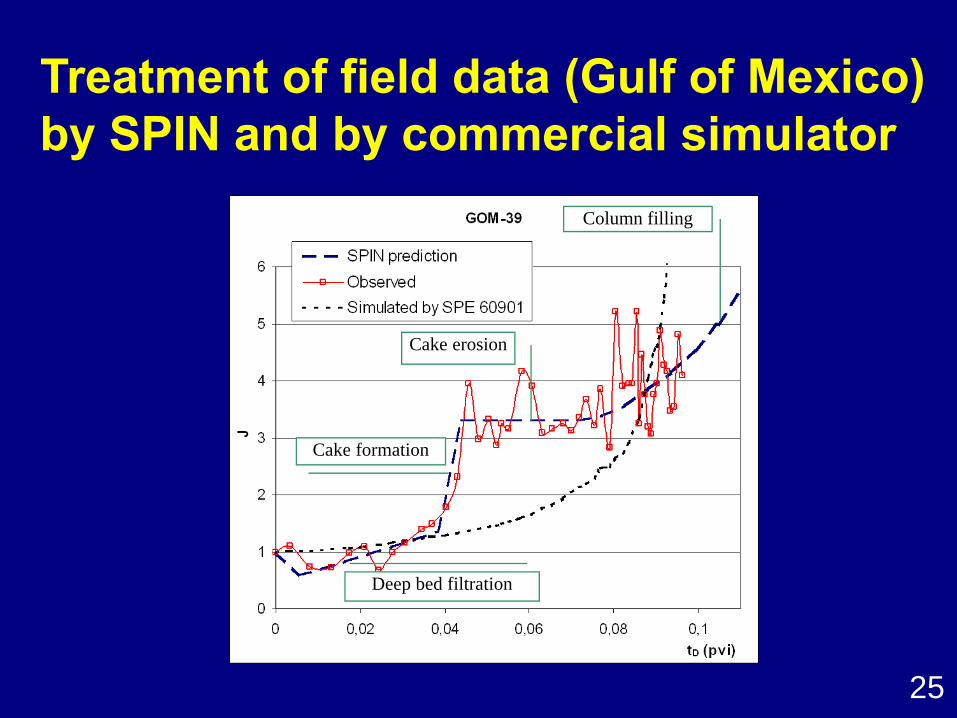
Theory for well injectivity impairment shows
•Good match with field data
•Good match with laboratory tests
3-point-pressure tool characterises injectivity damage system and is used in field / platform conditions
Mathematical model is implemented in software SPIN
Database of damage parameters –> for injectivity prediction
Conclusions
30
Collaborators:
•A L Serra de Souza, C A Furtado, P Dore, A G Siqueira, F Shecaira(Petrobras, Cenpes)
•R Paiva, A Santos, M da Silva, Maylton F da Silva, A C Gomes, E Resende
(UENF-Lenep / Petrobras)
•F Al-Abduwani, P Currie, W. Van den Broek,(Delft University of Technology, The Netherlands)
•D Marchesin, G Hime, A Alvares (IMPA, Brazil)
•A Shapiro (Technical University of Denmark)
•O Dinariev (Russian Academy of Sciences)
Acknowledgements
Thank you !!!