Page 1
SPE DISTINGUISHED LECTURER SERIESis funded principally
through a grant of the
SPE FOUNDATIONThe Society gratefully acknowledges
those companies that support the programby allowing their professionals
to participate as Lecturers.
And special thanks to The American Institute of Mining, Metallurgical,and Petroleum Engineers (AIME) for their contribution to the program.
Page 2
Formation Pressure Testing In the Dynamic Drilling Environment
SPE DISTINGUISHED LECTURER SERIES
Mark ProettHalliburton - Drilling and Formation Evaluation
Page 3
SPE DL Talks 2006
Sep 11 Tomsk Section, RussiaSep 12 Moscow Section, RussiaSep 13 Nizhnevartovsk Section, RussiaSep 14 Western Siberia, Noyabrsk, RussiaSep 18 Volga Section, Almetyevsk, RussiaSep 21 Aktau Section, KazakhstanSep 22 BP Baku, AzerbaijanOct 18 Midland Texas
Page 4
SPE DL Talks 2007
Jan 10 Houston, SPE Drilling Study GroupFeb 21 Denver, ColoradoFeb 22 Billings, MontanaMar 11 Dubai, UAEMar 12 Abu Dhabi, UAEMar 14 Cairo, EgyptMar 16 Tunis, Tunisia
Page 5
SPE DL Talks 2007
Apr 9 Michigan Section, Lansing, MichiganApr 11 Bridgeport, West VirginiaApr 12 Charleston, West VirginiaMay 14 Trans-Pecos Section, Odessa TexasMay 15 Arkansas Section, Fort Smith ArkansasMay 16 Mid Continent Section, Tulsa, OklahomaMay 17 Oklahoma City Section, Oklahoma, City
22 Talks Total
Page 6
Formation Pressure Testing in the Dynamic Drilling Environment
Formation Testing While Drilling (FTWD) tools were introduced in 2002 and this new service has raised fundamental questions.
How does the drilling environment affect the measurement?
How do FTWD and Wireline Formation Testers (WFT) compare?
What new applications can FTWD address?
Page 7
Formation Pressure Testing
Evolution of Formation Testing Technology
Wireline Formation Testing
Formation Testing While Drilling (FTWD)
FTWD Deployment & Challenges
FTWD Applications and Examples
Summary
Page 8
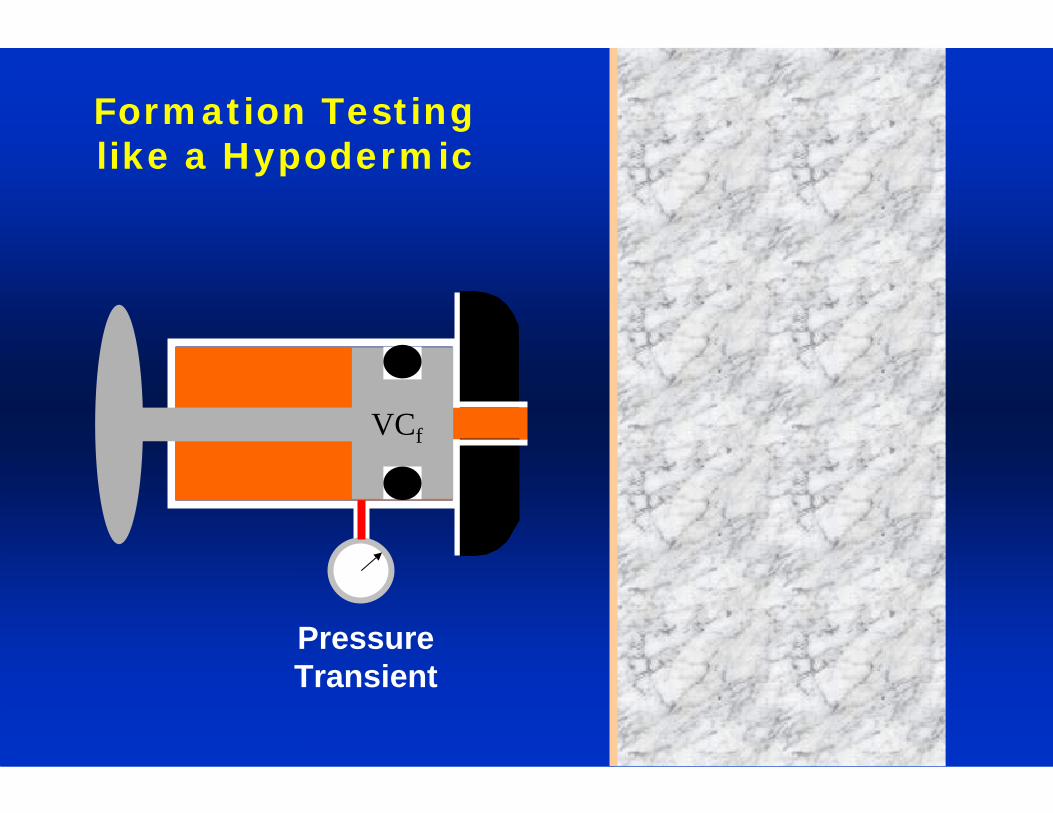
Formation Testinglike a Hypodermic
PressureTransient
VCf
Page 9
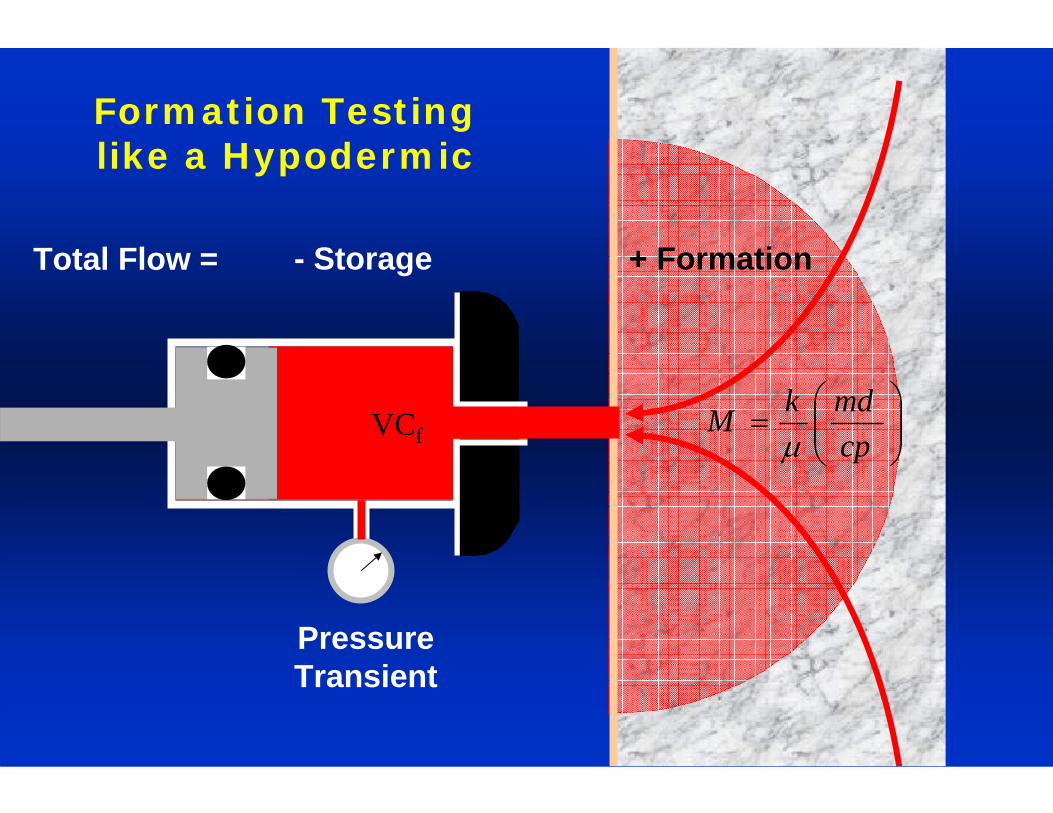
+ Formation
⎟⎟⎠
⎞⎜⎜⎝
⎛=
cpmdkM
μ
Formation Testinglike a Hypodermic
Total Flow =
PressureTransient
- Storage
VCf
Page 10
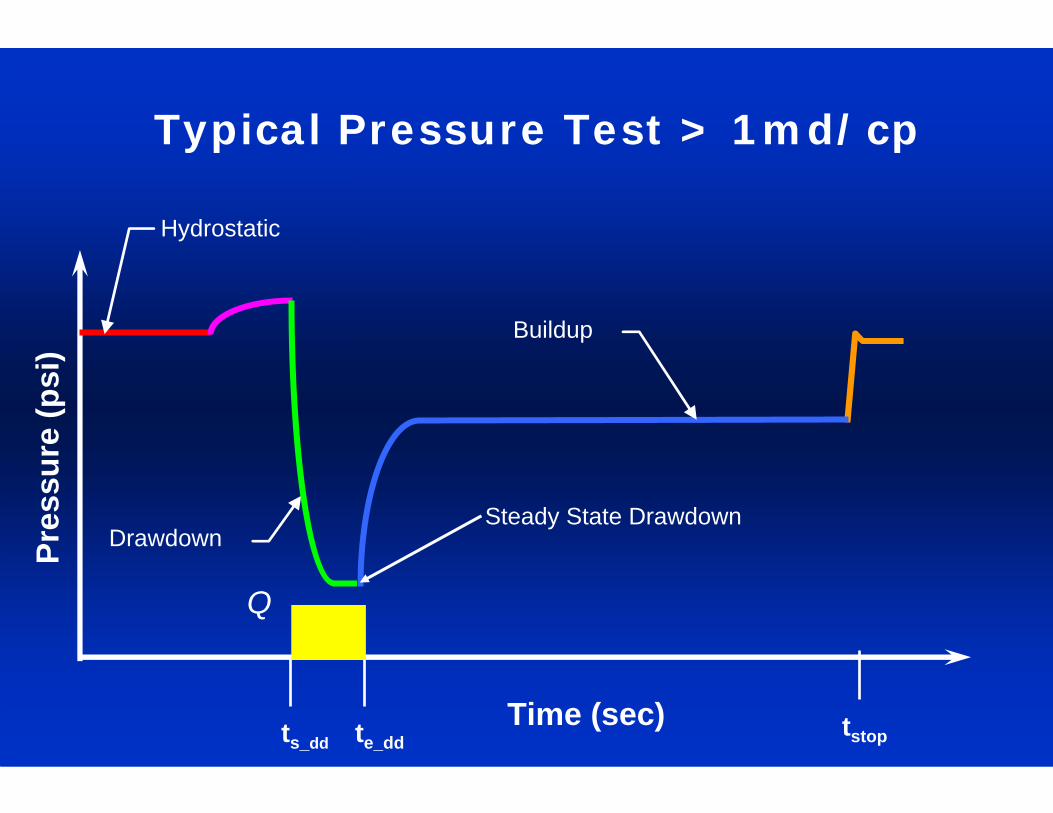
Pres
sure
(psi
)
Time (sec) tstopte_ddts_dd
Drawdown
Hydrostatic
Q
Typical Pressure Test > 1md/cp
Equalization ValvePressure Gauge
Probe
Packer
Pretest Chamber (5-10 cm3
Steady State Drawdown
Buildup
Page 11
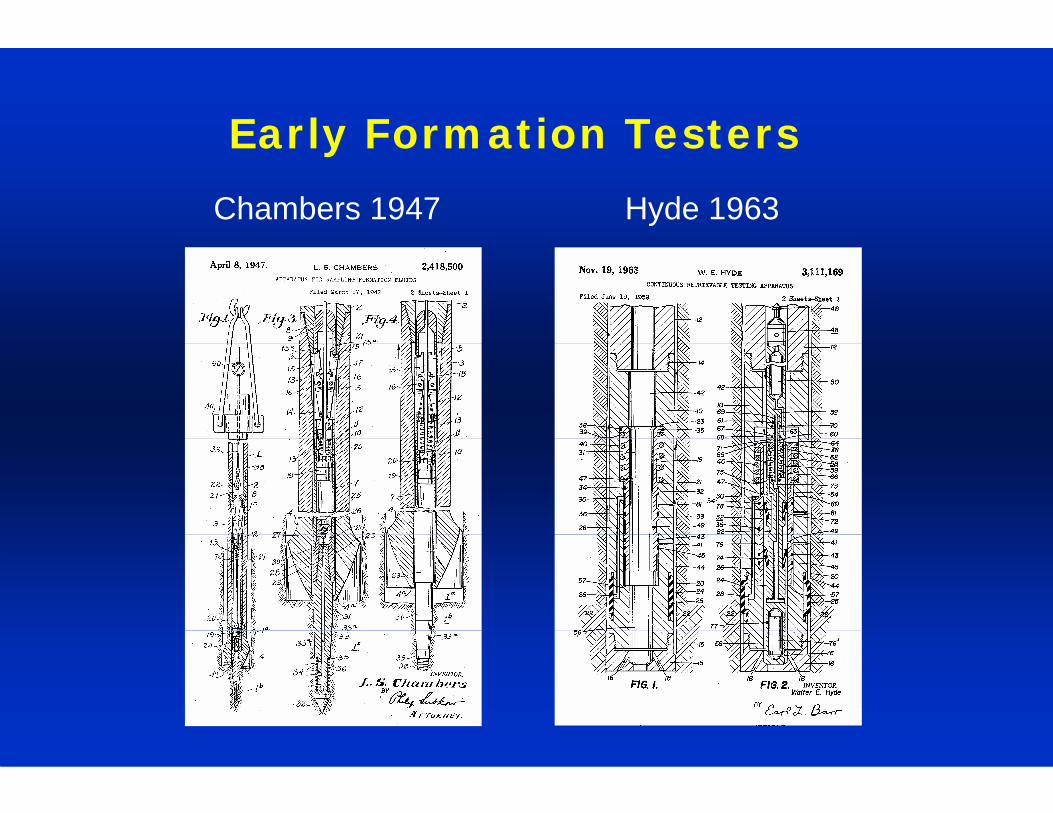
Early Formation Testers
Hyde 1963Chambers 1947
Page 12
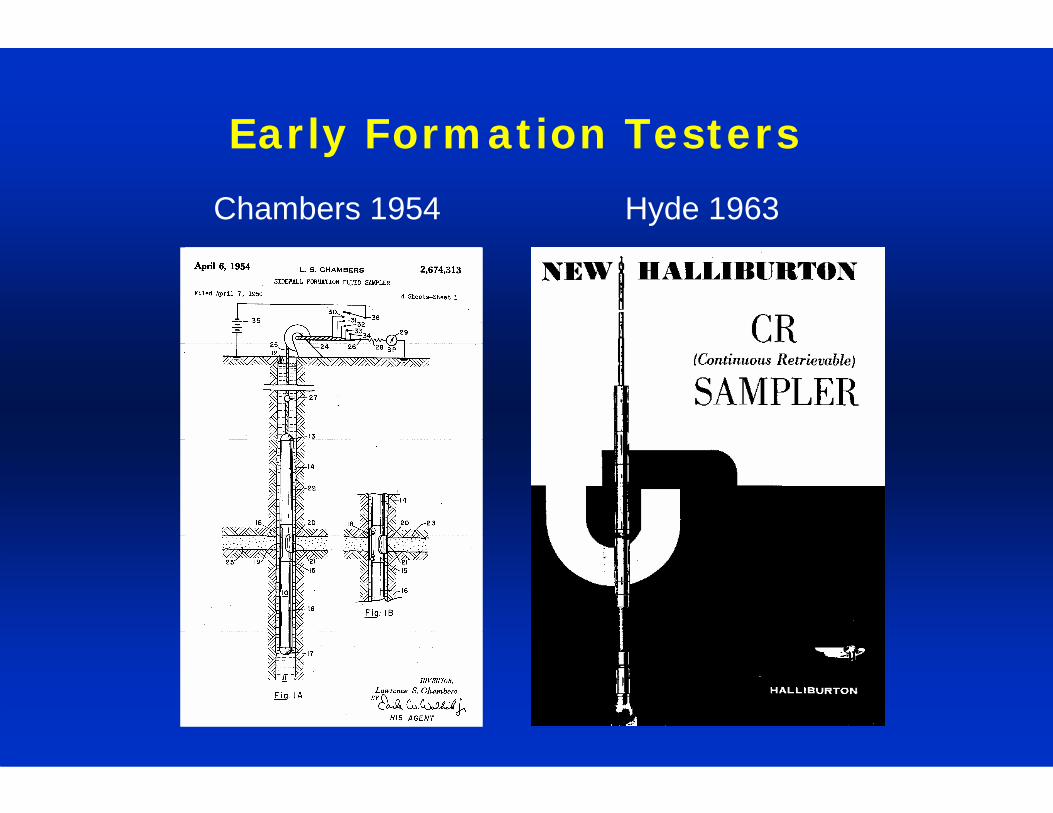
Early Formation Testers
Hyde 1963Chambers 1954
Page 13
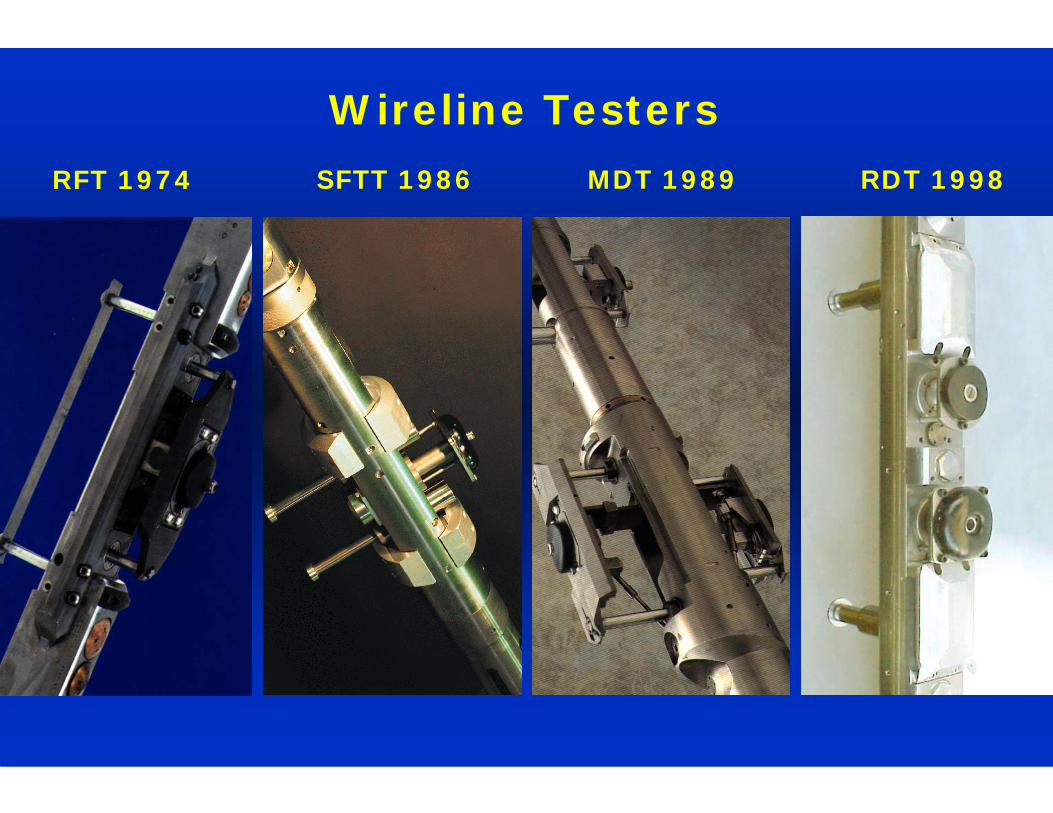
Wireline Testers
RDT 1998MDT 1989RFT 1974 SFTT 1986
Page 14
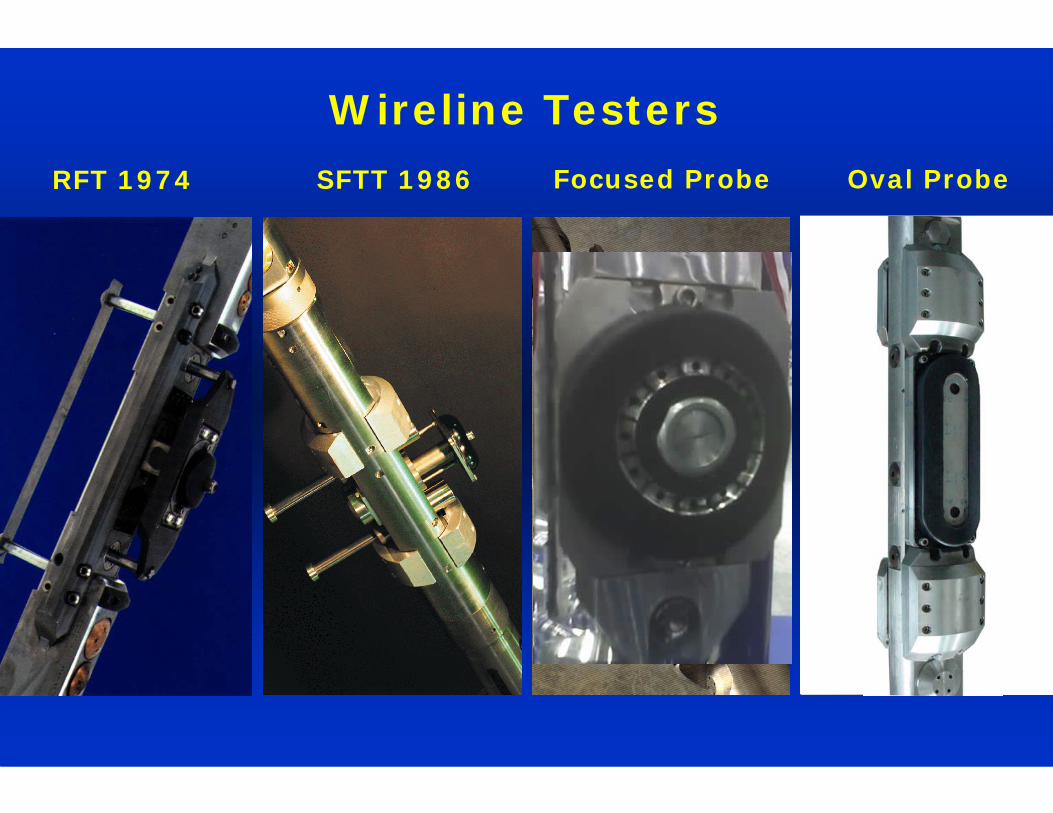
Wireline Testers
RDT 1998MDT 1989RFT 1974 SFTT 1986 Oval ProbeFocused Probe
Page 15
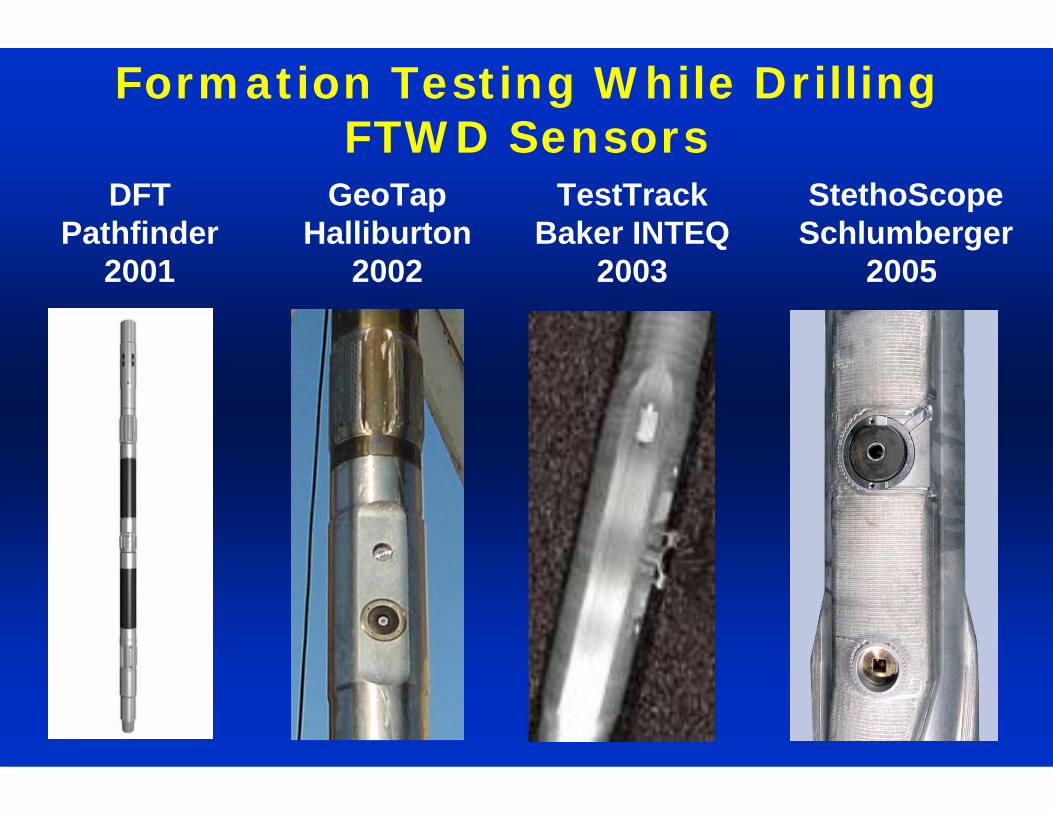
Formation Testing While Drilling FTWD Sensors
TestTrackBaker INTEQ
2003
DFTPathfinder
2001
StethoScopeSchlumberger
2005
GeoTapHalliburton
2002
Page 16
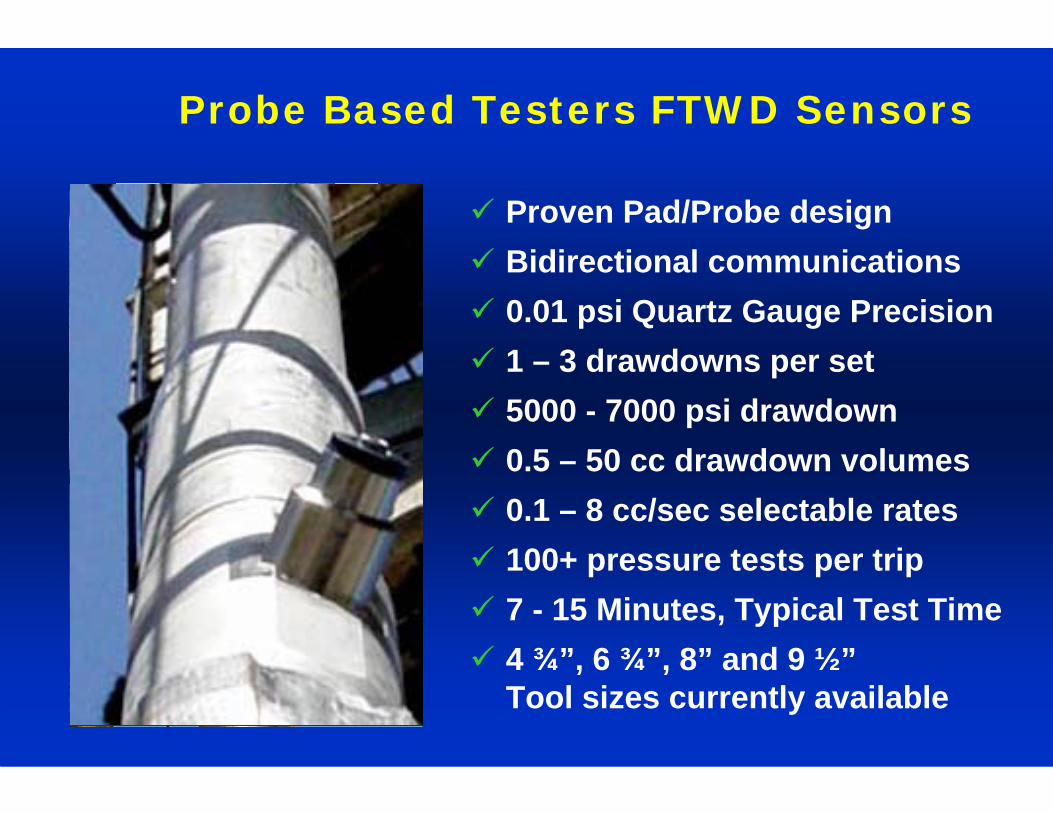
Proven Pad/Probe designBidirectional communications0.01 psi Quartz Gauge Precision1 – 3 drawdowns per set5000 - 7000 psi drawdown0.5 – 50 cc drawdown volumes0.1 – 8 cc/sec selectable rates 100+ pressure tests per trip7 - 15 Minutes, Typical Test Time4 ¾”, 6 ¾”, 8” and 9 ½”Tool sizes currently available
Probe Based Testers FTWD Sensors
Page 17
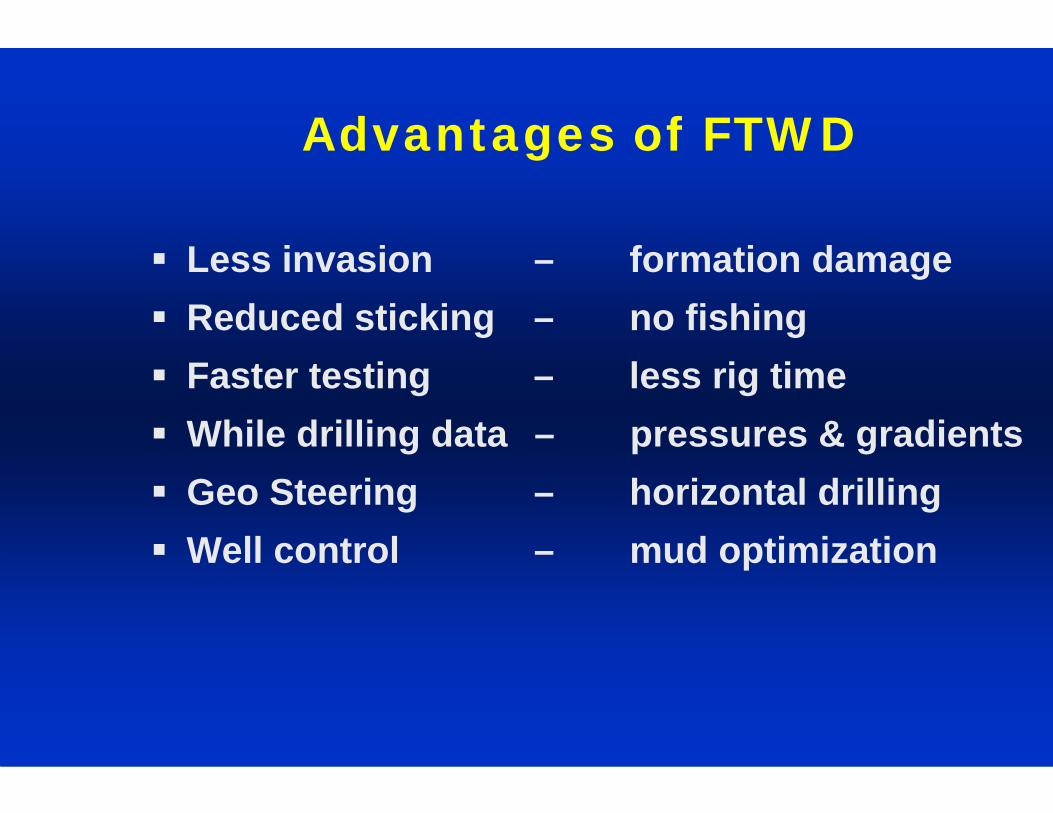
Advantages of FTWD
Less invasion – formation damageReduced sticking – no fishingFaster testing – less rig timeWhile drilling data – pressures & gradientsGeo Steering – horizontal drillingWell control – mud optimization
Page 18
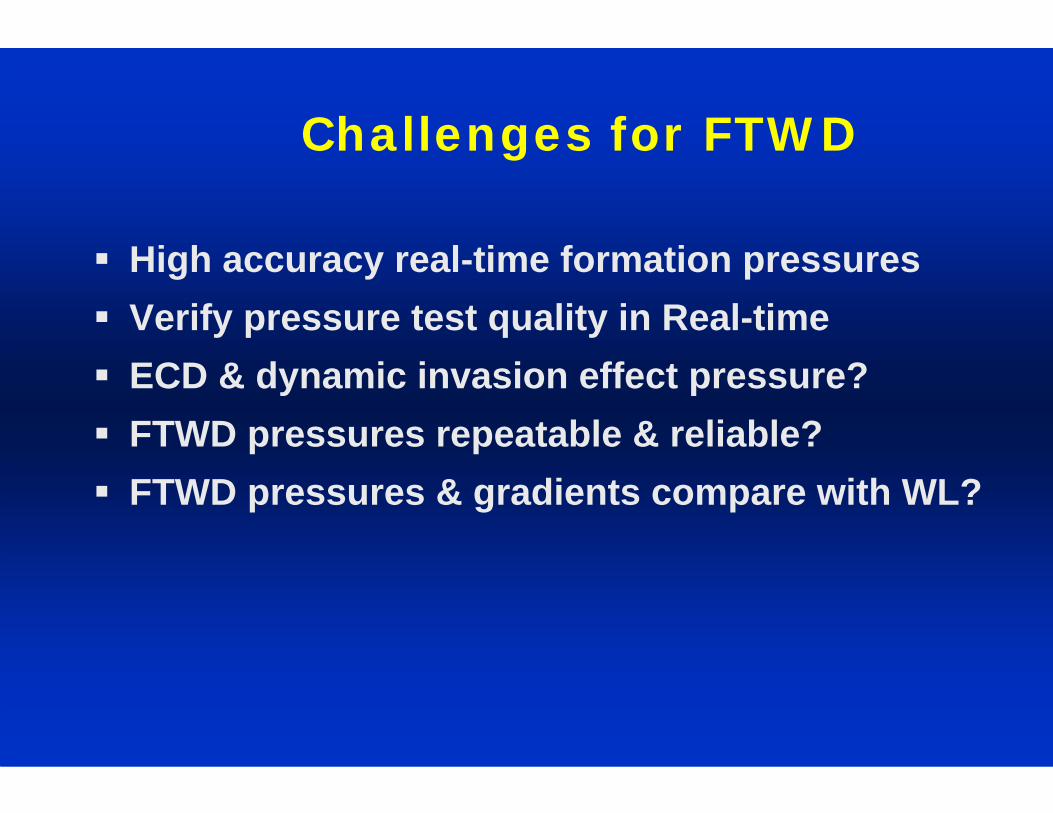
Challenges for FTWD
High accuracy real-time formation pressuresVerify pressure test quality in Real-timeECD & dynamic invasion effect pressure? FTWD pressures repeatable & reliable?FTWD pressures & gradients compare with WL?
Page 19
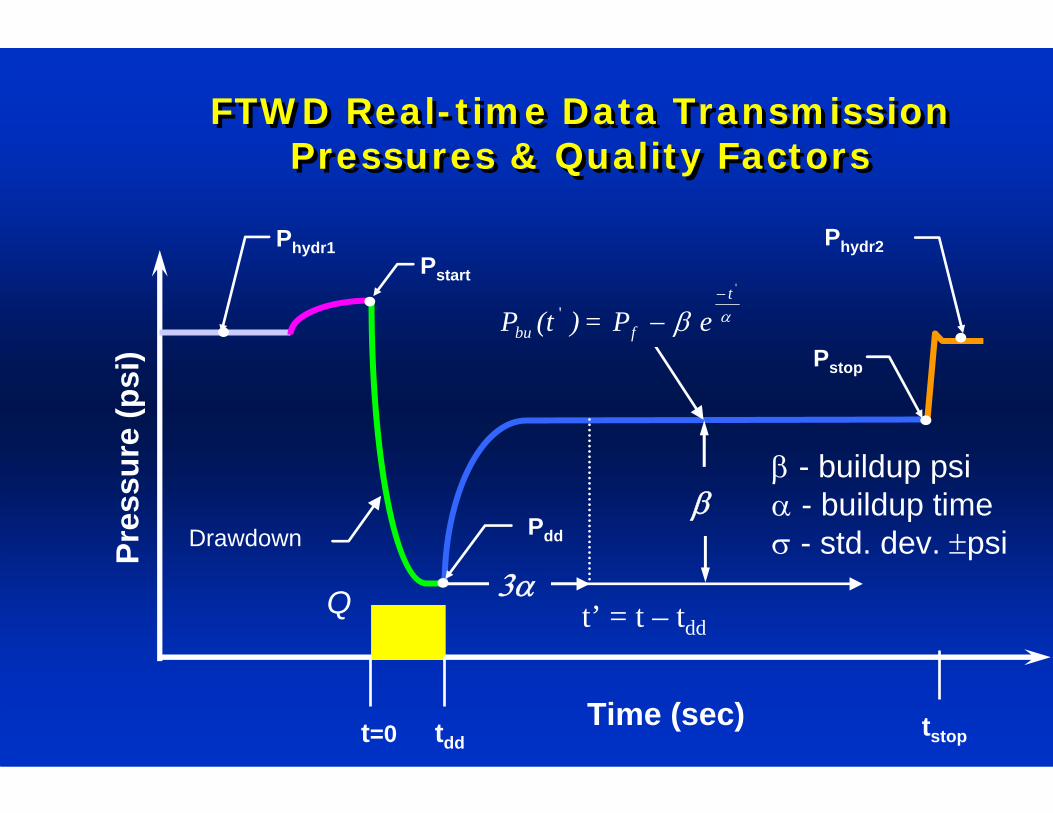
FTWD Real-time Data TransmissionPressures & Quality Factors
FTWD Real-time Data TransmissionPressures & Quality Factors
Pres
sure
(psi
)
Time (sec) tstop
Buildup
tdd
Q
t=0
αβ'
't
fbu e P=)(tP−
−
β
t’ = t – tdd
3α
β - buildup psiα - buildup timeσ - std. dev. ±psiPdd
Phydr1
Pstop
Pstart
Phydr2
Drawdown
Page 20
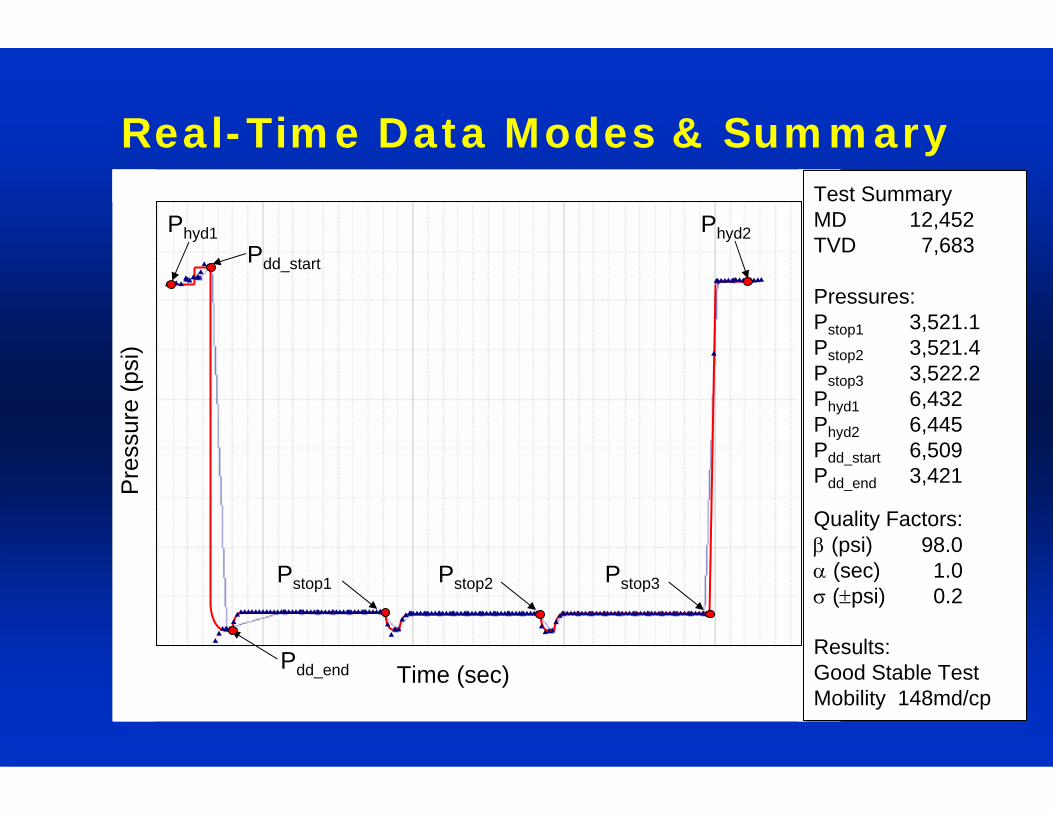
Test SummaryMD 12,452TVD 7,683
Pressures:Pstop1 3,521.1Pstop2 3,521.4Pstop3 3,522.2Phyd1 6,432Phyd2 6,445Pdd_start 6,509Pdd_end 3,421
Quality Factors:β (psi) 98.0α (sec) 1.0σ (±psi) 0.2
Results:Good Stable TestMobility 148md/cp
Pre
ssur
e (p
si)
Time (sec)
Real-Time Data Modes & Summary
Pstop3Pstop1 Pstop2
Pdd_end
Phyd2Pdd_start
Phyd1
Page 21
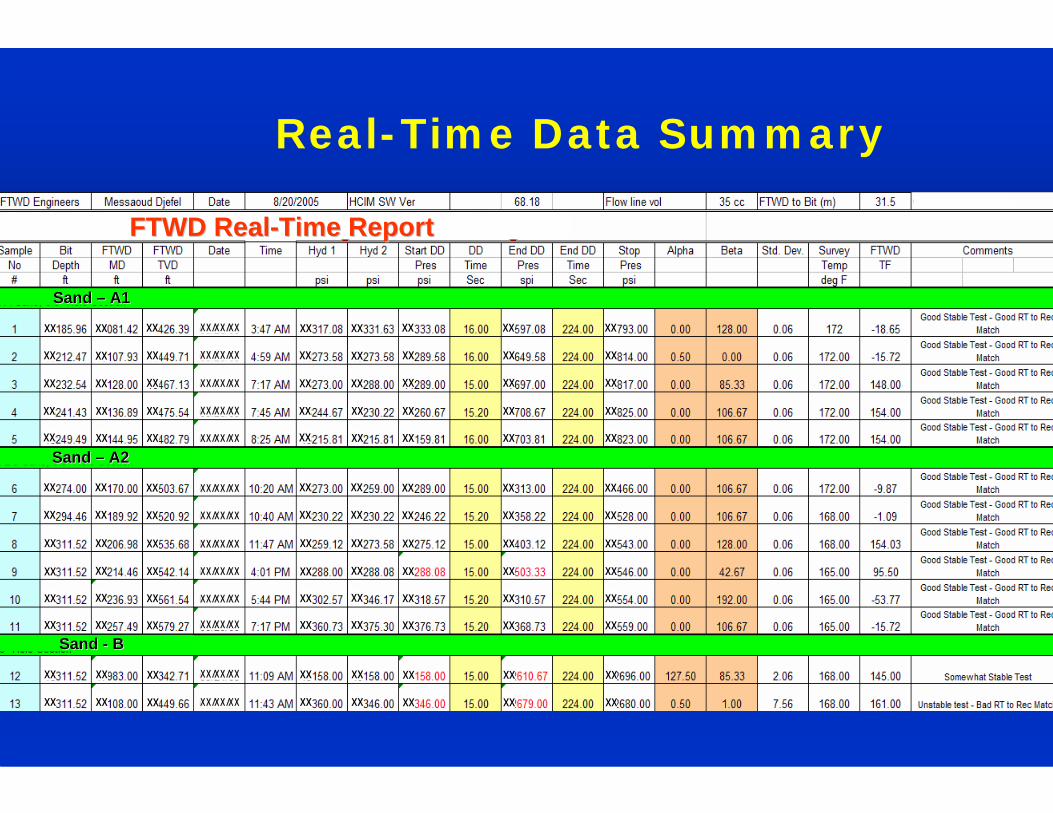
Real-Time Data Summary
xx xx
xx xx
xx xx
xx xx
xx xx
xx xx
xx xx
xx xx
xx xx
xx xx
xx xx
xx xx
xx xx
xx
xx
xx
xx
xx
xx
xx
xx
xx
xx
xx
xx
xx
FTWD RealFTWD Real--Time ReportTime Report
Sand Sand –– A2A2
Sand Sand -- BB
Sand Sand –– A1A1
xx
xx
xx
xx
xx
xx
xx
xx
xx
xx
xx
xx
xx
xx
xx
xx
xx
xx
xx
xx
xx
xx
xx
xx
xx
xx
xx xx
xx xx
xx xx
xx xx
xx xx
xx xx
xx xx
xx xx
xx xx
xx xx
xx xx
xx xx
xx xx
xx
xx
xx
xx
xx
xx
xx
xx
xx
xx
xx
xx
xx
XX/XX/XXXX/XX/XX
XX/XX/XXXX/XX/XX
XX/XX/XXXX/XX/XX
XX/XX/XXXX/XX/XX
XX/XX/XXXX/XX/XX
XX/XX/XXXX/XX/XX
XX/XX/XXXX/XX/XX
XX/XX/XXXX/XX/XX
XX/XX/XXXX/XX/XX
XX/XX/XXXX/XX/XX
XX/XX/XXXX/XX/XX
XX/XX/XXXX/XX/XX
XX/XX/XXXX/XX/XX
Page 22
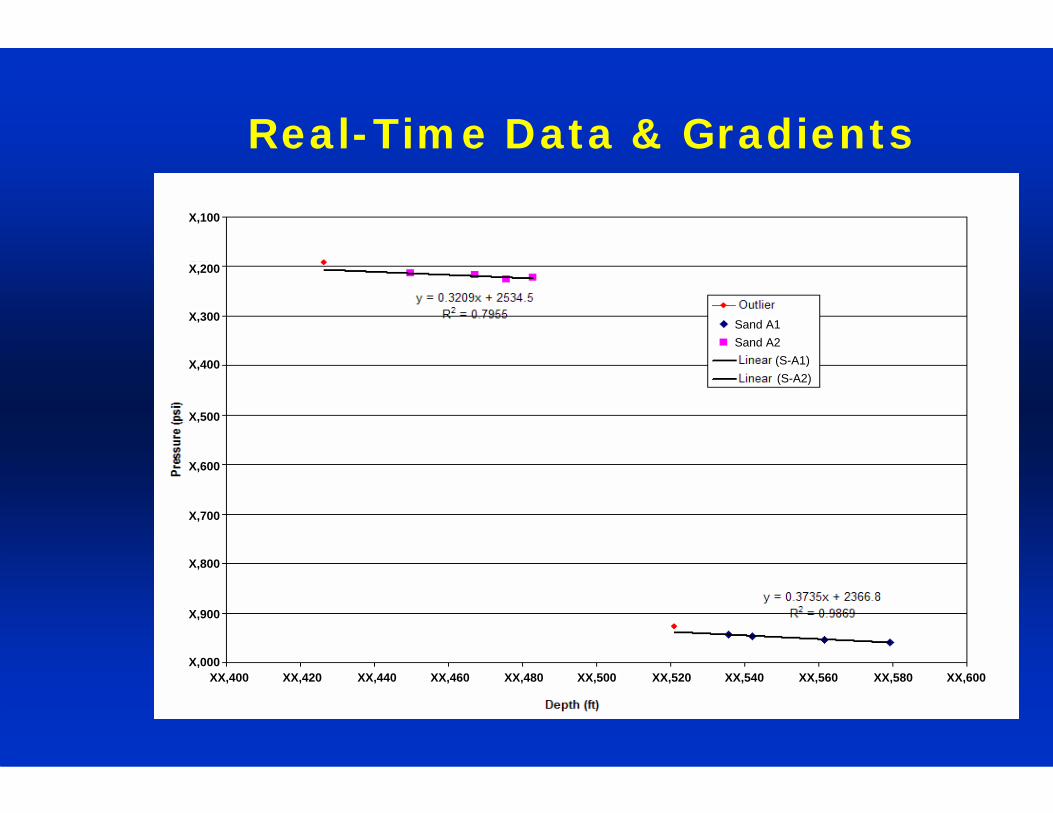
Real-Time Data & Gradients
XX,600XX,580XX,560XX,480XX,460XX,440XX,420X,000
XX,540XX,520XX,500XX,400
X,600
X,500
X,900
X,400
X,200
Sand A2
X,300
X,800
X,700
X,100
(S-A2)
Sand A1
(S-A1)
Page 23
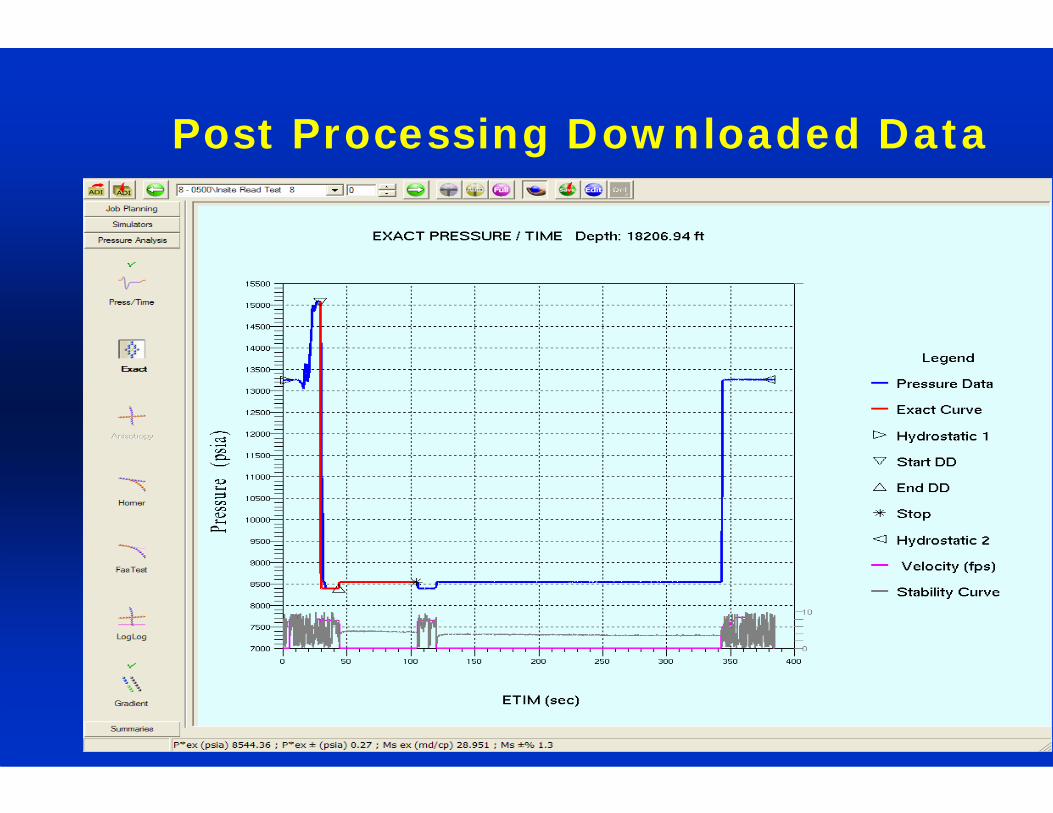
Post Processing Downloaded Data
Page 24
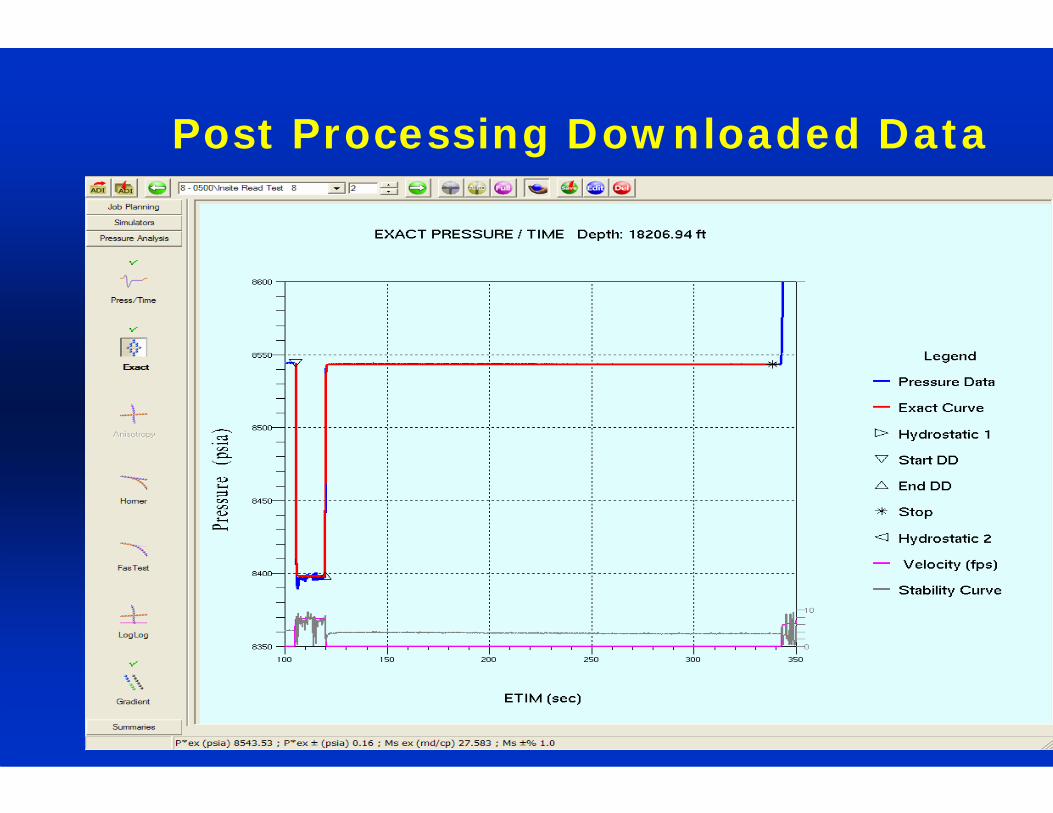
Post Processing Downloaded Data
Page 25
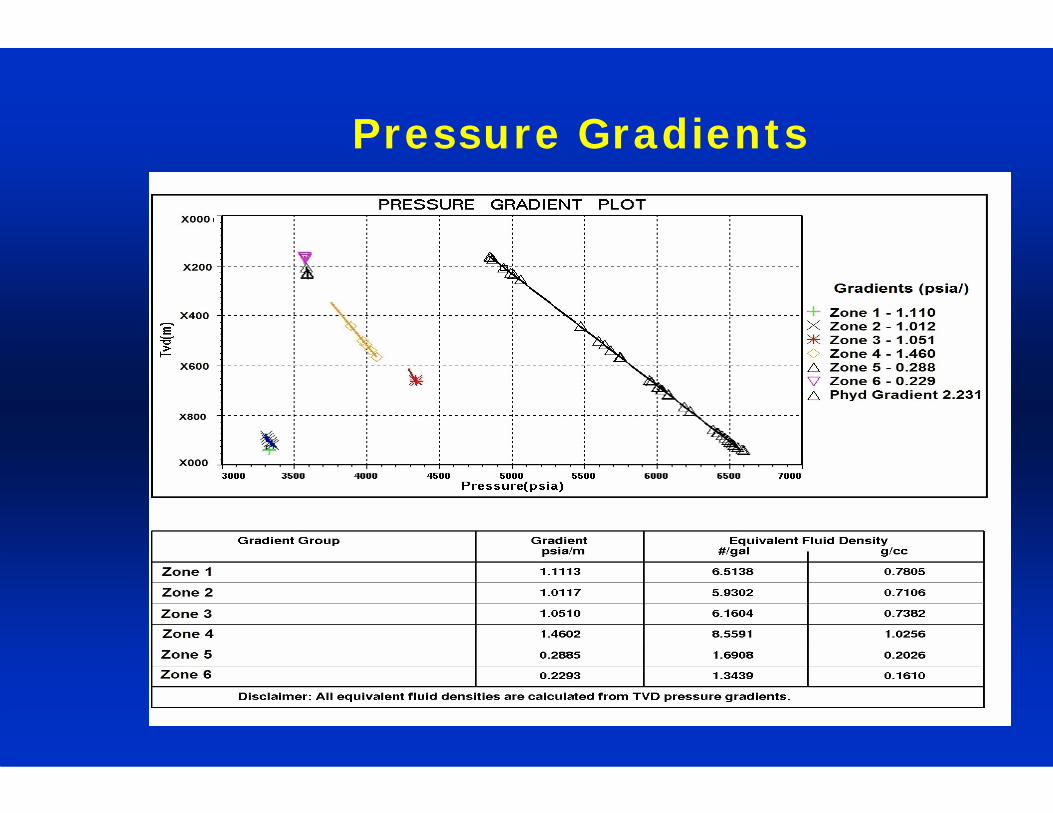
Pressure Gradients
Page 26
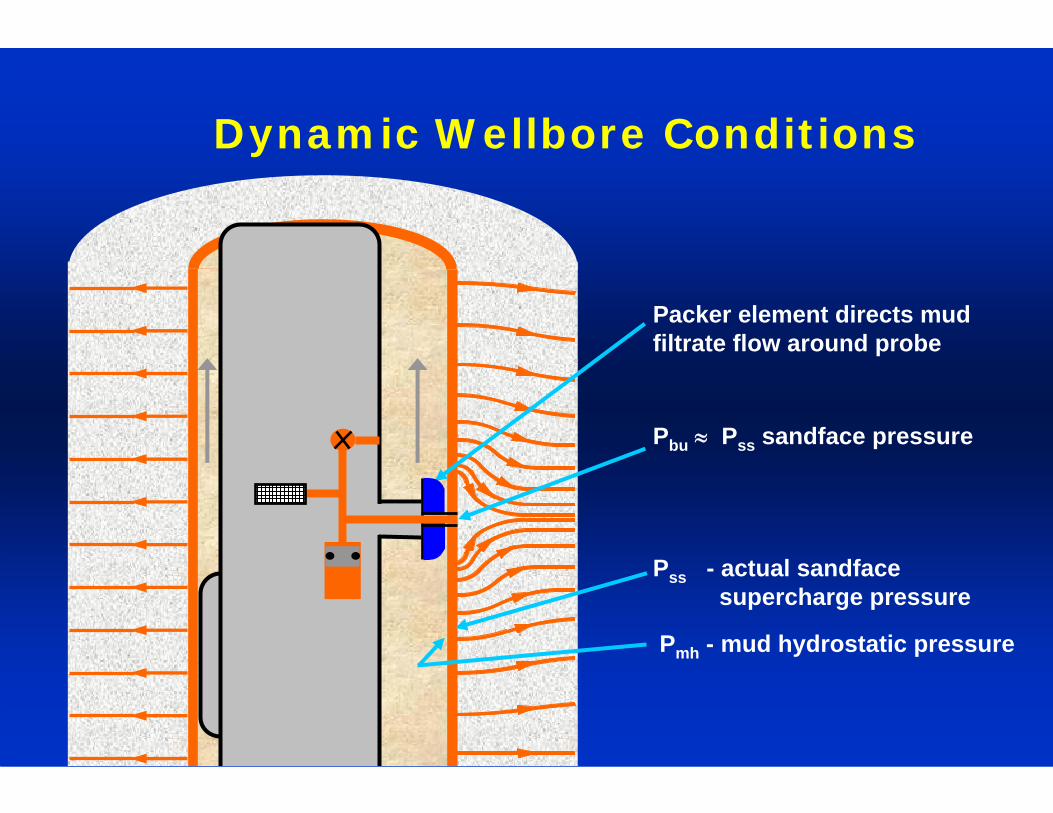
Dynamic Wellbore Conditions
Packer element directs mud filtrate flow around probe
Pbu ≈ Pss sandface pressure
Pss - actual sandfacesupercharge pressure
Pmh - mud hydrostatic pressure
Page 27
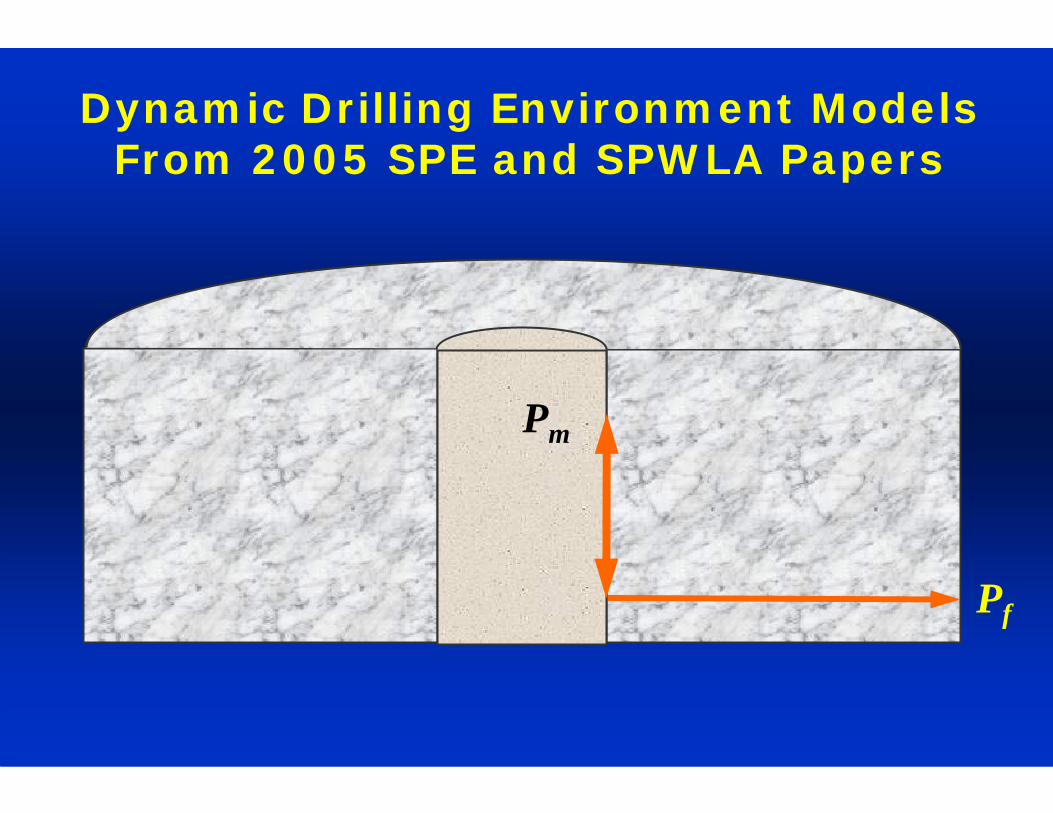
Dynamic Drilling Environment Models From 2005 SPE and SPWLA Papers
Pf
Pm
Page 28
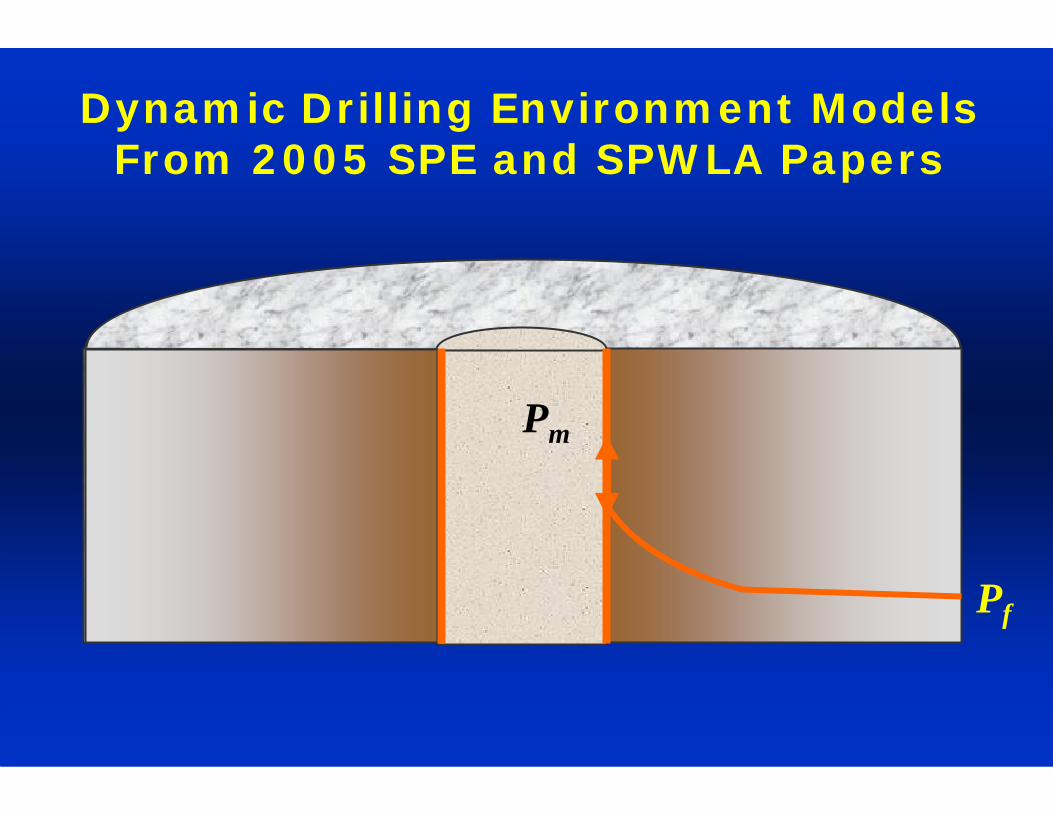
Dynamic Drilling Environment Models From 2005 SPE and SPWLA Papers
Pf
Pm
Page 29
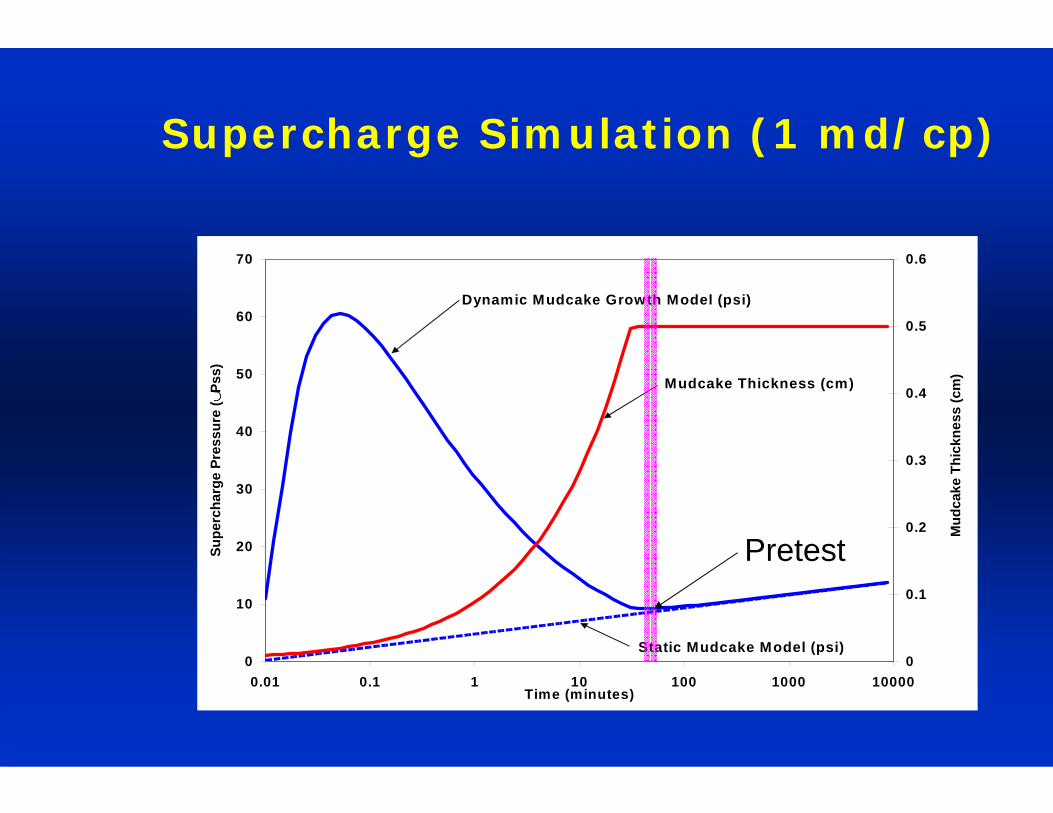
Supercharge Simulation (1 md/cp)
0
10
20
30
40
50
60
70
0.01 0.1 1 10 100 1000 10000Time (minutes)
Supe
rcha
rge
Pres
sure
( ∪Ps
s)
0
0.1
0.2
0.3
0.4
0.5
0.6
Mud
cake
Thi
ckne
ss (c
m)
Dynamic Mudcake Growth Model (psi)
Mudcake Thickness (cm)
Static Mudcake Model (psi)
Pretest
Page 30
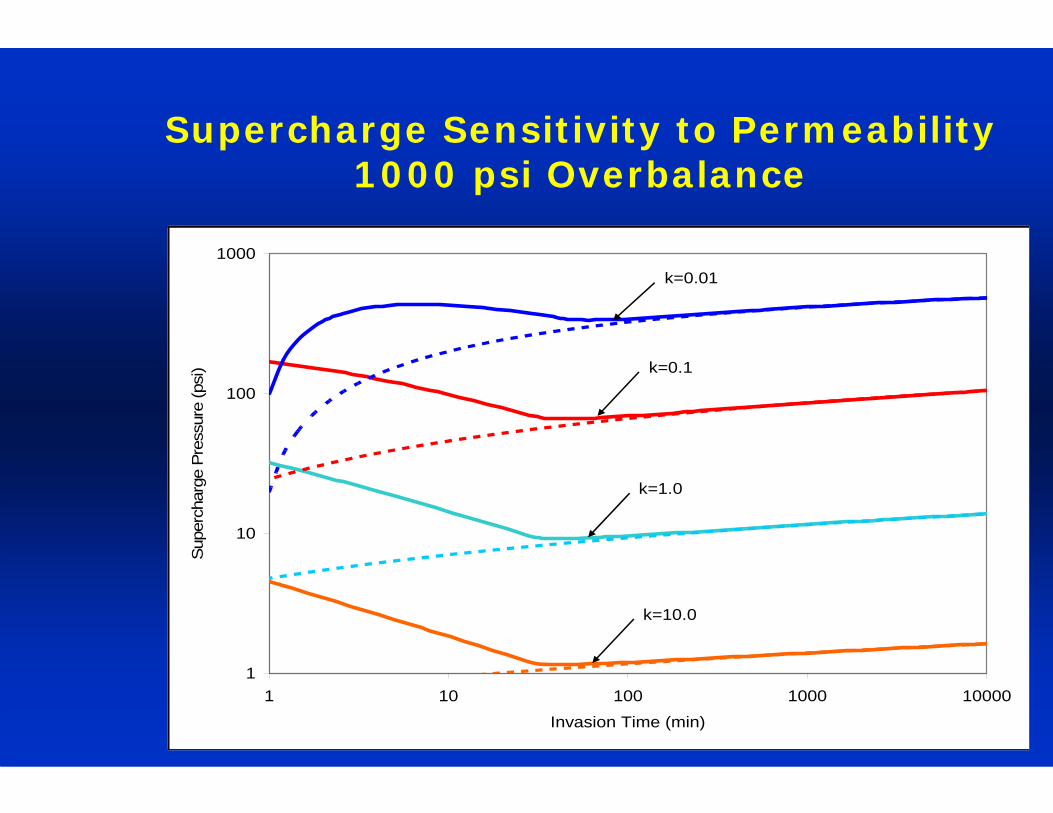
Supercharge Sensitivity to Permeability1000 psi Overbalance
1
10
100
1000
1 10 100 1000 10000
Invasion Time (min)
Sup
erch
arge
Pre
ssur
e (p
si)
k=0.01
k=0.1
k=1.0
k=10.0
Page 31
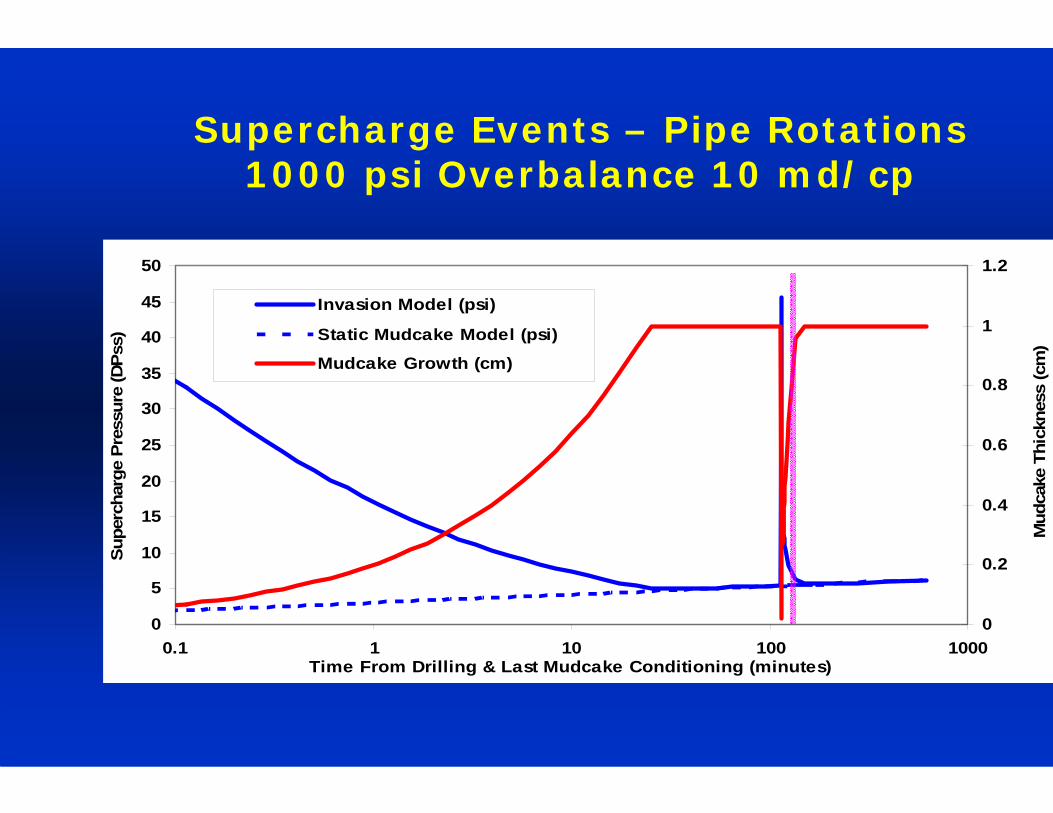
0
5
10
15
20
25
30
35
40
45
50
0.1 1 10 100 1000Time From Drilling & Last Mudcake Conditioning (minutes)
Sup
erch
arge
Pre
ssur
e (D
Pss)
0
0.2
0.4
0.6
0.8
1
1.2
Mud
cake
Thi
ckne
ss (c
m)
Invasion Model (psi)
Static Mudcake Model (psi)
Mudcake Growth (cm)
Supercharge Events – Pipe Rotations1000 psi Overbalance 10 md/cp
Page 32
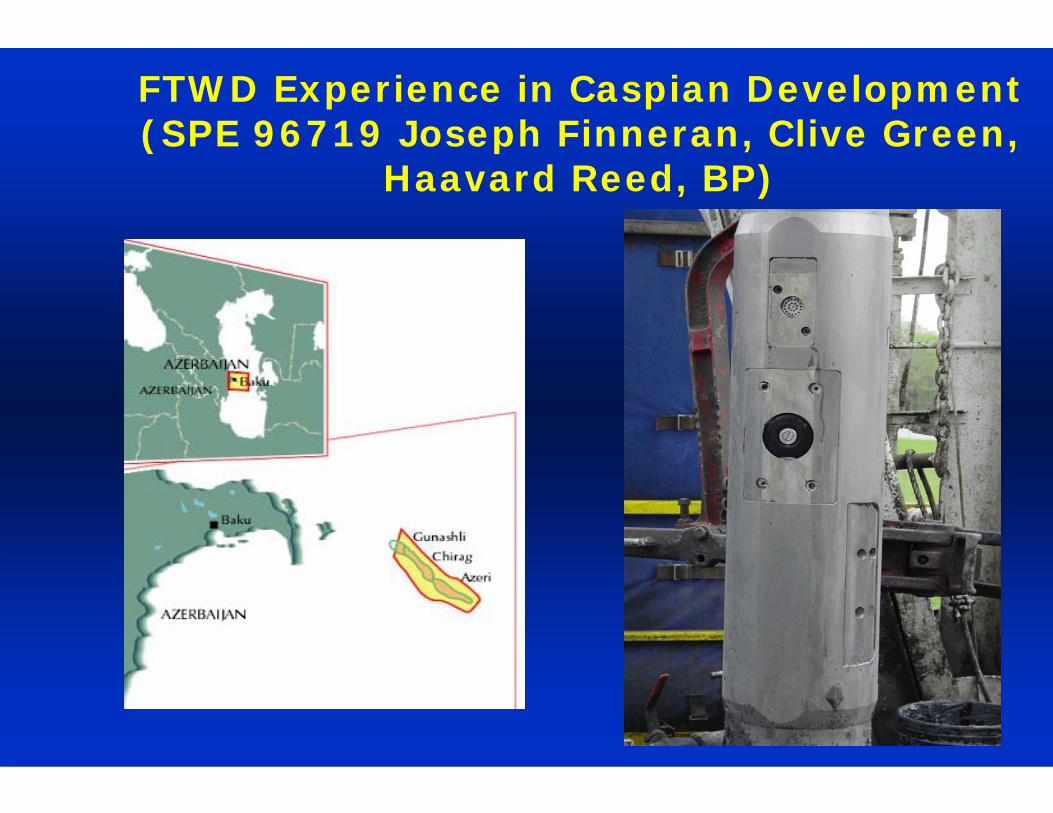
FTWD Experience in Caspian Development (SPE 96719 Joseph Finneran, Clive Green,
Haavard Reed, BP)
Page 33
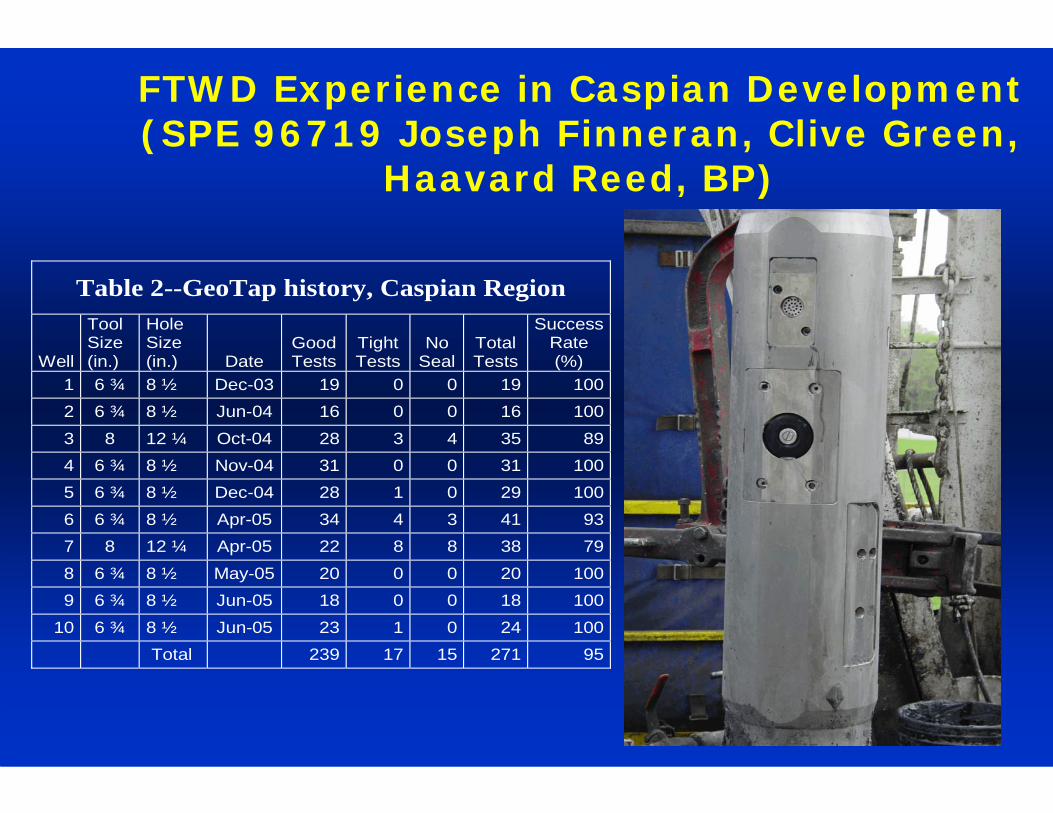
FTWD Experience in Caspian Development (SPE 96719 Joseph Finneran, Clive Green,
Haavard Reed, BP)
Table 2--GeoTap history, Caspian Region
Well
Tool Size (in.)
Hole Size (in.) Date
Good Tests
Tight Tests
No Seal
Total Tests
Success Rate (%)
1 6 ¾ 8 ½ Dec-03 19 0 0 19 100 2 6 ¾ 8 ½ Jun-04 16 0 0 16 1003 8 12 ¼ Oct-04 28 3 4 35 894 6 ¾ 8 ½ Nov-04 31 0 0 31 1005 6 ¾ 8 ½ Dec-04 28 1 0 29 1006 6 ¾ 8 ½ Apr-05 34 4 3 41 937 8 12 ¼ Apr-05 22 8 8 38 798 6 ¾ 8 ½ May-05 20 0 0 20 1009 6 ¾ 8 ½ Jun-05 18 0 0 18 100
10 6 ¾ 8 ½ Jun-05 23 1 0 24 100 Total 239 17 15 271 95
Page 34
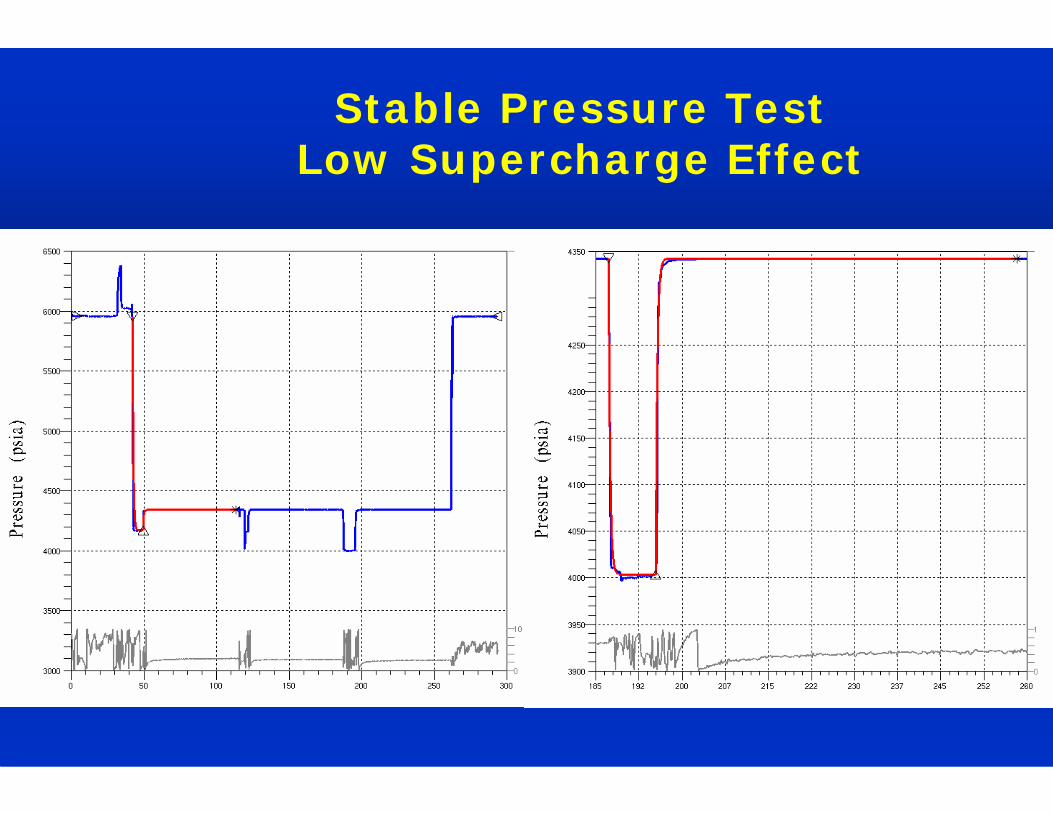
Stable Pressure TestLow Supercharge Effect
Page 35
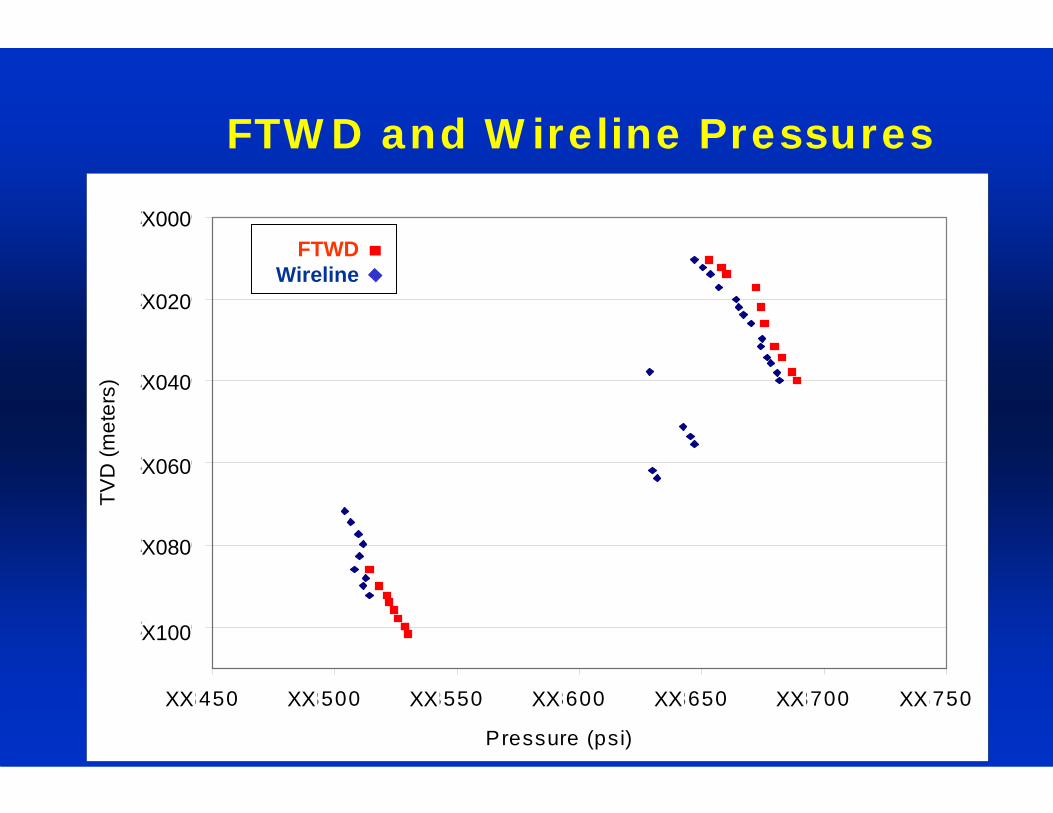
FTWD and Wireline Pressures
2650
2670
2690
2710
2730
2750
3450 3500 3550 3600 3650 3700 3750
Pressure (psi)
TVD
(met
ers)
X000
X020
X040
X060
X080
X100
XXXX XXXXXX XX XX
FTWDWireline
Page 36
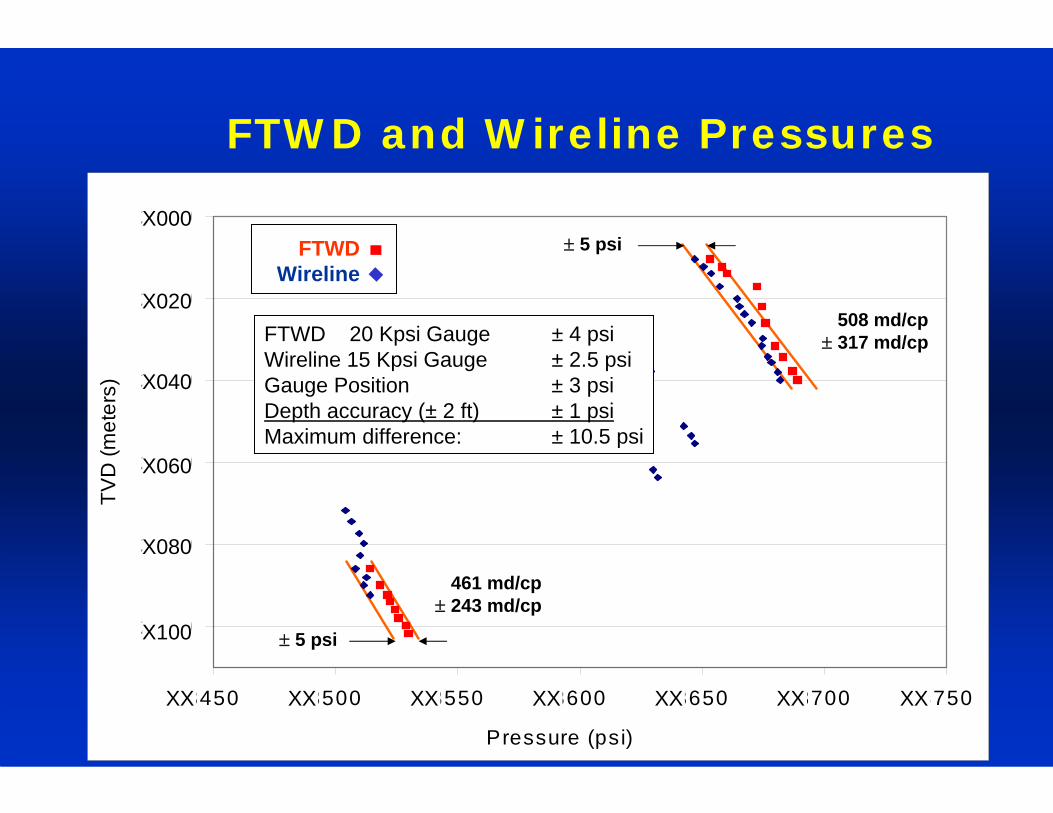
FTWD and Wireline Pressures
2650
2670
2690
2710
2730
2750
3450 3500 3550 3600 3650 3700 3750
Pressure (psi)
TVD
(met
ers)
X000
X020
X040
X060
X080
X100
XXXX XXXXXX XX XX
± 5 psi
461 md/cp± 243 md/cp
± 5 psi
508 md/cp± 317 md/cp
FTWDWireline
FTWD 20 Kpsi Gauge ± 4 psiWireline 15 Kpsi Gauge ± 2.5 psiGauge Position ± 3 psiDepth accuracy (± 2 ft) ± 1 psiMaximum difference: ± 10.5 psi
Page 37
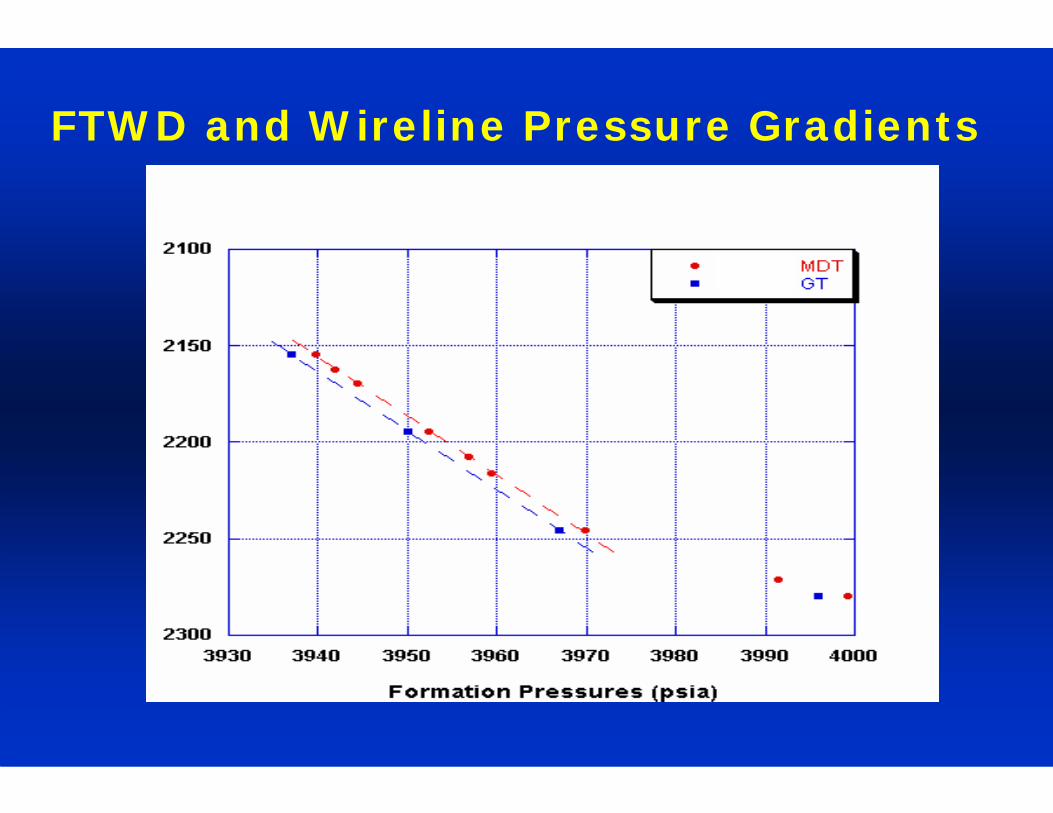
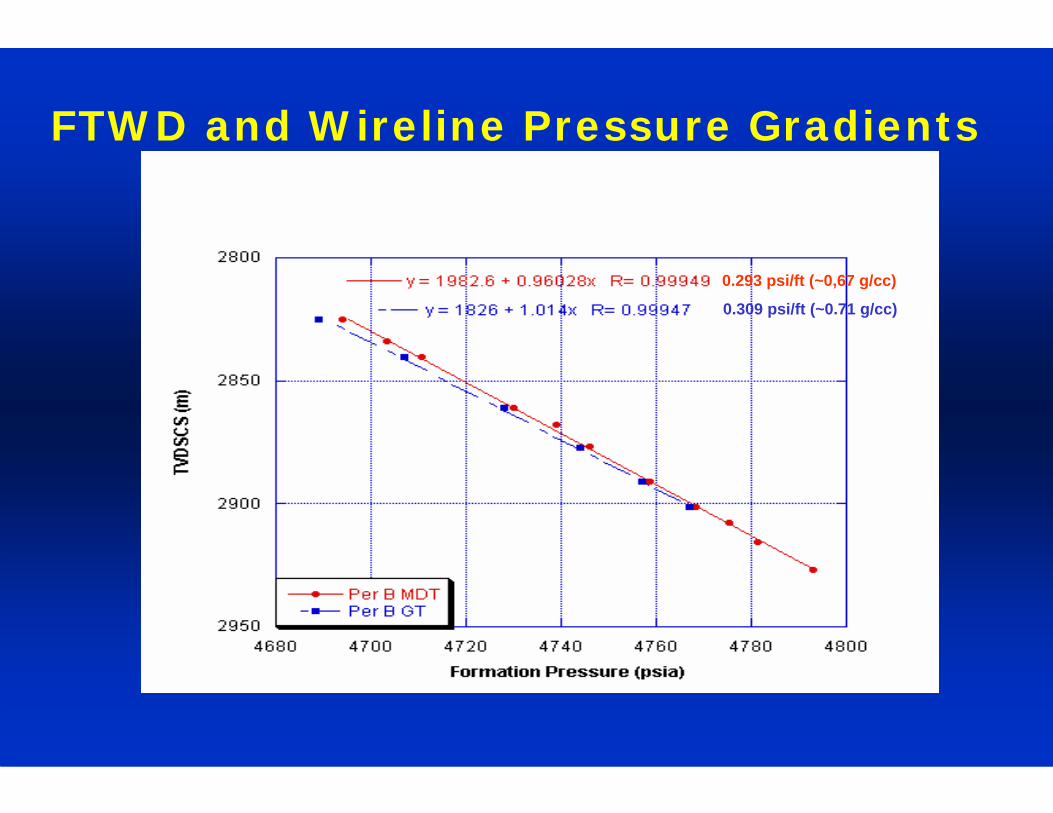
FTWD and Wireline Pressure Gradients
Page 38
0.293 psi/ft (~0,67 g/cc)
0.309 psi/ft (~0.71 g/cc)
FTWD and Wireline Pressure Gradients
Page 39
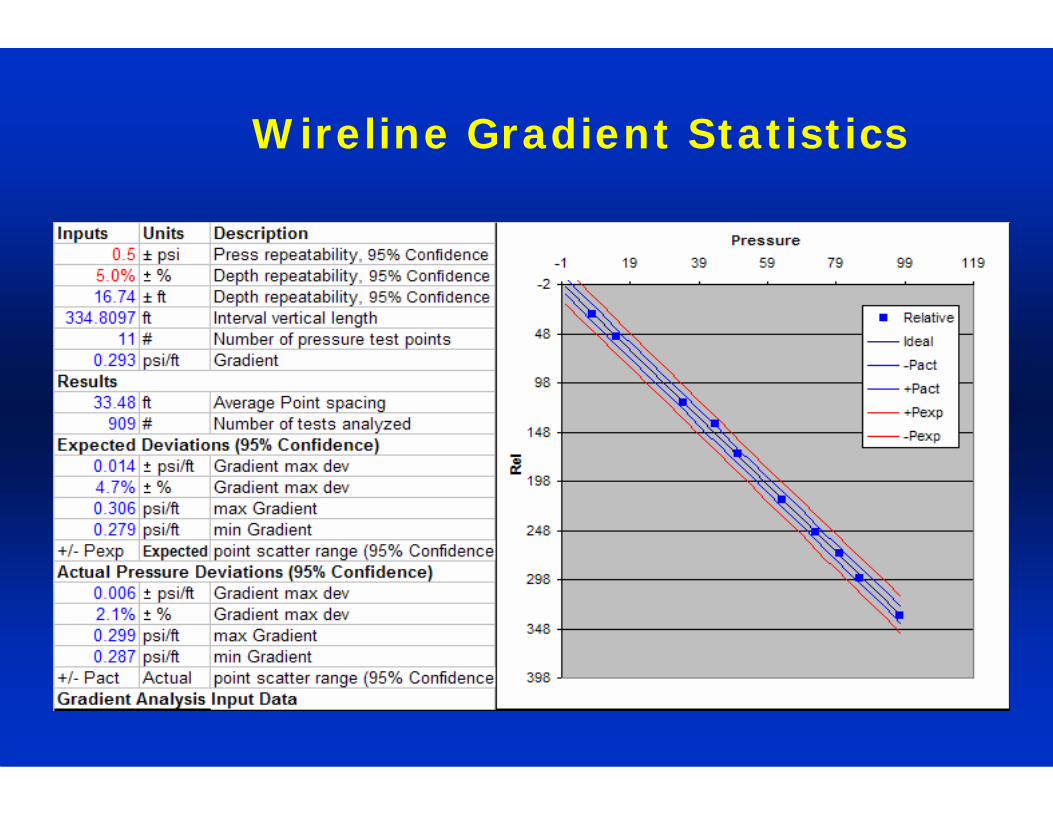
Wireline Gradient Statistics
Page 40
Wireline Gradient Statistics
Page 41
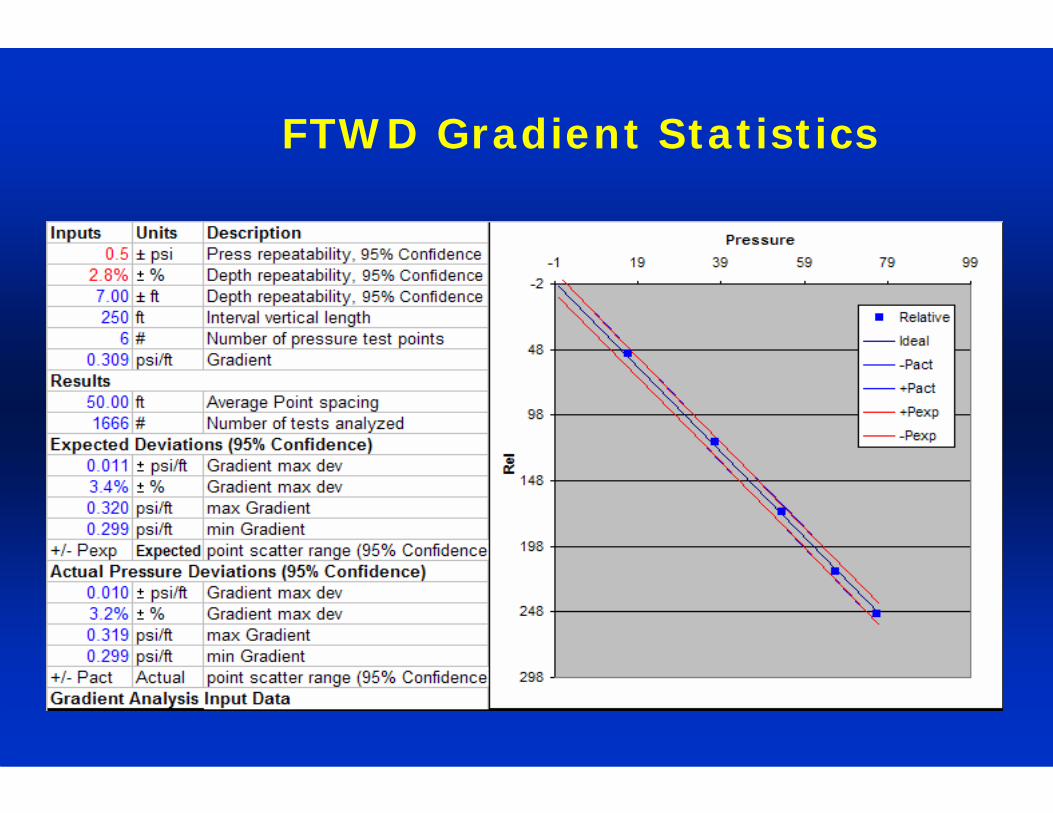
FTWD Gradient Statistics
Page 42
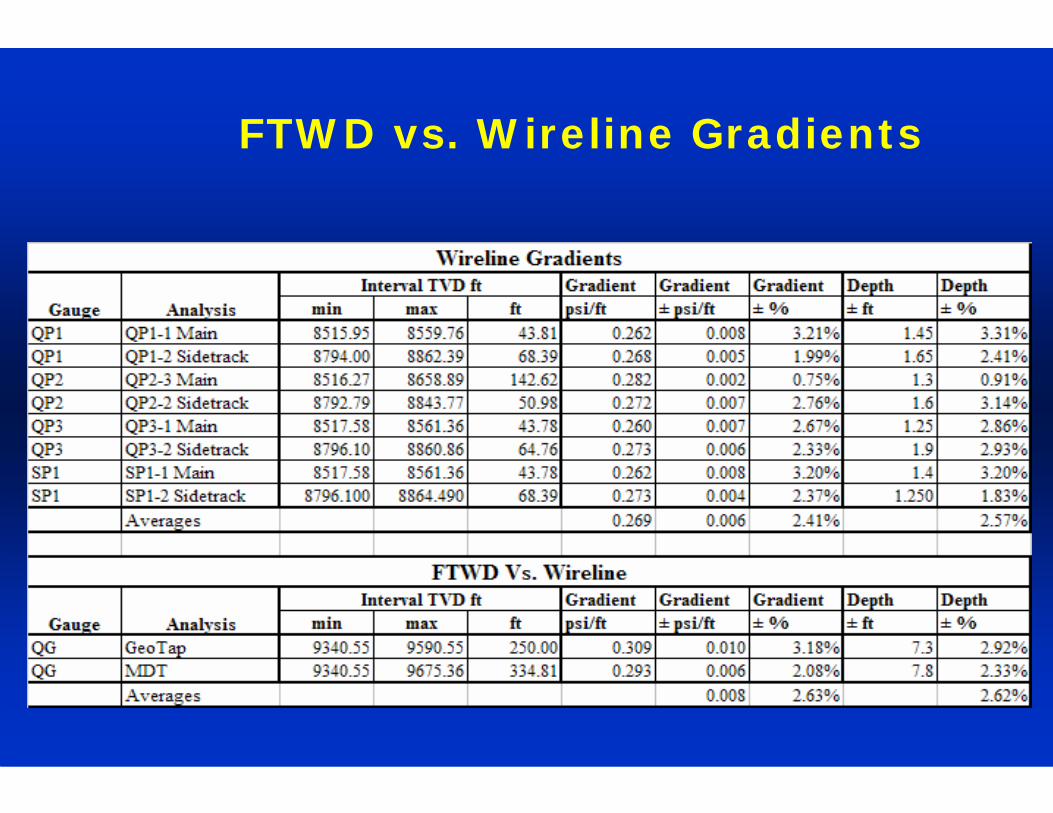
FTWD vs. Wireline Gradients
Page 43
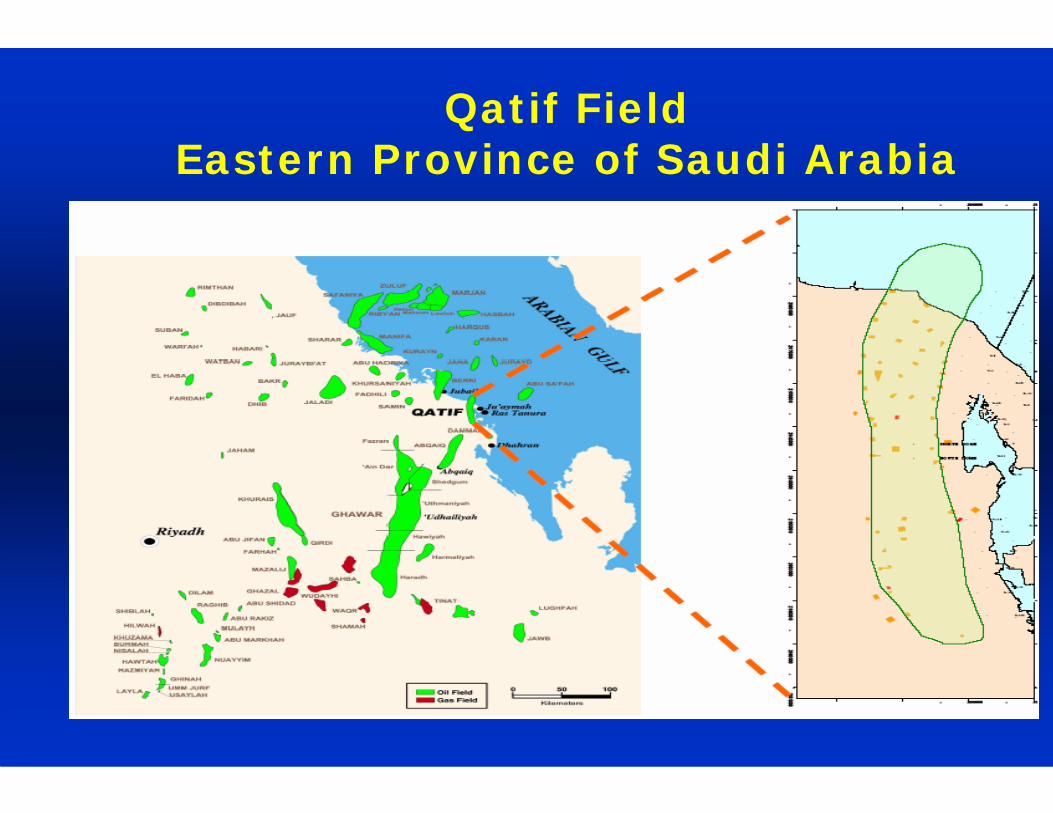
Qatif FieldEastern Province of Saudi Arabia
Page 44
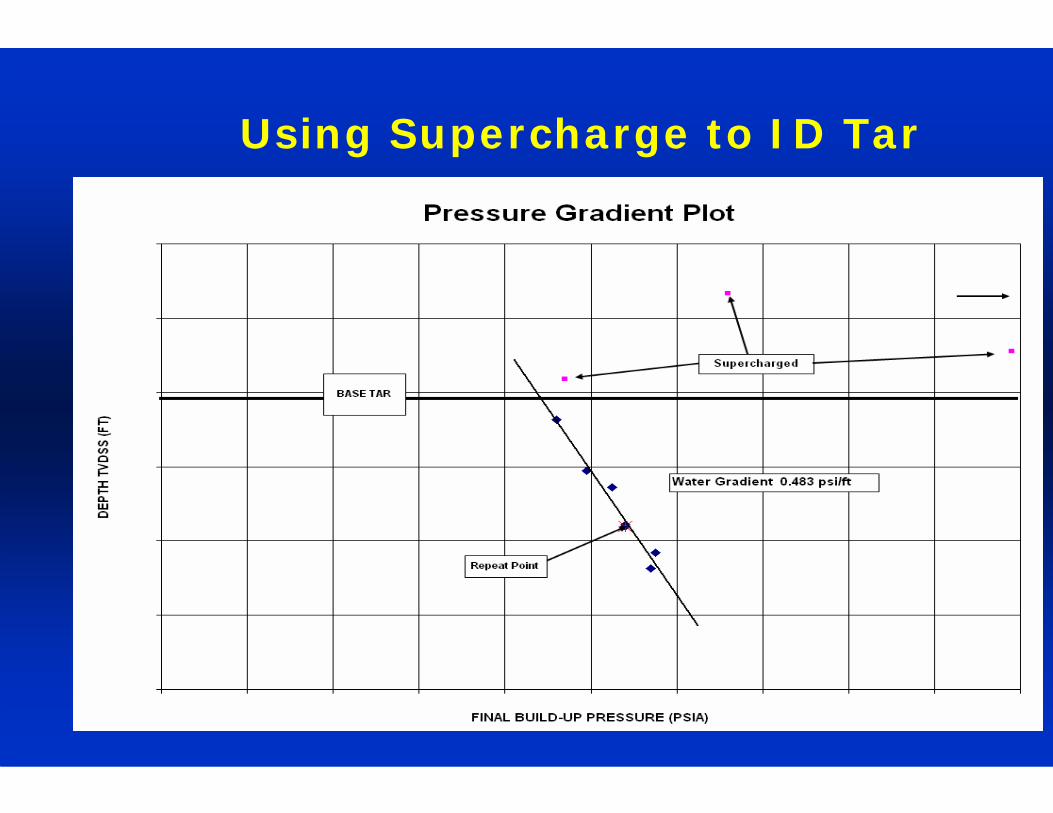
Using Supercharge to ID Tar
Page 45
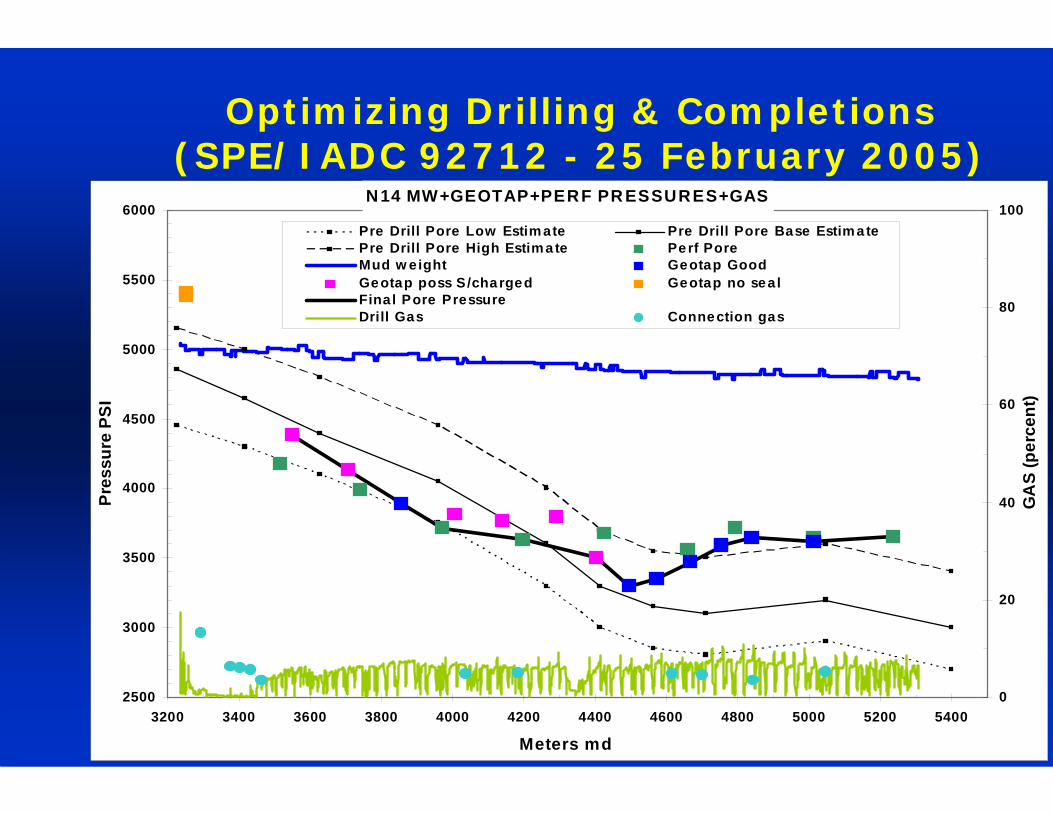
Optimizing Drilling & Completions (SPE/IADC 92712 - 25 February 2005)
N 14 MW+GEOTAP+PERF PR ESSURES+GAS
2500
3000
3500
4000
4500
5000
5500
6000
3200 3400 3600 3800 4000 4200 4400 4600 4800 5000 5200 5400
Meters md
Pre
ssur
e PS
I
0
20
40
60
80
100
GA
S (p
erce
nt)
Pre Drill Pore Low Estimate Pre Drill Pore Base EstimatePre Drill Pore High Estimate Perf PoreMud w eight Geotap GoodGeotap poss S/charged Geotap no sealFinal Pore PressureDrill Gas Connection gas
Page 46
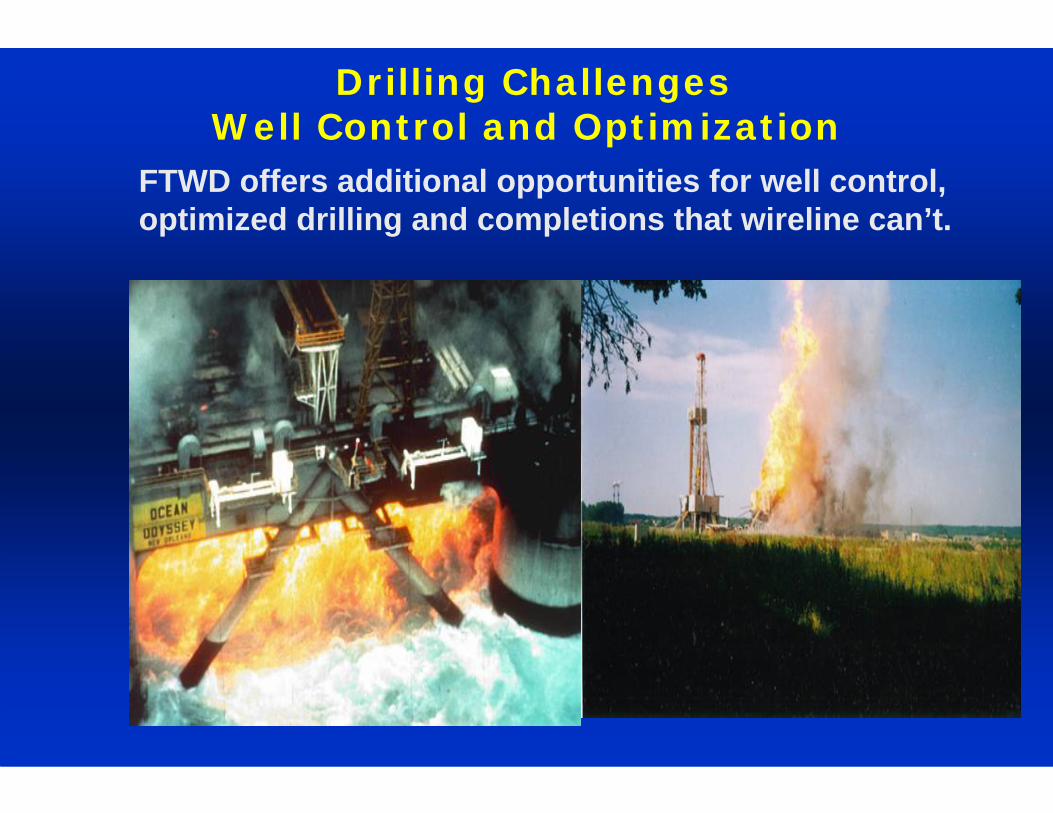
Drilling ChallengesWell Control and Optimization
FTWD offers additional opportunities for well control, optimized drilling and completions that wireline can’t.
Page 47
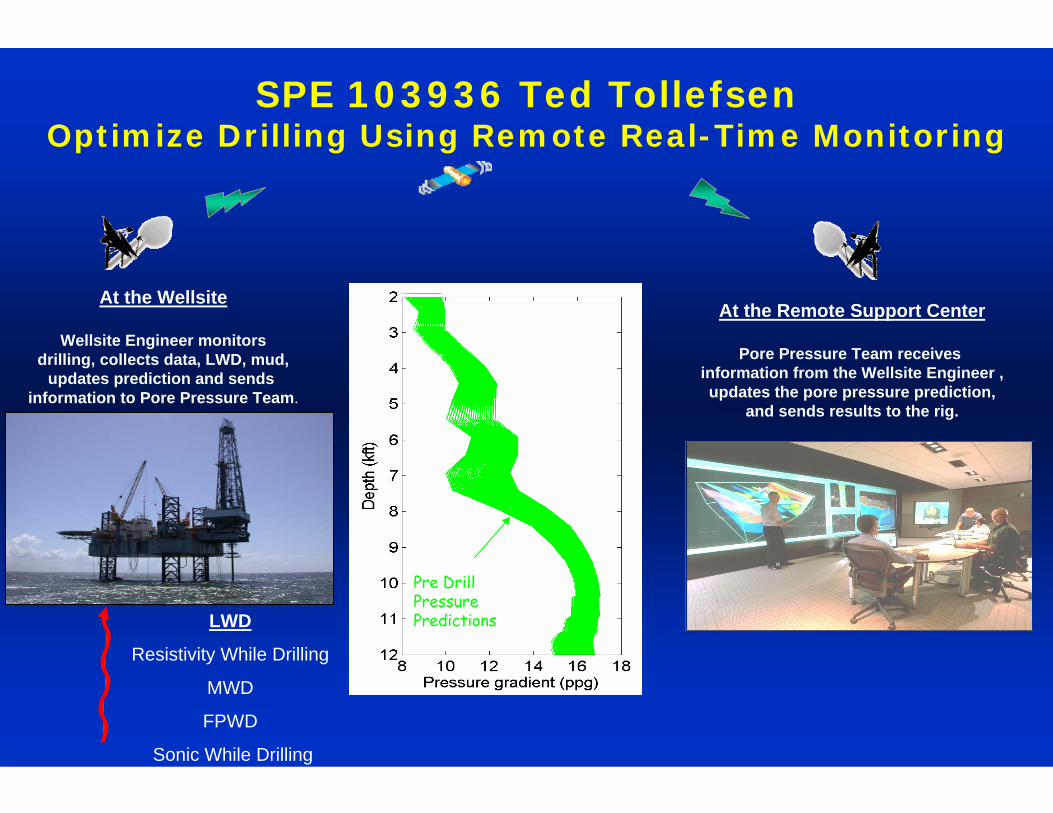
Pre DrillPressurePredictions
SPE 103936 Ted TollefsenOptimize Drilling Using Remote Real-Time Monitoring
LWD
Resistivity While Drilling
MWD
FPWD
Sonic While Drilling
At the Wellsite
Wellsite Engineer monitorsdrilling, collects data, LWD, mud,
updates prediction and sends information to Pore Pressure Team.
At the Remote Support Center
Pore Pressure Team receives information from the Wellsite Engineer ,updates the pore pressure prediction,
and sends results to the rig.
Page 48
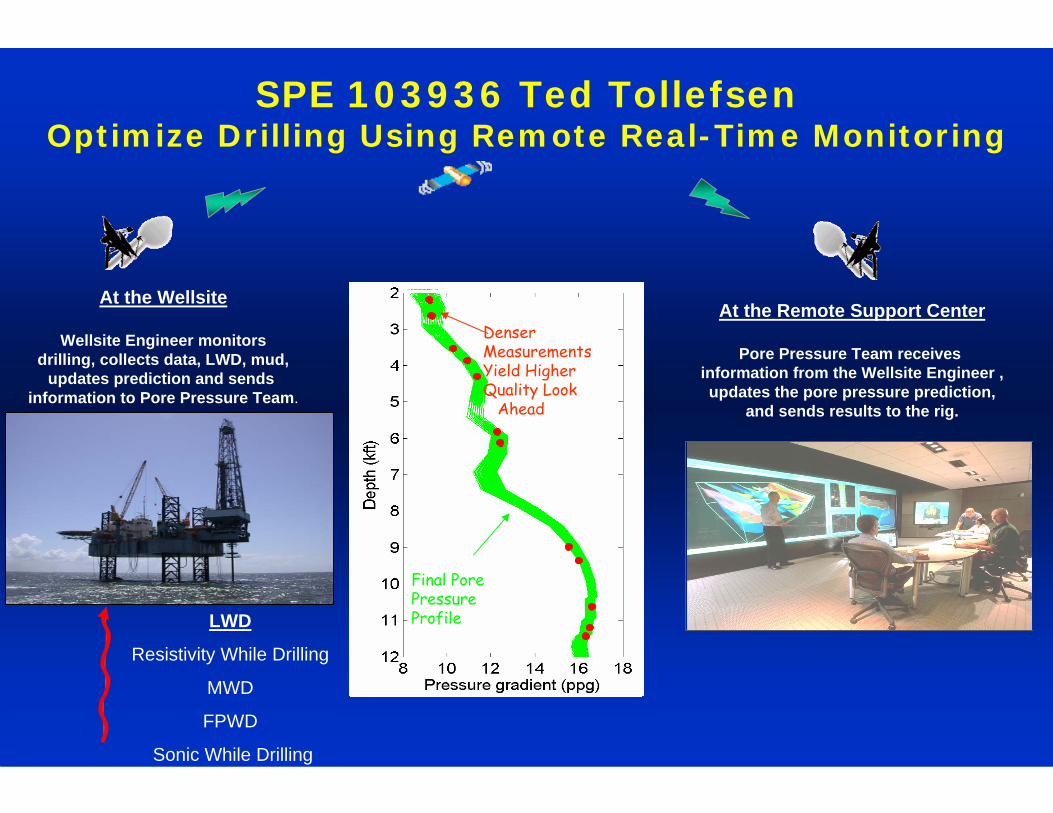
Pre DrillPressurePredictions
FormationPressureMeasured In Real Time
Real TimePressurePredictions
Formation PressureMeasured InPermeable Formations
Reducing Cone Of Uncertainty
Denser MeasurementsYield HigherQuality Look
Ahead
Final Pore PressureProfile
SPE 103936 Ted TollefsenOptimize Drilling Using Remote Real-Time Monitoring
LWD
Resistivity While Drilling
MWD
FPWD
Sonic While Drilling
At the Wellsite
Wellsite Engineer monitorsdrilling, collects data, LWD, mud,
updates prediction and sends information to Pore Pressure Team.
At the Remote Support Center
Pore Pressure Team receives information from the Wellsite Engineer ,updates the pore pressure prediction,
and sends results to the rig.
Page 49
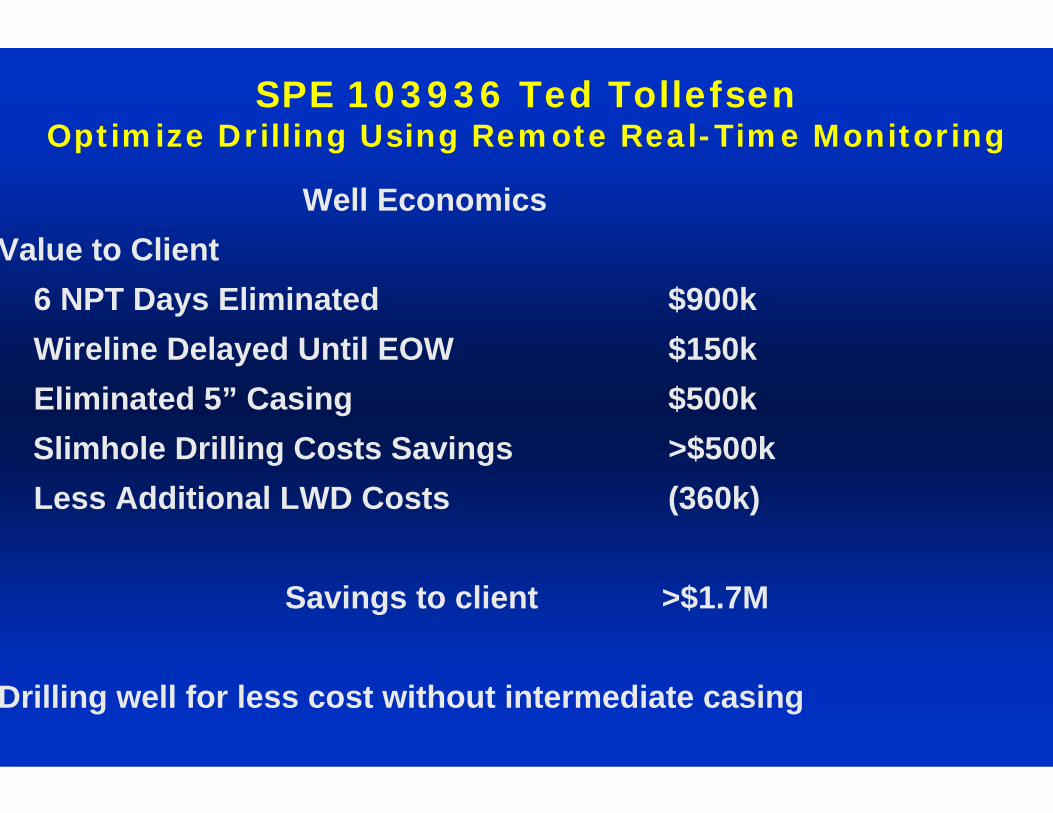
Well EconomicsValue to Client
6 NPT Days Eliminated $900kWireline Delayed Until EOW $150kEliminated 5” Casing $500kSlimhole Drilling Costs Savings >$500k Less Additional LWD Costs (360k)
Savings to client >$1.7M
Drilling well for less cost without intermediate casing
SPE 103936 Ted TollefsenOptimize Drilling Using Remote Real-Time Monitoring
Page 50
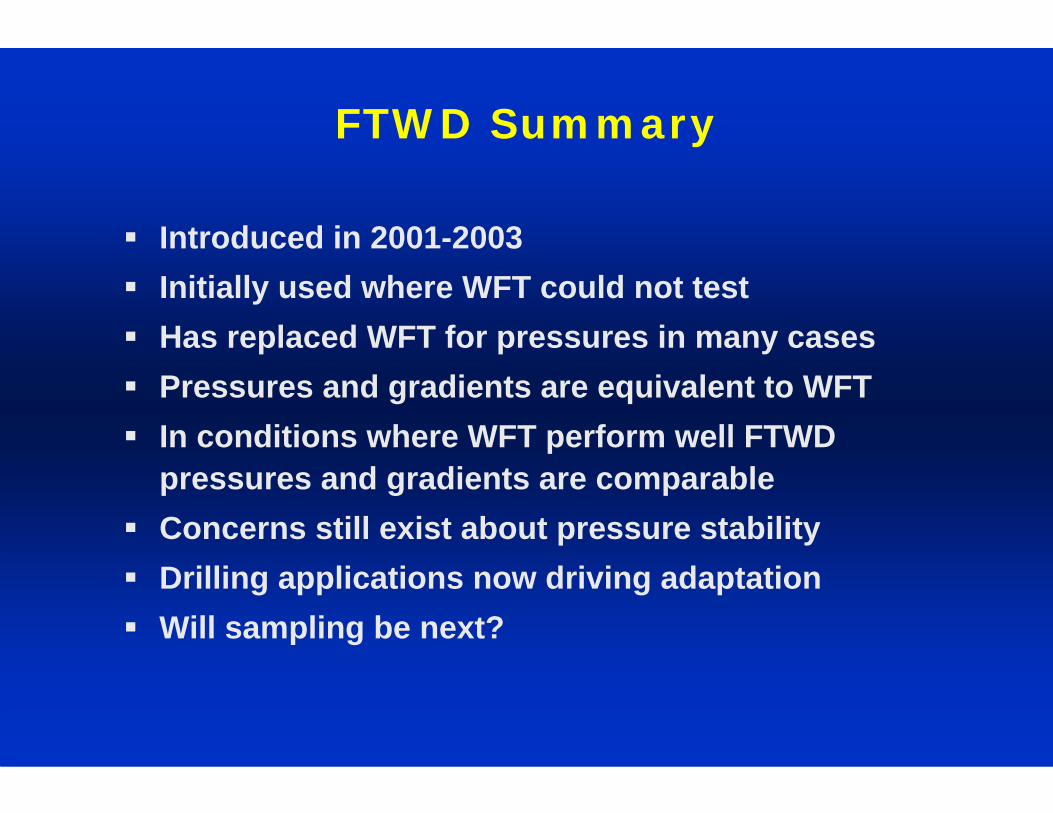
FTWD Summary
Introduced in 2001-2003Initially used where WFT could not testHas replaced WFT for pressures in many casesPressures and gradients are equivalent to WFTIn conditions where WFT perform well FTWD pressures and gradients are comparableConcerns still exist about pressure stabilityDrilling applications now driving adaptationWill sampling be next?