67
Report of the Public Company Task Force to the Special Committee on Enhanced Business Reporting June 2004 a American Institute of Certified Public Accountants

Report of the Public Company
Task Forceto the
Special Committee
on Enhanced Business
Reporting
J u n e 2 0 0 4
a
A m e r i c a n I n s t i t u t e o f C e r t i f i e d P u b l i c A c c o u n t a n t s

Introduction 3
Preparatory Notes 4
Executive Summary 6
Sample Reports Summary 10
Further Work
Appendix - Contributors 13
Sample Reports 15
Lintun Solutions, Inc.
KNZ A.G.
Galileo
eXchange
2
Contents

Introduction
This report has been prepared by the Public Company Task Force, (the “Task Force”) tothe Special Committee on Enhanced Business Reporting, (the “SCEBR”) of the AICPA.This document is the result of work conducted by the Task force between November2003 and June 2004.
These sample reports are not intended to be comprehensive. Rather, certain components of the business reports have been highlighted and presented here wherethe materials offer significant extensions to current practice. It is the intention of the TaskForce that the materials in these sample reports be considered as a collection of ideasfor potential enhancements to existing business reports and to offer contrasts with current methods of reporting.
These sample business reports were created primarily as a vehicle for authoring of material. While the Task Force has sought to organize this information in a logical formatthat is easy to follow, the intention is that this material be presented in an electronic formvia a web site and that the various components of this report be “tagged” using XBRL tofacilitate customized reporting and analysis by users of this information.
The mission of the SCEBR is:
“To establish a consortium of investors, creditors, regulators and management and other key stakeholders to improve the quality and transparency of information used for decision making.”
These sample enhanced business reports and the corresponding web presentations ofthis material have been prepared primarily to assist the SCEBR in communicating tointerested parties, some Enhanced Business Reporting concepts, as well as to assist theConsortium on Enhanced Business Reporting (the “Consortium”) in the planning andexecution of their work.
The sample reports draw from a number of business reporting frameworks. This varietyis intended to assist the Consortium in developing a comprehensive, proposed enhancedbusiness reporting framework(s). The frameworks expressed in these sample reports arenot intended to represent a proposed structure for an enhanced business reportingframework, although any one of these, or some combination, could fulfill such a role.
The Task Force recognizes that every company has a different perspective on the extentof competitive threats and litigation risk associated with the various components ofenhanced transparency. The Task Force did not attempt to apply these considerations asa filter in coming up with the ideas presented here or in the accompanying sampleenhanced business reports.
“In the late 19th century, long before securities laws came into effect, the New York Stock Exchange asked agroup of executives to disclose sales. The reaction was that sales were proprietary.”Source: An interview of Baruch Lev (and Bob Herz and Jonathon Low) by Lou Thompson Appearing in Investor Relations Quarterly, Volume 6, Number 1Published by National Investor Relations Institute
3
a

Preparatory Notes
The Public Company Task Force (the “Task Force”) was established by the SpecialCommittee of the American Institute of Certified Public Accountants in November 2003.The objective of the Task Force was to develop a set of sample business reports thatarticulate some of the potential approaches to enhanced business reporting. These sample reports are intended to prime the debate concerning enhancements to businessreporting. The reports generated were designed to include a demonstration of:
• The potential scope of enhanced business reports; i.e., examples of subjectmatter that may be considered for inclusion in a report
• where applicable, a range of alternatives for reporting on a particular element;e.g., a high degree of specificity regarding the components of a strategy disclosure vs. an open framework with general guidelines
• Sample disclosures for a number of industries
• Performance measures
• The application of XBRL and other technologies for business reporting.
• The potential benefits for stakeholders
• Commercial opportunities responsive to stakeholders needs
For the purposes of creating these sample reports, we have sought to include disclosuresthat provide information about the underlying relationships between the variety of internaland external value drivers and the company’s performance, sufficient to allow stakeholdersto obtain a reliable understanding of past performance, current situation and a reasonablebasis on which to predict future results.
The task force recognized that the following criteria should be considered in determiningthe scope of business reports:
1. Improves the quality of decision making in capital markets.
2. Value added to users, preparers and the information supply chain, exceeds costsassociated with preparation, disclosure and analysis
3. Comparable across time frames (can be consistently measured)
4. Does not significantly harm a company’s competitive position
5. Should be within management’s expertise to provide
The task force focused mainly on the first of these criteria above. A variety of thinking onthe other criteria is illustrated throughout the sample enhanced business reports. In addi-tion, the following criteria were considered to be desirable, and should be more fullyexplored:
• Applicable internationally
• Comparable across companies
• Suitable for timely measurement, reporting and analysis
• Can be measured with an acceptable degree of accuracy
4
Scope and Objectives
Criteria
American Institute of Certified Public Acountants

Given the objective of the task force to prime debate concerning business reporting,these sample reports were prepared with the aim of demonstrating the variety ofapproaches that can be taken across the spectrum of content elements. Accordingly,variations in each of the following dimensions are either demonstrated or referenced inthe sample reports:
1. The enhanced business reporting framework
2. Level of detail provided
3. Approaches to forward looking statements
4. Measurement uncertainty
5. Presentation format
These sample enhanced business reports are intended to represent hypothetical companies.Any similarities to actual companies or persons are coincidental and unintended.
Appendix — Contributors lists those who contributed to the development of this reportand the underlying sample enhanced business reports.
5
Dimensions
Identity
Contributors
American Institute of Certified Public Acountants

Executive Summary
The following key issues were identified in the course of the work of the Task Force. Thepotential solutions suggested here are reflected in the sample enhanced businessreports prepared by the Task Force.
Lack of a generally accepted framework makes access to information by users inefficient,comparability across companies, timeframes and countries difficult. It also results in information being produced that is irrelevant to many users.
Current reporting models do not explicitly provide information about the underlying relationships between the variety of internal and external value drivers and the company’sperformance, sufficient to allow stakeholders to obtain a reliable understanding of pastperformance, current situation and a reasonable basis on which to predict future results
Develop a generally accepted framework for enhanced business reporting.
Preparers, analysts and other users of business information argue that much of the contentof business reports is irrelevant. This represents a burden on both preparers and users ofbusiness information.
Move towards a “demand-pull” model that allows users of business information to identifyand extract those elements that they consider most important. This model would provideongoing feedback to preparers, regulators and others on how well reports are respondingto user needs.
Leverage XBRL to help facilitate this process.
Management face trade-off decisions when allocating scarce resources between projectswith short and long term paybacks. Increasingly, competitive advantage and future growthpotential are defined by a company’s command of intangible resources rather than tangibleresources. Thus retention of key personnel, organizational design, innovation processes etcare taking on more significance1. However, intangibles are hard to value and evidenceshows that the market consistently undervalues companies’ investments in intangibles.Accordingly, management have an incentive to invest for shorter term performance at theexpense of future growth.2
e.g. Various studies show that investment in Research and Development is barely keepingpace with inflation while the number of new patents being filed is on the decline.
Consider monitoring and reporting indicators of growth potential.
Present a group of performance metrics that reflect progress toward the collection of
6
Identification of aReporting Framework Issues
Possible Solutions
Relevancy of InformationIssues
Possible Solutions
Long Term vs ShortTerm PerformanceIssues
Possible Solutions
American Institute of Certified Public Acountants

strategic goals rather than just focusing on one. These metrics are ideally a subset ofthose used by management for internal monitoring and comprise a combination of laggingand leading indicators following recognized standard industry practice where applicable.
See discussion below regarding disclosure of observed relationships between value driversand progress towards business goals.
Current business reporting models do not provide for reporting of returns on capitalinvestments. This provides an opportunity for those seeking to manage current earningsby classifying current period expenses as capital investments. This reduces the value ofreported current period performance. Even where no misclassification of expensesoccurs, the lack of reporting of returns on long term investments makes it difficult forreaders of reports to obtain a complete picture of the profitability of the business and theeffectiveness of management’s investment strategies
Make specific provisions in future reporting models to report returns on capital investmentsto allow users to consider both current and long term investment returns when analyzingtotal profitability.
Forward looking information is typically limited in business reports today, providing littleguidance to analysts and others interested in forecasting future performance.Management are discouraged from increasing disclosure of their expectations regardingfuture performance due to concerns regarding potential litigation risk should their expectations not be met.
Greater transparency of the key drivers of value for the business and the relationshipthat management have observed to exist between these drivers and progress towardsbusiness goals would provide users of business reports with a sound basis on which toconstruct models for predicting future performance. A disclosure of these observed relationships would be further enhanced by management adding any commentaryregarding observations of changes that have been observed to be taking place betweenthese value drivers and business goals.
Where management believes that these relationships between value drivers and performance are likely to change in future periods due to either trends that have surfacedin the current period, or known events, we have demonstrated the principle of managementproviding additional information regarding the anticipated direction of change in theunderlying relationships.
Since such a discussion would not be projecting future performance, it would not increasemanagement’s exposure to litigation risk, but leave intermediaries and other users of business reports to form their own, informed expectations based on this information.
7
Tracking Capital ProjectPerformanceIssues
Possible Solutions
Forward-LookingInformationIssues
Possible Solutions
American Institute of Certified Public Acountants

The focus on projected earnings leads the market to over-react when projections of theone measure are not met and, in-turn, leads management to over-emphasize the need tomake their projected earnings number. Recent studies have shown that a significant proportion of S&P 500 companies make projected earnings within 1¢ – an indication ofearnings management.
In addition to the points above, provide greater disclosure of the inherent uncertainty inprojecting performance on any metric. Consider disclosing a range of estimates in placeof a single number (as some companies already do), or provide information to allowreaders to construct these ranges (standard deviation and population size data).
With few exceptions reported, quantitative information is subject to measurement and/orestimation error. Reporting a single value implies a degree of precision that is typicallylacking and sets expectations by users of business reports that are not sustainable.While these measurement and estimation errors should play a lesser role when viewinglong term trends, they have the potential to play a significant role in the short term.
Report historic numbers as a range rather than a point estimate
Management and auditors have a responsibility to ensure that reported financial informationis not “materially” misstated. However, this concept is subjective and poorly understood bythe majority of readers of business reports. At the margin, these reporting errors will leadsome managers and investors to make sub-optimal decisions.
Disclose sufficient information for users of reports to be able to substitute management’sestimates underlying quantitative data with their own and to see the impact on businessperformance and position.
Much work has been done to define the boundaries of an organization for financial reportingpurposes. This is not true for non-financial metrics, making comparison between reportednon-financial measures difficult. For example, when disclosing number of personnel – doesthis include part-time, casual labor, personnel from equity investments, personnel fromalliance partners, spouses? When disclosing investments in patents and copyrights andcorresponding returns, do these include investments made by joint ventures in which thebusiness does not own a controlling interest?
Ultimately develop industry specific standards for non-financial measurement.
In the interim, disclose the basis used for calculation in sufficient detail to allow users torecompute on alternative basis
8
Earnings Projectionsand EarningsManagementIssues
Possible Solutions
Assumptions of InherentAccuracy in ReportedFiguresIssues
Possible Solutions
Issues
Possible Solutions
Defining the Boundariesof the OrganizationIssues
Possible Solutions
American Institute of Certified Public Acountants

Assurance
Issues
Possible Solutions
Facilitating the extraction of information elements by users to be delivered in formatsdefined by those users leaves existing audit reports unhelpful since today’s audit reportsassume readers are viewing the financial statements taken as a whole rather thanextracts from the financial statements.
Furthermore, if business reporting is to increase in frequency, the current approach ofproviding assurance on a complete set of financial statements is likely to become anobstacle.
Develop concepts of data level integrity, and several levels of assurance, standards forprocess interruption and meta-control and assurance attributes together with correspondingauditing standards.
Conceptualize methodologies of continuous, process-by-process assurance.
1 Baruch Lev — Sharpening the Intangibles Edge — September 2003 and the PRISM Report 2003.2 Recent studies by AssetEconomics have shown that approximately two thirds of the market value of the Russell
3,000 is attributable to expectations of future growth. However, research by Baruch Lev has shown the level ofinvestment in R&D in the United States to be at the same level in 2000 as it was in 1960.
9
American Institute of Certified Public Acountants

The Sample Reports
The Task Force has compiled two “Sample Enhanced Business Reports” (LintunSolutions, Inc. and KNZ AG) through which it has articulated the potential solutions summarized above and a variety of other related ideas. Two additional presentationshave been prepared that include sample disclosures and information access ideas fortwo other companies "Galileo" and "eXchange". These two sample enhanced businessreports and the two presentations together with their key themes are as follows:
While Lintun, KNZ and eXchange present ideas that are potential enhancements to existingreporting, the "Galileo" sample report presents ideas that are further departures from current practice.
10
American Institute of Certified Public Acountants
Key Themes Lintun KNZ AG Galileo eXchange
Disclosing key value drivers and their role in driving performance √ √ √
Utilizing web delivery of information to enhance accessibility through:
a) Providing access to detailed information by allowing readers to “click through” √ √ √from summary level information components.
b) Providing multiple ways for readers to navigate to detailed information to facilitate delivery of only relevant √ √ √details dependant upon the context of the reader’s inquiry.
Facilitating easier analysis of results through the utilization of generally accepted taxonomies and electronic √ √ √tagging (XBRL).
Disclose the role of intangible value drivers in delivering current and future performance. √ √ √ √
Disclosing measurement uncertainties inherent in reported quantitative information √
Adopting an external reporting approach based upon management’s √ √internal reporting.
Disclosing a balance of performance metrics to capture both current period performance √ √ √as well as future growth potential.
Allowing users to access company relevantinformation from third party sources √ √including peer group information.
Enabling readers to select which group entities to include or exclude √from consolidated results.
Disclose level and source of assurance for financial and non-financial information. √ √

American Institute of Certified Public Acountants
11
Further Work
The Task Force recommends the follow topics be subject to further study and consideration:
1. Off Balance Sheet transactions and relationships — Potential claims on thecash flows of a business arising from relationships with third parties, but which donot appear as liabilities on the balance sheet. Further thought needs to be givenas to how best to clearly communicate such exposures. In particular, where thesepotential claims are triggered by certain variables meeting or exceeding certainpredefined values, consider ways of highlighting these “trigger points” togetherwith the impact on cash flows that result.
2. Input from attorneys and Regulators Is needed on at least two points:i. Disincentives to disclose — In the United States, at least, the security laws pres-
ent a disincentive for preparers to include anything that goes beyond the minimum requirements. For example: Including forward looking statements in a press releaserather than in a 10-k filing allows the preparer to avoid the potentially greater penaltiesassociated with misleading statements appearing in public filings. (Despite the safeharbor provisions contained in the securities law relating to such disclosures.)
ii. Summary information — Presentation of summary information presents apotential legal problem. Since a summary, by definition, requires that the preparer omit certain information, there is a risk that the reader, who relies onthe summary without reading the detail, may be harmed. The solution wouldseem to be to ensure that the most important information be included in thesummary. For example, when purchasing a car, prospective buyers are presented with summary level information of the car’s features, and when reading the instruction manual, certain safety warnings are highlighted.However, the prospective purchaser is not presented with a comprehensivereport containing all information about every component of the vehicle and norwould most buyers find such information relevant or useful.
3. Plain English — This objective is one that requires more careful thought. Someguidance would be useful on how a preparer might assess the extent to whichthey have complied with this objective. There is a natural tendency for preparersto slip into technical jargon and complex terminology, particularly at the moredetailed levels of discussion. One solution might be to determine whether a “manin the street,” or to quote an English legal term, “a man on the Clapham omnibus,”would be able to properly understand what has been written. Where there is noavoiding the use of complex terms or jargon, an interpretation should be madeavailable.
4. Information integrity attributes — Consider including integrity attributes of business information to help internal and external users. These attributes couldinclude an indication as to which control processes the information has been subjectto in order to help the user determine the level of reliability of the information.
5. Ensuring quality analysis of results — Regulators are increasingly addingspecificity to their requirements for management to analyze and discuss the businessresults for the period and its economic condition. However, there continue to bemany companies who provide little insight in their analysis. One way to encourageimprovements in this area is to develop and promote a set of generally acceptedguidelines and corresponding taxonomy. This would ensure that the readers areprovided with a sufficient degree of specificity. The capital markets (and potentiallyregulators) will appropriately reward and penalize accordingly.

12
6. Utilization of Technology in Reporting — The paper medium substantially limitsthe detail, timeliness and richness of information disclosure. Research is neededon provisioning information close to real time (continuous reporting), providinghighly dis-aggregated data, providing real-time assurance, and providing webaccess using rich database access delivery methodologies.
American Institute of Certified Public Acountants

Appendix – Contributors
Members of the Public Company Task Force
Paul Herring (Grant Thornton – Chair)
Joel Burzin (Grant Thornton – Retired)
Robert Eccles (Advisory Capital)
Mike Krzus (Grant Thornton)
Robert J. Laux (Microsoft Corporation)
Steven Lilien (Baruch College)
Sandeep Patel (Standard & Poors)
Amy Pawlicki (American Institute of Certified Public Accountants)
Miklos Vasarhelyi (Rutgers University)
The Task Force is most grateful to the following for their contributions to the preparationof this report. Any remaining errors and omissions are the responsibility of the TaskForce. The views represented in this report may not, in all instances, reflect the views ofthese individuals or the organizations which they represent:
Observers
Michael Alles (Rutgers University)
Stephen Bryan (Wake Forest University)
Tim Coville (Rutgers University)
Lynne Farber (Baruch College)
Rani Hoitash (Suffolk University)
Pat McConnell (Bear Stearns and CFA Institute)
Tom O’Rourke (St Charles Consulting Group)
David Smith (Smithink)
Jennifer Sullivan (Financial Accounting Standards Board)
Alison Thomas (PriceWaterhouseCoopers)
Other Contributors
John Ballow (Accenture)
Satyen S. Bhatt (Wake Forest University)
Michael Bray (KPMG)
Roland Burgman (AssetEconomics)
Jane Calvert-Lee (Confederation of British Industry)
13
American Institute of Certified Public Acountants

American Institute of Certified Public Acountants
Lucy Crofts (PriceWaterhouseCoopers)
Guillaume Danis (Metapraxis)
Robert K. Elliott (KPMG – Retired)
Paul Gladen (Independent)
Susan Hinds (Toyota)
Charlie Hoffman (UBmatrix)
Louis Iacovelli (TIBCO)
Greg Jonas (Moody’s)
Pam Kalafut (Predictiv)
David Larcker (The Wharton School - University of Pennsylvania)
Gina Lee (American Institute of Certified Public Accountants)
Baruch Lev (Stern School of Business at NYU)
Jon Low (Predictiv)
Jon Lukomnik (International Corporate Governance Network)
Josef MacDonald (International Accounting Standards Board)
Eric Miller (EM3 Design)
Scott Mitchell (OCEG)
Diane Mueller (BlastRadius)
Jeff Naumann (American Institute of Certified Public Accountants)
Mark O’Sullivan (PriceWaterhouseCoopers)
Amy Ripepi (Financial Reporting Advisors)
Bill Swirsky (Canadian Institute of Chartered Accountants)
Aditya Tole (Baruch College)
Kimberly Vonder Fecht (Rutgers University)
Hugh Wallis (Hyperion)
Peter Wallison (American Enterprise Institute)
Mike Willis (PriceWaterhouseCoopers)
Yue Zhang (Rutgers)
14

Lintun Solutions, Inc. Business Report 200515
Forward Looking Statements - In this report we make forward
looking statements about the company's financial condition,
results of operations, plans, objectives, future performance and
business. The words estimate, expect, intend, plan, project,
target, can, could, may, should, will, would or similar expressions
are part of forward looking statements. These statements involve
risks and uncertainties. Future results may differ from those
included in our forward looking statements.

Definition of Terms 17
About Lintun 18
Business at a Glance 18
Mission and Strategy 18
Product and Services
Performance 19
Governance 20
Social Responsibility 24
Market Overview — Network and Computers Division 25
Competition 25
Regulatory Environment 27
Macro-Economic 28
Strategy 29
Overview 29
Strategic Priorities 30
Operational Goals 30
Risks And Risk Management 33
Opportunities 37
Value Drivers 38
Performance 41
Summary 41
Supply Chain Innovation 41
Direct Customer Channel 43
Strategic Acquisitions
Product Innovation 47
Attract, Develop and Retain the Best People 49
Sensitivity Analysis 52
Macro-Economic Factors 52
Management Estimates 53
Projections 55
Financial Information 54
Appendix I — Bibliography 59
Appendix II — Performance Indicators 60
Appendix III — Risk Taxonomy 61
Appendix IV — Corporate Values, Ethics and Compliance 62
Contents
16

Definition of Terms
The following terms used in this report are intended to have the following meanings:
A process of profitably matching internal resources with constantly changing external demands.
Results of implementation of strategy.
Attributes, factors, competencies or resources that promote effective execution of strategies.
Desired outcomes.
Metrics that track outcomes of financial and non-financial variables that may either lead or lag overall corporate performance. These metrics taken together provide a view of the effectiveness of execution of the company’s strategy.
Operating Profit less Taxes less Cost of Capital.
Strategy definition provided by Jim Schrager, Clinical Professor of Entrepreneurship andStrategic Management – University of Chicago
17
Strategy
Outcomes
Value Drivers/Enablers
Objectives/Goals
Key Performance Indicators
Economic Profit
connecting you to the rest of the world

Business at a Glance
Lintun’s mission is to be a premier provider of products and services required for customers worldwide to build their information-technology and Internet infrastructures bydelivering the best possible customer experience by directly selling standards-basedcomputing products and services.
Lintun is enhancing and broadening the fundamental competitive advantages of the directcustomer model by applying the efficiencies of the Internet to its entire business. Thecompany is also working to become a worldwide leader in networking for the Internet.
Lintun is pursuing a strategy of continuous improvements in efficiency balanced withaggressive growth. The improvements in efficiency are focused on delivering superiorresponsiveness to customer demands at a lower cost than the competition. Aggressivegrowth is achieved through a program of strategic acquisitions combined with leveragingthe company’s lower cost base to drive organic growth via price competition. Both efficiency and growth strategies are reinforced by the Company’s strategy of attracting,developing and retaining the best people.
Lintun competes in a wide range of products and services as follows:
Desktops - 18%
Notebooks - 19%
Servers - 14%
Workstations 5%
Storage 4%
Networking 7%
Software 22%
Peripherals 11%
(percentages based on 2005 revenues).
Further discussion of Lintun's market share and competition in each of these marketscan be found in the Market Overview section of this report.
18
Mission and Strategy
Products and Services
About Lintun

As can be seen from the following table, the company fell just short of its goal forEconomic Profit for 2005 but met its goals for Revenue, Long Term EPS Growth and Personnel Retention. Although Economic Profit and Net Income are healthy, they lag behind the rest of the Computer Industry sector because of our strategy ofinvestment in top people and strategic acquisitions to ensure future growth rates well in excess of the sector. The company is not currently paying dividends due to theneed for ongoing investment for future growth.
19
Performance
connecting you to the rest of the world
1Calculated as an average growth in earnings per share for the preceding five year period. For example, the projectionfor 2006 is calculated by averaging the annual growth in earnings per share (undiluted) for 2001 – 2005.
2Retention of personnel excluding involuntary separations (see definition in performance section).3See “Forward Looking Information” for further discussion of the outlook for 2006.
Business Markets Key 2005 2005 2006Group Served Metrics Performance Goals Outlook3
Networking North America, Revenue $26.9 - $27.2bn $27.0 - $27.5bn 9 –15% growth& Computers Europe, Russia, Economic $2.99 - $3.02bn $2.96 - $3.38bn 20 – 85% growth
Japan Profit Long Term 8% 7% 9 – 10%EPSGrowth1
Personnel 90% 95% 95%Retention2
Software United States, & Peripherals Europe, Japan
Services United States, Europe
Not developed for this sample report
Comments
Some have suggested that second derivatives are better indicators of performance than actual values or firstderivatives as shown here. See Elliott– The Third Wave Breaks on theShores of Accountancy – 1992.
Long Term Growth in EPS is intendedto reflect long term growth potential ofthe business. Some have argued thatthis measure is not well correlated withfuture growth expectations implied inMarket Value. Alternative measuresinclude long term growth in free cashflows or a measurement of futuregrowth expectations inherent in MarketValue directly, adjusted for changes inthe market as a whole, and/or the peergroup. For further discussion of the useof this “Future Value” metric see thesample report “eXchange”.

Governance
The following is a summary of Lintun's main governance policies:
A majority of our Board members are independent. “Independent” is defined by the listingrules of the New York Stock exchange. In summary, these directors are not employed bythe Company, are not officers of the Company, have not been employed by the Companyfor the three years ending December 31, 2005, and do not have close relativesemployed by the Company.
All members of our key Board committees—the Audit Committee, the Compensation andthe Nomination Committee—are independent.
The independent members of our Board meet at least twice each year without the presence of management.
The following policies are designed to ensure that the interests of the board membersare well aligned with the interests of the Company:
1. Ownership of a significant number of shares is a pre-requisite for appointment tothe board of directors. The nominating committee uses its discretion in determiningwhat constitutes “significant” on a case by case basis.
2. No fees are paid to non-executive directors. Their entire compensation is in termsof dividends and appreciation of the market value of the stock and options that theyhold in the Company.
3. The Company does not carry any Directors and Officers liability insurance for non-executive board members. As a result of this policy, board members have moreat stake than most shareholders.
We have a clear code of business conduct and corporate governance that is monitoredby our ethics office and is annually affirmed by our employees.
The charters of our Board committees clearly establish their respective roles and responsibilities. Click here to see these charters.
We have an ethics office with a hotline available to all employees, and our AuditCommittee has procedures in place for the anonymous submission of employee complaints on accounting, internal controls, or auditing matters.
We have adopted a code of ethics that applies to our principal executive officer and allmembers of our finance department, including the principal financial officer and principalaccounting officer. Click here to review the Code.
Our internal audit control function maintains critical oversight over the key areas of ourbusiness and financial processes and controls, and reports directly to our Audit Committee.
Verily Verify LLP, our independent auditor, reports directly to the Audit Committee of theBoard of Directors. Verily Verify LLP’s accompanying report is based on its examinationconducted in accordance with auditing standards generally accepted in the UnitedStates, including a review of our internal control structure for purposes of designing theiraudit procedures.
In addition, our independent auditor has reported on our assertions as to the effectivenessof our internal control over financial reporting as required under Section 404 of theSarbanes-Oxley Act of 2002.
20
Comments
The following organizations and relatedweb sites offer guidance on CorporateGovernance “best practices”:
The OECD has issued an update to itsCG principles for public comment (Jan2004) in anticipation of ratification inMay 2004.
www.GCGF.org. This is the specializedsecretariat that coordinates corporategovernance activities for the OECD,World Bank and IFC. Includes trainingmaterials and other documentation.
www.calpers-governance.org. This isthe governance site for CalPERS. It hasan extensive list of documents, includingtheir domestic and international principles, and a document on barriersto good corporate governance. Seeespecially http://www.calpers-gover-nance.org/principles/international/global/page08.asp#disclosure
www.gmiratings.com. Extensive bibliography pages.
In addition to the disclosures madehere, it would be useful to provide a listof the specific anti-takeover devices inplace. (see www.sharkrepellent.net). Itwould also be useful to highlightwhether the company has a target ownership plan and retention period forholding stock obtained by exercisingstock options. Disclosure could also bemade of institutional ownership, ownership by activist investors, etc.
connecting you to the rest of the world
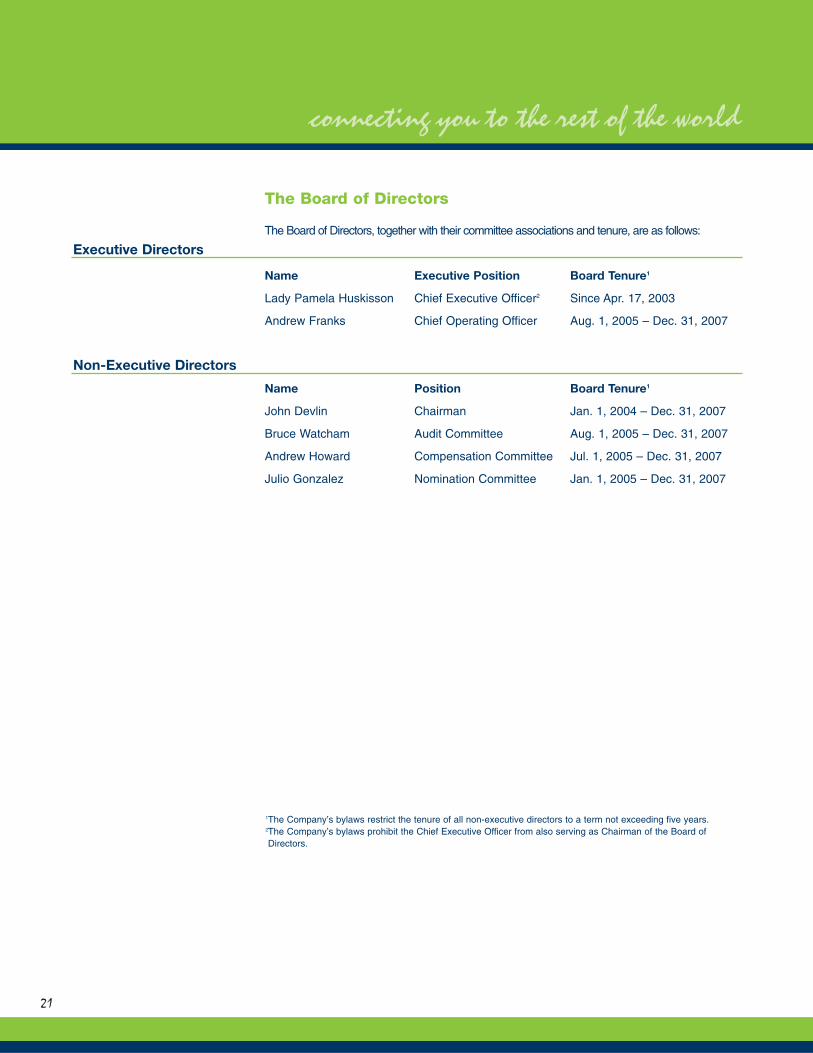
The Board of Directors
The Board of Directors, together with their committee associations and tenure, are as follows:
Name Executive Position Board Tenure1
Lady Pamela Huskisson Chief Executive Officer2 Since Apr. 17, 2003
Andrew Franks Chief Operating Officer Aug. 1, 2005 – Dec. 31, 2007
Name Position Board Tenure1
John Devlin Chairman Jan. 1, 2004 – Dec. 31, 2007
Bruce Watcham Audit Committee Aug. 1, 2005 – Dec. 31, 2007
Andrew Howard Compensation Committee Jul. 1, 2005 – Dec. 31, 2007
Julio Gonzalez Nomination Committee Jan. 1, 2005 – Dec. 31, 2007
21
Executive Directors
Non-Executive Directors
connecting you to the rest of the world
1The Company’s bylaws restrict the tenure of all non-executive directors to a term not exceeding five years.2The Company’s bylaws prohibit the Chief Executive Officer from also serving as Chairman of the Board ofDirectors.

2005 Remuneration
The following table summarizes compensation awarded to the executive directors:
Notes
Annual bonus, stock and option awards are determined based upon performance. If individual performance goals have been met in the year, one-third of the correspondingaward is made the following April. (The year in which the performance is first measuredis referred to as the “base year”.) Payment of the remaining two-thirds is spread overthe subsequent five years and is contingent upon goals being met in each of theseyears. As a result of this policy, in any given year, an executive director may receivebonus payments arising from up to five different base years. Individual performancegoals are linked to execution of the company’s strategic priorities and are determinedand reviewed annually by the compensation committee.
The Work of the Board in GovernanceThe board’s governance policies regulate its relationship with shareholders, the conductof board affairs and the board’s relationship with the group chief executive. The policiesrecognize the board’s separate and unique role as the link in the chain of authoritybetween the shareholders and the group chief executive.
The dual role played by the group chief executive and executive directors as both members of the board and leaders of the executive management is also recognized andaddressed. The policies require a majority of the board to be composed of independentnon-executive directors and delegate all aspects of the relationship between the boardand the group chief executive to the non-executive directors.
To discharge its governance function in the most effective manner, the board has laiddown rules for its own activities in a board process policy that covers the conduct ofmembers at meetings; the cycle of board activities and the setting of agendas; the provision of information to the board; board officers and their roles; board committees –their tasks and composition; qualifications for board membership and the process of thenomination committee; the assessment of board performance; the remunerationof non-executive directors; the process for directors to obtain independent advice; andthe appointment and role of the company secretary. The responsibility for implementationof this policy, which includes training of directors, is placed on the chairman.
At its heart, the board process policy recognizes that the board’s capacity, as a group, is limited. The board therefore reserves to itself the making of broad policy decisions,delegating more detailed considerations involved in meeting its stated requirementseither to board committees and officers (in the case of its own processes) or to the groupchief executive (in the case of the management of the company’s business activity). Theboard’s role is to set general policy and to monitor its implementation by the group chiefexecutive. To this end, the board executive linkage policy sets out how the board delegatesauthority to the group chief executive and the extent of that authority. In its goals policy, the
22
connecting you to the rest of the world
Stock AwardsSalary $000s) Bonus Total 2005 2006 Option Awards
2004 2005 2004 2005 2004 2005 Actual Value ($000s) Expected Value ($000s) Actual Value ($000sLady Huskisson 985 1,105 550 750 1,535 1,855 225,000 315 300,000 540 450,000 6,071 Andrew Franks 650 720 350 400 1,000 1,120 125,000 175 95,000 171 180,000 2,428

board states the long-term outcome it expects the group chief executive to deliver. Therestrictions on the manner in which the group chief executive may achieve the requiredresults are set out in the executive limitations policy, which addresses ethics, health,safety, the environment, financial distress, internal control, risk preferences, treatment ofemployees and political considerations. (See also the discussion of Corporate Values,Ethics and Compliance.)
The group chief executive explains how he intends to deliver the required outcome inannual and medium-term plans, which also respond to the group’s comprehensiveassessment of risks. Progress towards the expected outcome forms the basis of a reportto the board that covers actual results and a forecast of results for the current year. Thisreport is reviewed at each board meeting. The board-executive linkage policy also setsout how the group chief executive’s performance will be monitored and recognizes that,in the multitude of changing circumstances, judgment is always involved. The group chiefexecutive is obliged through dialogue and systematic review to discuss with the board allmaterial matters currently or prospectively affecting the company and its performanceand all strategic projects or developments. This key dialogue specifically includes anymaterially under-performing business activities and actions that breach the executive limitations policy. It also includes social, environmental and ethical considerations. Thesystems set out in the board-executive linkage policy are designed to manage, ratherthan to eliminate, the risk of failure to achieve the board goals policy or observe theexecutive limitations policy. They provide reasonable, not absolute, assurance againstmaterial misstatement or loss.
23
connecting you to the rest of the world

Social Responsibility
Lintun has just completed it’s tenth annual Corporate Social Responsibility report which
can be downloaded here.
Key areas addressed in this year’s report include the following:
• Responsible Marketing, Content and Use
• Health Concerns regarding Wireless Networks
• Reuse and recycling of Lintun products
• Environmental impacts of our operations
• Lintun products and services with social value
• Supply chain policies and performance relating to employment conditions inour factories and those of our vendors.
24
Comments
Groups such as the Global ReportingInitiative and the International Chamberof Commerce and others have frame-works for Corporate SocialResponsibility. The key elements ofthese reports could be linked or taggedto correspond with relevant strategicpriorities and performance discussions.This approach would allow users toview this information in an integratedway regardless of presentation formatin prepared reports.
connecting you to the rest of the world

Competition
The markets for Networking and Computers are changing rapidly, driven by convergingtechnologies, a migration to networking solutions and the increasing dominance of directsales channels over traditional retail.
These factors represent both Opportunities and Risks. Lintun is subject to the intensecompetition and pricing pressures of the technology industry, as well as continued weaktechnology spending brought about by a soft global economic environment; but we areable to succeed in this environment through competitive advantage in a number of areasfurther described in the Strategy section of this report.
We compete with numerous vendors in each product category. The number of competi-tors may increase, and the composition of competitors may change as we increase ouractivity in our advanced technology markets. Our main competitors, and an estimate oftheir market share (as published by RMS Analysts, Inc.), are as follows:
25
Market Overview
Desktop Notebook Computers Computers Servers Workstations Storage Networking
Lintun 22% 34% 24% 16% 12% 15%
Avocado 11% 22% 23% 18% 22% 9%
Banana 24% 18% 20% 19% 25% 28%
Cantaloupe 10% 12% 18% 12% 21% 23%
Date 7% 7% 5% 8% 9% 15%
Eggplant 7% 4% 3% 7% 8% 0%
Fig 8% 0% 2% 6% 0% 0%
Others 11% 3% 5% 14% 3% 10%
Total 100% 100% 100% 100% 100% 100%
Estimated market size 22 15 16 8 10 12($billions - 2005)
Estimated size - 2010 44 30 32 16 20 24

26
Network and Computers Division

27
Network and Computers Division
Profitability of each of these companies and their annualized growth in revenue for thepast five years are presented below:
Regulatory EnvironmentLintun’s business is subject to regulation by various national and state governmentalagencies. Such regulation includes the radio frequency emission regulatory activities ofthe U.S. FCC, the anti-trust regulatory activities of the FTC and Dept. of Justice, the consumer protection laws of the European Union and U.S. FTC, the import/export regulatory activities of the U.S. Dept of Commerce, the product safety regulatory activities of the U.S. Consumer Products Safety Commission, and environmental regulation by a variety of regulatory authorities in each of the countries in which Lintun conducts business.
Profitability Date of Annualized (net income/ last report revenue growth Notes
revenue) (last 5 years)
Lintun 10% 1/20/06 1%
Avocado 8% 3/1/05 15%
Banana 12% 1/18/06 10%
Cantaloupe 14% 8/9/05 34% Acquisition 2003
Date 18% 2/5/06 8%
Eggplant 13% 1/27/06 9%
Fig 15% 3/3/05 20%

Macro-EconomicLintun’s performance is impacted by a number of macro-economic variables, includingthe following:
• Currency exchange rate fluctuations
• Interest rate fluctuations
• Geopolitical risk
• General economic and business conditions and outlook
• Pricing pressures
See the Sensitivity Analysis section for further discussion of the impact of these variableson the Company.
In addition to the above, the Company is influenced by the promulgation of standards forboth software and hardware components of computers and peripherals. Lintun is positioned to be able to take advantage of further developments in these standards andof their further acceptance by more and more countries. This is because of Lintun’sapproach of delaying assembly of final products pending receipt of orders from customers. This delay in assembly is only possible with the close cooperation of our vendors and relies largely upon the industry complying with generally accepted standards for interoperability of individual components.
28
Network and Computers Division

Overview
Lintun's Network and Computer Division is positioning to be the fastest growing player inthe computer manufacturing sector. This is being done by investing in high quality people,supply chain processes, product innovation and strategic acquisitions. As a result of thisstrategy and the corresponding investments, the company is experiencing returns that arecurrently below average for the industry. Returns are not expected to exceed industry averages until 2008.
Investments to drive improved efficiency are focused on delivering superior responsivenessto customer demands at a lower cost than the competition. Aggressive growth will beachieved through a program of strategic acquisitions combined with leveraging thecompany’s lower cost base to drive organic growth via price competition. Both efficiencyand growth strategies are reinforced by attracting, developing and retaining the top quality people.
A summary of the division’s strategic priorities and their corresponding value drivers andoperational goals follows:
29
Strategy

See below for a description of each Strategic Priority.
See the Performance section of this report for an analysis of current period performance.
30
Network and Computers Division
Strategic Priorities Operational Goals Value Drivers
Increased Use of EIS or Inventory Turn Tagging
Supply ChainInnovation Reduced Business Process
Superior Cycle Time Improvement IdeasResponsiveness toCustomer Demands Increased Revenue CRM
at Low Cost per Customer ImplementationDirect Customer
Channel Improved Customer Timely DeliveryRetention
Return on Acquisition andStrategic Investments Integration Process
Acquisitions in Acquisitions ExpertiseCapital Investments Exceeds Hurdle Rates
Product Increased Share of New ProductInnovation Revenue from Research and
New Products Development
Improved Offer Competitive Pay Acceptance Rate and Benefits
and RetentionAttract, Develop and Retain the Best People Improved Training and
Performance Employee of Personnel Development
and Retention Programs
Reduced Frequency Definition andof 'Significant' Risk Communication of
Risk Management Management Control Processes Exceptions and Corresponding
Responsibilities

Superior Responsiveness to Customer Demands at Lower Cost
This strategy has two components – the provision and maintenance of a direct delivery channel to customers, and continuous improvements to the supply chain.
Lintun’s direct-to-customer business model eliminates the costs associated with maintaining a dealer network. This direct customer channel also provides the companywith precise order information that can be quickly communicated to vendors. This resultsin highly predictable inventory requirements that, in turn, allow the company to operate atsignificantly lower inventory levels than its competitors. The combination of these twodynamics results in a cost advantage for the company that enables it to compete as thelowest cost provider in the industry.
The company believes this competitive advantage in efficiency is sustainable for at least tenyears because of the unique process competency that has been developed and which isnecessary in order to successfully execute a direct customer channel business model.Lintun has taken 20 years developing, refining and continuously enhancing this competency.
Growing Market Share
The Company expects to be able to continue its growth in market share enjoyed in thepast few years as competitors continue to struggle to match Lintun on pricing and quality,and as increases in vendor costs have a disproportionate impact on other companiescarrying higher inventory levels and subject to higher uncertainty in their business cycles.Acquisition of new domestic customers is achieved at a lower cost than either a horizontal or a geographic expansion but offers more limited longer term potential.Accordingly, the company continues to invest in both strategies for acquiring moredomestic customers (primarily through leveraging the cost and quality advantages referenced above), as well as in development of new products and services that arecomplimentary to the existing portfolio.
31
Direct CustomerChannel
Supply Chain Innovation
Organic Growth
Network and Computers Division

Capital Investments
Management is continuously searching for appropriate acquisition and alliance candidates that would allow for an accelerated expansion into either complimentary products/services or geographic markets. The initial investment in developing alliances istypically recovered within 12 months. Recovery of investments in new acquisitions rangesfrom three to four years. An example is the acquisition of FISH Chips, PLC in 1999 thatprovided Lintun with strong entrance into the internet router market. The original investmentin this acquisition of $350 million was recovered by 2003. The Internet router businesssegment that now represents this business generated a contribution of $75 million togroup profits in 2005.
During 2005 the company launched a New Product Innovation program to furtherstrengthen future growth prospects and to secure growth in market share. Investmentsare being made in personnel and equipment to support research into new computerdesigns and development to bring the best of these designs to market. New products aredesigned to operate within existing industry standards. The company aims to take newproduct ideas to market within three years of identification.
Attract, Develop and Retain the Best People
The Company is focused on maintaining a competitive edge through continuous supplychain process innovation and maintaining high quality standards as further discussedelsewhere in this report. This strategy requires the sharpest minds for effectively execution and an ongoing program of personnel development. Accordingly, Lintun placesa high priority on attracting, developing and retaining the best people and is proud of itstrack record in this area.
Overpayment — It is possible that the company may overpay for personnel, resulting insub-optimal business performance. This risk is increased by the fact that measurementof performance of personnel is difficult and therefore measuring a return on this investmentis also difficult. Management consider the significance of this risk to be moderate and thelikelihood of such an event occurring to be moderate given the number of new personnelhired each year and the annual adjustments to compensation. The Company addressthis risk by engaging a number of independent Human Resource consulting firms to conductan annual review of the Company’s compensation structure compared to our competitorsin all the key markets in which we operate. This information is a primary considerationwhen setting and adjusting compensation levels for new personnel and during eachannual adjustment.
32
Strategic Acquisitions
New Product Innovation
Network and Computers Division

Risks and Risk Management
Lintun has adopted COSO’s Enterprise Risk Management framework. Enterprise RiskManagement is defined by that organization as follows:
“Enterprise risk management is a process, effected by an entity’s board of directors,management and other personnel, applied in strategy setting and across the enterprise,designed to identify potential events that may affect the entity, and manage risks to bewithin its risk appetite, to provide reasonable assurance regarding the achievement ofentity objectives.”
The components of this model may be summarized by the following graphic:
33
Comments
The draft COSO framework presentedhere is one of a number of possiblegenerally accepted frameworks for riskmanagement that could be adopted asa component of Enhanced BusinessReporting. An interface along theselines provides the user with the abilityto navigate through a risk management“view” of the information contained inthe Business Report – both at the individual initiative level as well as theorganization and business unit level.This material is only partially populatedfor the purposes of this sample report.
Network and Computers Division
It is suggested that enhanced business reports provide for a view into the businessthrough a risk management lens such as that provided by the COSO risk managementframework. For illustrative purposes, this sample enhanced business report contains onlysome of these elements.

Identified specific risks and mitigating controls.
The following specific risks associated with the division’s strategic priorities have beenidentified by management:
A low cost strategy carries inherent risks of quality issues as pricing pressures are con-veyed to all areas of production and product/service delivery. Lintun takes a proactiveapproach to managing this risk by making customer satisfaction and quality managementa priority. Quality and Customer Satisfaction management processes are integrated intothe core of the division’s business activities and management compensation is partlydependent on their ability to continuously meet aggressive leading and lagging perform-ance indicators associated with both these areas.
Competitors may erode the division’s competitive advantage in efficiency by replicatingthe direct customer channel model. The successful replication of this model would havea significant impact on the division’s business. However, management considers this riskto be very low due to:
1. The division’s strict protection of internally developed process competency referenced above, and
34
Reduced product/service quality
Replicating the direct customer channel model
Network and Computers Division

2. The continuous improvement in this competitive edge as represented by the cycletime (from receipt of customer order to delivery), unit production and delivery cost.
3. The failure of a number of competitors to replicate the direct customer channelmodel that have been widely reported and analyzed in the business press inrecent years.
Competing as the low cost provider yields higher returns in markets that have a relativelyhigher elasticity of demand for the products/services. i.e. An incremental decrease inprice results in an increase in revenue that is larger than would be experienced in othermarkets. This elasticity of demand varies by market segment and accordingly the success ofthis strategy is likely to vary. Management considers the potential impact of this risk to bemoderate because of the diversity of markets in which the division operates. The likeli-hood of elasticity of demand declining to the point where the low cost strategy is notappropriate is considered remote because management retain expert economists toevaluate this metric for all new markets prior to any decision to enter the market. Thosepotential markets that display elasticities lower than a pre-defined value are highlighted asgreater risk for special management consideration prior to entry and are usually rejectedunless there are other factors that outweigh this consideration.
It is a well known fact that the majority of business acquisitions fail to deliver the returnsthat were projected at the time of the transaction. This is due to a variety of reasons.Recent studies have identified the following as the primary culprits:
• The price negotiation departs from the values suggested by the valuation models and becomes an “ego trip” for the CEO.
• The valuation model underestimates the time and investment required toachieve the synergies identified
• Those responsible for integration are not included in the due diligence phaseof the transaction.
The division addresses these risks by requiring finance committee approval of all acquisitions. This committee is required to ensure that all deals comply with companypolicy. This policy prohibits paying in excess of values suggested by models developedby the due diligence team. In addition, the due diligence team is required to include atleast one member who has experience in a senior management position executing theintegration of businesses of a similar nature to the acquisition target. Where there are nointernal candidates with these credentials, integration consultants are included in the duediligence team. These consultants are typically retained in advance of all acquisitions inorder to plan and then lead the integration activities on a contingent fee basis.
Expansion into new lines of business and geographies increases business complexitiesexponentially. This risk is considered to have a moderate significance and likelihood.Management addresses this risk by carefully evaluating the strength and cultural compatibility of management in target companies. Lintun retains the incumbent manage-ment following most acquisitions and relies on their existing knowledge and processesfor ongoing oversight. In addition, the division has established a rhythm of monthly,
35
Price elasticity of demand
Overpaying for acquisitions
Ability of managementto manage increasedcomplexities
Network and Computers Division

quarterly and annual meetings that all business unit heads are required to attend. Thesemeetings are chaired by the division president and review the status of all priority initiatives. Quarterly and Annual meetings also include a strategic planning component.
In addition the following pervasive risk was considered to be significant.
Management periodically review the ability of the business to continue to have access tofinancing should the division ever lose access to the public debt and equity markets. (Forexample, if the division were spun off as a separate, unlisted company, or if Lintun as awhole were to de-list or go private). The impact of a loss of access to the public financingmarkets would be significant because the business would have to replace this financingwith more expensive bank and working capital financing sources.
Management consider the likelihood of exiting the public capital markets to be remote.Nevertheless, they continue to pursue a policy of ensuring that the business retain sufficiently strong ratings with banks that they would be able to secure sufficient privatesources of financing in the event that public funds were no longer available.
The following section discusses a number of other pervasive risks that face the business.Management consider the significance of these to be less than those discussed above.
In addition to the specific risks discussed relating to each business strategy, there are anumber of pervasive risks that affect Lintun’s business and the results of its operations.These risks include the following:
Macroeconomic:
• Currency exchange rate fluctuations
• Interest rate fluctuations
• Geopolitical risks including armed hostilities, terrorism or public health issues
• General economic and business conditions and outlook
• Pricing pressures
Operating:
• Sourcing Risk, including component availability and cost
• Ability to effectively manage periodic product transitions
• Product/Service failure (direct channel presents heightened exposure of brandto product/service failures)
• Market acceptance of new products
Financing:
• Ability to secure and retain both debt and equity financing
• Changes in the market value of investments
36
Financing Risk
Pervasive Risks
Network and Computers Division

Opportunities
Both PCs and enterprise hardware still represent significant growth opportunities forLintun, especially overseas. Global growth in communications technology also reflects a significant growth opportunity. Lintun is well-positioned to benefit from growth in coretechnologies and advanced technologies through all of our key markets. See the"Projections" section for management's perception of the prospects for future growth.
International growth potential represents a significant opportunity for Lintun, which holdsonly 10% of total market share outside of the United States. As of the end of fiscal year2003, Lintun held 18% of total global market share, a gain of nearly 3% over the prioryear, the strongest year-on-year gain in Lintun’s history.
37
Product/Service Line Expansion
Geographic Expansion
Network and Computers Division

Value Drivers
The following Value Drivers are key to the effective execution of the company’s strategies:
As more vendors migrate to a standard information management system that complieswith Lintun’s protocols, the more effective Lintun will be in managing and compressingthe business cycle. A standard information exchange protocol allows customer orderinformation to be immediately converted into requisitions for components from vendorsand for adjustments to the scheduling of personnel.
This value driver is monitored using the percentage of vendors who have adoptedLintun’s information protocols. The effectiveness of this value driver is monitored bytracking increases in inventory turn and reductions in business cycle time (defined as thenumber of days elapsing from receipt of a customer order to delivery of the product orservice as calculated on a three month rolling average).
Lintun has a core competency of ongoing innovation in compressing the supply chain.This translates into cost benefits allowing the company to offer the lowest prices in themarket. All employees are encouraged to submit ideas for improvements to this process.A working group reviews these ideas each week and allocates resources to further develop the most promising submissions. Those submitting ideas that are adoptedreceive a share of the corresponding increase in productivity.
This value driver is monitored using the number of ideas for process improvement submitted each week. The effectiveness of this value driver is monitored by trackingincreases in inventory turn and reductions in business cycle time (defined as the numberof days elapsing from receipt of a customer order to delivery of the product or service ascalculated on a three month rolling average).
Lintun has developed a total customer relationship management process. The objectiveof this process is to exceed customers’ expectations. The Company has established a
38
Use of ElectronicInformation Systemsand/or Tagging
Comments
The Task Force considered presentinga separate section in this sampleenhanced business report for"Resources" that would discuss bothTangible and Intangible resource key todelivering on the strategic priorities ofthe business. Instead discussion ofthese resources is embedded within thediscussion of Value Drivers.Nevertheless, it would appear to beuseful to separately 'tag' resources inorder for users to be able to create theirown views of the resources available tothe business.
There are a number of possible ideasfor organizing frameworks for catalogingresources. These include those present-ed in the Prism Report referenced inthe Bibliography, a framework devel-oped by AssetEconomics and theValueReporting framework developedby PriceWaterhouseCoopers.
Process Improvement Ideas
Comments
These value drivers are representativeonly. In practice there may well be morevalue drivers identified for a given strat-egy than the few represented here. Inaddition, this analysis would also bepresented for each business segment.
Customer RelationshipManagement ProcessImplementation
Network and Computers Division

roll-out program that is systematically training customer service personnel throughout theorganization on this methodology and in the effective use of related software.
This value driver is monitored using the percentage of locations that have completed theimplementation of the customer relationship management process. The effectiveness ofthis value driver is monitored by tracking revenues per customer and customer retentionrates (percentage of customers in a given period who were also customers in the preceding period).
Timeliness of delivery has been identified through various studies, to be a key determinantin customer retention. Accordingly, the Company has established a technique that allowsfor a highly accurate estimate of delivery time when a customer places an order based ona combination of factors, including inventory levels throughout the supply chain andexpected capacity information provided by the Company’s distributors. A small “cushion” isadded to this estimate in arriving at the date and time that are communicated to the cus-tomer together with order confirmation. Any significant deviations that are subsequentlyanticipated in the delivery date and time are communicated to the customer via their preferred communication medium (phone or e-mail). In addition, customers are able totrack the current status of their order through an eight step process in advance of delivery.
This value driver is monitored using the average number of days delay between anticipated and actual delivery time. The effectiveness of this value driver is monitored bytracking revenues per customer and customer retention rates (percentage of customersin a given period who were also customers in the preceding period).
When new acquisition candidates are identified, the division assembles a due diligenceteam comprising representatives from both the division and Lintun corporate with experiencein Mergers and Acquisitions. These due diligence teams are sometimes supplemented withoutside experts from accounting, legal and investment banking firms. Representativesfrom the Networking and Computer Division always include the head of the group mostlikely to absorb the new acquisition, in the event that the deal goes through. Thisapproach ensures that those who will be responsible for future performance have someinput to the evaluation and valuation of the prospect.
Lintun corporate have developed an integration methodology that covers the period fromdue diligence through 100 days following the deal being consummated. All members ofthe Networking and Computer Division’s due diligence and acquisition team have com-pleted training on this methodology.
This value driver is monitored using the number of division personnel who have completedthe Lintun acquisition and integration training and who have obtained practical experiencein acquisition and integration projects. In order to be counted within this statistic, personnelneed to have participated in this training within the last three years AND have participatedin at least two acquisition/integration projects. Project experience gained with otheremployers is accepted for this consideration.
39
Timely Delivery
Acquisition andIntegrationProcess ExpertiseComments
Top Value Drivers for High Tech fromstudies by PricewaterhouseCoopers:
1. Strategic Direction2. Cash Flow3. Market Growth4. Gross Margins5. Quality/Experience of
Management Team6. Market Size7. Competitive Landscape8. Earnings9. Speed to Market (first to market)10. Market Share.
Network and Computers Division

Lintun is committed to attracting and retaining the best people. Accordingly, the Companyintentionally pays significantly above the market rate and provides a series of insurance,pension and other benefits that are superior to most competitors.
This value driver is monitored using the percentage that average total compensation andbenefit costs per employee exceed the industry average. The effectiveness of this valuedriver is monitored by tracking Offer Acceptance Rates, Personnel Performance andRetention Rates.
The Networking and Computer Division participates in Lintun’s corporate training programthat provides a comprehensive curriculum for personnel from most functions and at alllevels of expertise. Each employee is teamed with a mentor to ensure that they receiveguidance on career and personal development. In addition, each employee is required toparticipate in the division’s 360 feedback process so that input is provided from subordinates,superiors and peers in helping each individual plan their future training and developmentactivities and goals.
This value driver is monitored using dollars spent on training and development peremployee.
The effectiveness of this value driver is monitored by tracking offer acceptance rates, theaverage number of post graduate years of education per employee, retention rates andpersonnel performance statistics.
The Network and Computer Division have established a hierarchy of process level, group and business unit controls to mitigate both pervasive and specific risks. See theCOSO enterprise risk management framework for definitions and further description ofthis approach to risk management.
Each process owner, group head and business unit president is have specific responsibilities defined for identification, reporting and controlling risks. These responsibilities are communicated annually in addition to periodic updates for changes in procedures and responsibilities.
The effectiveness of these risk management procedures are reviewed annually by the risk management committee and recommendations for improvements made to the audit committee and chief risk officer of Lintun.
This value driver is monitored using the percentage of identified process owners, group heads and business unit presidents who have received notification of their responsibilities and who are delivering periodic risk management reports in accordancewith established policy.
The effectiveness of this value driver is monitored using the number of risk exceptionsgenerated each year.
40
Competitive Pay and Benefits
Training and EmployeeDevelopment Programs
Definition andCommunication of Control Processes and CorrespondingResponsibilities
Network and Computers Division

Summary
The Networking and Computers Division fell just short of its goal for Economic Profit for2005 but met its goals for both Long Term EPS Growth and Personnel Retention.Although Economic Profit and Net Income are healthy, they lag behind the goals and therest of the Computer Industry sector because of our strategy of investment in top peopleand strategic acquisitions to ensure future growth rates well in excess of the sector.
Supply Chain Innovation
The following goals and performance relate to the value drivers and their correspondingoutcomes associated with this strategy:
1Calculated as an average growth in earnings per share for the preceding five year period. For example, the projectionfor 2006 is calculated by averaging the annual growth in earnings per share (undiluted) for 2001 – 2005.
2Retention of personnel excluding involuntary separations (see definition in performance section).3See “Forward Looking Information” for further discussion of the outlook for 2006.
41
Key 2005 2006 Metrics Performance Goals Outlook3
Revenue $27.1bn $26.5bn 9 – 15% growth
Economic $3.0bn $3.2 20 – 85% growthProfit
Long Term 8% 7% 9 – 10%EPS Growth1
Personnel 90% 95% 95%Retention2
Performance

Value Drivers
Outcomes
42
Network and Computers Division
2005 2005 2004 IndustryGoal Actual Actual Benchmark
Increased Inventory Turn 250 248 240 150
Reduced Business Cycle Time (Elapsed days from Order 7 6.5 7.5 15to Delivery)
2005 2005 2004 Goal Actual ActuaI
Use of EIS or tagging (percentage of vendors 70% 65% 60%adopted Lintun protocol)
Process Improvement Ideas (number of ideas 120 125 110submitted)

Direct Customer ChannelThe following goals and performance relate to the value drivers and their correspondingoutcomes associated with this strategy:
43
Network and Computers Division

Value Drivers
Outcomes
44
Network and Computers Division
2005 2005 2004 IndustryGoal Actual Actual Benchmark
Increased Revenue per Customer (growth over 50% 45% 40% 15%prior year)
Improved Customer Retention (percentage of customers who were 70% 68% 65% 35%also customers in the previous year)
2005 2005 2004 Goal Actual ActuaI
CRM Implementation (percentage of locations 82% 85% 70%completed implementation
Timely Delivery (days delay between anticipated -1 -1 -0.5and actual delivery)

A. Observed Relationship Between Improved Customer Retention andEconomic Profit
We have been closely monitoring customer retention for the past ten years as we continueto strive for improved performance in this area. Although correlation between customer variations in Economic Profit is not proof of causality, we have found that 25%% of the variations in Economic Profit for quarterly results over the past 10 years can be explainedby corresponding variations in customer retention (i.e., we have found a correlation coeffi-cient of 0.5 exists between these two measures when values are examined for quarterlyresults for the past 10 years). We have also found that customer retention is an evenstronger predictor of Economic Profit if we assume a time lag of one quarter between a change incustomer retention and a corresponding change in Economic Profit.
We have noticed a weakening in this relationship in recent quarters. (The same analysisperformed last year resulted in a correlation coefficient of 0.55.) Accordingly, we antici-pate that there may be a further weakening in future periods as other variables take onmore significance in determining Economic Profit.
B. Observed relationship between value drivers and customer retention
Given the importance of customer retention in improving Economic Profit, we haveconducted a number of internal studies to examine the potential drivers of customerretention. The results of this study (which a working group reviews for validity everysix months) show that the following variables are the primary drivers of customerretention. The values associated with each driver represent the percentage of variations in customer retention that they can explain:
CRM implementation (23%)
Timely deliveries (21%)
Order accuracy (18%)
Price competitiveness (18%)
Our model further suggests that these drivers lead customer retention performanceby one, three, two and three quarters respectively.
C. Analysis of current period performance
This was the second year of implementation of our Customer Relationship Managementprogram. Our customer service personnel were able to operate more effectively giventheir greater experience of working with these new operating procedures and supportingsoftware tools. Increased customer retention and revenue per customer reflect a broadertrend of increases in customer satisfaction and lower rates of return.
We continued to beat our estimated delivery dates by an average of one day. Our surveysof current and past customers and our ongoing review of relationships between value driversand customer retention confirm that delivering our products and services on or before ourestimated delivery dates is a key driver of customer retention and satisfaction. This surveydata also suggest that there is causality in these relationships, not just correlation. Ourcontinuous improvements to our supply chain management processes should allow us tomaintain this performance.
45
Management’sDiscussion and Analysis
Network and Computers Division
Comments
The top value drivers derived fromPredictiv’s 2003 study of the durablemanufacturing sector in the U.S. were(in order of importance):
1. Innovation2. Human Capital3. Management4. Alliances5. Quality6. Environment7. Brand8. Technology9. Customer
Comments
Lintun is following the approach suggested by Ittner and Larcker for theselection and validation of their valuedrivers. This approach includes:
1.Linkage between performance metrics and strategy. Select metricson the basis of causal models (or“value driver maps”)
2. Validatation of these linkages
3. Setting the right performance targets
4. Measuring correctly – ensure statistical validity and reliability. – i.e.the metrics captures what it is supposed to capture and measure-ment techniques introduce acceptablelevels of measurement error.
5. Continuous improvement – quarterlyupdate to causal models.

Customer loyalty is our best measure of success in building long-term relationships — IfLintun does an effective job of building trust among customers, we will be rewarded withloyal customers and repeat business. While over 60% of Lintun’s customers have continuedto buy our products after their first purchase, we intend to increase this number to 75%through the enhanced efforts to improve customer service and relationships described above.
Product Innovation
The following goals and performance relate to the value drivers and their correspondingoutcomes associated with this strategy:
Value Drivers
Outcomes
46
Network and Computers Division
2005 2005 2004 Goal Actual ActuaI
Investment in new product research and 1,600 1,525 1,550development
2005 2005 2004 IndustryGoal Actual Actual Benchmark
Percentage of revenue derived from 30% 18% 21% 40%"New Products"

A. Observed relationship between Revenue from New Products and Long TermGrowth Rates
Although correlation between New Product Revenues and Long Term Growth inEPS is not proof of causality, we have found that 36% of the variations in Long TermEPS Growth for quarterly results over the last ten years can be explained by corresponding variations in New Product Revenues. (i.e. we have found a correlationcoefficient of 0.6 exists between these two measures when values are examined forquarterly results for the past 10 years. (click here for further parameters of this sta-tistical analysis). We have also found that New Product Revenues is an evenstronger predictor of Long Term EPS Growth if we assume a time lag of three quarters between a change in New Product Revenues and a corresponding changein Long Term EPS Growth.
We have noticed a strengthening in this relationship in recent quarters. (The sameanalysis performed last year resulted in correlation of 0.4).
B. Observed relationship between value drivers and percentage of revenuederived from New Products.
Given the importance of New Product Revenues in determining long term growth rates,we have we have conducted a number of internal studies to examine the potentialdrivers of New Product Revenues. The results of this study, (which a working groupreviews for validity every six months), show that the following variables are the primarydrivers of New Product Revenues. The values associated with each driver representthe percentage of variations in revenue from new products that they can explain:
Investments in New Product Research and Development (16%)
Number of Patent filings (15%)
Number of dedicated Research and Development Personnel (13%)
Our model further suggests that these drivers lead New Product Revenues by ten, eight,and ten quarters respectively.
C. Analysis of current period performance.
Lintun has a history of product innovation since its inception. However, in 2005 welaunched a new program to highlight our focus on this area as a key driver of futuregrowth. During the year 125 new product proposals were generated, and 32 ideas wereapproved for further development. The average life of products brought to market in thepast 10 years that originated from this innovation process is five years. The average revenue generated over the life of one of these products is $24.8 million.
$19.2bn ($17bn) of the current year’s revenues and $7.3bn ($6.5bn), of this year’s costof sales were attributable to products that were originally developed through this innovationprocess. (Remaining revenues arise from externally acquired products, extensions toexisting products and services.)
$230 million of contingent liabilities for product warranty claims discussed in note ( ) to thefinancial statements are attributable to products originally developed through this process.
47
Management’sDiscussion and Analysis
Network and Computers Division

The generation of the 125 product proposals referenced above utilized:
• 470 product ideas submitted by 620 people (350 employees and 120 clients),
• 130 external studies
• $23 million in terms of personnel, patent and copyright fees, legal fees andother resources
The time required for development of new products through this process varies with thenature of the product, personnel involved and the point in the business cycle at whichcertain key product development stages are reached. The following table summarizesthe estimated times for each stage of the process based on a sample of 50 productsbrought to market over the past three years. These estimates will accurately predict actualprocess times in 95% of cases.
48
connecting you to the rest of the world
Comments
This table has not been created buthas been referenced here for illustrativepurposes.

Attract, Develop and Retain the Best People
The following goals and performance relate to the value drivers and their corresponding
outcomes associated with this strategy:
49
Network and Computers Division

Value Drivers
50
Network and Computers Division
2005 2005 2004 IndustryGoal Actual ActuaI Benchmark
Competitive Compensation and 25 - 30 27% 26% 0%Benefits (percentagesabove market)
Training and Employee Development Programs (Dollars spent on training $2,500 $2,450 $2,550 $1,500and development per employee)

Outcomes
Industry benchmark data is obtained from The Saratoga Institute™.
Total expenditures on training and development were $123 million and $120 million in2005 and 2004 respectively.
51
Network and Computers Division
2005 2005 2004 IndustryGoal Actual Actual Benchmark
Offer Acceptance Rate (Total offers accepted 92% 91% 89% 87.4%divided by total offers extended)
Retention (1 Minus voluntary separations divided by average total 95% 90% 91% 85.6%employee headcount over the period
Personnel Performance (Post taining performance as measured by 4 3.9 3.6 N/Aimmediate supervisor) 1 - unacceptable to 5 - Outstanding

Sensitivity Analysis
The division's performance is impacted by a variety of internal and external factors asdiscussed elsewhere in this report. The following is an estimation of the impact that marginal changes in these factors would have on performance, other things being heldconstant. Management have selected those factors they consider to have the greatestimpact on the performance of the division for inclusion in this analysis.
The following table provides an indication of the estimated impact that fluctuations insome of these variables would have had on the company’s performance in 2005(amounts shown are increases/ (decreases) in $ millions):
1. The currency impact is estimated to be primarily the effect of translating results ofoperations in Europe and Britain into U.S. dollars based upon reported resultsfrom these regions for 2005. Approximately 85% and 80% of the division'sDollar/Euro and Dollar/Pound exchange rate exposure was hedged with forwardcurrency contracts as of December 31st, 2005 at an average cost of 1.5% of thecontract amount.
2. Increases in interest rates have a negative impact as the business is a net borrower of funds, however this impact is relatively modest since the majority ofborrowings is with fixed rate instruments.
3. The impact of a change in GDP has been estimated by examining the historicrelationship between GDP in the United States and Europe and business performance in those regions over the past 10 years. The relationship shown inthis table assumes a six month delay between changes in GDP and correspondingchanges in business performance.
4. Sales price impacts have been estimated based upon information obtained fromcustomers reactions to changes in product and services made in the course of theyear. The 1% reduction in prices referenced here is assumed to apply to all products and services. The corresponding increase in revenues reflects the relative inelastic demand for the company’s products and services.
5. Management makes no representations regarding the accuracy of these estimated
52
Macro-EconomicFactors
Notes:
Network and Computers Division
Estimated Impact
Net Operating Economic Revenue Cash Flow Value Added
Unit Change From To From To From To
Currency
Euro 0.56 to 0.51 72 108 8 20 4 10
Pound Sterling £0.67 to £0.61 24 36 3 7 2 5
Interest Rates Increase of 1% -5 -2 -3 -1 -1 0
GDP Growth Increase of 1% 10 15 3 4 1 2
Sales Price Reduction of 1% 13 18 -3 2 -1 0

impacts or whether such relationships may continue in the future.
6. While the preceding sensitivity analysis has assumed that macro economic variables can change while others are held constant, in practice this is not thecase. There is generally accepted to be a relationship between changes inexchange rates, interest rates and GDP growth.
Estimates are inherent to performance measurement, both in terms of financial and non-financial measures. The following are those areas where estimates by managementhave the greatest potential impact on reported performance:
Revenue and Receivables are primarily impacted by estimates of provisions for doubtfulreceivables and for returns as follows.
The stock-based compensation expense is partly determined by estimates made ofexpected volatility in the stock price during the period the options are held and estimatesof how long the options will be held prior to exercise. Management used an estimatedstock volatility of 33% for 2005 and an expected life of 4 years. The table below showshow the total stock-based compensation expense for 2005 would have differed for acombination of different assumptions of stock volatility and life of the options using theBlack-Scholes valuation model. Amounts shown are $ millions.
Expected Stock Volatility
53
Management Estimates
Revenue and Receivables
Stock Options
Network and Computers Division
Percentage applied to period end Industry Impact of a 1% increase inbalances in determining provisions Benchmark provisions on 2005 performance
Average for 2005 Revenue Provisions Economic 2003-2005 (Balance Value
Sheet AddedAccounts)
Doubtful 4% 3% 3.5% $(20m) $20m $7mReceivables
Returns 3.5% 2.5% 5% $(14m) $14m $4m
20% 25% 30% 35% 40% 45% 50% 55% 60%
2.0 138 168 197 227 256 285 313 341 369
2.5 155 187 220 252 284 315 346 376 406
3.0 170 205 239 274 308 341 374 407 439
3.5 183 220 257 293 329 365 399 433 466
4.0 195 234 273 311 349 385 421 457 491
4.5 206 247 287 327 366 404 441 477 512
5.0 217 259 301 342 382 421 459 496 532
5.5 227 270 313 355 396 436 475 512 549
6.0 236 280 324 367 409 450 489 527 564
6.5 244 290 334 378 421 462 502 541 577
7.0 252 298 344 388 432 474 514 553 589
Exp
ecte
d L
ife (
yrs)
Comments
Alternatives to the Black-Scholes valuation method include the latticeapproaches including binomial methods.

The following comparative information regarding volatility in stock price and average optionlife for a number of other companies operating in our industry is provided here for reference:
Source: SEC 10K filings and Compustat.
54
Network and Computers Division
Stock Volatility Average Life of Options (Jan. 1 2000 – (period from grant toDec. 31. 2005) exercise date in years)
Avocado 35% 5.3Banana 40% 6.2Cantaloupe 29% 4.5

Projections
Growth rates for 2006 – 8 are expected1 within the following ranges:
Notes
1. A statistical analysis of the key variables driving growth rates for the metrics referenced here suggests that the actual growth rates for the periods stated havea 90% probability of lying within the ranges stated.
2. As projected in the 2004 business report.
3. Revenue growth for 2005 is an estimate because the actual Revenue is impacted anumber of estimates including provision for doubtful receivables and provision forreturns, the outcome of which is not fully known at the time of preparing this report.Some of these estimates are not fully resolved for 2004 and accordingly there issome uncertainty associated with the 2004 revenue figure. The range of growth ratesreflected here for 2005 was calculated by comparing these two ranges of estimatesof results for 2005 and 2004 at the 90% confidence level (see Income Statements).
4. Calculated as an average growth in earnings per share for the preceding five yearperiod. For example, the projection for 2006 is based upon an average of historicgrowth in earnings per share for 2001 – 2005 together with the projected growthin earnings per share for 2006.
5. Retention of personnel excluding involuntary separations. (See definition in performance section.)
The range in estimated growth reflects uncertainty over a variety of external and internalfactors that impact performance. These factors include the macro-economic variables,regulatory, competitive and key value drivers discussed elsewhere in this report.
The range of estimated growth rates for Economic Profit is greater than that for Revenuebecause of the larger number of variable impacting Economic Profit, including capitalemployed, interest rates and other costs.
These growth rates apply to core activities and not to unusual or non-recurring items.There were no such items anticipated for 2006 at the time this report was prepared.
55
Network and Computers Division
Actual Projections
2005 20052 2006 2007 2008
Revenue 7.5 – 8.5%3 8 – 10% 9 – 15% 15 – 20% 15 – 20%
Economic 15 - 16% 14 – 30% 20 – 85% 20 – 85% 20 – 85%Profit
Operating (16%) 5 – 8% 7 – 10% 8 – 15% 8 – 15%Cash Flows
Long Term 7.5 – 8.5% 6.5 – 7.5% 9.0 – 10% 10 – 12.5% 12 – 15%EPS Growth4
Personnel 90% 90 – 96% 90 – 96% 90 – 96% 90 – 96%Retention5
Comments
See SEC Interpretative Release 33-6835 on MD&A, Interpretative Release33-8350 on MD&A; SEC Staff Reviewof 2003 Fortune 500 Forms 10-K.Note especially, “As the Commissionhas stated, "[i]t is the responsibility of management to identify and addressthose key variables and other qualitativeand quantitative factors which are peculiar to and necessary for an understanding and evaluation of theindividual company." Also, the rulesestablishing a safe harbor for disclosureof "forward-looking statements" definesuch statements to include statementsof "future economic performance con-tained in" MD&A. These safe harborsapply to required statements concerningthe future effect of known trends,demands, commitments, events oruncertainties, as well as to optional forward-looking statements (Rule175(c) under the Securities Act of 1933("Securities Act"), 17 CFR 230.175(c),and Rule 3b-6(c) under the ExchangeAct. 17 CFR 240.3b-6)

Income Statements
The sample standard deviations associated with each income statement caption arebased upon samples taken in the estimation of items included in these captions.Standard deviations of subtotals are calculated taking into account covariances betweenthe income statement captions included in the subtotals. A 95% confidence interval maybe computed for any caption by multiplying the standard deviation by 1.96 and adding orsubtracting this figure from the value shown for the caption. Thus the samples taken sug-gest that there is a 95% probability that the actual revenue for 2005 lies between $27,141million +/- (1.96 x $102 million). That is between $26,941 million and $27,341 million.
56
Comments
This Financial Information is intended tobe representative extracts of a full setof financial statements that would beincluded in an Enhanced BusinessReport.
(In millions, except earnings per share)
Year Ended December 31 2005 2004 2003Estimated σ(n-1) Estimated σ(n-1) Estimated σ(n-1)
Mean Mean MeanRevenue $27,141 $102 $25,042 $94 $27,091 $102 Operating expenses:Cost of revenue 17,350 230 16,008 212 17,003 225 Research and development 1,795 46 1,656 42 2,202 56 Sales and marketing 3,583 54 3,524 53 4,245 63 General and administrative 550 20 691 26 624 23
Total operating expenses 23,278 217 21,879 201 24,074 217
Operating income 3,863 216 3,163 200 3,017 216 Investment income 157 - 145 - 157 -
Income before income taxes 4,020 216 3,308 200 3,174 216 Provision for income taxes 1,170 65 1,080 60 1,168 65
Net income 2,850 203 2,228 188 2,006 203
Basic earnings per share $0.59 $0.04 $0.45 $0.04 $0.41 $0.04 Diluted earnings per share $0.58 $0.04 $0.44 $0.04 $0.40 $0.04
Weighted average shares outstanding:Basic 4,854 4,952 4,889 Diluted 4,934 5,087 4,971
Financial Information

BALANCE SHEETS
57
Network and Computers Division
(In millions)
December 31 2005 2004
AssetsCurrent assets:
Cash and equivalents $ 4,079 $ 6,562Short-term investments 2,483 1,723Accounts receivable, net 3,203 2,921Inventories 590 579Deferred income taxes 368 396Other 1,062 1,089
Total current assets 11,785 13,270
Property and equipment, net 2,317 2,464Equity and other investments 8,717 6,587Goodwill 2,022 1,782Intangible assets, net 278 399Other long-term assets 1,785 1,778
Total assets $26,904 $26,280
Liabilities and stockholders’ equityCurrent liabilities:
Accounts payable $ 1,394 $ 874Accrued compensation 735 683Income taxes 799 718Short-term unearned revenue 1,517 1,572Other 2,700 2,631
Total current liabilities 7,145 6,478
Long-term unearned revenue 387 375Long-term debt 253 260Other long-term liabilities 584 408Commitments and contingenciesStockholders’ equity:
Common stock and paid-in capital – shares authorized 13,500; Shares issued and outstanding 4,789 and 4,953 11,297 12,153Retained earnings 7,107 6,633Accumulated other comprehensive 131 (27)income (loss)
Total stockholders’ equity 18,535 18,759
Total liabilities and $26,904 $26,280stockholders’ equity
See accompanying notes.

CASH FLOWS STATEMENTS
58
Network and Computers Division
(In millions)Year Ended December 31 2005 2004 2003
OperationsNet income $ 2,850 $ 2,228 $ 2,006Depreciation and amortization 901 1,098 1,238Net recognized (gains)/losses 227 52 (846)on investmentsStock option income tax benefits 196 274 1,163Changes in:
Operating working capital 314 1,197 154Non-current assets and liabilities (99) 343 1,578
Net cash from operations 4,389 5,192 5,293
InvestingAdditions to property and equipment (511) (1,472) (1,376)Purchases of investments (18,239) (13,540) (13,987)Sales and maturities of investments 15,238 13,041 11,681Other 103 438 (198)
Net cash used for investing (3,409) (1,533) (3,880)
FinancingCommon stock issued 422 477 829Common stock repurchased (4,137) (2,427) (1,350)Other 21 15 (6)
Net cash used for financing (3,694) (1,935) (527)
Net change in cash and equivalents (2,714) 1,724 886Effect of exchange rates on cash and equivalents 231 (53) (16)Cash and equivalents, beginning of year 6,562 4,891 4,022
Cash and equivalents, end of year $ 4,079 $ 6,562 $ 4,892
See accompanying notes.

Appendix I – Bibliography
• “The Prism Report 2003 – Research findings and policy recommendations.”The European Commission Information Society Technologies Programme.
• “Accounting for People Report” – The UK Department of Trade and Industry.
• “Coming Up Short on Non-Financial Performance Measurement” – ChristopherD. Ittner and David F. Larcker – HBR, November 2003.
• “Truth and Transparency: The Federal Government’s Financial Condition andFiscal Outlook” – David M. Walker, September 2003.
• “The GAAP Gap – Corporate Disclosure in the Internet Age” – Robert E. Litanand Peter J. Wallison.
• “New Measures for the New Economy” – Institute of Chartered Accountants inEngland and Wales, March 2000.
• “New Reporting Models for Business” – Institute of Chartered Accountants inEngland and Wales, November 2003.
• “Intellectual Capital Statement Guidelines” – Danish Ministry of Science,Technology and Innovation, 2003.
• “Improving Business Reporting – A Customer Focus” – American Institute ofCertified Public Accountants, 1994.
• “Guidelines for Disclosure (MD&A)” – The Canadian Institute of CharteredAccountants.
• “The Naked Corporation” – Don Tapscott.
• “New Directions in Business – Performance Reporting, Communications andAssurance” – The Institute of Chartered Accountants in Australia, by MichaelBray, 2002.
• “Sharpening the Intangibles Edge” – Baruch Lev, September 2003.
• “Enterprise-Wide Risk Management: Strategies for Linking Risk andOpportunity”. Published by Financial Times, 2000.
• “Preparing Performance Indicators and Objectives”, by Roger Kaufman. From“The Guidebook for Performance Improvement”. Edited by Roger Kaufman,Sivasailam Thiagarajan and Paula MacGillis, 1977.
• “What Really Works” by Joyce and Nohria, HBR, July 2003.
• “Mastering the Rockefeller Habits” by Verne Harnish.
• Interpretive Release 33-8350; 34-48960, MD&A, United States Securities andExchange Commission.
• “The Third Wave Breaks on the Shores of Accountancy” – Robert K. Elliott, 1992.
• British Petroleum Annual Report 2003.
• Cisco Annual Report 2003.
• Dell Corporation Annual Report 2003.
• Coca Cola Annual Report 2003.
59
Network and Computers Division

Appendix II – Performance Indicators
“Every quality manifests itself in a certain quantity, and without quantity there can be noquality.” Chairman Mao Tse-Tung
Kaufman (1997), offers the following insights concerning the selection of effective indicators:1. Differentiation among means and ends – indicators focused on “ends” are recommended
over those focused on “means”. Indicators focused on means provide incentives andinformation concerning processes, resources or methodology. Indicators focused onends provide incentives and information regarding performance. Indicators focused onends are considered preferable since “ends” are the ultimate measure of whether anyprocess, resource or methodology is “worthy”.
2. The rigor of measurability of the results – There are four scales of measurement(Stevens S.S. 1951 – Handbook of Experimental Psychology):
• Nominal (Naming)
• Ordinal (Rank ordering)
• Interval (Equal scale distances with arbitrary zero point)
• Ratio (Equal scale distances with known zero point)
Objectives are measured on an interval or ratio scale, while goals, aims and purposesuse nominal and ordinal scales. Performance indicators and their associated objectivesshould be measurable on an interval or ratio scale...
3. The array and range of organizational elements covered – indicators should belinked with the other organizational elements to ensure that there is a “results chain,which links internal, organizational results, with external, outside-the-organization,consequences.” The organizational elements are inputs, processes, micro/products,macro/outputs and mega/outcomes. Kaufman discusses indicators for each ofthese elements (inputs and process indicators are those associated with “means”,while the others are associated with “ends”). Further reference is made to Drucker(Management Tasks, responsibilities, practices – 1973), who challenges managementto question whether a task is worth doing at all. Adding this consideration to thepreceding discussion suggests expanding the set of indicators covering theorganizational elements to identify both current and desired values of each indicator.
Examples of objectives and performance indicators associated with each of the three“results” components of the organizational elements above are also provided by Kaufman:
Mega/Outcome Linked – All the sold and delivered automobiles turned out by theplant after June 4 will be safe and effective as indicated by no court ordered changes,mandated modifications, or returns; no complaints under the “Lemon Law”; no upheldsuccessful lawsuits attributed to manufacturing defects or air pollution. There will be noloss of life attributed to defective design, development or fabrication.
Macro/Outputs Related – At least 99% of all parts manufactured by the Santo PlaceboPlant after next month will meet all quality acceptance standards without remanufacturingand will be shipped to distribution points and/or to customers on or before the timescontracted, as indicated by no client complaints about timeliness or quality, or returnsfor defects or dissatisfaction.
Micro/Products Related – At least 99.8% of all computer monitors delivered after January1 will meet all quality acceptance standards, as indicated by sign-off by the quality inspectoron each shift and by no rejects from the quality assurance test laboratory.
60
Network and Computers Division

Appendix III – Risk Taxonomy
The following is a comprehensive model for classification of business risk that was developed by Arthur Andersen and which was published in “Enterprise-wide RiskManagement: Strategies for Linking Risk and Opportunity” by the Financial Times, 2000.This model could form part of an overall taxonomy for Enhanced Business Reporting.
61
Network and Computers Division

Appendix IV – Corporate Values, Ethics and Compliance
Lintun Solutions is committed to translating its principles of effective governance, highintegrity and compliance into the operations of our business. To this end, we developedand maintain a robust compliance and ethics program to:
• Identify, evolve, and renew commitment to our values
• Identify and evolve our strategic, operational, and compliance objectives
• Identify those events that may put our values and objectives at risk
• Proactively respond to risks
Values
Lintun Solutions is committed to the values articulated in our Statement of CorporateValues. The Statement is developed and revised via a series of roundtable discussionsthat include all stakeholders, including employees and other corporate agents at all levels, suppliers, and customers. Lintun Solutions’ values are:1
• A fierce commitment to integrity
• Leadership in the industry and the community
• Mutual respect amongst our personnel and for company policies
These values transcend individuals within the organization and provide a guidepost forall employees at all levels2. Commitment to these values begins with top management,including the Chief Executive Officer and the Board of Directors. Each year, the Board,along with the CEO, signs off on the renewed Statement of Corporate Values.
Objectives
The objectives of our compliance and ethics program are aligned with the overall strategic, operation, and compliance objectives of the enterprise. Each year, we are com-mitted to supporting objectives concerned with promoting and maintaining integrity andcompliance. This past year, the compliance and ethics program also helped to supportthe following objectives:
62
Network and Computers Division
1OCEG requirement to list values.2OCEG requirement that corporate values are primary and are not confused with the individual values of seniormanagement.
Corporate Objective Compliance and Ethics Program Objective
Reduce operating costs 25% • Reduce training delivery costs while maintaining quality
• Reduce issue processing costs while maintaining quality
• Reduce document retention rosts while maintaining quality
Comply with SOX • Update Issue Management System
• Update Document Retention/Management System

Structure
Lintun Solutions employs a Chief Compliance Officer (CCO) who is directly responsiblefor all compliance and ethics management processes. This includes:
• Identifying key events and compliance/ethics risks in our business model
• Maintaining proactive responses to these risks
• Code of Conduct
• Policies and procedures
• Training
• Communications
• Reporting
• Human resource responses (hiring and performance evaluation criteria, etc.)
• Data/record management policies
• Maintaining a “hotline” for reporting and resolving issues
• Ongoing monitoring of the compliance and ethics management processes
• Periodic evaluation of the compliance and ethics management program
The CCO is responsible for all day-to-day compliance and ethics processes includingbusiness conduct, employment, environmental and information privacy. The ChiefFinancial Officer and Chief Audit Executive are jointly responsible for those processesassociated with financial compliance.
The CCO reports to the CEO for day-to-day operations, and periodically to the AuditCommittee to report on key issues that arise in the course of business.3 Performance isevaluated by the Audit Committee.4 Compensation is determined by the Audit Committeeeach year.5 The CCO maintains dedicated staff in the Business Conduct Office (BCO) locatedat our headquarters. In addition, the CCO is responsible for at least one virtual staff person ineach of our operating facilities who serves as a compliance and ethics liaison.
Key Responses
While all of our responses to compliance and ethics risks are important, LintunSolutions relies on several key tools to manage the compliance and ethics program.These tools include the Code of Conduct, the Annual Survey, Issue Management, andProgram Evaluation.
Code of Conduct
The Lintun Code of Business Conduct articulates our governance, compliance, and ethicalobligations and expectations of our business practices. It is updated annually via a seriesof “roundtables” that include all of our stakeholders. The Code is available in every one ofour offices and online at www.Lintun.com/codeOfConduct.6 It is localized to ensure thatnot only the words, but also the spirit of the Code is clear and appropriately communicatedfor each of the 25 countries in which we operate. It addresses the following areas:
• Lintun values, goals, and philosophy
63
Network and Computers Division
3OCEG requirement to disclose the Chief Compliance Officer responsibility and reporting structure4OCEG requirement to disclose who evaluates performance of CCO5OCEG requirement to disclose compensation structure of CCO 6OCEG requirement to disclose where the Code is located
• Importance of the Code
• Consequences for breaking the Code
• Process for reporting issues
• Conflicts of interest
• Gifts and gratuities
• Transparency
• Corporate opportunities and assets
• Social responsibility
The Code is applicable to all employees at all levels7 and is distributed each year via e-mail8. Each employee is required to confirm receipt by visiting a web site and digitally“signing” a statement of confirmation. For those locations where web access is limited, apaper-based confirmation is required9. Further, we recently implemented an onlineassessment of understanding regarding the Code. By 2006, all employees will berequired to confirm understanding of the Code by taking this online test10.
Annual Survey
Each year, we conduct the Lintun Business Conduct Questionnaire (EBCQ) which surveysstakeholders regarding perceptions about the compliance and ethics program – as well asactual behavior observed by stakeholders. This survey helps us keep informed about:
• Employee perceptions about the compliance and ethics program
• Other stakeholder perceptions about the compliance and ethics program
• Actual/potential “hotspots” in our business where we should focus efforts
More than 10,000 employees and managers are required to complete the EBCQ on aregular basis. Results and subsequent investigations are reported to the Audit Committedby the CCO.
Issue Management
Lintun Solutions maintains an issue management “hotline” that allows all stakeholders(employees, corporate agents, suppliers, customers, and other partners) to anonymouslyask questions or report potential issues11. This hotline is available 24 hours each day viaa publicly available web site and toll-free phone number12. Issues are handled accordingto a structured process to ensure consistency and quality.
Program Certification and Evaluation
Lintun Solutions conducts ongoing and period evaluation of the compliance and ethicsprogram. Senior level managers in all business units are required to complete ongoingCompliance and Ethics Certification (CEC) for all compliance and ethics activities in theirareas of responsibility. These certifications are developed and processed by the CCOand staff. Results of the CEC are reported to the Audit Committee. In addition, theInternal Audit Department conducts periodic Regulatory Compliance Reviews (RCR) to
64
Network and Computers Division
7OCEG requirement to disclose to whom the Code is applicable8OCEG requirement to disclose how the Code is distributed9OCEG requirement to disclose how receipt of the Code is confirmed10OCEG requirement to disclose how understanding of the Code is confirmed11OCEG requirement to disclose the scope and anonymity of the issue management mechanism12OCEG requirement to disclose the time-based availability of the issue management mechanism

monitor the effectiveness of our regulatory programs to determine if we are operating in amanner consistent with our policies, procedures and legal requirements. The results ofRCR activities are reported to the CCO and jointly to the Audit Committee by the CCOand Chief Audit Executive (CAE).
Lintun uses several frameworks to provide an objective basis against which we judge ourprogram including the Open Compliance and Ethics Group (OCEG) and FederalSentencing Guidelines (FSG).
Key Areas13
Lintun Solutions has conducted an enterprise-wide analysis of our business processesand events that introduce compliance and ethics related risks. In the past year we havefocused our efforts on the following key areas:
65
Network and Computers Division
13OCEG requirement to disclose key areas that were addressed in the past year.
Area
International Sales
Privacy
Hiring
Potential Risks
Due to increased focus oninternational sales, it is criticalthat all of our salespeopleunderstand fair dealings inobtaining and managing international business.
Lintun operates in severalindustries including financialservices and healthcare whichrequire special attention to theprivacy of certain client data.
Lintun has enjoyed massivegrowth over the past fiveyears – and this has entailedrapid hiring of employees inall locations. It is critical thatall employees who hire orinterview understand expectations regardingequality, diversity, and non-discriminatory hiring.
Proactive Response
We have put in place additional policies, communications and trainingfor all employees with internationalsales responsibilities so that theyunderstand relevant laws and internalpolicies regarding:
• Foreign Corrupt Practices
• Antitrust issues
• Money laundering
• USA PATRIOT issues
We have put in place additionalpolicies, communications and training for all employees so thatthey understand relevant laws andinternal policies regarding:
• Information Privacy (including HIPPA and BL)
We have put in place additionalpolicies, communications and training for all employees who hireand interview so that they understandrelevant laws and internal policiesregarding:
• Anti-discrimination
• Appropriate interviewing

66
Network and Computers Division
Metric Results Goal Notes
Number of 2002: n/a 25% We are pleased to see increased issues reported/ usage of the hotline.number of 2003: 1.4% Internal employees Basis
2004: 2.5%
2005: 12.5%
Number of 2002: n/a 10% With increased usage of the hotline,issues that we find that a majority of issuesresult in 2003: n/a OCEG/ERC result in questions regarding future“incidents’/ standards behavior rather than actualtotal number standards incidents. We are encouraged byof issues this trend and hope that we continue
to find that employees areknowledgeable about the hotlineand use it to voice concerns and askquestions before actions are taken.
Cycle time to 2002: n/a 4 days The rapid increase in processingresolve an efficiency is primarily attributed toincident 2003: n/a Internal the increase in issue management
Basis staff in mid-2003. This improvementof cycle time helps us to understand
2004: 10 days and handle those issues that rise tothe level of incident more quickly.
2005: 5 days
Key Metrics14
Lintun Solutions manages the compliance and ethics processes using several key metrics:
Issue Processing
14OCEG requirement to disclose key metrics

Employee Satisfaction
Employee Commitment and Beliefs
Metric Results Goal Notes
% employees 2002: 76% 90% 2003 represents a 5% decrease inwho are at job satisfaction. This decrease isleast “satisfied” 2003: 71% primarily a result of our acquisitionwith their job of XXX CORP. We found a relevantand work 2004: 85% Internal deviation from the norm inenvironment Basis departments that were affected by
2005: 80% this acquisition. To deal with thisissue, we have developed and areexecuting a communicationsprogram that we believe willalleviate job satisfaction concern.
67
Network and Computers Division
15OCEG/ERC takes an annual survey in the United States of 2,500 employees regarding ethics and compliance perceptions.
Metric Results Goal Notes
% employees 2002: n/a 100% In the past, the primary reasonwho are at least employees were not committed to“committed” to Lintun values was that they were notLintun values 2003: 65% Internal aware of what the values were. We
Basis have made great strides in this2004: 70% regard and continue to work toward
activities that build awareness and2005: 87% commitment to our values.
% employees 2002: n/a > OCEG/ERC We are pleased that in 2003 we who believe annual exceeded the US national average Lintun survey of 82%15. That said, we strive to strives to 2003: n/a consistently exceed the national “do the right average.thing” 2004: 70% OCEG/ERC
2005: 83% standards


