special highlights Economic Census 2016: Profile of SMEs n 2005, following the directive from the National SME Development Council (NSDC), the Department of Statistics, Malaysia (DOSM) conducted the first census on SMEs in Malaysia. The first census entitled ‘Baseline Census of Establishments and Enterprises 2005’ was for the reference year 2003. Subsequently the second census on SMEs named the ‘Economic Census 2011: Profile of Small and Medium Enterprises’ was conducted for the reference year 2010. The Economic Census 2016: Profile of SMEs for the reference year 2015 was officially released on 29 September 2017. This latest Census was undertaken by DOSM during the period of April until November 2016. Special Highlights Economic Census 2016: Profile of SMEs I
Transcript
CHAPTER 1 THE MALAYSIAN ECONOMYspecial highlights Economic Census 2016: Profile of SMEs
n 2005, following the directive from the National SME Development Council (NSDC), the Department of Statistics, Malaysia (DOSM) conducted the first census on SMEs in Malaysia. The first census entitled ‘Baseline Census of Establishments and Enterprises 2005’ was for the reference year 2003. Subsequently the second census on SMEs named the ‘Economic Census
2011: Profile of Small and Medium Enterprises’ was conducted for the reference year 2010. The Economic Census 2016: Profile of SMEs for the reference year 2015 was officially released on 29 September 2017. This latest Census was undertaken by DOSM during the period of April until November 2016.
Special HighlightsEconomic Census 2016: Profile of SMEs
I
SME ANNUAL REPORT 2016/17 SME ANNUAL REPORT 2016/17
Similar to the previous census, the latest release of the Economic Census 2016 covered establishments and firms in the country’s key economic sectors which were based on the Malaysia Standard Industrial Classification (MSIC) 2008 Ver 1.0; namely manufacturing, services, agriculture, construction as well as mining & quarrying sectors.The main source of information for the frame was from the Companies Commission of Malaysia (SSM). Apart from the SSM, information on the frame was also updated from other sources such as from Malaysian Investment Development Authority (MIDA), Ministry of Agriculture and Agro-Based Industry (MOA), Construction Industry Development Board, Malaysia (CIDB), Minerals & Geosciences Department, Malaysia (JMG), Department of Electricity and Gas Supply, various businesses and trade associations, newspaper advertisements and websites.
The Census was also conducted on an establishment basis whereby an establishment is defined as ‘an economic unit that is engaged in one activity, under a single legal entity and operating in a single physical location’. Each establishment was assigned an industry classification based on its principal activity and not to that of its parent company.
Entrepreneurs in the agriculture sector which were registered with the MOA or other Government agencies for the purpose of receiving aid were not covered in this Census.
Data on distributive trade including wholesale trade, retail trade & motor vehicles for reference year 2015 were estimated using data from the Census of Distributive Trade undertaken in 2014 for reference year 2013.
Main Findings from the 2016 CensusIn the newly-released Economic Census 2016, the classification of SMEs used was based on the new definition of SMEs which came into effect on 1 January 2014. The Census revealed that there were altogether 907,065 SMEs operating in Malaysia in 2015, which represent 98.5% of the total establishments of 920,624 firms.
Taking into consideration the new definition of SMEs, the number of SMEs covered in the Economic Census 2011 has been revised to 638,790 SMEs in 2010, as compared to 645,136 SMEs recorded in the earlier publication. Thus, there has been an increment of more than 260,000 establishments, registering an average growth rate of 7.3% per annum from year 2010 until 2015. The increase in the number of SMEs in the latest Census was partly due to a comprehensive Business Register which is known as Establishment Enterprise (EE) Frame. The frame was updated to take into account new establishments and to record any changes in the status of the establishments such as closed down, not in operation, change in activities and location or postal addresses.
Table 1: Number of Establishments and Percentage Share to Total Establishment of SMEs and Large Firms
Source: Economic Census 2011 and Economic Census 2016, Department of Statistics, Malaysia
110
CHAPTER 1 THE MALAYSIAN ECONOMYspecial highlights Economic Census 2016: Profile of SMEs
SMEs by Economic Sector
Looking across key economic sectors, SMEs are highly concentrated in the services sector, which accounted for 89.2% (809,126 firms) of total SME establishments. Meanwhile, about 5.3% of SMEs (47,698) are involved in the manufacturing sector, followed by 4.3% (39,158) in the construction sector, 1.1% (10,218) in the agriculture sector with the remaining 0.1% (865) in the mining & quarrying sector.
111
EC 2011 (Reference Year 2010) EC 2016 (Reference Year 2015)
Table 2: Number of Establishments by Sector and Percentage Share to Total SMEs and Establishments
Note: Figures may not necessarily add up due to rounding
Source: Economic Census 2011 (revised) and Economic Census 2016, Department of Statistics, Malaysia
In the services sector, majority of SMEs are predominantly in the distributive trade sub-sector (wholesale & retail trade services) including repair of motor vehicles & motorcycles, followed by food & beverages services and transportation & storages services (refer to Chart 1).
The Census revealed that there were altogether 907,065 SMEs operating in Malaysia in 2015, which represent 98.5% of the total establishments of 920,624 firms
“
”
SME ANNUAL REPORT 2016/17 SME ANNUAL REPORT 2016/17
Chart 1: Percentage Share of SMEs in Services Sector by Sub-sector (%)
Source: Economic Census 2016, Department of Statistics, Malaysia
In the manufacturing sector, most SMEs are concentrated in the textiles & wearing apparel, food & beverages products, fabricated metal and machinery & equipment sub-sectors (refer to Chart 2).
Chart 2: Percentage Share of SMEs in the Manufacturing Sector by Sub-sector (%)
Source: Economic Census 2016, Department of Statistics, Malaysia
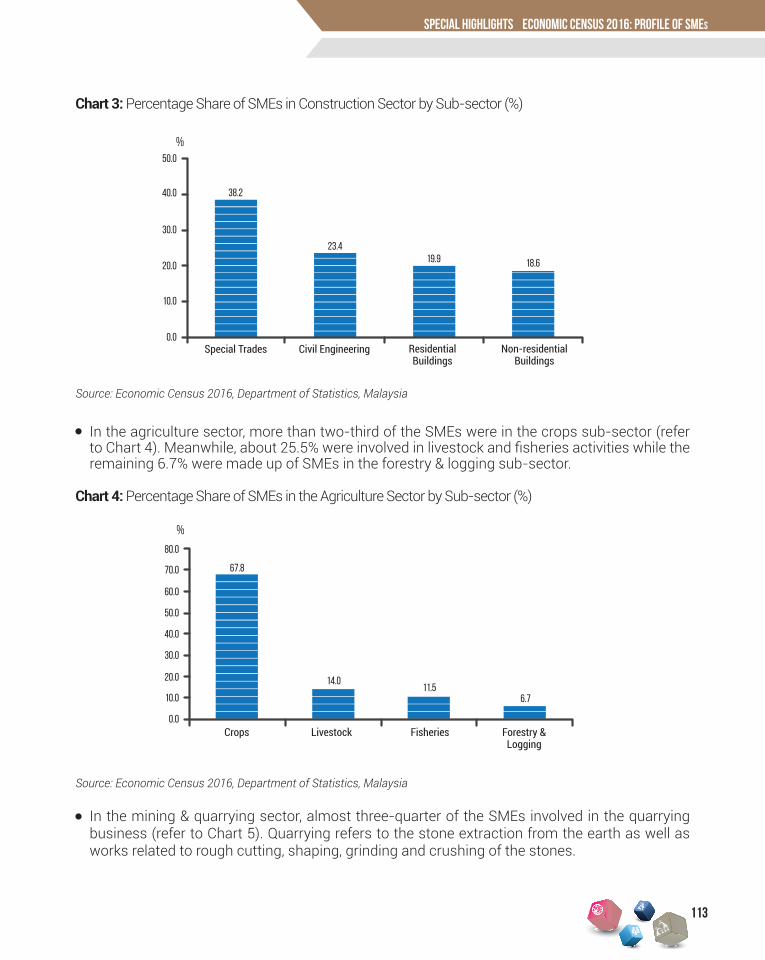
In the construction sector, SMEs were mainly involved in the special trades sub-sector, forming about 38.2% of total establishments in the sector (refer to Chart 3). Special trades refer to the construction of parts of buildings such as plumbing installation, concrete works and plastering, without full responsibility for the entire project.
12.8
84.3
91.7
49.5
31.011.6
82.4
72.2
50.4
32.08.4
45.5
34.2
55.1
76.7
10.1
38.5
42.4
65.6
79.8
60.051.2
20.4
6.6 5.6 4.2
12.0
50.0
40.0
30.0
20.0
10.0
0.0
Wholesale &Retail Trade
Food &Beverages
Transportation& Storage
PersonalServices
ProfessionalServices
Others
Textiles &WearingApparel
Food &Beverages
FabricatedMetal
Products
Machinery& Equipment
Printing Furniture Rubber &Plastic
Products
Non-metalicMineral
Products
WoodProducts
Electrical &Electronics
Others
18.2 17.4
11.1 9.9
6.75.2 5.1 4.2 3.6 3.6
14.9
0.0
4.0
8.0
12.0
16.0
20.0
38.2
19.923.4
18.6
Special Trades Civil Engineering ResidentialBuildings
Non-residentialBuildings
0.0
10.0
20.0
30.0
40.0
50.0
Crops Livestock Fisheries
67.8
14.011.5
6.7
0.0
10.0
20.0
30.0
40.0
50.0
60.0
70.0
80.0
Forestry &Logging
Quarrying Mineral Mining Petroleum &Natural Gas
0.0
20.0
40.0
60.0
80.0
100.0
74.2
15.510.3
EC 2011 EC 2016 Services
Micro Small Medium
Manufacturing Agriculture Construction Mining &Quarrying
0.010.020.030.040.050.060.070.080.090.0
100.02.7
20.2
77.1 76.5 80.2
18.3
48.4
5.3 11.9 12.322.0
40.543.4
52.9
46.347.6 44.2
25.1
21.2
2.3 1.5
Services92.7%
Manufacturing5.1%
Mining & Quarrying0.01%
Construction1.4% Agriculture
0.8%
32.1
20.8 22.118.0
47.6
62.5 75.0
66.0
14.5
25.4
76.172.8
0.0
20.0
40.0
60.0
80.0
100.0
120.0
140.0
160.0
180.0
200.0
Overall
Others1
Financing via online platform (crowdfunding platform)
Co-operatives
Grants or financing from Government
Suppliers/trade credit/angels/NGOs
Friends or relatives
Banks/DFIs/microcredit institutions
Internal funds/shareholders/personal savingsMicro Small Medium
Debt consolidation/refinancing
Improvement or upgrade production process
R&D, acquire another business and others
Purchase or renting machinery/equipment/vehicles/computer software & hardware and land/building
Working capital
0.0
10.0
20.0
30.0
40.0
50.0
60.0
70.0
80.0
90.0
100.0
EC 2011
Did not use ICT in business Used ICT in business
EC 2016
Did not useinternet inbusiness,
43.9%Used internetin business,
43.9%
Did not usewebsite inbusiness,
77.2%
Used websitein business,
22.8%
51.5%
48.5%36.1%
63.9%
0.0
10.0
20.0
30.0
40.0
50.0
60.0
70.0
80.0
90.0
100.0
110.0
120.0
130.0
2.2 1.5 1.1 0.9
Promotion & Marketing
Overseas exposition and exhibition
Press release wire
Events sponsorship
Local exposition and axhibition
Marketing agent
Advertisement
Search engine optimisation
Flyers, catalogues etc.
Social networking website
Not applicable
83.8
11.0
7.9
6.6
6.25.3
%
%
%
%
%
% share tototal SMEs
%
%
300.0
250.0
200.0
150.0
100.0
50.0
0.0Overall Micro Small Medium
%
112
60.051.2
20.4
6.6 5.6 4.2
12.0
50.0
40.0
30.0
20.0
10.0
0.0
Wholesale &Retail Trade
Food &Beverages
Transportation& Storage
PersonalServices
ProfessionalServices
Others
%
CHAPTER 1 THE MALAYSIAN ECONOMYspecial highlights Economic Census 2016: Profile of SMEs
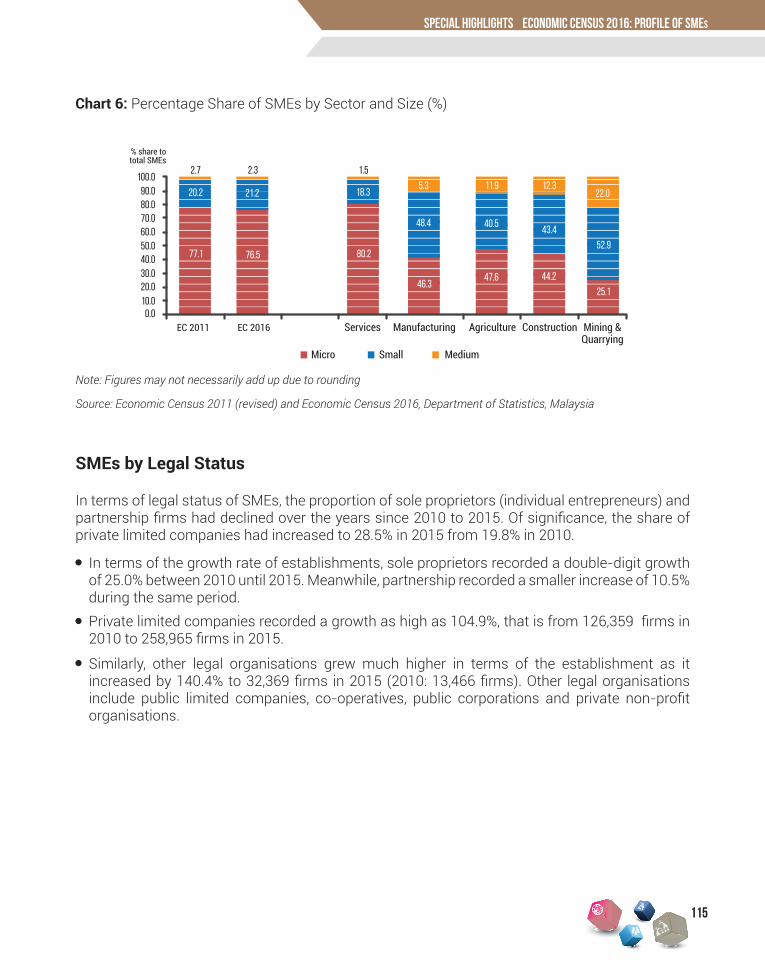
In the agriculture sector, more than two-third of the SMEs were in the crops sub-sector (refer to Chart 4). Meanwhile, about 25.5% were involved in livestock and fisheries activities while the remaining 6.7% were made up of SMEs in the forestry & logging sub-sector.
Chart 3: Percentage Share of SMEs in Construction Sector by Sub-sector (%)
Source: Economic Census 2016, Department of Statistics, Malaysia
12.8
84.3
91.7
49.5
31.011.6
82.4
72.2
50.4
32.08.4
45.5
34.2
55.1
76.7
10.1
38.5
42.4
65.6
79.8
60.051.2
20.4
6.6 5.6 4.2
12.0
50.0
40.0
30.0
20.0
10.0
0.0
Wholesale &Retail Trade
Food &Beverages
Transportation& Storage
PersonalServices
ProfessionalServices
Others
Textiles &WearingApparel
Food &Beverages
FabricatedMetal
Products
Machinery& Equipment
Printing Furniture Rubber &Plastic
Products
Non-metalicMineral
Products
WoodProducts
Electrical &Electronics
Others
18.2 17.4
11.1 9.9
6.75.2 5.1 4.2 3.6 3.6
14.9
0.0
4.0
8.0
12.0
16.0
20.0
38.2
19.923.4
18.6
Special Trades Civil Engineering ResidentialBuildings
Non-residentialBuildings
0.0
10.0
20.0
30.0
40.0
50.0
Crops Livestock Fisheries
67.8
14.011.5
6.7
0.0
10.0
20.0
30.0
40.0
50.0
60.0
70.0
80.0
Forestry &Logging
Quarrying Mineral Mining Petroleum &Natural Gas
0.0
20.0
40.0
60.0
80.0
100.0
74.2
15.510.3
EC 2011 EC 2016 Services
Micro Small Medium
Manufacturing Agriculture Construction Mining &Quarrying
0.010.020.030.040.050.060.070.080.090.0
100.02.7
20.2
77.1 76.5 80.2
18.3
48.4
5.3 11.9 12.322.0
40.543.4
52.9
46.347.6 44.2
25.1
21.2
2.3 1.5
Services92.7%
Manufacturing5.1%
Mining & Quarrying0.01%
Construction1.4% Agriculture
0.8%
32.1
20.8 22.118.0
47.6
62.5 75.0
66.0
14.5
25.4
76.172.8
0.0
20.0
40.0
60.0
80.0
100.0
120.0
140.0
160.0
180.0
200.0
Overall
Others1
Financing via online platform (crowdfunding platform)
Co-operatives
Grants or financing from Government
Suppliers/trade credit/angels/NGOs
Friends or relatives
Banks/DFIs/microcredit institutions
Internal funds/shareholders/personal savingsMicro Small Medium
Debt consolidation/refinancing
Improvement or upgrade production process
R&D, acquire another business and others
Purchase or renting machinery/equipment/vehicles/computer software & hardware and land/building
Working capital
0.0
10.0
20.0
30.0
40.0
50.0
60.0
70.0
80.0
90.0
100.0
EC 2011
Did not use ICT in business Used ICT in business
EC 2016
Did not useinternet inbusiness,
43.9%Used internetin business,
43.9%
Did not usewebsite inbusiness,
77.2%
Used websitein business,
22.8%
51.5%
48.5%36.1%
63.9%
0.0
10.0
20.0
30.0
40.0
50.0
60.0
70.0
80.0
90.0
100.0
110.0
120.0
130.0
2.2 1.5 1.1 0.9
Promotion & Marketing
Overseas exposition and exhibition
Press release wire
Events sponsorship
Local exposition and axhibition
Marketing agent
Advertisement
Search engine optimisation
Flyers, catalogues etc.
Social networking website
Not applicable
83.8
11.0
7.9
6.6
6.25.3
%
%
%
%
%
% share tototal SMEs
%
%
300.0
250.0
200.0
150.0
100.0
50.0
0.0Overall Micro Small Medium
%
In the mining & quarrying sector, almost three-quarter of the SMEs involved in the quarrying business (refer to Chart 5). Quarrying refers to the stone extraction from the earth as well as works related to rough cutting, shaping, grinding and crushing of the stones.
Chart 4: Percentage Share of SMEs in the Agriculture Sector by Sub-sector (%)
Source: Economic Census 2016, Department of Statistics, Malaysia
12.8
84.3
91.7
49.5
31.011.6
82.4
72.2
50.4
32.08.4
45.5
34.2
55.1
76.7
10.1
38.5
42.4
65.6
79.8
60.051.2
20.4
6.6 5.6 4.2
12.0
50.0
40.0
30.0
20.0
10.0
0.0
Wholesale &Retail Trade
Food &Beverages
Transportation& Storage
PersonalServices
ProfessionalServices
Others
Textiles &WearingApparel
Food &Beverages
FabricatedMetal
Products
Machinery& Equipment
Printing Furniture Rubber &Plastic
Products
Non-metalicMineral
Products
WoodProducts
Electrical &Electronics
Others
18.2 17.4
11.1 9.9
6.75.2 5.1 4.2 3.6 3.6
14.9
0.0
4.0
8.0
12.0
16.0
20.0
38.2
19.923.4
18.6
Special Trades Civil Engineering ResidentialBuildings
Non-residentialBuildings
0.0
10.0
20.0
30.0
40.0
50.0
Crops Livestock Fisheries
67.8
14.011.5
6.7
0.0
10.0
20.0
30.0
40.0
50.0
60.0
70.0
80.0
Forestry &Logging
Quarrying Mineral Mining Petroleum &Natural Gas
0.0
20.0
40.0
60.0
80.0
100.0
74.2
15.510.3
EC 2011 EC 2016 Services
Micro Small Medium
Manufacturing Agriculture Construction Mining &Quarrying
0.010.020.030.040.050.060.070.080.090.0
100.02.7
20.2
77.1 76.5 80.2
18.3
48.4
5.3 11.9 12.322.0
40.543.4
52.9
46.347.6 44.2
25.1
21.2
2.3 1.5
Services92.7%
Manufacturing5.1%
Mining & Quarrying0.01%
Construction1.4% Agriculture
0.8%
32.1
20.8 22.118.0
47.6
62.5 75.0
66.0
14.5
25.4
76.172.8
0.0
20.0
40.0
60.0
80.0
100.0
120.0
140.0
160.0
180.0
200.0
Overall
Others1
Financing via online platform (crowdfunding platform)
Co-operatives
Grants or financing from Government
Suppliers/trade credit/angels/NGOs
Friends or relatives
Banks/DFIs/microcredit institutions
Internal funds/shareholders/personal savingsMicro Small Medium
Debt consolidation/refinancing
Improvement or upgrade production process
R&D, acquire another business and others
Purchase or renting machinery/equipment/vehicles/computer software & hardware and land/building
Working capital
0.0
10.0
20.0
30.0
40.0
50.0
60.0
70.0
80.0
90.0
100.0
EC 2011
Did not use ICT in business Used ICT in business
EC 2016
Did not useinternet inbusiness,
43.9%Used internetin business,
43.9%
Did not usewebsite inbusiness,
77.2%
Used websitein business,
22.8%
51.5%
48.5%36.1%
63.9%
0.0
10.0
20.0
30.0
40.0
50.0
60.0
70.0
80.0
90.0
100.0
110.0
120.0
130.0
2.2 1.5 1.1 0.9
Promotion & Marketing
Overseas exposition and exhibition
Press release wire
Events sponsorship
Local exposition and axhibition
Marketing agent
Advertisement
Search engine optimisation
Flyers, catalogues etc.
Social networking website
Not applicable
83.8
11.0
7.9
6.6
6.25.3
%
%
%
%
%
% share tototal SMEs
%
%
300.0
250.0
200.0
150.0
100.0
50.0
0.0Overall Micro Small Medium
%
113
SME ANNUAL REPORT 2016/17 SME ANNUAL REPORT 2016/17
Chart 5: Percentage Share of SMEs in Mining & Quarrying Sector by Sub-sector (%)
Source: Economic Census 2016, Department of Statistics, Malaysia
114
12.8
84.3
91.7
49.5
31.011.6
82.4
72.2
50.4
32.08.4
45.5
34.2
55.1
76.7
10.1
38.5
42.4
65.6
79.8
60.051.2
20.4
6.6 5.6 4.2
12.0
50.0
40.0
30.0
20.0
10.0
0.0
Wholesale &Retail Trade
Food &Beverages
Transportation& Storage
PersonalServices
ProfessionalServices
Others
Textiles &WearingApparel
Food &Beverages
FabricatedMetal
Products
Machinery& Equipment
Printing Furniture Rubber &Plastic
Products
Non-metalicMineral
Products
WoodProducts
Electrical &Electronics
Others
18.2 17.4
11.1 9.9
6.75.2 5.1 4.2 3.6 3.6
14.9
0.0
4.0
8.0
12.0
16.0
20.0
38.2
19.923.4
18.6
Special Trades Civil Engineering ResidentialBuildings
Non-residentialBuildings
0.0
10.0
20.0
30.0
40.0
50.0
Crops Livestock Fisheries
67.8
14.011.5
6.7
0.0
10.0
20.0
30.0
40.0
50.0
60.0
70.0
80.0
Forestry &Logging
Quarrying Mineral Mining Petroleum &Natural Gas
0.0
20.0
40.0
60.0
80.0
100.0
74.2
15.510.3
EC 2011 EC 2016 Services
Micro Small Medium
Manufacturing Agriculture Construction Mining &Quarrying
0.010.020.030.040.050.060.070.080.090.0
100.02.7
20.2
77.1 76.5 80.2
18.3
48.4
5.3 11.9 12.322.0
40.543.4
52.9
46.347.6 44.2
25.1
21.2
2.3 1.5
Services92.7%
Manufacturing5.1%
Mining & Quarrying0.01%
Construction1.4% Agriculture
0.8%
32.1
20.8 22.118.0
47.6
62.5 75.0
66.0
14.5
25.4
76.172.8
0.0
20.0
40.0
60.0
80.0
100.0
120.0
140.0
160.0
180.0
200.0
Overall
Others1
Financing via online platform (crowdfunding platform)
Co-operatives
Grants or financing from Government
Suppliers/trade credit/angels/NGOs
Friends or relatives
Banks/DFIs/microcredit institutions
Internal funds/shareholders/personal savingsMicro Small Medium
Debt consolidation/refinancing
Improvement or upgrade production process
R&D, acquire another business and others
Purchase or renting machinery/equipment/vehicles/computer software & hardware and land/building
Working capital
0.0
10.0
20.0
30.0
40.0
50.0
60.0
70.0
80.0
90.0
100.0
EC 2011
Did not use ICT in business Used ICT in business
EC 2016
Did not useinternet inbusiness,
43.9%Used internetin business,
43.9%
Did not usewebsite inbusiness,
77.2%
Used websitein business,
22.8%
51.5%
48.5%36.1%
63.9%
0.0
10.0
20.0
30.0
40.0
50.0
60.0
70.0
80.0
90.0
100.0
110.0
120.0
130.0
2.2 1.5 1.1 0.9
Promotion & Marketing
Overseas exposition and exhibition
Press release wire
Events sponsorship
Local exposition and axhibition
Marketing agent
Advertisement
Search engine optimisation
Flyers, catalogues etc.
Social networking website
Not applicable
83.8
11.0
7.9
6.6
6.25.3
%
%
%
%
%
% share tototal SMEs
%
%
300.0
250.0
200.0
150.0
100.0
50.0
0.0Overall Micro Small Medium
%
SMEs by Firm Size
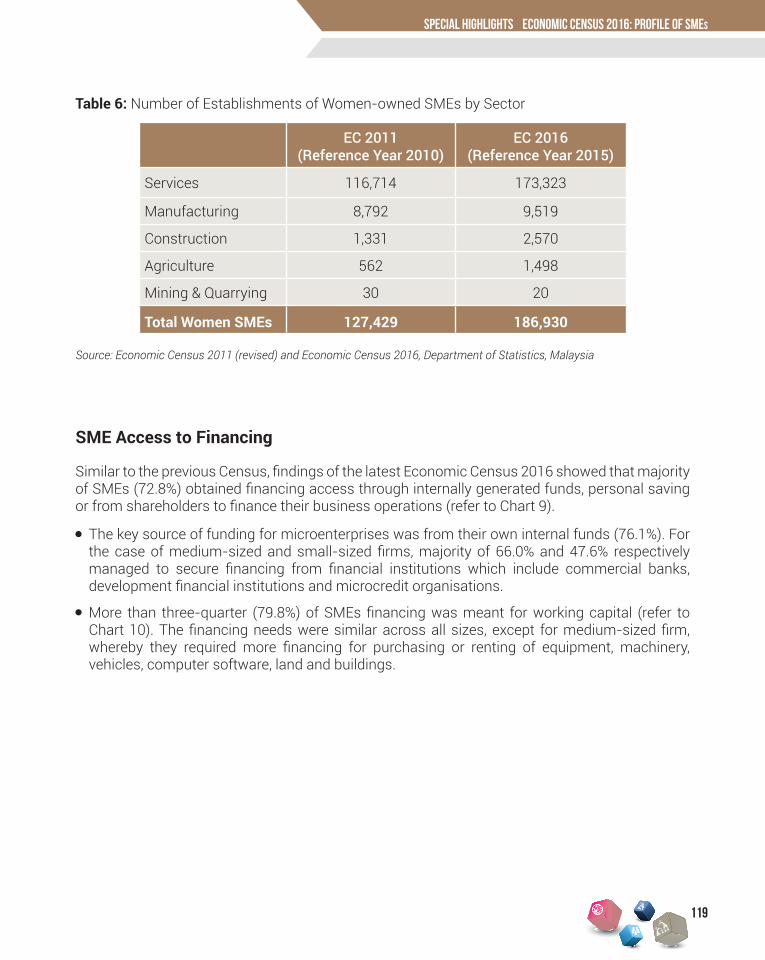
In terms of size, majority of the SMEs were microenterprises, constituting 76.5% of total SMEs in Malaysia (2010: 77.1%). Meanwhile, small-sized SMEs formed 21.2% of the total SME establishments and the balance 2.3% were medium-sized SMEs. Comparing the structure of these SMEs in 2010 until 2015, microenterprises grew by 40.8% in terms of number of establishments, small-sized firms grew by 49.4% and medium-sized firms grew by 21.5%. Microenterprises, which are mostly business operators with less than five full-time employees, were predominant across the services sector. Meanwhile, large proportion of SMEs in the manufacturing, construction and agriculture sectors were well-balanced across microenterprises and small-sized firms, with only small portion were medium-sized firms. On the other hand, more than half of the SMEs in the mining & quarrying sector was made up of small-sized firms.
EC 2011 (Reference Year 2010) EC 2016 (Reference Year 2015)
% share to total SMEs 77.1 20.2 2.7 100.0 76.5 21.2 2.3 100.0
% share to total establishment
76.0 19.9 2.6 98.5 75.3 20.9 2.2 98.5
Table 3: Number of Establishments and Percentage Share of SMEs by Firm Size
Note: Figures may not necessarily add up due to rounding
Source: Economic Census 2011 (revised) and Economic Census 2016, Department of Statistics, Malaysia
CHAPTER 1 THE MALAYSIAN ECONOMYspecial highlights Economic Census 2016: Profile of SMEs
115
Chart 6: Percentage Share of SMEs by Sector and Size (%)
12.8
84.3
91.7
49.5
31.011.6
82.4
72.2
50.4
32.08.4
45.5
34.2
55.1
76.7
10.1
38.5
42.4
65.6
79.8
60.051.2
20.4
6.6 5.6 4.2
12.0
50.0
40.0
30.0
20.0
10.0
0.0
Wholesale &Retail Trade
Food &Beverages
Transportation& Storage
PersonalServices
ProfessionalServices
Others
Textiles &WearingApparel
Food &Beverages
FabricatedMetal
Products
Machinery& Equipment
Printing Furniture Rubber &Plastic
Products
Non-metalicMineral
Products
WoodProducts
Electrical &Electronics
Others
18.2 17.4
11.1 9.9
6.75.2 5.1 4.2 3.6 3.6
14.9
0.0
4.0
8.0
12.0
16.0
20.0
38.2
19.923.4
18.6
Special Trades Civil Engineering ResidentialBuildings
Non-residentialBuildings
0.0
10.0
20.0
30.0
40.0
50.0
Crops Livestock Fisheries
67.8
14.011.5
6.7
0.0
10.0
20.0
30.0
40.0
50.0
60.0
70.0
80.0
Forestry &Logging
Quarrying Mineral Mining Petroleum &Natural Gas
0.0
20.0
40.0
60.0
80.0
100.0
74.2
15.510.3
EC 2011 EC 2016 Services
Micro Small Medium
Manufacturing Agriculture Construction Mining &Quarrying
0.010.020.030.040.050.060.070.080.090.0
100.02.7
20.2
77.1 76.5 80.2
18.3
48.4
5.3 11.9 12.322.0
40.543.4
52.9
46.347.6 44.2
25.1
21.2
2.3 1.5
Services92.7%
Manufacturing5.1%
Mining & Quarrying0.01%
Construction1.4% Agriculture
0.8%
32.1
20.8 22.118.0
47.6
62.5 75.0
66.0
14.5
25.4
76.172.8
0.0
20.0
40.0
60.0
80.0
100.0
120.0
140.0
160.0
180.0
200.0
Overall
Others1
Financing via online platform (crowdfunding platform)
Co-operatives
Grants or financing from Government
Suppliers/trade credit/angels/NGOs
Friends or relatives
Banks/DFIs/microcredit institutions
Internal funds/shareholders/personal savingsMicro Small Medium
Debt consolidation/refinancing
Improvement or upgrade production process
R&D, acquire another business and others
Purchase or renting machinery/equipment/vehicles/computer software & hardware and land/building
Working capital
0.0
10.0
20.0
30.0
40.0
50.0
60.0
70.0
80.0
90.0
100.0
EC 2011
Did not use ICT in business Used ICT in business
EC 2016
Did not useinternet inbusiness,
43.9%Used internetin business,
43.9%
Did not usewebsite inbusiness,
77.2%
Used websitein business,
22.8%
51.5%
48.5%36.1%
63.9%
0.0
10.0
20.0
30.0
40.0
50.0
60.0
70.0
80.0
90.0
100.0
110.0
120.0
130.0
2.2 1.5 1.1 0.9
Promotion & Marketing
Overseas exposition and exhibition
Press release wire
Events sponsorship
Local exposition and axhibition
Marketing agent
Advertisement
Search engine optimisation
Flyers, catalogues etc.
Social networking website
Not applicable
83.8
11.0
7.9
6.6
6.25.3
%
%
%
%
%
% share tototal SMEs
%
%
300.0
250.0
200.0
150.0
100.0
50.0
0.0Overall Micro Small Medium
%
In terms of legal status of SMEs, the proportion of sole proprietors (individual entrepreneurs) and partnership firms had declined over the years since 2010 to 2015. Of significance, the share of private limited companies had increased to 28.5% in 2015 from 19.8% in 2010.
SMEs by Legal Status
In terms of the growth rate of establishments, sole proprietors recorded a double-digit growth of 25.0% between 2010 until 2015. Meanwhile, partnership recorded a smaller increase of 10.5% during the same period.
Similarly, other legal organisations grew much higher in terms of the establishment as it increased by 140.4% to 32,369 firms in 2015 (2010: 13,466 firms). Other legal organisations include public limited companies, co-operatives, public corporations and private non-profit organisations.
Private limited companies recorded a growth as high as 104.9%, that is from 126,359 firms in 2010 to 258,965 firms in 2015.
Note: Figures may not necessarily add up due to rounding
Source: Economic Census 2011 (revised) and Economic Census 2016, Department of Statistics, Malaysia
SME ANNUAL REPORT 2016/17 SME ANNUAL REPORT 2016/17
SMEs by Geographical Location
Findings of the Economic Census 2016 showed a major increase in the shares of SMEs in Kuala Lumpur and Pulau Pinang as compared with the shares recorded in 2010 based on Economic Census 2011. There was also higher number of SMEs recorded in Johor, Selangor and Melaka.
116
EC 2011(Reference Year 2010)
EC 2016 (Reference Year 2015)
No. of establishment
% share tototal SMEs
No. of establishment
% share to total SMEs
Sole Proprietor 443,901 69.5 554,900 61.2
Partnership 55,064 8.6 60,831 6.7
Private Limited 126,359 19.8 258,965 28.5
Others 13,466 2.1 32,369 3.6
Total SMEs 638,790 100.0 907,065 100.0
Table 4: SMEs by Legal Status
Source: Economic Census 2011 (revised) and Economic Census 2016, Department of Statistics, Malaysia
Klang Valley (Selangor and Kuala Lumpur) accounted for more than one-third of the total SMEs.
States that recorded the highest increase in terms of percentage share of SMEs were Kuala Lumpur (+1.6 percentage points) and Pulau Pinang (+1.1 percentage points).
Generally, more than 60% of SMEs are mainly concentrated in the top five States namely Selangor (19.8%), Kuala Lumpur (14.7%), Johor (10.8%), Perak (8.3%) and Pulau Pinang (7.4%).
CHAPTER 1 THE MALAYSIAN ECONOMYspecial highlights Economic Census 2016: Profile of SMEs
117
EC 2011 (Reference Year 2010)
EC 2016 (Reference Year 2015)
Percentage pointincrease / decrease
Selangor 19.7 19.8 + 0.1
WP Kuala Lumpur 13.1 14.7 + 1.6
Johor 10.6 10.8 + 0.2
Perak 9.1 8.3 - 0.8
Pulau Pinang 6.3 7.4 + 1.1
Sarawak 6.8 6.7 - 0.1
Sabah 6.4 6.2 - 0.2
Kedah 5.6 5.4 - 0.2
Kelantan 5.9 5.1 - 0.8
Pahang 4.5 4.1 - 0.4
Negeri Sembilan 3.9 3.6 - 0.3
Melaka 3.4 3.5 + 0.1
Terengganu 3.5 3.2 - 0.3
Perlis 0.8 0.8 0.0
WP Labuan 0.3 0.3 0.0
WP Putrajaya 0.1 0.1 0.0
Total SMEs 100.0 100.0
Table 5: Percentage Share of SMEs by State in 2015 vis-a-vis 2010 (%)
Source: Economic Census 2011 (revised) and Economic Census 2016, Department of Statistics, Malaysia
SME ANNUAL REPORT 2016/17 SME ANNUAL REPORT 2016/17
Chart 7: Percentage Share of SMEs by State (%)
Source: Economic Census 2016, Department of Statistics, Malaysia
Women-owned SMEs
By definition, women-owned SMEs are firms of which women hold at least 51% of the equity, or the CEOs are women that own at least 10% of the equity. In 2015, women-owned SMEs accounted for 186,930 firms or about 20.6% of total SMEs in Malaysia (2010: 127,429 firms). There was an increase of 46.7%, from the one recorded in 2010. In terms of breakdown by sectors, majority 92.7% of women-owned are SMEs engaged in the services sector, followed by the manufacturing sector (5.1%). Women however are less involved in the construction, agriculture as well as mining & quarrying sectors.
Chart 8: Distribution of Women-owned SMEs by Sector (%)
118
Perlis0.8%
5.1%
3.2%
4.1%
6.2%
0.3%
6.7%
10.8%
7.4%
5.4%
8.3%
19.8%
14.7%
0.1%
3.6%
3.5%
Pulau Pinang
Kedah
Perak
Selangor
WP Kuala Lumpur
WP PutrajayaNegeri Sembilan
Melaka
Johor
Pahang
Terengganu
Kelantan
WP Labuan
Sarawak
Sabah
Services92.7%
Manufacturing5.1%
Mining & Quarrying0.01%
Construction1.4% Agriculture
0.8%
Note: Figures may not necessarily add up due to rounding
Source: Economic Census 2016, Department of Statistics, Malaysia
CHAPTER 1 THE MALAYSIAN ECONOMYspecial highlights Economic Census 2016: Profile of SMEs
119
SME Access to Financing
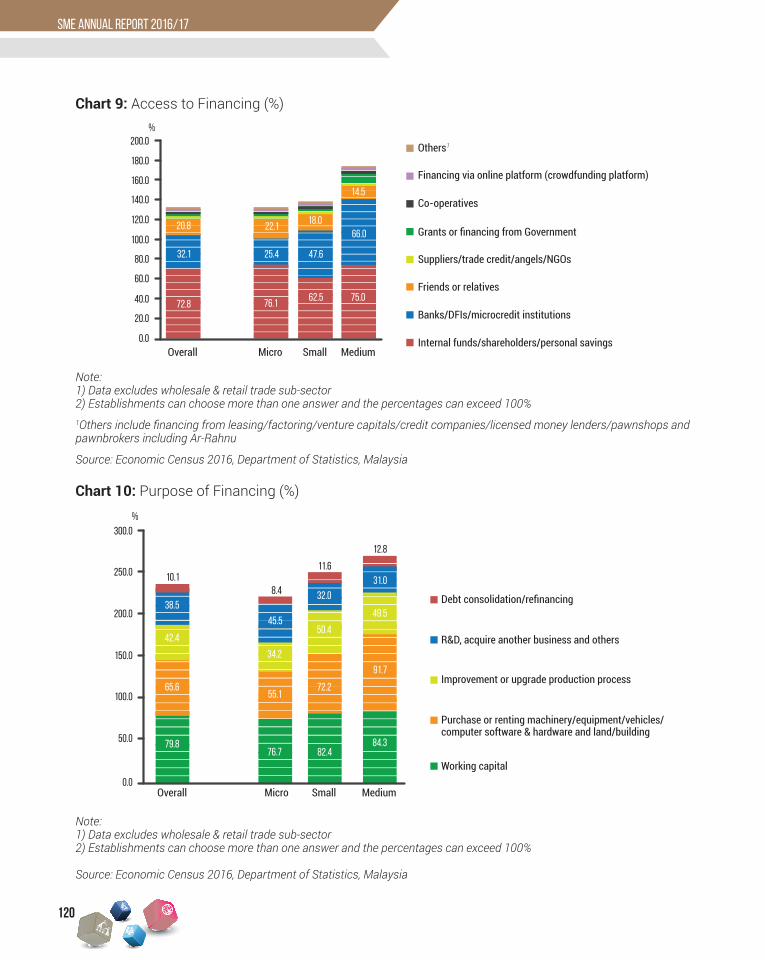
Similar to the previous Census, findings of the latest Economic Census 2016 showed that majority of SMEs (72.8%) obtained financing access through internally generated funds, personal saving or from shareholders to finance their business operations (refer to Chart 9).
Table 6: Number of Establishments of Women-owned SMEs by Sector
Source: Economic Census 2011 (revised) and Economic Census 2016, Department of Statistics, Malaysia
The key source of funding for microenterprises was from their own internal funds (76.1%). For the case of medium-sized and small-sized firms, majority of 66.0% and 47.6% respectively managed to secure financing from financial institutions which include commercial banks, development financial institutions and microcredit organisations.
More than three-quarter (79.8%) of SMEs financing was meant for working capital (refer to Chart 10). The financing needs were similar across all sizes, except for medium-sized firm, whereby they required more financing for purchasing or renting of equipment, machinery, vehicles, computer software, land and buildings.
EC 2011(Reference Year 2010)
EC 2016(Reference Year 2015)
Services 116,714 173,323
Manufacturing 8,792 9,519
Construction 1,331 2,570
Agriculture 562 1,498
Mining & Quarrying 30 20
Total Women SMEs 127,429 186,930
SME ANNUAL REPORT 2016/17 SME ANNUAL REPORT 2016/17
Chart 9: Access to Financing (%)
Note: 1) Data excludes wholesale & retail trade sub-sector2) Establishments can choose more than one answer and the percentages can exceed 100%1Others include financing from leasing/factoring/venture capitals/credit companies/licensed money lenders/pawnshops and pawnbrokers including Ar-Rahnu
Source: Economic Census 2016, Department of Statistics, Malaysia
Note: 1) Data excludes wholesale & retail trade sub-sector2) Establishments can choose more than one answer and the percentages can exceed 100%
Source: Economic Census 2016, Department of Statistics, Malaysia
Chart 10: Purpose of Financing (%)
120
12.8
84.3
91.7
49.5
31.011.6
82.4
72.2
50.4
32.08.4
45.5
34.2
55.1
76.7
10.1
38.5
42.4
65.6
79.8
60.051.2
20.4
6.6 5.6 4.2
12.0
50.0
40.0
30.0
20.0
10.0
0.0
Wholesale &Retail Trade
Food &Beverages
Transportation& Storage
PersonalServices
ProfessionalServices
Others
Textiles &WearingApparel
Food &Beverages
FabricatedMetal
Products
Machinery& Equipment
Printing Furniture Rubber &Plastic
Products
Non-metalicMineral
Products
WoodProducts
Electrical &Electronics
Others
18.2 17.4
11.1 9.9
6.75.2 5.1 4.2 3.6 3.6
14.9
0.0
4.0
8.0
12.0
16.0
20.0
38.2
19.923.4
18.6
Special Trades Civil Engineering ResidentialBuildings
Non-residentialBuildings
0.0
10.0
20.0
30.0
40.0
50.0
Crops Livestock Fisheries
67.8
14.011.5
6.7
0.0
10.0
20.0
30.0
40.0
50.0
60.0
70.0
80.0
Forestry &Logging
Quarrying Mineral Mining Petroleum &Natural Gas
0.0
20.0
40.0
60.0
80.0
100.0
74.2
15.510.3
EC 2011 EC 2016 Services
Micro Small Medium
Manufacturing Agriculture Construction Mining &Quarrying
0.010.020.030.040.050.060.070.080.090.0
100.02.7
20.2
77.1 76.5 80.2
18.3
48.4
5.3 11.9 12.322.0
40.543.4
52.9
46.347.6 44.2
25.1
21.2
2.3 1.5
Services92.7%
Manufacturing5.1%
Mining & Quarrying0.01%
Construction1.4% Agriculture
0.8%
32.1
20.8 22.118.0
47.6
62.5 75.0
66.0
14.5
25.4
76.172.8
0.0
20.0
40.0
60.0
80.0
100.0
120.0
140.0
160.0
180.0
200.0
Overall
Others1
Financing via online platform (crowdfunding platform)
Co-operatives
Grants or financing from Government
Suppliers/trade credit/angels/NGOs
Friends or relatives
Banks/DFIs/microcredit institutions
Internal funds/shareholders/personal savingsMicro Small Medium
Debt consolidation/refinancing
Improvement or upgrade production process
R&D, acquire another business and others
Purchase or renting machinery/equipment/vehicles/computer software & hardware and land/building
Working capital
0.0
10.0
20.0
30.0
40.0
50.0
60.0
70.0
80.0
90.0
100.0
EC 2011
Did not use ICT in business Used ICT in business
EC 2016
Did not useinternet inbusiness,
43.9%Used internetin business,
43.9%
Did not usewebsite inbusiness,
77.2%
Used websitein business,
22.8%
51.5%
48.5%36.1%
63.9%
0.0
10.0
20.0
30.0
40.0
50.0
60.0
70.0
80.0
90.0
100.0
110.0
120.0
130.0
2.2 1.5 1.1 0.9
Promotion & Marketing
Overseas exposition and exhibition
Press release wire
Events sponsorship
Local exposition and axhibition
Marketing agent
Advertisement
Search engine optimisation
Flyers, catalogues etc.
Social networking website
Not applicable
83.8
11.0
7.9
6.6
6.25.3
%
%
%
%
%
% share tototal SMEs
%
%
300.0
250.0
200.0
150.0
100.0
50.0
0.0Overall Micro Small Medium
%
CHAPTER 1 THE MALAYSIAN ECONOMYspecial highlights Economic Census 2016: Profile of SMEs
121
Promotion and Marketing Activities of SMEs
The Census revealed that about 16.4% of SMEs undertook some form of marketing and promotion activities whereby most of SMEs utilised social networking platform to market their products or services. The other types of medium used were mostly through printed materials such as flyers and catalogues, followed by search engine optimisation, advertisement and marketing agents. Nevertheless, majority of SMEs (83.6%) still did not undertake any promotional or marketing activities to enhance their businesses.
Chart 11: Promotion and Marketing Activities of SMEs (%)
83.6%11.0%
Socialnetworking
website
6.6%Search engineoptimisation
Advertisement6.2% 5.3%
Marketingagent
Local expositionand exhibition
2.2% 1.5%
sponsorship
Press releasewire
1.1% 0.9%Overseas
exposition andexhibition
Not applicable
Flyers,catalogues etc.
7.9%
Promotion & Marketing
NEWSLOREM IPSUM DOLOR SIT AMET
No.
11:12:2014
LOREM IPSUM DOLOR SIT AMET LOREM IPSUM DOLOR SIT AMET LOREM IPSUM DOLOR SIT AMET
LOREM IPSUM DOLOR SIT AMET LOREM IPSUM DOLOR SIT AMET
LOREMT
LOREM IPSUM DOLOR SIT AMET LOREM IPSUM DOLOR SIT AMET
LOREM IPSUM DOLOR SIT AMET LOREM IPSUM DOLOR SIT AMET
LOREM IPSUM DOLOR SIT AMET LOREM IPSUM DOLOR SIT AMET
LOREM IPSUM DOLOR SIT AMET LOREM IPSUM DOLOR SIT AMET
LOREM IPSUM DOLOR SIT AMETLOREM IPSUM DOLOR SIT AMET
LOREM IPSUM DOLOR SIT AMET LOREM IPSUM DOLOR SIT AMET
LOREM IPSUM DOLOR SIT AMET LOREM IPSUM DOLOR SIT AMET
LOREM IPSUM DOLOR SIT AMET LOREM IPSUM DOLOR SIT AMET
LOREM IPSUM DOLOR SIT AMET LOREM IPSUM DOLOR SIT AMET
LOREM IPSUM DOLOR SIT AMET LOREM IPSUM DOLOR SIT AMET
LOREM IPSUM DOLOR SIT AMET LOREM IPSUM DOLOR SIT AMET
LOREM IPSUM DOLOR SIT AMET LOREM IPSUM DOLOR SIT AMET
LOREM IPSUM DOLOR SIT AMET LOREM IPSUM DOLOR SIT AMET
LOREM IPSUM DOLOR SIT AMET LOREM IPSUM DOLOR SIT AMET
LOREM IPSUM DOLOR SIT AMET LOREM IPSUM DOLOR SIT AMET
LOREM IPSUM DOLOR SIT AMET LOREM IPSUM DOLOR SIT AMET
LOREM IPSUM DOLOR SIT AMET
LOREM IPSUM DOLOR SIT AMET LOREM IPSUM DOLOR SIT AMET
LOREM IPSUM DOLOR SIT AMET LOREM IPSUM DOLOR SIT AMET
LOREM IPSUM DOLOR SIT AMET LOREM IPSUM DOLOR SIT AMET
LOREM IPSUM DOLOR SIT AMET LOREM IPSUM DOLOR SIT AMET
LOREM IPSUM DOLOR SIT AMETLOREM IPSUM DOLOR SIT AMET
LOREM IPSUM DOLOR SIT AMET LOREM IPSUM DOLOR SIT AMET
LOREM IPSUM DOLOR SIT AMET LOREM IPSUM DOLOR SIT AMET
LOREM IPSUM DOLOR SIT AMET LOREM IPSUM DOLOR SIT AMET
LOREM IPSUM DOLOR SIT AMET LOREM IPSUM DOLOR SIT
AMETLOREM IPSUM DOLOR SIT AMET LOREM IPSUM DOLOR SIT
AMET LOREM IPSUM DOLOR SIT AMET LOREM IPSUM DOLOR SIT
AMET
LOREM IPSUM DOLOR SIT AMET
LOREM IPSUM DOLOR SIT AMET LOREM IPSUM DOLOR SIT AMET
LOREM IPSUM DOLOR SIT AMET LOREM IPSUM DOLOR SIT AMET
LOREM IPSUM DOLOR SIT AMET LOREM IPSUM DOLOR SIT AMET
LOREM IPSUM DOLOR SIT AMET LOREM IPSUM DOLOR SIT AMET
LOREM IPSUM DOLOR SIT AMET
booth
Note: 1) Data excludes wholesale & retail trade sub-sector2) Establishments can choose more than one answer and the percentages can exceed 100%
Source: Economic Census 2016, Department of Statistics, Malaysia
*The SME Annual Report 2016/17 was published on 29 September 2017, but the data used in this section has been updated on 12 October 2017 based on latest release of the Economic Census 2016: Profile of SMEs by the Department of Statistics, Malaysia