An experimental investigation on cavitation, noise, and slipstream characteristics of ocean stream turbines D Wang, M Atlar , and R Sampson School of Marine Science and Technology, University of Newcastle upon Tyne, Newcastle upon Tyne, UK The manuscript was received on 23 March 2006 and was accepted after revision for publication on 18 August 2006. DOI: 10.1243/09576509JPE310 Abstract: The paper presents an experimental investigation on the cavitation, noise, and slipstream characteristics of an ocean tidal stream turbine together with a discussion on the test facilities and methodology used. The experiments were conducted in a cavitation tunnel used to test marine propellers, with the same similarity laws as are used for a marine propeller. The cavitation patterns were observed at conditions corresponding to pre-stall, stall, and post- stall stream speeds as well as for two different depths of submergence of the turbine shaft to simulate the static presence of waves. The noise levels of the turbine were measured at the same conditions as the cavitation tests. The experimental results show that the turbine can experience strong unstable sheet and cloud cavitations as well as strong tip vortex cavitation at a shallow depth of shaft submergence which can be imposed by a wave trough taking place over the turbine. It is also shown that the measured noise level of the turbine is further increased due to the presence of cavitation. Finally, the slipstream wash was measured in terms of field velocities in the wake and surrounding of the turbine, and results show the slipstream wash may have an impact on the seabed if a turbine is positioned too close to it. Keywords: renewable energy, ocean stream/marine turbine, cavitation, noise, slipstream wash, environmental impact 1 INTRODUCTION Owing to increasing demand in clean energy and rising fossil fuel prices, more and more investment and research are focused on the renewable energy resources. These include electricity extracted from wind resources by means of wind turbines, and more recently, from tidal and other current resources in oceans through water turbines. Offshore renew- able resources such as offshore wind, tidal stream/ current, and waves are the most abundant source of renewable energy on the earth. It is more realisti- cally estimated that extractable tidal stream energy are about 18 TWh/yr within UK continental shelf and channel island territorial sea [1]. Much effect had been made to extract tidal energy through var- ious demonstration projects, including fixed prototype installation [2, 3] and some novel floating types [4]. The energy extracted from these resources is clean energy because of no emissions of CO 2 in the pro- duction of energy; however, this does not mean that it is free from impact on the environment. Although the impact of the wind turbines on the environment has been widely investigated [5 – 9], to the authors’ knowledge, there is hardly any investi- gation reported in the open literature to explore potential sources for environmental impact associ- ated with tidal stream turbines. In harnessing energy from the ocean a tidal stream turbine operates on the similar principle as the wind turbine, except that tidal steam turbines are prone to cavitation phenomena and free surface effects and hence it will produce and radiate undesirable noise due to shedding vortices from its blades and support- ing tower. Unlike wind turbine, a tidal stream turbine will not have an undesirable, direct ‘visual’ impact nor ‘noise’ effect on human beings since the turbine Corresponding author: School of Marine Science and Technol- ogy, University of Newcastle Upon Tyne, Newcastle Upon Tyne, NE1 7RU, UK. email: [email protected]SPECIAL ISSUE PAPER 219 JPE310 # IMechE 2007 Proc. IMechE Vol. 221 Part A: J. Power and Energy
Transcript
An experimental investigation on cavitation, noise, andslipstream characteristics of ocean stream turbinesD Wang, M Atlar�, and R Sampson
School of Marine Science and Technology, University of Newcastle upon Tyne, Newcastle upon Tyne, UK
The manuscript was received on 23 March 2006 and was accepted after revision for publication on 18 August 2006.
DOI: 10.1243/09576509JPE310
Abstract: The paper presents an experimental investigation on the cavitation, noise, andslipstream characteristics of an ocean tidal stream turbine together with a discussion on thetest facilities and methodology used. The experiments were conducted in a cavitation tunnelused to test marine propellers, with the same similarity laws as are used for a marine propeller.The cavitation patterns were observed at conditions corresponding to pre-stall, stall, and post-stall stream speeds as well as for two different depths of submergence of the turbine shaft tosimulate the static presence of waves. The noise levels of the turbine were measured at thesame conditions as the cavitation tests. The experimental results show that the turbine canexperience strong unstable sheet and cloud cavitations as well as strong tip vortex cavitationat a shallow depth of shaft submergence which can be imposed by a wave trough takingplace over the turbine. It is also shown that the measured noise level of the turbine is furtherincreased due to the presence of cavitation. Finally, the slipstream wash was measured interms of field velocities in the wake and surrounding of the turbine, and results show theslipstream wash may have an impact on the seabed if a turbine is positioned too close to it.
Owing to increasing demand in clean energy andrising fossil fuel prices, more and more investmentand research are focused on the renewable energyresources. These include electricity extracted fromwind resources by means of wind turbines, andmore recently, from tidal and other current resourcesin oceans through water turbines. Offshore renew-able resources such as offshore wind, tidal stream/current, and waves are the most abundant sourceof renewable energy on the earth. It is more realisti-cally estimated that extractable tidal stream energyare about 18 TWh/yr within UK continental shelfand channel island territorial sea [1]. Much effecthad been made to extract tidal energy through var-ious demonstration projects, including fixed
prototype installation [2, 3] and some novel floatingtypes [4].
The energy extracted from these resources is cleanenergy because of no emissions of CO2 in the pro-duction of energy; however, this does not meanthat it is free from impact on the environment.Although the impact of the wind turbines on theenvironment has been widely investigated [5–9], tothe authors’ knowledge, there is hardly any investi-gation reported in the open literature to explorepotential sources for environmental impact associ-ated with tidal stream turbines.
In harnessing energy from the ocean a tidal streamturbine operates on the similar principle as the windturbine, except that tidal steam turbines are prone tocavitation phenomena and free surface effects andhence it will produce and radiate undesirable noisedue to shedding vortices from its blades and support-ing tower. Unlike wind turbine, a tidal stream turbinewill not have an undesirable, direct ‘visual’ impactnor ‘noise’ effect on human beings since the turbine
�Corresponding author: School of Marine Science and Technol-
ogy, University of Newcastle Upon Tyne, Newcastle Upon Tyne,
JPE310 # IMechE 2007 Proc. IMechE Vol. 221 Part A: J. Power and Energy
will be deeply submerged in the sea. However, it willhave a potential impact on the environment, in par-ticular sea life when one considers the concept of‘energy farms’, which include arrays of these unitsin a concentrated area, and increased noise radiationand scouring effect at sea bed.
An important difference between wind and tidalstream turbines is the potential cavitation phenom-ena that may occur on the blades of the tidal turbinewhich can increase the risk of environmental impactas well as causing erosion on the blades.
The cavitation phenomenonwas first observed andreported scientifically on marine propeller over ahundred years ago [10, 11]. Although the onset ofcavitation on a marine propeller blade is rather com-plex phenomenonmainly involving the effect of oper-ating condition, blade geometry, andwater quality, insimple terms one can assume that cavitation willdevelop at any point on the blade where the pressurelevel is reduced to the level of saturated vapourpressure of the ambient water. When such an equili-brium condition is reached, different types of cavita-tionmay develop (e.g. tip vortex, sheet, bubble, cloudetc.) depending on the above-mentioned effects. As astream turbine operates on the same principle as amarine propeller, it can be subjected to some ofthese types of cavitation phenomena.
Depending on the type of the cavitation developed,some undesirable effects can be allied with it, includ-ing erosion of the blade, due to imploding cavitiesnear to the blade surfaces and associated noise aswell as shaft vibration and performance degradationdepending on the extent, volume, and fluctuatingnature of the developed cavitation. The radiatednoise level of a stream turbine will be increased con-siderably due to the presence of cavitation which willcause further environmental concern on the sur-rounding sea life. The issue of designing a stream tur-bine incorporating with cavitation, in particular,based on the wind turbine blade technology, isbeing currently overlooked. There are recent studiesreported in the open literature, e.g. Batten et al. [12]andMolland et al. [13], where attempts weremade tominimize or avoid cavitation in the design of currentturbines based on cavitation free bucket analysis oftwo-dimensional sections, a method used inmarine propeller design. In these joint studies, var-ious two-dimensional NACA sections were usedand their cavitation characteristics were validatedwith cavitation tunnel tests based on these two-dimensional, stationary foils. No experimental inves-tigation was reported on the cavitation performanceof the whole turbine model in the issue of environ-mental impact.
Another source of potential environmental impact,that can be associated with a tidal stream turbine, isthe perturbed velocity field and associated wash
effect induced by the vortices in the slipstream ofthe turbine. Although the slipstream wash of amarine propeller has been investigated by manyresearchers, including the present authors [14–16],no similar investigations have been reported onstream turbines in the open literature to the authors’knowledge.
The present paper, therefore, aims to contribute tothe above-mentioned knowledge gaps through anexperimental investigation on the cavitation, noise,and slipstream wash characteristics of a tidalstream turbine by adopting the testing and extrapol-ation procedures used for marine propellers. Thedetails of the testing facility is described next andthis followed by the description of the cavitationobservations, noise, and slipstream wash measure-ments with a 400 mm tidal stream turbine model,including the discussion of the results and con-clusions from the investigation.
2 TESTING FACILITY AND METHODOLOGY
2.1 Test facilities and model
The experiments were conducted in the emersoncavitation tunnel (ECT) at the Newcastle upon TyneUniversity. The tunnel is a medium size propellercavitation tunnel with a measuring section of1219 mm � 806 mm (width � height). The speed ofthe tunnel water varies between 0.5 and 8 m/s,whereas the tunnel pressure can be varied to give atunnel speed based cavitation number of 0.5–23.Full details of the ECT can be found in reference [17].
The full-scale turbine has a 20 m diameter withthree blades and was designed based on a stall regu-lation to operate in a design tidal stream speed of3.5 m/s and shaft speed of 12 r/min. The airfoiltype S814 section [18] was used in the design of theblade sections. A 1/50th scaled model of the turbine,which has a 400 mm diameter, was made from brassalloy material with built-in blades for the exper-iments, and the main particulars of the model arepresented in Table 1.
The turbine was driven by the propeller drivesystem of the ECT, and the torque and thrust of theturbine were measured by using the tunnel’s maindynamometer (K&R Type H33) in order to set andcontrol the operating condition of the turbine accu-rately. Using the same setup, the sound pressurelevels of the turbine were measured by usingBruel & Kjaer Type 8103 miniature hydrophone andassociated data acquisition system, whereas theflowfield around the turbine was measured bymeans of a two-dimensional Dantec laser doppleranemometry (LDA) system. Further details of thesesystems and the tests are given in the following.
220 D Wang, M Atlar, and R Sampson
Proc. IMechE Vol. 221 Part A: J. Power and Energy JPE310 # IMechE 2007
2.2 Test methodology
It is well known that in order to properly simulate thereal operating condition in the experimentalenvironment, certain similarity laws have to beobserved. Although a marine propeller and a tidalstream turbine have different missions, they operatebased on the same hydrodynamic principles inexperiencing the hydrodynamic loadings developedon their blades, including the effects of cavitationand free surface. Thus, the well-established similaritylaws for the propeller flow are adopted for a streamturbine in the present experimental investigations,which include two basic similarity laws, i.e. geometrysimilarity and flow or hydrodynamic similarity.
2.2.1 Geometry similarity
Geometry similarity will require the tested modelshould have similar geometry as that in the fullscale.This similarity can be easily achieved by scalingdown the full-scale geometry using a fraction, orso-called scale factor. The scale factor should bechosen as larger as possible according to test facili-ties in order to reduce Reynolds number relatedscale effect on test results, and it was chosen as1/50 based on test facilities of ECT.
2.2.2 Flow or hydrodynamic similarity
The hydrodynamic similarity of a marine pro-peller is presented by following non-dimensionalcoefficients.
The conduct of the cavitation tests in a cavitationtunnel with no free surface would only require theconstant ‘advance ratio’ and ‘cavitation number’for the model and full-scale propeller while the com-pliance with the constant ‘Reynolds’ and ‘Froude’numbers will be violated due to physical limitationsof a testing facility and absence of the free surface,respectively. In the case of a turbine, the advanceratio of a propeller can be replaced with a morerepresentative ‘tip speed ratio’ (TSR) of the turbineflow, whereas the cavitation number at a interestpoint on the blade of a turbine (e.g. 0.7 R) can bedefined, basically, similar to the propeller cavitationnumber. Thus the TSR, l, can be described as
l ¼pDn
Vc(6)
Like in most of other hydrodynamic tests, Rey-nolds number, Re, which is defined in equation (3),cannot be fully simulated, and it should be set ashigh as possible in order to reduce the associatedscale effect. From the experience with marine pro-peller model tests, when Re is higher than 106, theassociated scale effect can be assumed negligible.By considering the physical limitations of the ECTfacility, Re was set at about 0.2–0.3 � 106 in thepresent tests.
As stated earlier, the water quality is an importantfactor in cavitation phenomenon, whose effect canbe represented, in the simplistic terms, by the dis-solved gas or oxygen content of the tunnel solution,although its distribution is equally important. Thelevel of this content should be maintained at arequired level in order to minimize the resultingscale effects. In the present tests, the dissolvedoxygen content was measured and controlled bymeans of YSI model 95 handheld dissolved oxygenand temperature system.
Table 1 Main particulars of the tidal stream turbine models
Investigation on cavitation, noise, and slipstream of ocean turbines 221
JPE310 # IMechE 2007 Proc. IMechE Vol. 221 Part A: J. Power and Energy
3 CAVITATION OBSERVATIONS
3.1 Operating conditions
Cavitation observations were carried out in threedifferent conditions corresponding to pre-stall, stall(designed), and post-stall stream speeds, to cover arange of stream speeds that might induce cavitation.
The upper and lower limits of this rangewere speci-fied in such a way that two thirds of the maximumpower, which is represented by 67 per cent ofCpmax, as shown in Fig. 1, is extractable and fromwhich the two-limit tip speed ratios and, hence, thecorresponding pre- and post-stream speeds arespecified.
Tests were conducted corresponding to two differ-ent depths of turbine shaft submergence, thedesigned (20 m) and shallow (11 m) shaft immersion.The latter condition was used to simulate the effectof waves on cavitation in terms of the static waterhead representing the trough of a wave whiledynamic effect of waves was ignored due to limit oftest facilities. Of course this is too simplistic way ofsimulating the wave effect since the dynamic actionof the wave particles and other realities would beignored. However, full simulation of the entire waveeffects would require more sophisticated testingfacilities (e.g. vacuum tank with wave maker) andassociated setup which was beyond the scope of
this investigation. Table 2 presents a summary ofoperating conditions and other details of the turbineand flow in the full-scale and model-scale.
In Table 2, the static head (Hs) denotes the shaftimmersion in full scale, whereas in model scale thevalue of Hs is met by the amount of vacuum applied tothe tunnel to keep the cavitation number as same asthat in full-scale. The model scale Hs value wasmeasured and controlled by a ‘U’ type mercury man-ometer in ECT; the dissolved oxygen content level(a/as) was kept constant throughout the tests at 42 percent.
3.2 Cavitation observations at designed shaftimmersion (20 m)
Figures 2 to 4 show the observed cavitation patternscorresponding to the designed, pre-, and post-stallstream speeds at the designed shaft immersion andconstant rate of rotation of the turbine shaft, respect-ively. As shown in Fig. 2, only mild tip vortices wereobserved at the designed stream speed which willalso result in an increase in the noise level as it willbe discussed later on.
Cavitation pattern at the pre-stall stream speedmanifested itself in a much finer and intermittenttype of tip vortex as shown in Fig. 3.
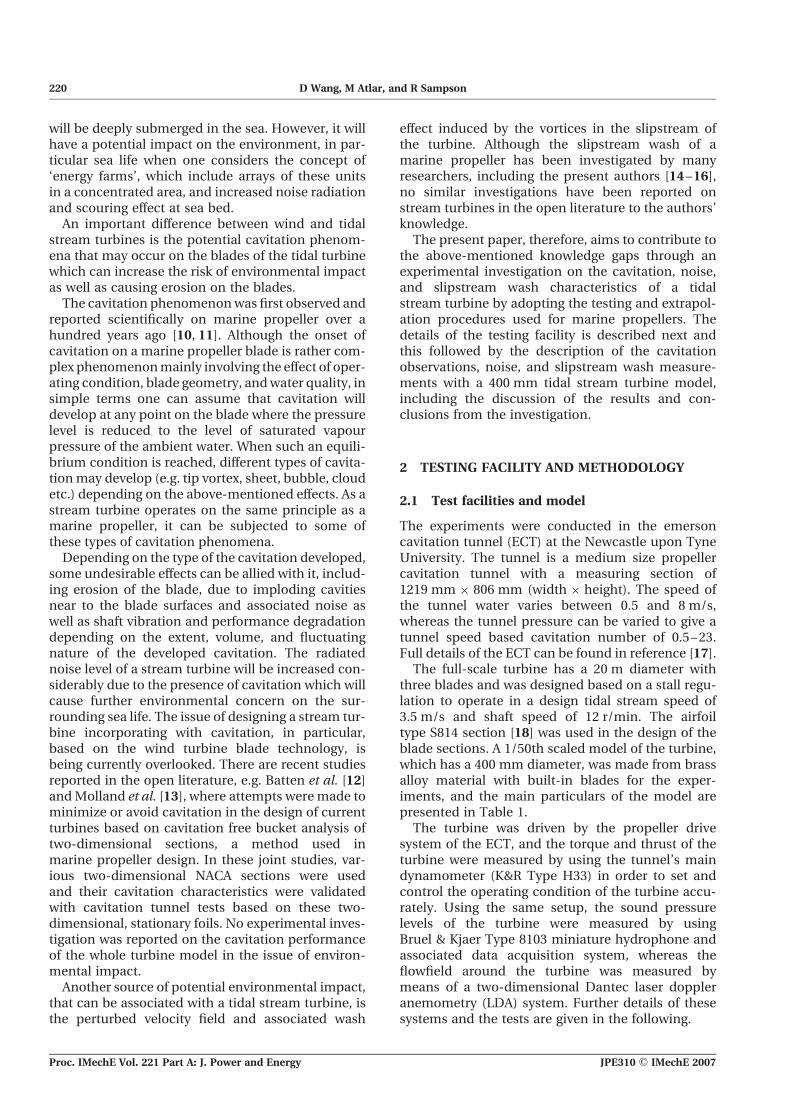
As shown in Fig. 4, different to the cavitation pat-terns observed in the previous two conditions, thecavitation type observed at the post-stall streamspeed was only a very light sheet cavitation devel-oped at the leading edge of the suction side of theblades extending from 0.55 to 0.7 R and there wasno tip vortex observed.
3.3 Cavitation observed at shallow shaftimmersion (11 m)
As stated earlier in order to explore the effect of waves,particularly the effect of a wave trough, the turbinewas tested at much shallower shaft immersion (11 mas opposed to 20 m designed immersion in fullscale). Similar to those at the designed submergence,cavitation observations were made at the designed,pre-, and post-stall stream speeds under the sameFig. 1 Definition of pre- and post-stall stream speeds
Proc. IMechE Vol. 221 Part A: J. Power and Energy JPE310 # IMechE 2007
oxygen content, and observed cavitation patterns areshown in Figs 5, 6, and 7, respectively.
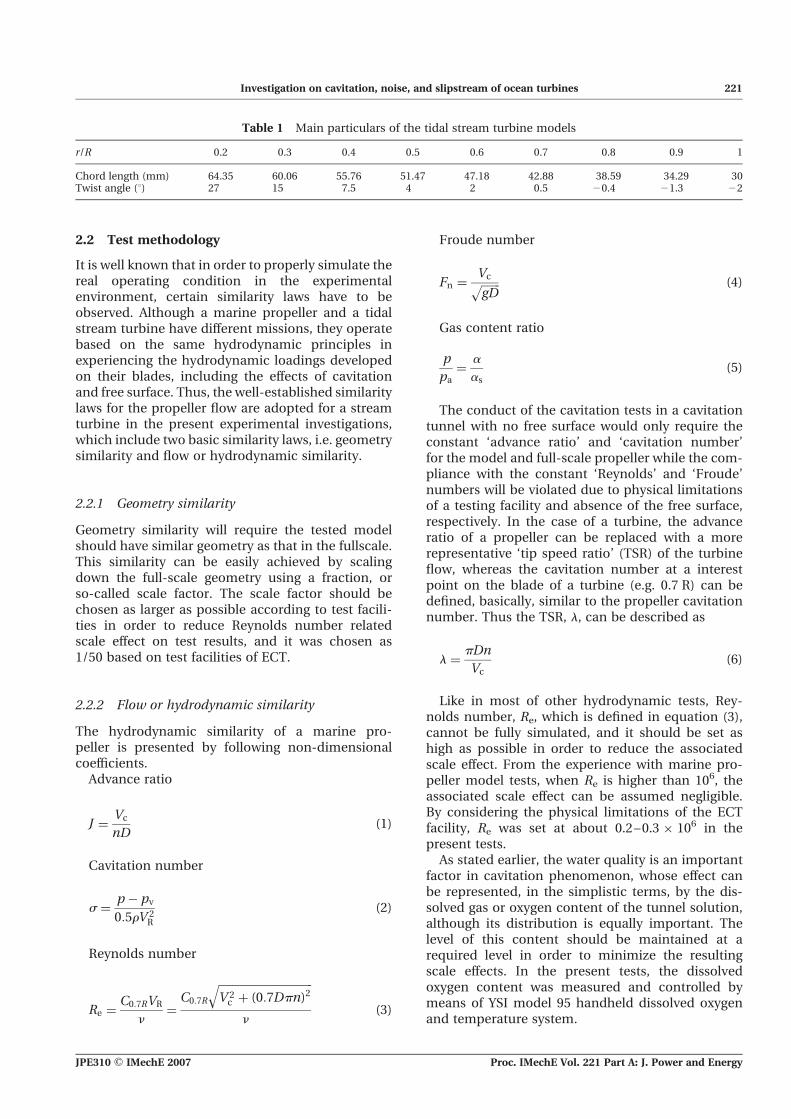
As shown in Fig. 5, the designed stream speed dis-plays considerably thick but stable sheet cavitationon the blades extending over the region from 0.6 to0.9 R and from the leading edge to the maximum of20 per cent chord length. However, the tail end ofthe sheet cavitation displays some instability andbursts to form an unstable and erosive cloud cavita-tion. In this condition, relatively thick and strong tip
vortices emanating from the blades were alsoobserved.
However, at the pre-stall stream speed, as shownin Fig. 6, only stable thin tip vortices were observed.
Finally, Fig. 7 shows the cavitation observed at thepost-stall stream speed. In this condition, moreextended and thicker sheet cavitation were observedin the region from 0.5 to 0.9 R and from leading edgeto the maximum of 30 per cent chord length. Similarto the designed condition, the tail end of the sheet
Fig. 2 Cavitation observed at designed shaft immersion and stream speed (Vc ¼ 3.5 m/s,
n ¼ 12 r/min, Hs ¼ 20 m, D ¼ 20 m, TSR ¼ 3.69, s ¼ 3.789)
n ¼ 12 r/min, Hs ¼ 20 m, D ¼ 20 m, TSR ¼ 3.69, s ¼ 3.933)
Investigation on cavitation, noise, and slipstream of ocean turbines 223
JPE310 # IMechE 2007 Proc. IMechE Vol. 221 Part A: J. Power and Energy
cavitation became unstable and burst to form erosivecloud cavitation in combination with much strongertip vortices shedding from the blades making thesituation worst.
4 NOISE MEASUREMENTS
The noise level measurements of the turbine wereconducted simultaneously with the cavitation
observations and, hence, at the same test conditionspresented in Table 2.
4.1 Test set-up and procedures
The common procedure of noise measurements inthe emerson cavitation tunnel is to use Bruel &Kjaer Type 8103 Miniature Hydrophone. This devicewas situated in a water-filled, thick-walled, steelcylinder placed on Plexiglas window outside the
Fig. 4 Cavitation observed at designed shaft immersion and post-stall stream speed
(Vc ¼ 4.67 m/s, n ¼ 12 r/min, Hs ¼ 20 m, D ¼ 20 m, TSR ¼ 3.69, s ¼ 3.499)
Fig. 5 Cavitation observed at shallow shaft immersion and designed stream speed (Vc ¼ 3.5 m/s,
n ¼ 12 r/min, Hs ¼ 11 m, D ¼ 20 m, TSR ¼ 3.69, s ¼ 2.232)
224 D Wang, M Atlar, and R Sampson
Proc. IMechE Vol. 221 Part A: J. Power and Energy JPE310 # IMechE 2007
top lid of the tunnel and at a vertical distance of440 mm from the shaft centre-line and 50 mm for-ward of the rotation plane of the turbine. Bruel &Kjaer PULSETM Noise and Vibration Analysis – Type7700 software was used to acquire and analyse thesound pressure data.
The total noise levels of the turbine at one-thirdOctave band were first recorded at centre frequen-cies ranging from 20 Hz to 25 kHz, which included
both the net turbine noise and the noise generatedby the proximity (background noise). Consequently,in order to calculate the noise generated exclusivelyby the turbine, i.e. the net turbine noise, the back-ground noise had to be measured separately and tobe subtracted logarithmically from the totalmeasured noise. In the measurements of the back-ground noise, an idle mass, which had the samemass as model turbine, replaced the model turbine
Fig. 6 Cavitation observed at shallow shaft immersion and pre-stall stream speed (Vc ¼ 2.57 m/s,
n ¼ 12 r/min, Hs ¼ 11 m, D ¼ 20 m, TSR ¼ 4.89, s ¼ 2.349)
n ¼ 12 r/min, Hs ¼ 11 m, D ¼ 20 m, TSR ¼ 4.89, s ¼ 2.349)
Investigation on cavitation, noise, and slipstream of ocean turbines 225
JPE310 # IMechE 2007 Proc. IMechE Vol. 221 Part A: J. Power and Energy
and the tunnel was kept working at the same operat-ing condition and having the same water quality asfor the total noise measurements carried outpreviously.
4.2 Results analysis
A common practice in the analysis and presentationof the noise levels for a ship propeller are to reducethe measured values of sound pressure levels (SPL)in each one-third Octave band to an equivalent1 Hz bandwidth by means of the correction formularecommended by the cavitation committee of the15th International Towing Tank Conference (ITTC)as follows [19]
SPL1 ¼ SPLm � 10 logDf (7)
The ITTC also required that the sound pressurelevels be corrected to a standard measuring distanceof 1 m using the following relationship
SPL ¼ SPL1 þ 20 log (r) (8)
Having converted the measured SPLm for the totaland the background noise sources to the equivalent1 Hz at 1 m SPL1 using equations (7) and (8), the levelof net sound pressure (SPLN) of the model propeller ateach centre frequency was calculated using the follow-ing logarithmic subtraction formula given by Ross [20],
SPLN ¼ 10 log 10(SPLT=10) � 10(SPLB=10)� �
(9)
The noise level of the model propeller was extrapo-lated to the full-scale noise level using scaling laws rec-ommended by the Cavitation Committee of 18th ITTC[21]
DL(p) ¼ 20 logDP
DM
� �zrMrP
� �xsP
sM
� �y=2"
nPDP
nMDM
� �yrPrM
� �y=2#
(10)
fP ¼ fMnP
nM(11)
where subscripts P and M refer to ship and model,respectively; z and y are taking as 1 and 2, respectively.
In the presence of no specific code of practicefor water turbines, the above-described analysismethod for ship propellers was adopted to predictthe net sound pressure levels of the full-scale turbinefor all the test conditions and results are shown inFigs 8 and 9. In the absence of a specific criterionto control noise radiated from such devices, theminimum noise specification recommended by the
International Council for the Exploration of the Sea(ICES) for fisheries research vessel was also pre-sented in these figures for reference only [22]. Thisspecification is to meet the need for noise reductionin research vessels undertaking fishery resource sur-veys and makes practical recommendation for limit-ing underwater radiated noise, to assist thosedrawing up specifications for new vessels. On thisbasis, it does not provide any regulatory value apartfrom an interesting comparison.
Figure 8 presents a comparison of the net noiselevels of the turbine at the pre-stall and designedstream speeds for the design shaft immersion(20 m). The condition for the post-stall speed wasexcluded since the background noise level in thiscasewashigher than the total noise levelwhichunfor-tunately does not reflect any meaningful result. Asshown in Fig. 8, within the measured region, the pre-dicted net noise level at the designed speed is about10–15 per cent higher than the pre-stall streamspeed condition reflecting the contribution from
Fig. 8 Net noise levels at designed shaft depth in the
full scale
Fig. 9 Net noise levels at shallow shaft depth in the full
scale
226 D Wang, M Atlar, and R Sampson
Proc. IMechE Vol. 221 Part A: J. Power and Energy JPE310 # IMechE 2007
relatively more prominent tip vortices for the formercondition. It is also interesting that both conditionsdisplay lower noise levels in comparison to the ICESminimum noise specification criteria.
Figure 9 presents a comparison of the net noiselevel of the turbine at the pre-stall, designed, andpost-stall stream speeds at the shallow shaft immer-sion (11 m). Except the pre-stall condition at lowerfrequency range (i.e. ,10 Hz), majority of the pre-dicted net noise for all conditions appears to befree from the background noise contamination. Thenet SPL can be as high as 150 dB at the post-stall con-dition and there is a hierarchy in the increasing noiselevels regarding to the increasing magnitude of thestream speed and hence severity of the cavitationpatterns observed earlier. It is also interesting tonote that the SPL for the design and post-stallspeeds can be higher than the ICES specificationlevel over some part of the low-frequency range.
In spite of the uncertainty associated with thebackground noise over a certain frequency range,the comparison of the net SPLs in Figs 8 and 9 indi-cates that the noise levels increase with the increaseof intensities of the tip and unstable cloud cavita-tions, particularly in the medium range of centrefrequencies (5–30 Hz) investigated.
5 SLIPSTREAM WASH MEASUREMENT
On the basis of the assumption that the potentialimpact of the tidal stream turbine on environment(e.g. scouring of the sea bed, increased noise) willmanifest itself through the perturbed velocities in theturbine’s slipstream, the velocity field in this wakeregion was measured by means of a LDA in the ECT.
5.1 Test setup and procedures
The LDA used was a two-dimensional Dantec LDAwhose optic was controlled by a computer driven
three-dimensional traversing mechanism. A polarcoordinate system was used for setting the measure-ment mesh which was selected in the bottom leftquadrant along the turbine shaft, due to limitationon the access to the full-slipstream. On each meshquadrant, nine angles (10 points), at 108 intervals,were set in the circumferential direction. In theradial direction, 18–24 radii were specified with themaximum radius being 280 mm. A Cartesian coordi-nate systemwas selected with its origin located at theshaft axis and 30 mm in front of the turbine discplane. The measured slipstream length was approxi-mately one full diameter (410 mm). This was selectedsuch that a distance equivalent to 1 R of the turbine(200 mm) was behind the disc and 1.05 R (210 mm)was in front of the disc along the x-direction; eightquadrant meshes were used to cover this measure-ment length, as shown in Fig. 10.
The velocity field behind a propeller or turbine isunsteady and it is difficult to measure this flowfieldusing the LDA technology since it is time dependentand data acquisition will require an enormousamount of data samples and associated time. Fortu-nately, although the turbine wake is unsteady, it isperiodic and can be measured using encoder tech-nology. The periodic nature of the flow motion canimply to acquire as many samples as required at aspace point, provided that the samples are acquiredusing an encoder to trigger the acquisition. The func-tion of the encoder is to trigger all the measurementsstarting at the same time in a cycle and this will guar-antee each sample is acquired at the same time in aperiod. The encoder is triggered by a transistor-tran-sistor-logic pulse, equating to one pulse per turbinerevolution.
5.2 Results analysis
The velocity field measurements were carried out atthe turbine designed operating condition which
Fig. 10 Arrangement of measuring meshes
Investigation on cavitation, noise, and slipstream of ocean turbines 227
JPE310 # IMechE 2007 Proc. IMechE Vol. 221 Part A: J. Power and Energy
corresponds to a 2 m/s of stream speed and 342.9 r/min of shaft rotation rate. At each measuring point,about 3000–4000 velocity samples were collectedfor each of the two velocity components (Vx, Vz)within one turbine revolution. From these samples,72 velocity data per velocity component are averagedat 58 intervals within one revolution as shown inFig. 11 where Vx_t and Vz_t are the measured velocitysamples in time domain and Vx_tm and Vz_tm are themean velocities averaged at each 58 interval.
At each measured point, 72 velocity data for eachvelocity component were further averaged in timedomain based on the following integration toobtain the mean velocity at one measuring point
Vx pm ¼1
2p
ð2p0
Vx tm du (12)
Vz pm ¼1
2p
ð2p0
Vz tm du (13)
At each radius of the measured quadrant, Vx_pm
and Vz_pm were averaged to obtain the mean velocityat a radius as follows
Vx rm ¼2
p
ðp=20
Vx pm du (14)
Vz rm ¼2
p
ðp=20
Vz pm du (15)
On each measured quadrant, Vx_rm and Vz_rm wereaveraged to obtain the mean velocity on each quad-rant as follows
Vx m ¼1
R� rh
ðRrh
Vx rm dr (16)
Vz m ¼1
R� rh
ðRrh
Vz rm dr (17)
The mean axial velocities thus calculated at eachradius on each quadrant are shown in Fig. 12.
Useful insight to the distributions of the mean longi-tudinal velocity component (Vx) along the shaft axisboth before and after the turbine disc and along theradii can be gained. The striking feature of this flow-field is the increasing magnitudes of the velocitycomponent Vx at the outer radii towards/beyondthe tip in the downstream. The magnitude of the per-turbed velocity component Vx can be 17 per centhigher than the free stream speed at a fractionalradius of r/R ¼ 1.4 from the shaft axis in themeasurement plane, x ¼ 2230 mm (i.e. at a down-stream distance of 1.0 R). Thus, the total velocity(resultant velocity of Vx, Vy and Vz) will be surelyhigher than 17 per cent and the expected slipstreamwash might have impact on the seabed (e.g. adversescouring effect), if the turbine is to be installed closeto the seabed.
The variation of the mean vertical component (Vz)of the velocity field along the shaft and radii, asshown in Fig. 13, displays rather complex distri-bution without any clear trend, although the magni-tudes of the velocities increase towards and after theturbine in the near vicinity.
Although the magnitudes of Vz in overall are muchsmaller than the magnitudes of the axial component
Fig. 11 Measured total velocities in time domainFig. 12 Measured mean axial velocity Vx_rm (averaged
at a radius)
Fig. 13 Measured mean vertical velocity Vz_rm
(averaged at a radius)
228 D Wang, M Atlar, and R Sampson
Proc. IMechE Vol. 221 Part A: J. Power and Energy JPE310 # IMechE 2007
(Vx), being about one third of the latter at the maxi-mum, they will contribute and hence increase themagnitude of the total velocities.
Variations of the mean velocity on each measuredquadrant are shown in Fig. 14, which presents meanvelocity variations in the process of flow passingthrough the turbine. From Fig. 14, it seems thatthere will be no concern of the environmentalimpact from the turbine slipstream wash within itswake as dominant component Vx of wash velocityis much less than stream speed. It also revealssome interesting velocity variations, although notrelevant within the wash context: firstly, the valueof the mean stream velocity is reduced as the flowapproaches to the rotor disc due to blocking effectof the turbine; and secondly, it is noticed that thatthe rotor induces a swirling action to the flow, andit seems that the maximum value of the swirl isreached at the disc and then this action decays inthe wake due to viscous effect.
6 CONCLUSIONS
From the present investigation, the following con-clusions can be reached.
1. Cavitation tunnels and testing procedures usedfor marine propellers can be used and adoptedfor testing marine turbines to investigate theirperformance in the likely presence of cavitation.
2. Cavitation can be an important design andenvironmental concern for a tidal stream oceanturbine if the turbine blades are not properlydesigned and the turbine is not properly installed.
3. Extreme waves can have significant influence oncavitation performance as a result of the staticallyreduced immersion of the turbine shaft and thedynamically increased flow velocity at the turbineblade due to effect of the free surface, though thelater was not tested in present paper. The immer-sion of 1.5–2.0 diameter of turbine should be
required to avoid such effect without deterioratingperformance of power extraction.
4. Cavitation also increases the level of noiseradiated from the turbine and hence can be afurther source of concern for the marine environ-ment, in particular in a ‘farm’ configuration.
5. Slipstream wash velocity of a tidal stream turbinecan be significantly higher than the free streamvelocity which may have an adverse effect on theseabed as well as contributing to the radiatednoise levels. The turbine shaft should be keptclear from the seabed at least for one turbinediameter distance to avoid such impact.
6. In occurrence of severe cavitation, a stream tur-bine may have significant impact on environmentin terms of noise. If a stream turbine is too closeseabed (shaft height from seabed is less thanone diameter of the turbine), the turbine mayhave impact on environment by causing sedimentmovement on seabed or disturbing marine lifenear seabed.
ACKNOWLEDGEMENT
The present investigation was based on the part ofthe results of a joint research project entitled ‘Aninvestigation of tidal stream rotor performance’,EPSRC Grant Ref no: GR/R50851/01, and was con-ducted during 2002–2005. This project was spon-sored by the EPSRC’s ‘Renewable & New EnergyTechnologies’ Programme- RNET4/308 and hencethe financial support received by the EPSRC is grate-fully acknowledged.
REFERENCES
1 Black & Veatch Consulting Ltd. Phase II UK tidalstream energy resource assessment. Phase II tidalstream resource report–rev2.doc, Issue 3, July 2005,available from www.thecarbontrust.co.uk/ctmarine3/res/PhaseIITidalStreamResourceReport.pdf.
2 Fraenkel, P. L. Power frommarine turbines. Proc. InstnMech. Engrs, Part A: J. Power and Energy, 2002, 216(A1),1–14.
3 Fraenkel, P. L. Marine Current TurbinesTM Ltd’s tidalturbines developments: the development of anentirely new energy conversion system. Part D Confer-ence Proceeding of World Maritime TechnologyConference (WMTC), 4th International MarineRenewable Energy, MAREC, London, 6–10 March2006, pp. 79–88, IMarEST.
4 Manchester, R. The TidEl floating free-stream tidal tur-bine system. Part D Conference Proceeding of WorldMaritime Technology Conference (WMTC), 4th Inter-national Marine Renewable Energy, MAREC, London,6–10 March 2006, pp. 89–95, IMarEST.
Fig. 14 Measured mean axial and vertical velocities
(averaged at a quadrant)
Investigation on cavitation, noise, and slipstream of ocean turbines 229
JPE310 # IMechE 2007 Proc. IMechE Vol. 221 Part A: J. Power and Energy
5 Kelly, N. D., McKenna, H. E. R., Hemphill, R., Etter,C. L., Garrelts, R. C., and Linn, N. C. Acoustic noiseassociated with the MOD-I wind turbine: its source,impact and control. SERI TR-635-1166, NationalRenewable Energy Laboratory, Golden, Colorado, 1985.
6 Glegg, S. A. L., Baxter, S. M., and Glendinning, A. G.The prediction of broadband noise for wind turbine.J. Sound Vib., 1987, 118(2), 217–239.
7 Greene, G. C. and Hubbard, H. H. Some effect of non-uniform inflow on the radiated noise of a large windturbine. TM-8183, NASA Langley Research Center,Hampton, Virginia, 1980.
8 Kelly, N. D., Hemphill, R. R., and Sengupta, D. L. Tele-vision interface and acoustic emission associated withthe operation of the Darrieus VAWT. Proceedings of5th Biennial Wind Energy Conference and Workshop,Washington, DC, 1981, vol. 1, pp. 397–413.
9 Stephens, D. G., Shepherd, K. P., Hubbard, H. H., andGrosveld, F. W. Guide to evaluation of human exposureto noise from large wind turbine. M-83288, NASA Lang-ley Research Center, Hampton, Virginia, 1982.
10 Barnaby, S. W. On the formation of cavities in water byscrew propeller at high speed. Transactions of the Insti-tution of Naval Architects, 1897, 38, 139–144.
11 Parsons, C. The application of the compoundsteam turbine to the purpose of marine propulsion.Transactions of the Institution of Naval Architects,1897, 38, 232–242.
12 Batten, W. M. J., Bahaj, A. S., Molland, A. F., andChaplin, J. R. Hydrodynamics of marine currentturbines. Renew. Energy, 2006, 31(2), 249–256.
13 Molland, A. F., Bahaj, A. S., Chaplin, J. R., and Batten,W. M. J. Measurements and predictions of forces,pressures and cavitation on 2-D sections suitable formarine current turbines. Proc. Instn Mech. Engrs, PartM: J. Engineering for the Maritime Environment, 2004,218, 127–138.
14 Wang, D., Atlar, M., and Mesbahi, E. Experimentalinvestigation of propeller wash using laser doppler ane-mometry. HIPER’02, 3rd International Conference onHigh-performance marine vehicles, Bergen, Norway,14–17 September 2002.
15 Wang, D., Atlar, M., Paterson, I., Danisman, D. B., andMesbahi, E. Slipstream (wash) measurements withmodel propeller of a catamaran in isolation using anLDA system. FLOWMART, Report no MT-2001-008,Newcastle University, 2001.
16 Wang, D., Atlar, M., Glover, E. J., and Paterson, I. Exper-imental investigation of flow field around a poddedpropulsor using LDA. T-POD, First International Confer-ence on Technological advances in podded propulsion,Newcastle University, 14–16 April 2004, pp. 483–498.
17 Atlar, M. A. History of the emerson cavitation tunneland its role in propeller cavitation research. NCT’50,International Conference on Propeller cavitation,Newcastle-upon-Tyne, April 2000, pp. 3–34.
18 Somers, D. M. Design and experimental results for theS814 airfoil: Airfoil, Incorporated. Subcontractor report:NREL/SR-440-6019, State College, Pennsylvania, 1997.
19 ITTC. Cavitation committee report. 15th InternationalTowing Tank Conference, The Hague, the Netherlands,1978.
20 Ross, D. Mechanics of underwater noise, 1976 (Perga-mon Press, New York, USA).
22 Mitson, R. B.(Ed.) Underwater noise of research vessels,review and recommendations. Cooperative researchreport No 209, International Council For the Explora-tion of the Sea, May 1995.
APPENDIX
Notation
C0.7R chord length at 0.7 R (m)Cpmax maximum power coefficientD diameter of the propeller (m)f centre frequency (Hz)Fn Froude numberg acceleration of gravity (m/s2)Hs shaft immersion of the turbine (m)J advance ration rotation rate of turbine shaft (1/s)P pressure at a point of interest (N/m2)pa pressure at atmosphere (N/m2)Pv vapour pressure of water (N/m2)r vertical reference distance for which the
noise level is measuredrh hub radius (m)R radius of turbine (m)Re Reynolds numberSPL equivalent 1 Hz at 1 m distance sound
pressure level (in dB; re 1 mPa)SPLB background sound pressure level
measured at an equivalent 1 Hzbandwidth and 1 m (in dB; re 1 mPa)
SPL1 reduced sound pressure level to 1 Hzbandwidth (in dB; re 1 mPa)
SPLm measured sound pressure level at eachcentre frequency (in dB; re 1 mPa)
SPLN net sound pressure level calculated atequivalent 1 Hz bandwidth and 1 m (in dB;re 1 mPa).
SPLT total sound pressure level measured at anequivalent 1 Hz bandwidth and 1 m (in dB;re 1 mPa)
Vc tidal stream speed or propeller inflowvelocity (m/s)
VR resultant velocity of blade section (m/s)Vx_m mean axial velocity on a quadrant (m/s)Vz_m mean vertical velocity on a quadrant (m/s)Vx_pm mean axial velocity at a point (m/s)Vz_pm mean vertical velocity at a point (m/s)Vx_rm mean axial velocity on a radius (m/s)Vz_rm mean vertical velocity on a radius (m/s)Vx_t measured axial velocity in time domain
represented by angle (m/s)
230 D Wang, M Atlar, and R Sampson
Proc. IMechE Vol. 221 Part A: J. Power and Energy JPE310 # IMechE 2007
Vz_t measured vertical velocity in time domainrepresented by angle (m/s)
Vx_tm mean axial velocity at 58 interval in timedomain (m/s)
Vz_tm mean vertical velocity 58 interval in timedomain (m/s)
a gas content at the pressure at a point ofinterest
as gas content at the atmospheric pressureDf bandwidth for each one-third Octave band
filter in Hz.DL(P) increased noise level when scaled from the
model to full scale(in dB; re 1 mPa)l tip speed ration kinematic viscosity of water (m2/s)r mass density of water (kg/m3)s cavitation number
Investigation on cavitation, noise, and slipstream of ocean turbines 231
JPE310 # IMechE 2007 Proc. IMechE Vol. 221 Part A: J. Power and Energy