36
SPECIAL REPORT: Private Investing in the Power Sector in Emerging Markets OCTOBER 2015
SPECIAL REPORT:
Private Investing in the Power Sector in Emerging Markets
OC
TO
BE
R 2
01
5
2 • SPECIAL REPORT: PRIVATE INVESTING IN THE POWER SECTOR IN EMERGING MARKETS
About EMPEA
EMPEA is the global industry association for private capital in emerging markets. We are an independent non-profit organization with over 300 member firms, comprising institutional investors, fund managers and industry advisors, who together manage more than US$1 trillion of assets and have offices in more than 100 countries across the globe. Our members share EMPEA’s belief that private capital is a highly suited investment strategy in emerging markets, delivering attractive long-term investment returns and promoting the sustainable growth of companies and economies. We support our members through global authoritative intelligence, conferences, networking, education and advocacy.
Project Team
Jeff Schlapinski (lead), Manager, Research Maryam Haque, Senior Director, Research Molly Brister, Senior Research Analyst Brady Jewett, Research Analyst Luke Moderhack, Research Analyst Rae Winborn, Research Analyst Abigail Beach, Associate, Strategic Engagement
Executive Editor
Robert W. van Zwieten, President & Chief Executive Officer
Guest Legal Contributors
Kirsti Massie, Partner and Global Head of Power, White & Case LLP Ank Santens, Partner, White & Case LLP Someera Khokhar, Partner, White & Case LLP
Production Assistance
Ben Pierce, Pierce Designers
1077 30th Street NW • Suite 100 • Washington, DC 20007 USAPhone: +1.202.333.8171 • Fax: +1.202.333.3162 • Web: empea.org
To learn more about EMPEA or to request a membership application, please send an email to [email protected].
EMPEA’s Board of Directors
Robert Petty (Chairman) Managing Partner & Co-Founder, Clearwater Capital Partners
Teresa Barger (Vice Chair) Senior Managing Director, Cartica Management, LLC
Rebecca Xu (Vice Chair) Co-Founder & Managing Director, Asia Alternatives Management LLC
Thomas C. Barry President & Chief Executive Officer, Zephyr Management, L.P.
Fernando Borges Managing Director & Co-Head of South America Buyout Group, The Carlyle Group
Michael Calvey Founder & Senior Partner, Baring Vostok Capital Partners
Okechukwu Enelamah Chief Executive Officer, African Capital Alliance
Paul Fletcher Chairman, Actis
Mark Kenderdine-Davies General Counsel, CDC Group plc
Temitope (Tope) Lawani Co-Founder & Managing Partner, Helios Investment Partners
Roger Leeds Professor, Johns Hopkins University, SAIS
H. Jeffrey Leonard President & Chief Executive Officer, Global Environment Fund
Piero Minardi Managing Director, Warburg Pincus
Sanjay Nayar Member & Head, KKR India Advisors Pvt. Ltd.
Ziad Oueslati Founding Partner, AfricInvest
Nicolas Rohatyn Chief Executive Officer & Chief Investment Officer, The Rohatyn Group
Jean Eric Salata Chief Executive & Founding Partner, Baring Private Equity Asia
Maninder Saluja Partner & Co-Head, Emerging Markets Private Equity, Quilvest Group
George W. Siguler Managing Director & Founding Partner, Siguler Guff & Company
Tom Speechley Partner, The Abraaj Group & Chief Executive Officer, The Abraaj Group (North America)
Yichen Zhang Chairman & Chief Executive Officer, CITIC Capital
EMPEA • 1
CONTENTS
Executive Summary ...................................................................................................................................... 2
The Macro Picture: What Makes Power a Compelling Sector for Investment? ....................................................................................................... 4
The Current Landscape: Fundraising and Investment Trends and Sector Breakdown ............................................................................................. 6
The Opportunity in Power Generation ............................................................................................. 14
The Opportunity in Transmission and Distribution .................................................................... 22
Risk in the EM Power Sector: Weighing the Evidence .................................................................. 25
Legal Spotlight ............................................................................................................................................ 26
Outlook ........................................................................................................................................................... 29
Conclusion ...................................................................................................................................................... 31
Sampling of Private Fund Managers Active in the EM Power Sector.................................. 32
Report Methodology ................................................................................................................................. 33
SPECIAL REPORT: Private Investing in the Power Sector in Emerging Markets
EMPEA Members have exclusive access to the underlying exhibits and data in the report via the MS Excel icon at right.
2 • SPECIAL REPORT: PRIVATE INVESTING IN THE POWER SECTOR IN EMERGING MARKETS
The power sector in emerging markets (EM) is increasingly on the radar screens of international investors. Demand for electricity in developing economies is high and will only grow, requiring substantial additional investment in both the modernization of outdated power infrastructure and in building new capacity in order to meet the needs of consumers and businesses. As this report uncovers, electricity supply and demand dynamics in emerging markets—coupled with regulatory environments that have evolved towards increased private participation in the power sector—underpin an opportunity for private investment fund managers (GPs) and their limited partners (LPs) to not only earn compelling returns, but also drive further economic growth and welfare gains by increasing access to reliable and affordable power.
This report draws on insights from interviews with numerous GPs and LPs active in EM power investing and analysis of EMPEA’s fundraising, investment and exit data, as well as macroeconomic data from third-party sources, with a view to understanding: the fundamentals driving the investment opportunity in the power sector; major patterns and trends in private fund investment in EM power; the case for investing within specific market segments; factors that may minimize or magnify risk for investors; and key issues that may have a bearing on the future scale and scope of private investment in the sector.
EXECUTIVE SUMMARY
EMPEA • 3
Key findings include:• The power sector opportunity in emerging markets is driven by
the overriding need for new energy infrastructure. Nearly 1.3 billion people in developing economies still lack access to elec-tricity, and demand for power in non-OECD markets is expected to grow more than three times as fast as in the developed world through 2035, according to the International Energy Agency. Total anticipated investment in emerging markets power infra-structure over this timeframe is expected to reach US$10.2 tril-lion, accounting for approximately two-thirds of the global total.
• From 2008 through the first half of 2015, GPs raised an aggre-gate US$32.3 billion for power-dedicated funds and power-in-clusive clean technology and infrastructure funds. Managers specializing in power-related fund strategies have captured a higher share of all private funds’ power investment activity since 2013, as generalist funds that opportunistically invest in power deals have moved out of the sector.
• Private fund managers invested an aggregate US$13.6 billion in disclosed capital in the EM power sector from 2008 through the first half of 2015, with just under 86% of the total capital deployed in power generation, the transformation of primary energy within power plants into electricity, rather than other market segments. While to date fund managers have been less active on the transmission and distribution (T&D) side of the sector, which includes the transfer of electricity from generation sites along high-voltage lines and then local networks to end users, the need for new investment and private-sector expertise in these segments is no less crucial.
• Driven by supportive government policies, significant recent cost reductions and favorable geographic and climatic conditions, renewables have accounted for 51% of capital invested in power generation and 73% of deals by number since 2008. The levelized cost of solar power, in particular, has declined rapidly over the last decade, and the technology has strong potential for deployment
at the point of use via a distributed model. Strong renewables deal flow, coupled with untapped reserves of relatively-clean nat-ural gas in most regions, suggests the future energy portfolio of developing economies can be environmentally friendly.
• Greenfield, buy-and-build and expansion strategies, rather than investments in fully mature assets, have constituted the vast majority of investments in power generation since 2008. This may reflect the relative lack of mature or “brownfield” infra-structure investment opportunities in emerging markets com-pared to the developed world, as well as the potential for GPs to earn higher returns by developing new capacity.
• Institutional investors evaluating private fund managers target-ing the EM power sector see its merits, but express concerns related to project development and construction risk, currency risk and counter-party risk, as well as underlying market and regulatory conditions, asset scale and exit prospects. While legal and financial structuring solutions exist to mitigate some risks in the sector—and the investment model for EM power projects has become more standardized across markets—GPs must be transparent in conveying potential hazards to their investors.
• Future prospects for GPs investing in the EM power sector will likely be influenced by three overarching themes: continued reg-ulatory reforms and market liberalization, especially in the T&D market segments; broader energy market dynamics, including oil price volatility and further reductions in the cost of renew-able power technology; and the effects of global economic shocks and financial market dislocations on EM currencies, cross-border investment flows and governments’ fiscal health. Nevertheless, power demand and supply gaps across developing economies will persist and are unlikely to be alleviated for some time, providing fund managers with the opportunity to not only generate financial returns, but also make a developmental impact on consumers and businesses.
4 • SPECIAL REPORT: PRIVATE INVESTING IN THE POWER SECTOR IN EMERGING MARKETS
THE MACRO PICTURE: What Makes Power a Compelling Sector for Investment?The rise of emerging markets over the last two decades has had a transformative impact on the world economy. According to the International Monetary Fund, from 1995 to 2015, emerging markets’ aggregate GDP in purchasing power parity terms has increased from US$16 trillion to US$64 trillion, while their share of global economic output has risen from 41% to 57%.1 Sustained aggregate economic growth has brought hundreds of millions of people into the middle class and fueled increased demand for reliable and affordable electricity to produce basic consumer goods and industrial staples, as well as to light, heat and cool homes. Laird Reed, Senior Investment Manager at IFC Asset Management Company (AMC), illustrates the drivers behind the rise in power demand in emerging markets: “As countries grow from low-income to middle-income and the middle class starts
growing, the very first thing people do is start buying appliances, televisions, more lights and bigger houses; these are all driven by power.” With the public utilities that dominate the sector in many emerging economies unable to keep pace with current electric-ity consumption patterns, let alone future demand, the need for increased private investment in the sector is clear.
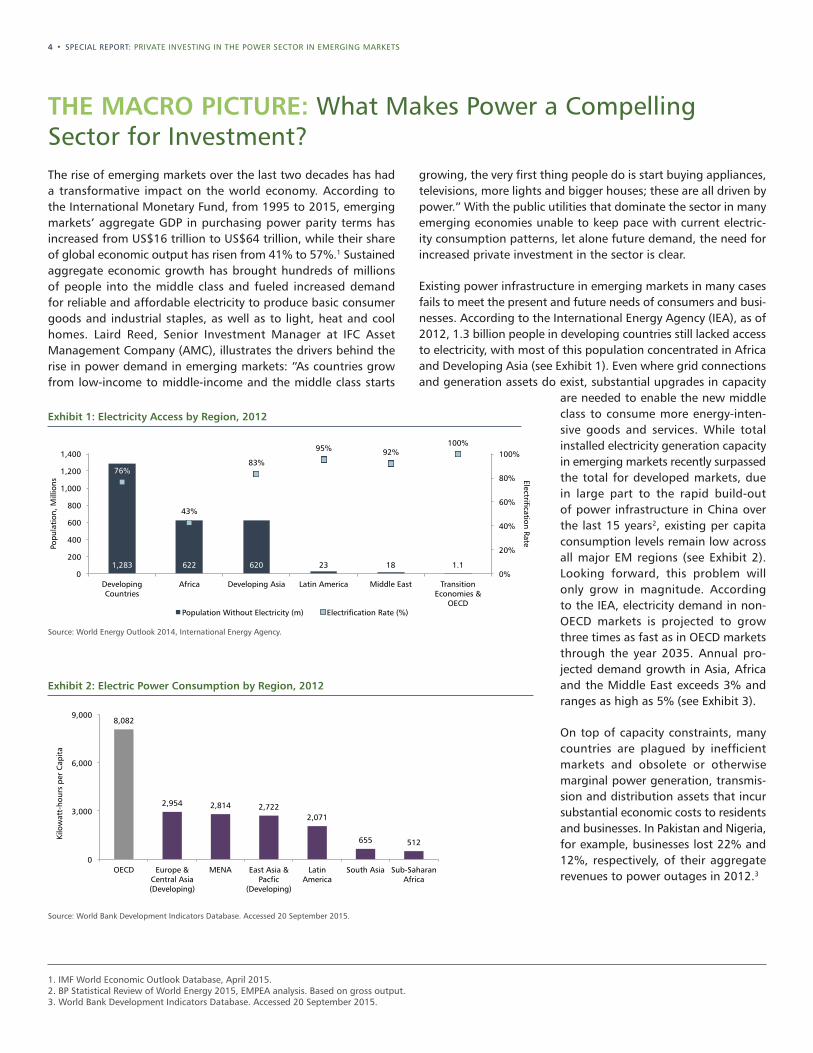
Existing power infrastructure in emerging markets in many cases fails to meet the present and future needs of consumers and busi-nesses. According to the International Energy Agency (IEA), as of 2012, 1.3 billion people in developing countries still lacked access to electricity, with most of this population concentrated in Africa and Developing Asia (see Exhibit 1). Even where grid connections and generation assets do exist, substantial upgrades in capacity
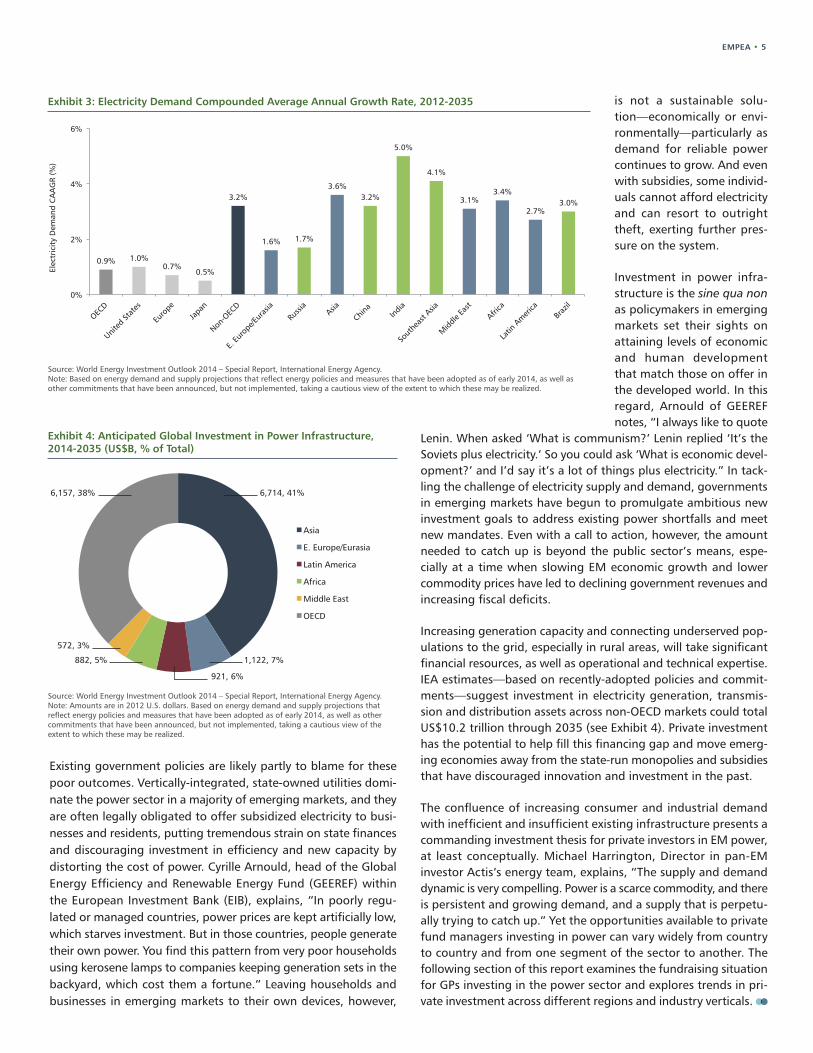
are needed to enable the new middle class to consume more energy-inten-sive goods and services. While total installed electricity generation capacity in emerging markets recently surpassed the total for developed markets, due in large part to the rapid build-out of power infrastructure in China over the last 15 years2, existing per capita consumption levels remain low across all major EM regions (see Exhibit 2). Looking forward, this problem will only grow in magnitude. According to the IEA, electricity demand in non-OECD markets is projected to grow three times as fast as in OECD markets through the year 2035. Annual pro-jected demand growth in Asia, Africa and the Middle East exceeds 3% and ranges as high as 5% (see Exhibit 3).
On top of capacity constraints, many countries are plagued by inefficient markets and obsolete or otherwise marginal power generation, transmis-sion and distribution assets that incur substantial economic costs to residents and businesses. In Pakistan and Nigeria, for example, businesses lost 22% and 12%, respectively, of their aggregate revenues to power outages in 2012.3
Exhibit 1: Electricity Access by Region, 2012
Source: World Energy Outlook 2014, International Energy Agency.
1,283 622 620 23 18 1.1
76%
43%
83%
95% 92% 100%
0%
20%
40%
60%
80%
100%
0
200
400
600
800
1,000
1,200
1,400
Developing Countries
Africa Developing Asia Latin America Middle East Transition Economies &
OECD
Electrification Rate Popu
lati
on, M
illio
ns
Population Without Electricity (m) Electrification Rate (%)
Exhibit 2: Electric Power Consumption by Region, 2012
Source: World Bank Development Indicators Database. Accessed 20 September 2015.
8,082
2,954 2,814 2,722 2,071
655 512
0
3,000
6,000
9,000
OECD Europe & Central Asia (Developing)
MENA East Asia & Pacfic
(Developing)
Latin America
South Asia Sub-Saharan Africa
Kilo
wat
t-ho
urs
per
Cap
ita
1. IMF World Economic Outlook Database, April 2015. 2. BP Statistical Review of World Energy 2015, EMPEA analysis. Based on gross output. 3. World Bank Development Indicators Database. Accessed 20 September 2015.
EMPEA • 5
Existing government policies are likely partly to blame for these poor outcomes. Vertically-integrated, state-owned utilities domi-nate the power sector in a majority of emerging markets, and they are often legally obligated to offer subsidized electricity to busi-nesses and residents, putting tremendous strain on state finances and discouraging investment in efficiency and new capacity by distorting the cost of power. Cyrille Arnould, head of the Global Energy Efficiency and Renewable Energy Fund (GEEREF) within the European Investment Bank (EIB), explains, “In poorly regu-lated or managed countries, power prices are kept artificially low, which starves investment. But in those countries, people generate their own power. You find this pattern from very poor households using kerosene lamps to companies keeping generation sets in the backyard, which cost them a fortune.” Leaving households and businesses in emerging markets to their own devices, however,
is not a sustainable solu-tion—economically or envi-ronmentally—particularly as demand for reliable power continues to grow. And even with subsidies, some individ-uals cannot afford electricity and can resort to outright theft, exerting further pres-sure on the system.
Investment in power infra-structure is the sine qua non as policymakers in emerging markets set their sights on attaining levels of economic and human development that match those on offer in the developed world. In this regard, Arnould of GEEREF notes, “I always like to quote
Lenin. When asked ‘What is communism?’ Lenin replied ‘It’s the Soviets plus electricity.’ So you could ask ‘What is economic devel-opment?’ and I’d say it’s a lot of things plus electricity.” In tack-ling the challenge of electricity supply and demand, governments in emerging markets have begun to promulgate ambitious new investment goals to address existing power shortfalls and meet new mandates. Even with a call to action, however, the amount needed to catch up is beyond the public sector’s means, espe-cially at a time when slowing EM economic growth and lower commodity prices have led to declining government revenues and increasing fiscal deficits.
Increasing generation capacity and connecting underserved pop-ulations to the grid, especially in rural areas, will take significant financial resources, as well as operational and technical expertise. IEA estimates—based on recently-adopted policies and commit-ments—suggest investment in electricity generation, transmis-sion and distribution assets across non-OECD markets could total US$10.2 trillion through 2035 (see Exhibit 4). Private investment has the potential to help fill this financing gap and move emerg-ing economies away from the state-run monopolies and subsidies that have discouraged innovation and investment in the past.
The confluence of increasing consumer and industrial demand with inefficient and insufficient existing infrastructure presents a commanding investment thesis for private investors in EM power, at least conceptually. Michael Harrington, Director in pan-EM investor Actis’s energy team, explains, “The supply and demand dynamic is very compelling. Power is a scarce commodity, and there is persistent and growing demand, and a supply that is perpetu-ally trying to catch up.” Yet the opportunities available to private fund managers investing in power can vary widely from country to country and from one segment of the sector to another. The following section of this report examines the fundraising situation for GPs investing in the power sector and explores trends in pri-vate investment across different regions and industry verticals.
Exhibit 3: Electricity Demand Compounded Average Annual Growth Rate, 2012-2035
Source: World Energy Investment Outlook 2014 – Special Report, International Energy Agency.Note: Based on energy demand and supply projections that reflect energy policies and measures that have been adopted as of early 2014, as well as other commitments that have been announced, but not implemented, taking a cautious view of the extent to which these may be realized.
0.9% 1.0% 0.7%
0.5%
3.2%
1.6% 1.7%
3.6% 3.2%
5.0%
4.1%
3.1% 3.4%
2.7% 3.0%
0%
2%
4%
6%
OECD
United
Stat
es
Euro
pe
Japa
n
Non-O
ECD
E. Eu
rope
/Eura
sia
Russi
a Asia
China
India
Sout
heas
t Asia
Midd
le Ea
st
Africa
Latin
Am
erica
Braz
il
Elec
tric
ity
Dem
and
CA
AG
R (%
)
Exhibit 4: Anticipated Global Investment in Power Infrastructure, 2014-2035 (US$B, % of Total)
Source: World Energy Investment Outlook 2014 – Special Report, International Energy Agency.Note: Amounts are in 2012 U.S. dollars. Based on energy demand and supply projections that reflect energy policies and measures that have been adopted as of early 2014, as well as other commitments that have been announced, but not implemented, taking a cautious view of the extent to which these may be realized.
6,714, 41%
1,122, 7%
921, 6%
882, 5%
572, 3%
6,157, 38%
Asia
E. Europe/Eurasia
Latin America
Africa
Middle East
OECD
6 • SPECIAL REPORT: PRIVATE INVESTING IN THE POWER SECTOR IN EMERGING MARKETS
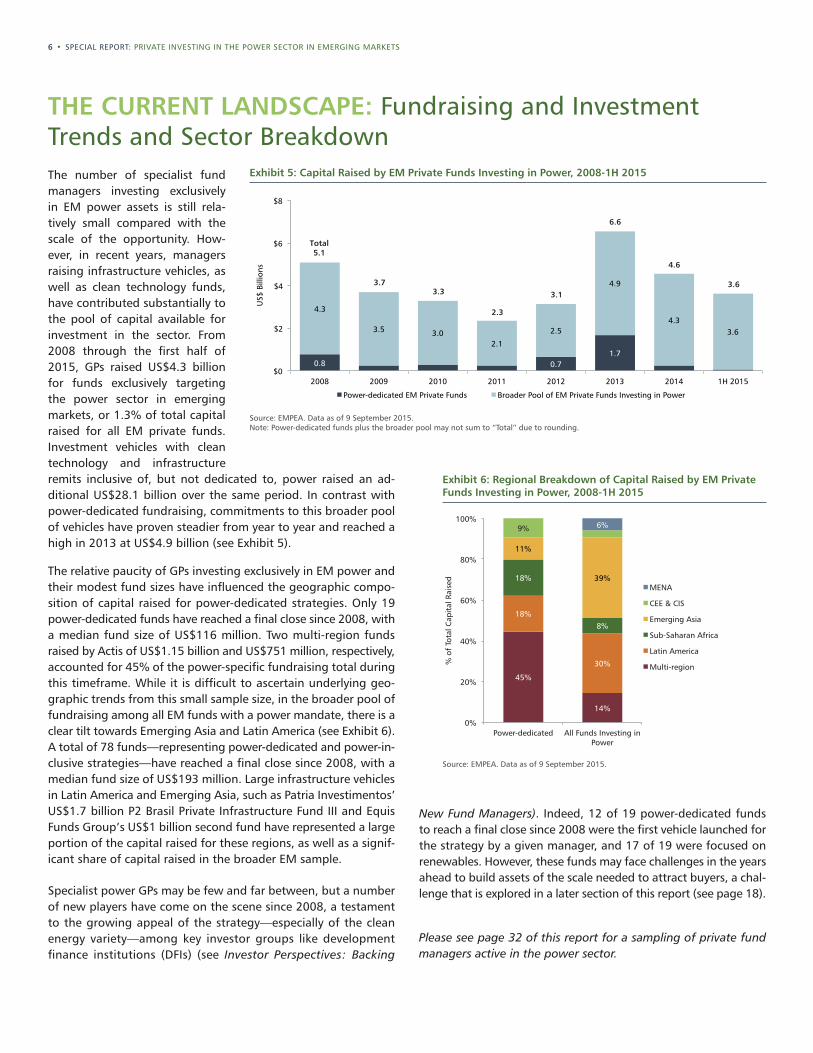
THE CURRENT LANDSCAPE: Fundraising and Investment Trends and Sector BreakdownThe number of specialist fund managers investing exclusively in EM power assets is still rela-tively small compared with the scale of the opportunity. How-ever, in recent years, managers raising infrastructure vehicles, as well as clean technology funds, have contributed substantially to the pool of capital available for investment in the sector. From 2008 through the first half of 2015, GPs raised US$4.3 billion for funds exclusively targeting the power sector in emerging markets, or 1.3% of total capital raised for all EM private funds. Investment vehicles with clean technology and infrastructure remits inclusive of, but not dedicated to, power raised an ad-ditional US$28.1 billion over the same period. In contrast with power-dedicated fundraising, commitments to this broader pool of vehicles have proven steadier from year to year and reached a high in 2013 at US$4.9 billion (see Exhibit 5).
The relative paucity of GPs investing exclusively in EM power and their modest fund sizes have influenced the geographic compo-sition of capital raised for power-dedicated strategies. Only 19 power-dedicated funds have reached a final close since 2008, with a median fund size of US$116 million. Two multi-region funds raised by Actis of US$1.15 billion and US$751 million, respectively, accounted for 45% of the power-specific fundraising total during this timeframe. While it is difficult to ascertain underlying geo-graphic trends from this small sample size, in the broader pool of fundraising among all EM funds with a power mandate, there is a clear tilt towards Emerging Asia and Latin America (see Exhibit 6). A total of 78 funds—representing power-dedicated and power-in-clusive strategies—have reached a final close since 2008, with a median fund size of US$193 million. Large infrastructure vehicles in Latin America and Emerging Asia, such as Patria Investimentos’ US$1.7 billion P2 Brasil Private Infrastructure Fund III and Equis Funds Group’s US$1 billion second fund have represented a large portion of the capital raised for these regions, as well as a signif-icant share of capital raised in the broader EM sample.
Specialist power GPs may be few and far between, but a number of new players have come on the scene since 2008, a testament to the growing appeal of the strategy—especially of the clean energy variety—among key investor groups like development finance institutions (DFIs) (see Investor Perspectives: Backing
New Fund Managers). Indeed, 12 of 19 power-dedicated funds to reach a final close since 2008 were the first vehicle launched for the strategy by a given manager, and 17 of 19 were focused on renewables. However, these funds may face challenges in the years ahead to build assets of the scale needed to attract buyers, a chal-lenge that is explored in a later section of this report (see page 18).
Please see page 32 of this report for a sampling of private fund managers active in the power sector.
Exhibit 5: Capital Raised by EM Private Funds Investing in Power, 2008-1H 2015
Source: EMPEA. Data as of 9 September 2015. Note: Power-dedicated funds plus the broader pool may not sum to “Total” due to rounding.
0.8 0.7 1.7
4.3
3.5 3.0 2.1
2.5
4.9
4.3 3.6
$0
$2
$4
$6
$8
2008 2009 2010 2011 2012 2013 2014 1H 2015
US$
Bill
ions
Power-dedicated EM Private Funds Broader Pool of EM Private Funds Investing in Power
3.73.3
4.6
6.6
3.13.6
2.3
Total5.1
Exhibit 6: Regional Breakdown of Capital Raised by EM Private Funds Investing in Power, 2008-1H 2015
Source: EMPEA. Data as of 9 September 2015.
45%
14%
18%
30%
11%
39% 18%
8%
9% 6%
0%
20%
40%
60%
80%
100%
Power-dedicated All Funds Investing in Power
% o
f To
tal C
apit
al R
aise
d
MENA
CEE & CIS
Emerging Asia
Sub-Saharan Africa
Latin America
Multi-region
EMPEA • 7
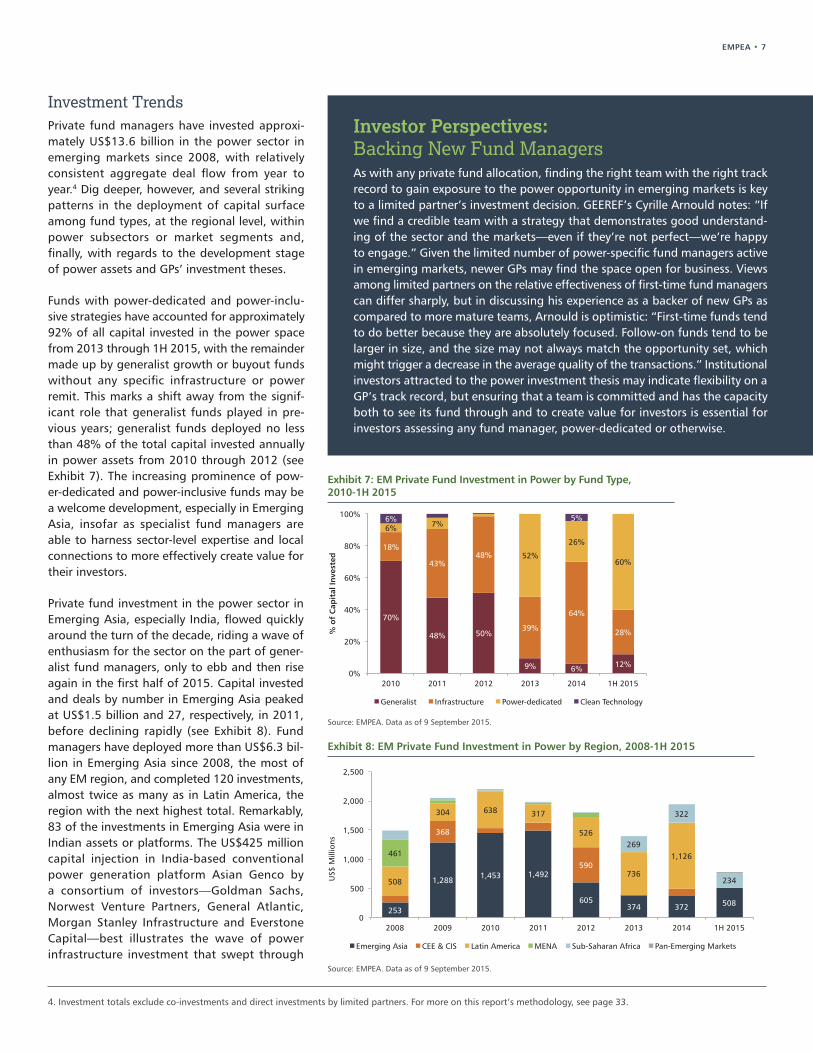
Exhibit 7: EM Private Fund Investment in Power by Fund Type, 2010-1H 2015
Source: EMPEA. Data as of 9 September 2015.
70%
48% 50%
9% 6% 12%
18%
43% 48%
39%
64%
28%
6% 7%
52%
26%
60%
6% 5%
0%
20%
40%
60%
80%
100%
2010 2011 2012 2013 2014 1H 2015
% o
f C
apit
al In
vest
ed
Generalist Infrastructure Power-dedicated Clean Technology
Investor Perspectives: Backing New Fund ManagersAs with any private fund allocation, finding the right team with the right track record to gain exposure to the power opportunity in emerging markets is key to a limited partner’s investment decision. GEEREF’s Cyrille Arnould notes: “If we find a credible team with a strategy that demonstrates good understand-ing of the sector and the markets—even if they’re not perfect—we’re happy to engage.” Given the limited number of power-specific fund managers active in emerging markets, newer GPs may find the space open for business. Views among limited partners on the relative effectiveness of first-time fund managers can differ sharply, but in discussing his experience as a backer of new GPs as compared to more mature teams, Arnould is optimistic: “First-time funds tend to do better because they are absolutely focused. Follow-on funds tend to be larger in size, and the size may not always match the opportunity set, which might trigger a decrease in the average quality of the transactions.” Institutional investors attracted to the power investment thesis may indicate flexibility on a GP’s track record, but ensuring that a team is committed and has the capacity both to see its fund through and to create value for investors is essential for investors assessing any fund manager, power-dedicated or otherwise.
Exhibit 8: EM Private Fund Investment in Power by Region, 2008-1H 2015
Source: EMPEA. Data as of 9 September 2015.
253
1,288 1,453 1,492
605 374 372 508
368
590
508
304 638 317
526
736
1,126 461 269
322
234
0
500
1,000
1,500
2,000
2,500
2008 2009 2010 2011 2012 2013 2014 1H 2015
US$
Mill
ions
Emerging Asia CEE & CIS Latin America MENA Sub-Saharan Africa Pan-Emerging Markets
Investment TrendsPrivate fund managers have invested approxi-mately US$13.6 billion in the power sector in emerging markets since 2008, with relatively consistent aggregate deal flow from year to year.4 Dig deeper, however, and several striking patterns in the deployment of capital surface among fund types, at the regional level, within power subsectors or market segments and, finally, with regards to the development stage of power assets and GPs’ investment theses.
Funds with power-dedicated and power-inclu-sive strategies have accounted for approximately 92% of all capital invested in the power space from 2013 through 1H 2015, with the remainder made up by generalist growth or buyout funds without any specific infrastructure or power remit. This marks a shift away from the signif-icant role that generalist funds played in pre-vious years; generalist funds deployed no less than 48% of the total capital invested annually in power assets from 2010 through 2012 (see Exhibit 7). The increasing prominence of pow-er-dedicated and power-inclusive funds may be a welcome development, especially in Emerging Asia, insofar as specialist fund managers are able to harness sector-level expertise and local connections to more effectively create value for their investors.
Private fund investment in the power sector in Emerging Asia, especially India, flowed quickly around the turn of the decade, riding a wave of enthusiasm for the sector on the part of gener-alist fund managers, only to ebb and then rise again in the first half of 2015. Capital invested and deals by number in Emerging Asia peaked at US$1.5 billion and 27, respectively, in 2011, before declining rapidly (see Exhibit 8). Fund managers have deployed more than US$6.3 bil-lion in Emerging Asia since 2008, the most of any EM region, and completed 120 investments, almost twice as many as in Latin America, the region with the next highest total. Remarkably, 83 of the investments in Emerging Asia were in Indian assets or platforms. The US$425 million capital injection in India-based conventional power generation platform Asian Genco by a consortium of investors—Goldman Sachs, Norwest Venture Partners, General Atlantic, Morgan Stanley Infrastructure and Everstone Capital—best illustrates the wave of power infrastructure investment that swept through
4. Investment totals exclude co-investments and direct investments by limited partners. For more on this report’s methodology, see page 33.
8 • SPECIAL REPORT: PRIVATE INVESTING IN THE POWER SECTOR IN EMERGING MARKETS
Key Segments of the Power SectorThe power sector can be divided into three principal subsectors: generation, the transformation of primary energy within power plants into electricity; transmission, the transfer of electricity from utility-scale power plants to local networks near end users; and distribution, the “last-mile” delivery of electricity to end users. Large vertically-integrated utilities, often publicly-owned, operate across all three phases, and while public utilities often hold a monopoly on transmission and distribution, independent power producers (IPPs)
are active in the generation segment in most emerging markets. Private players in utility-scale power generation are complemented by companies that provide distributed generation services, install-ing, operating and/or maintaining small-scale generation assets at the point of use. In liberalized markets with private participation in the transmission and distribution segments, wholesale markets, rather than a monopoly utility, intermediate supply and demand for electricity, and power trading firms play a role as brokers.
Exhibit 9: Key Segments of the Power Sector
Source: EMPEA.
Generation (Utility-scale)
Generation (Distributed)
Primary Energy
Conventional: Coal, Natural Gas and Fuel Oil or Diesel
Renewable: Wind, Hydro, Solar, Geothermal, Biomass, Waste to Energy
The "Grid"
Transmission Distribution
End User
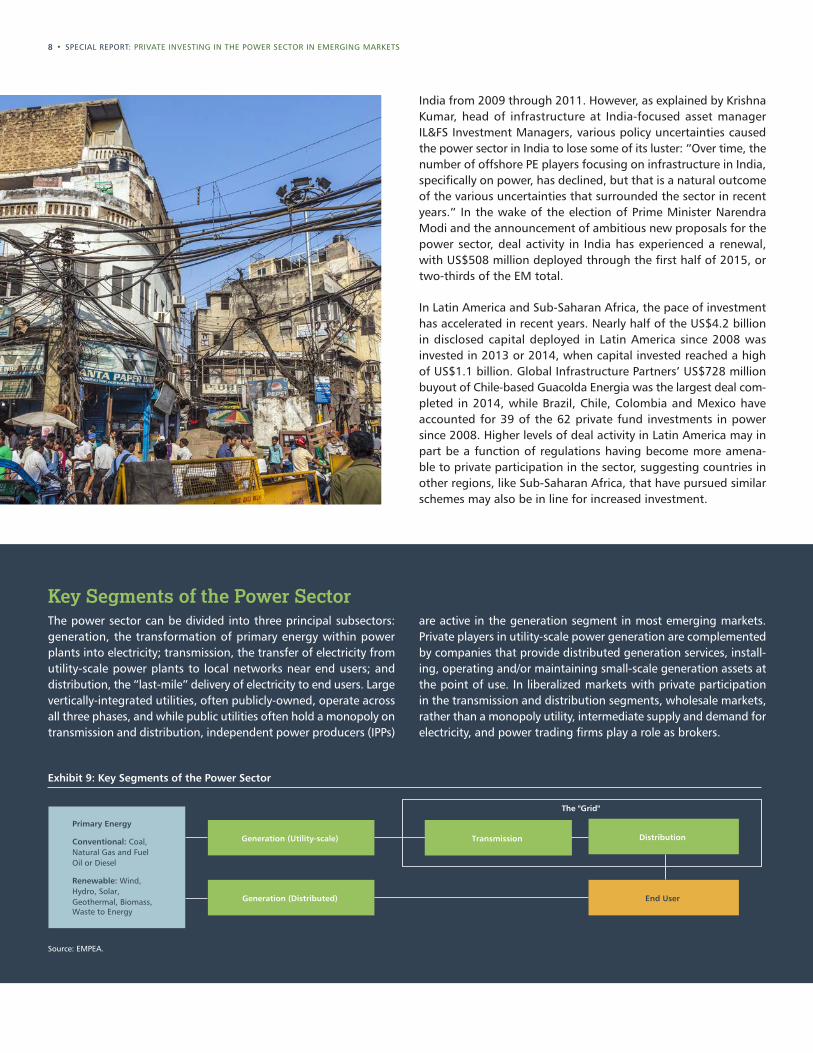
India from 2009 through 2011. However, as explained by Krishna Kumar, head of infrastructure at India-focused asset manager IL&FS Investment Managers, various policy uncertainties caused the power sector in India to lose some of its luster: “Over time, the number of offshore PE players focusing on infrastructure in India, specifically on power, has declined, but that is a natural outcome of the various uncertainties that surrounded the sector in recent years.” In the wake of the election of Prime Minister Narendra Modi and the announcement of ambitious new proposals for the power sector, deal activity in India has experienced a renewal, with US$508 million deployed through the first half of 2015, or two-thirds of the EM total.
In Latin America and Sub-Saharan Africa, the pace of investment has accelerated in recent years. Nearly half of the US$4.2 billion in disclosed capital deployed in Latin America since 2008 was invested in 2013 or 2014, when capital invested reached a high of US$1.1 billion. Global Infrastructure Partners’ US$728 million buyout of Chile-based Guacolda Energia was the largest deal com-pleted in 2014, while Brazil, Chile, Colombia and Mexico have accounted for 39 of the 62 private fund investments in power since 2008. Higher levels of deal activity in Latin America may in part be a function of regulations having become more amena-ble to private participation in the sector, suggesting countries in other regions, like Sub-Saharan Africa, that have pursued similar schemes may also be in line for increased investment.
EMPEA • 9
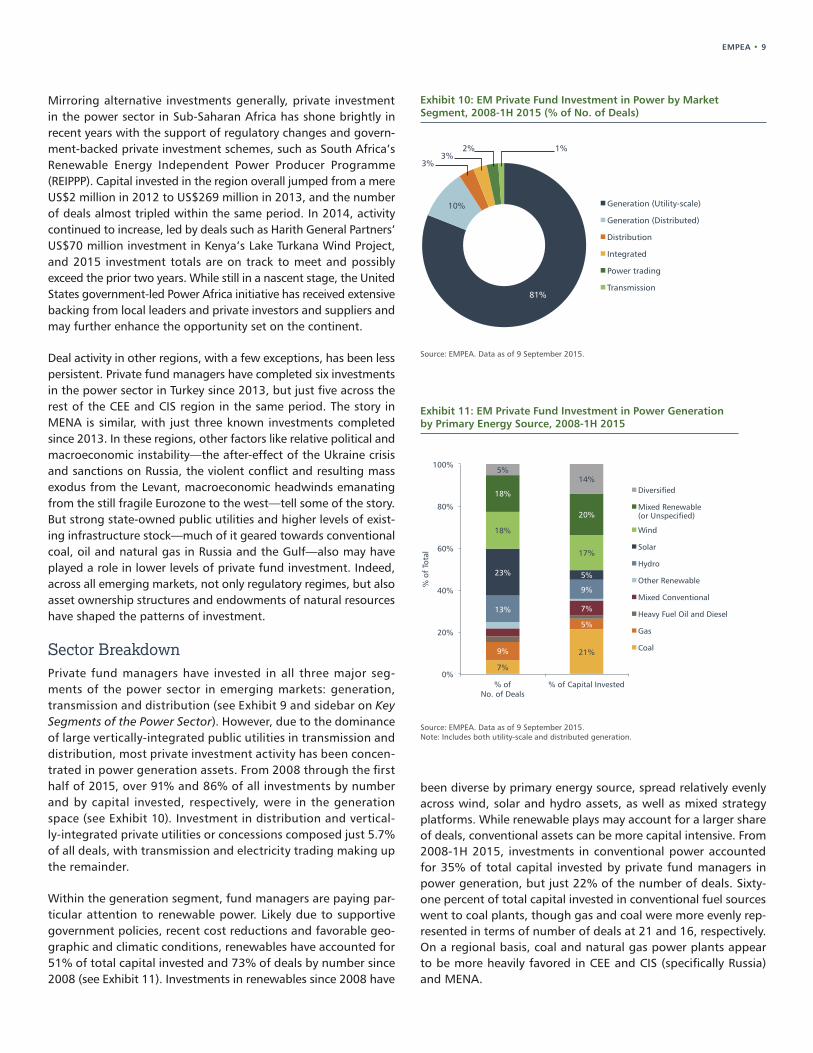
Exhibit 10: EM Private Fund Investment in Power by Market Segment, 2008-1H 2015 (% of No. of Deals)
Source: EMPEA. Data as of 9 September 2015.
81%
10%
3% 3%
2% 1%
Generation (Utility-scale)
Generation (Distributed)
Distribution
Integrated
Power trading
Transmission
Exhibit 11: EM Private Fund Investment in Power Generation by Primary Energy Source, 2008-1H 2015
Source: EMPEA. Data as of 9 September 2015.Note: Includes both utility-scale and distributed generation.
7%
21% 9%
5%
7% 13%
9%
5% 23%
18%
17%
18%
20%
5% 14%
0%
20%
40%
60%
80%
100%
% of No. of Deals
% of Capital Invested
% o
f To
tal
Diversified
Mixed Renewable (or Unspecified)
Wind
Solar
Hydro
Other Renewable
Mixed Conventional
Heavy Fuel Oil and Diesel
Gas
Coal
Mirroring alternative investments generally, private investment in the power sector in Sub-Saharan Africa has shone brightly in recent years with the support of regulatory changes and govern-ment-backed private investment schemes, such as South Africa’s Renewable Energy Independent Power Producer Programme (REIPPP). Capital invested in the region overall jumped from a mere US$2 million in 2012 to US$269 million in 2013, and the number of deals almost tripled within the same period. In 2014, activity continued to increase, led by deals such as Harith General Partners’ US$70 million investment in Kenya’s Lake Turkana Wind Project, and 2015 investment totals are on track to meet and possibly exceed the prior two years. While still in a nascent stage, the United States government-led Power Africa initiative has received extensive backing from local leaders and private investors and suppliers and may further enhance the opportunity set on the continent.
Deal activity in other regions, with a few exceptions, has been less persistent. Private fund managers have completed six investments in the power sector in Turkey since 2013, but just five across the rest of the CEE and CIS region in the same period. The story in MENA is similar, with just three known investments completed since 2013. In these regions, other factors like relative political and macroeconomic instability—the after-effect of the Ukraine crisis and sanctions on Russia, the violent conflict and resulting mass exodus from the Levant, macroeconomic headwinds emanating from the still fragile Eurozone to the west—tell some of the story. But strong state-owned public utilities and higher levels of exist-ing infrastructure stock—much of it geared towards conventional coal, oil and natural gas in Russia and the Gulf—also may have played a role in lower levels of private fund investment. Indeed, across all emerging markets, not only regulatory regimes, but also asset ownership structures and endowments of natural resources have shaped the patterns of investment.
Sector BreakdownPrivate fund managers have invested in all three major seg-ments of the power sector in emerging markets: generation, transmission and distribution (see Exhibit 9 and sidebar on Key Segments of the Power Sector). However, due to the dominance of large vertically-integrated public utilities in transmission and distribution, most private investment activity has been concen-trated in power generation assets. From 2008 through the first half of 2015, over 91% and 86% of all investments by number and by capital invested, respectively, were in the generation space (see Exhibit 10). Investment in distribution and vertical-ly-integrated private utilities or concessions composed just 5.7% of all deals, with transmission and electricity trading making up the remainder.
Within the generation segment, fund managers are paying par-ticular attention to renewable power. Likely due to supportive government policies, recent cost reductions and favorable geo-graphic and climatic conditions, renewables have accounted for 51% of total capital invested and 73% of deals by number since 2008 (see Exhibit 11). Investments in renewables since 2008 have
been diverse by primary energy source, spread relatively evenly across wind, solar and hydro assets, as well as mixed strategy platforms. While renewable plays may account for a larger share of deals, conventional assets can be more capital intensive. From 2008-1H 2015, investments in conventional power accounted for 35% of total capital invested by private fund managers in power generation, but just 22% of the number of deals. Sixty-one percent of total capital invested in conventional fuel sources went to coal plants, though gas and coal were more evenly rep-resented in terms of number of deals at 21 and 16, respectively. On a regional basis, coal and natural gas power plants appear to be more heavily favored in CEE and CIS (specifically Russia) and MENA.
10 • SPECIAL REPORT: PRIVATE INVESTING IN THE POWER SECTOR IN EMERGING MARKETS
Private Debt and Mezzanine Funds and EM PowerThough private fund managers typically provide equity capital to EM-based power companies and projects, senior debt and mezzanine investments have accounted for 12% of deals in the sector since 2008. GPs providing senior debt can supplement commercial bank or DFI financing in the construction of new assets or in restructuring the liabilities of those already in operation, while mezzanine financing can work well for power producers with capital needs, but a closed group of equity backers and limited recourse to more traditional lenders. According to Yaw Keteku of pan-African mezzanine and senior debt fund manager Vantage Capital, “Mezzanine works well in the power sector because it’s a flexible form of capital; it’s more shareholder-friendly than pure equity, more flexible than senior debt and potentially
complementary to both.” When Ghana-based independent power producer Genser Energy faced a funding gap for a plant it was building for a Canadian mining company, Vantage provided US$18.5 million in mezzanine financing to complete the project. Closely-held Genser had tapped out its senior debt facilities, so accessing new funding while avoiding the dilution of its family owners was critical. The long-term contracted revenues of power assets are particularly appealing to mezzanine fund managers, given the nature of their financing. Keteku adds, “Infrastructure projects, power assets in particular, are appealing because they have predictable earnings streams, and because our instrument is debt-like, it’s good to have that to lend against, with potential equity upside.”
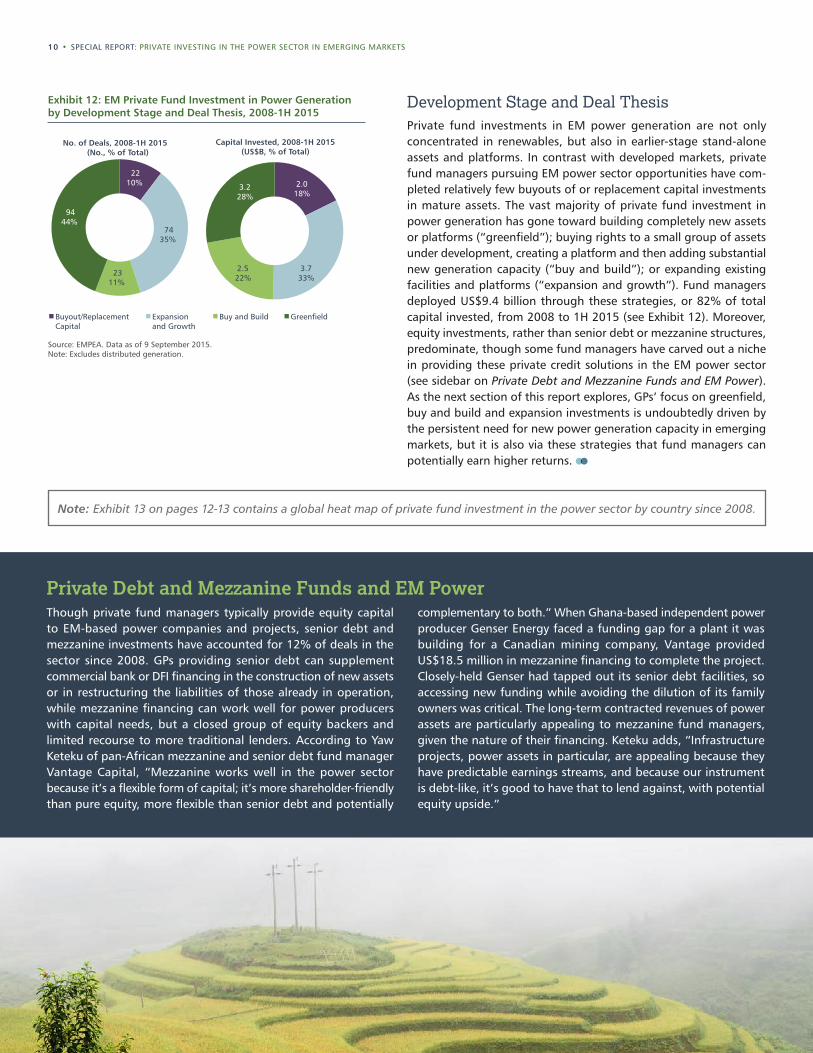
Development Stage and Deal ThesisPrivate fund investments in EM power generation are not only concentrated in renewables, but also in earlier-stage stand-alone assets and platforms. In contrast with developed markets, private fund managers pursuing EM power sector opportunities have com-pleted relatively few buyouts of or replacement capital investments in mature assets. The vast majority of private fund investment in power generation has gone toward building completely new assets or platforms (“greenfield”); buying rights to a small group of assets under development, creating a platform and then adding substantial new generation capacity (“buy and build”); or expanding existing facilities and platforms (“expansion and growth”). Fund managers deployed US$9.4 billion through these strategies, or 82% of total capital invested, from 2008 to 1H 2015 (see Exhibit 12). Moreover, equity investments, rather than senior debt or mezzanine structures, predominate, though some fund managers have carved out a niche in providing these private credit solutions in the EM power sector (see sidebar on Private Debt and Mezzanine Funds and EM Power). As the next section of this report explores, GPs’ focus on greenfield, buy and build and expansion investments is undoubtedly driven by the persistent need for new power generation capacity in emerging markets, but it is also via these strategies that fund managers can potentially earn higher returns.
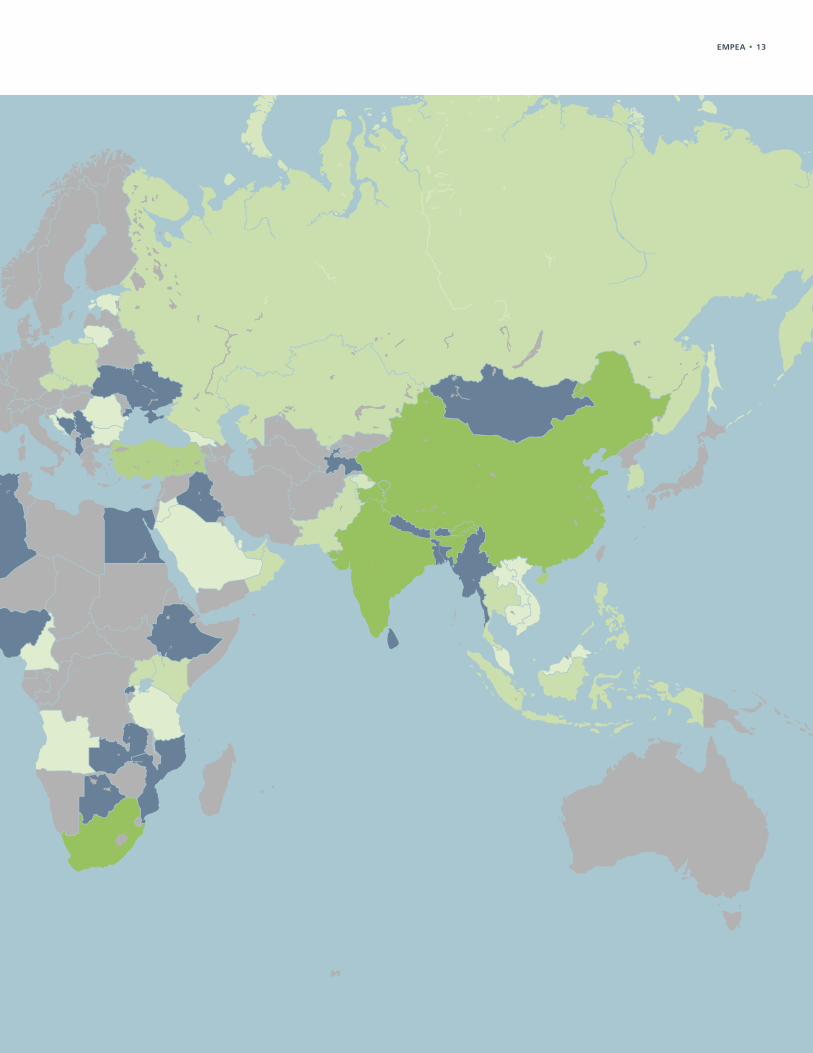
Note: Exhibit 13 on pages 12-13 contains a global heat map of private fund investment in the power sector by country since 2008.
Exhibit 12: EM Private Fund Investment in Power Generation by Development Stage and Deal Thesis, 2008-1H 2015
Source: EMPEA. Data as of 9 September 2015.Note: Excludes distributed generation.
2210%
7435%
2311%
9444%
No. of Deals, 2008-1H 2015 (No., % of Total)
2.0 18%
3.7 33%
2.5 22%
3.2 28%
Capital Invested, 2008-1H 2015 (US$B, % of Total)
Buyout/Replacement Capital
Expansion and Growth
Buy and Build Greenfield
EMPEA • 11
EMPEA Market MapIdentifying 1,000 global emerging markets private capital fund managers, while generating targeted lists customized to your specific search terms.
EMPEA Market Map
The EMPEA Market Map provides Members exclusive access to interactive, searchable listings of private investment fund managers active in emerging markets and EM-focused private investment funds currently raising capital. The Market Map supplements EMPEA’s quarterly Industry Statistics and Data Insights and is powered by our proprietary database, FundLink.
Discover our recently released beta version for Members-only, where you can access regional searches, advanced custom searches and funds in the market.
To get started, visit EMPEA.org and login.
All Market Map data is exportable via a link at the bottom of each dashboard.
Visit us at EMPEA.org
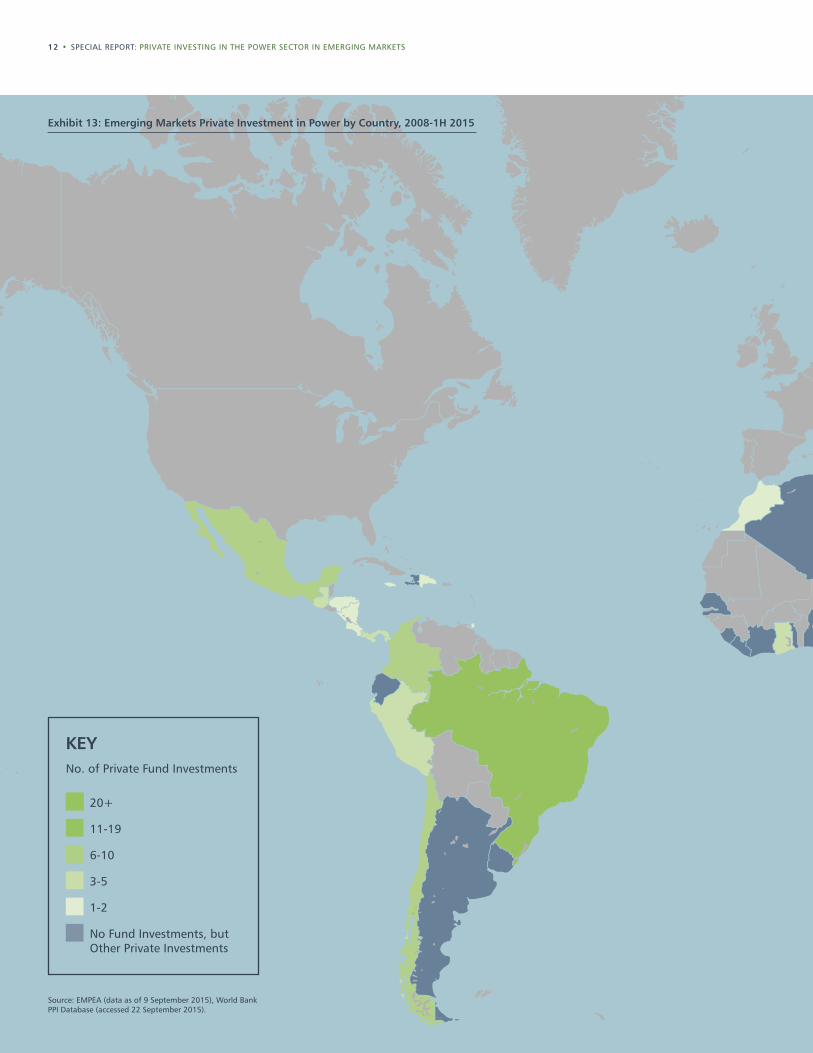
12 • SPECIAL REPORT: PRIVATE INVESTING IN THE POWER SECTOR IN EMERGING MARKETS
KEY
No. of Private Fund Investments
20+
11-19
6-10
3-5
1-2
No Fund Investments, but Other Private Investments
Exhibit 13: Emerging Markets Private Investment in Power by Country, 2008-1H 2015
Source: EMPEA (data as of 9 September 2015), World Bank PPI Database (accessed 22 September 2015).
EMPEA • 13
14 • SPECIAL REPORT: PRIVATE INVESTING IN THE POWER SECTOR IN EMERGING MARKETS
Substantial investment in new power generation capacity in emerging markets is required to meet both current shortfalls and future demand, and the investment activity of EM-focused private fund managers—attracted by the return potential of higher-risk, higher-reward greenfield and expansion opportunities—has reflected this reality. Saurabh Agarwal, Principal at global private equity firm Warburg Pincus, explains, “Supply in many countries is lagging far behind demand. As a result, power prices are high, and there is room to build a lot of supply and still take advantage of the high-price environment to generate an attractive return on capital.” However, the skill and resilience needed to see a power generation project through to completion while navigating reg-ulatory hurdles and other difficulties in EM environments should not be underestimated. Agarwal adds, “The challenge that comes into play—and the reason why supply is limited—is because it’s really hard to build power plants.” The challenges of investing in generation assets, especially greenfield projects, are manifold, but the rewards are clear for fund managers able to successfully navigate obstacles in the development and construction process and find suitable buyers for operational assets.
Build and SellOpportunities for private fund managers to invest in power gen-eration assets have grown as more and more governments in emerging markets have adopted the independent power producer (IPP) model to build out generation capacity (see sidebar A Closer Look at IPPs and PPAs). Under this scheme, fund manager-backed developers—which may range from a small team of entrepre-neurs and engineers developing a single power plant to a large development platform with a dozen pipeline projects—can ensure that electricity produced by a new power plant has a guaranteed buyer. For renewable power assets, feed-in tariffs, which provide guaranteed payments in line with the cost of deploying particu-lar renewable technologies, play a similar role. These contractual mechanisms attempt to ensure a steady stream of future cash flows for a generation asset and are what ultimately lend it value once it has been built and commissioned.
Yet getting a greenfield power project to the operational stage of its life can be an arduous process, in which the development team and its backers must move through a sequence of key project development tasks with little margin for error. Obtaining the nec-essary regulatory approvals and permits to operate, hiring contrac-tors for construction and maintenance, arranging fuel supply (for coal, natural gas or biomass plants) and, most critically, signing a PPA are all necessary before further equity and debt financing to fund the cost of construction can be closed.
According to Sumeet Thakur, Global Head of Power at International Finance Corporation (IFC), a development finance institution with a mandate to support infrastructure development in emerging
A Closer Look at the Independent Power Producer Model and Power Purchase AgreementsBy Kirsti Massie, Ank Santens and Someera Khokhar of White & Case LLP
In emerging markets, governments and utility companies (which are often state-owned) have increasingly turned to “IPPs”—private-sector entities that generate electricity for sale to utilities and end users—to attract new sources of capital to finance power projects and to ensure that they are constructed efficiently and quickly, while bringing to bear new expertise and skill sets.
Typically, new IPPs sell electricity into the state-dominated power system under a long-term power purchase agreement (PPA). A PPA is entered into between a project company and an offtaker (again typically a state-owned entity), where the offtaker undertakes to make “availability-based” payments to the project company, with smaller payments made for energy output. Many of the cost components for IPPs, such as debt and equity financing, equipment and fuel, are denominated in a hard currency, whereas PPA payments, the main source of revenue for the project company, are typically made in local currency. (This currency mismatch can create risks for investors, an issue explored on page 26 of this report.)
A PPA structure provides a degree of certainty with respect to revenues for the financers of power projects, security that is typically missing in “merchant” assets, which sell electricity at variable prices on wholesale markets. By tapping private capital, governments no longer need to raise the financing for new capacity themselves—an attractive option for gov-ernments that are attempting to manage financial crises and cash-poor state finances.
5. “Institutional Investment in Infrastructure in Emerging Markets and Developing Economies,” PPIAF, March 2014.
markets, many of the large multinational corporations who once dominated the infrastructure space in emerging markets are no longer as active as they used to be, and a shortage of capital to fund new projects looms: “One of the greatest challenges we’ve faced has been fewer global sponsors that are willing to work in emerging markets, though the full negative impact of this has been mitigated to an extent by local and regional sponsors.” Moreover, many banks and insurance companies in developed markets have pulled away from financing infrastructure in emerg-ing economies following the global financial crisis and the imple-mentation of new regulations like Basel III.5
THE OPPORTUNITY IN POWER GENERATION
EMPEA • 15
Exhibit 14: Power Generation Project Lifecycle – Key Stages and Risk and Return Characteristics
Source: EMPEA.
Risk Capital
Long-term Yield
Development-phase
Feasibility Assessment Land Acquisition
Permitting and Licensing Engineering, Procurement and
Construction (EPC) Contract Operations and Maintenance Agreement
Fuel Supply Agreement (if applicable) Power Purchase Agreement
Project Financing and Insurance
Financial Close
Higher
Lower
Contruction, Testing and Commisioning
Full Operation
Risk and Expected
Return Profile
Project Maturity and Investor
Point of Entry
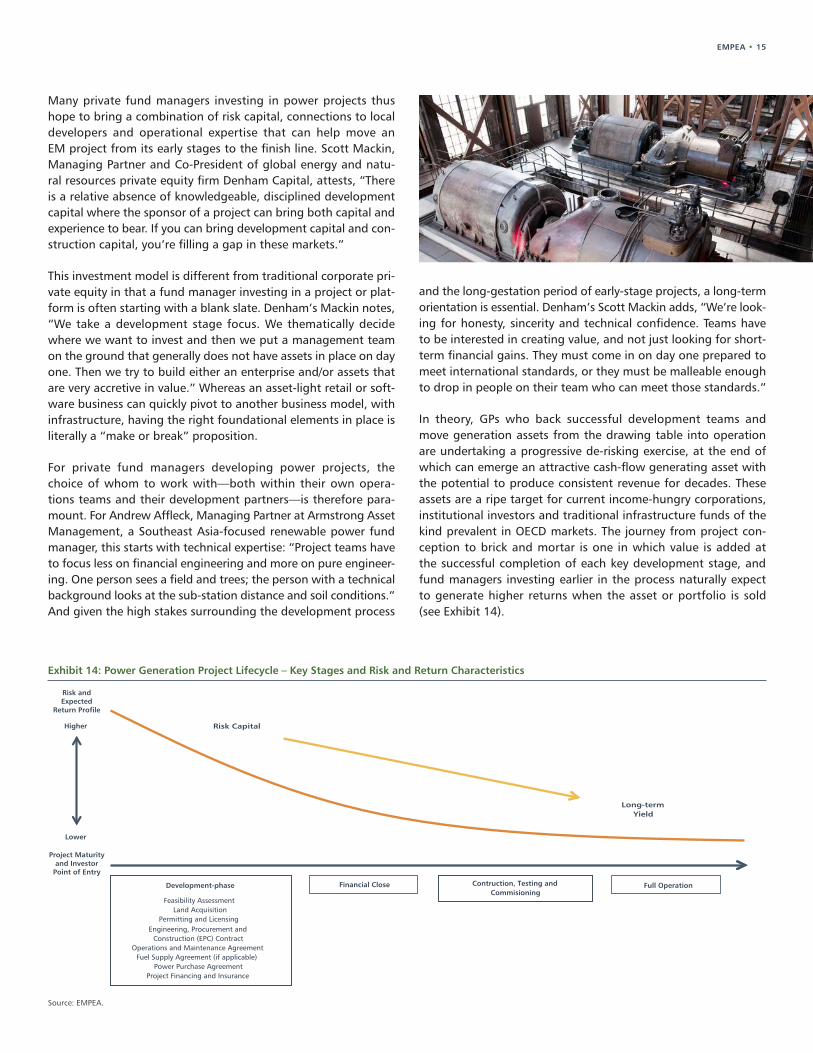
Many private fund managers investing in power projects thus hope to bring a combination of risk capital, connections to local developers and operational expertise that can help move an EM project from its early stages to the finish line. Scott Mackin, Managing Partner and Co-President of global energy and natu-ral resources private equity firm Denham Capital, attests, “There is a relative absence of knowledgeable, disciplined development capital where the sponsor of a project can bring both capital and experience to bear. If you can bring development capital and con-struction capital, you’re filling a gap in these markets.”
This investment model is different from traditional corporate pri-vate equity in that a fund manager investing in a project or plat-form is often starting with a blank slate. Denham’s Mackin notes, “We take a development stage focus. We thematically decide where we want to invest and then we put a management team on the ground that generally does not have assets in place on day one. Then we try to build either an enterprise and/or assets that are very accretive in value.” Whereas an asset-light retail or soft-ware business can quickly pivot to another business model, with infrastructure, having the right foundational elements in place is literally a “make or break” proposition.
For private fund managers developing power projects, the choice of whom to work with—both within their own opera-tions teams and their development partners—is therefore para-mount. For Andrew Affleck, Managing Partner at Armstrong Asset Management, a Southeast Asia-focused renewable power fund manager, this starts with technical expertise: “Project teams have to focus less on financial engineering and more on pure engineer-ing. One person sees a field and trees; the person with a technical background looks at the sub-station distance and soil conditions.” And given the high stakes surrounding the development process
and the long-gestation period of early-stage projects, a long-term orientation is essential. Denham’s Scott Mackin adds, “We’re look-ing for honesty, sincerity and technical confidence. Teams have to be interested in creating value, and not just looking for short-term financial gains. They must come in on day one prepared to meet international standards, or they must be malleable enough to drop in people on their team who can meet those standards.”
In theory, GPs who back successful development teams and move generation assets from the drawing table into operation are undertaking a progressive de-risking exercise, at the end of which can emerge an attractive cash-flow generating asset with the potential to produce consistent revenue for decades. These assets are a ripe target for current income-hungry corporations, institutional investors and traditional infrastructure funds of the kind prevalent in OECD markets. The journey from project con-ception to brick and mortar is one in which value is added at the successful completion of each key development stage, and fund managers investing earlier in the process naturally expect to generate higher returns when the asset or portfolio is sold (see Exhibit 14).
16 • SPECIAL REPORT: PRIVATE INVESTING IN THE POWER SECTOR IN EMERGING MARKETS
Fund Manager(s) Company NameCountry/Region Asset Description Source Type
Energy Source Deal Type(s)
Investment Amount(s)
(US$m)Investment
Date(s)
Amadeus Capital Partners Cambridge Clean Energy (CEE)
Pan-Emerging Markets Distributed Generation Renewable Solar Equity 12 Feb-15
Novastar Ventures SolarNow Uganda Distributed Generation Renewable Solar Equity 1 Oct-14
Actis Zuma Energia Mexico Development Platform Diversified Diversified Equity 250 Sep-14
Armstrong Asset Management nv vogt Philippines Development Platform Renewable Solar Equity 29 Aug-14
Foursan Group Shamsuna Power Jordan Stand-alone Renewable Solar Equity N/A May-14
Global Infrastructure Partners Guacolda Energia Chile Stand-alone Conventional Coal Equity 728 Mar-14
Harith General Partners Lake Turkana Wind Project Kenya Stand-alone Renewable Wind Equity 70 Mar-14
American Capital Energy & Infrastructure (ACEI) BMR Energy Latin America Development Platform Renewable Wind Equity 25 Dec-13
Small Enterprise Assistance Funds (SEAF) Alazani II Georgia Stand-alone Renewable Hydro Mezzanine 3 May-13
Vantage Capital Genser Energy Ghana Distributed Generation Conventional Diversified Mezzanine N/A Mar-13
Crescent Capital Turksolar Turkey Stand-alone Renewable Solar Equity N/A Mar-13
IL&FS Investment Managers MAXpower Indonesia Distributed Generation Conventional Diversified Equity 59 Feb-12
ACON Investments Hidrotenencias Panama Development Platform Renewable Hydro Equity 30 Feb-12
Gulf Capital Smart Energy Solutions (SES)
United Arab Emirates Distributed Generation Conventional Heavy Fuel Oil Equity, Senior
Debt N/A, 25 Jan-12, Mar-12
Dragon Capital Electricite Du Laos Generation Laos Development Platform Renewable Hydro PIPE 3 Jan-11
KKR Avantha Power & Infrastructure India Development Platform Conventional Coal Equity 54, 75 Oct-10, Jul-11
Warburg Pincus Omega Energia Renovavel Brazil Development Platform Renewable Hydro Equity 201 Sep-10
Global Environment Fund (GEF)
UPC Renewables China Holdings China Development Platform Renewable Wind Equity 30 Feb-10
IDFC Alternatives GMR Energy India Development Platform Conventional Diversified Equity N/A, 100 Oct-09, Mar-11
Darby Private Equity Eletrogoes Brazil Development Platform Renewable Diversified Mezzanine 30 Jul-09
3i Group Adani Power India Development Platform Conventional Coal Equity 750 Jun-09
Cordiant Capital Polaris Energy Nicaragua Nicaragua Stand-alone Renewable Geothermal Senior Debt N/A Dec-08
Denham Capital Management BioTherm Energy South Africa Development Platform Renewable Diversified Equity 150 Oct-08
Source: EMPEA. Data as of 9 September 2015.
Exhibit 15: Sampling of Private Fund Investments in Power Generation, 2008-1H 2015
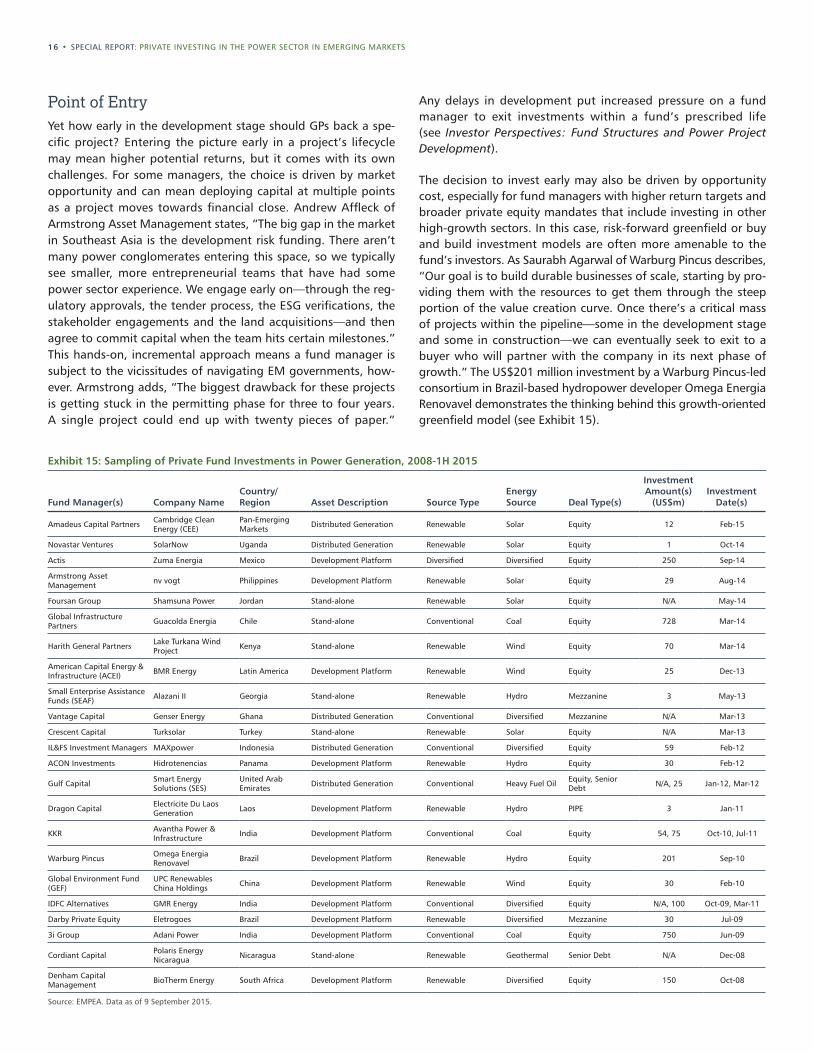
Point of EntryYet how early in the development stage should GPs back a spe-cific project? Entering the picture early in a project’s lifecycle may mean higher potential returns, but it comes with its own challenges. For some managers, the choice is driven by market opportunity and can mean deploying capital at multiple points as a project moves towards financial close. Andrew Affleck of Armstrong Asset Management states, “The big gap in the market in Southeast Asia is the development risk funding. There aren’t many power conglomerates entering this space, so we typically see smaller, more entrepreneurial teams that have had some power sector experience. We engage early on—through the reg-ulatory approvals, the tender process, the ESG verifications, the stakeholder engagements and the land acquisitions—and then agree to commit capital when the team hits certain milestones.” This hands-on, incremental approach means a fund manager is subject to the vicissitudes of navigating EM governments, how-ever. Armstrong adds, “The biggest drawback for these projects is getting stuck in the permitting phase for three to four years. A single project could end up with twenty pieces of paper.”
Any delays in development put increased pressure on a fund manager to exit investments within a fund’s prescribed life (see Investor Perspectives: Fund Structures and Power Project Development).
The decision to invest early may also be driven by opportunity cost, especially for fund managers with higher return targets and broader private equity mandates that include investing in other high-growth sectors. In this case, risk-forward greenfield or buy and build investment models are often more amenable to the fund’s investors. As Saurabh Agarwal of Warburg Pincus describes, “Our goal is to build durable businesses of scale, starting by pro-viding them with the resources to get them through the steep portion of the value creation curve. Once there’s a critical mass of projects within the pipeline—some in the development stage and some in construction—we can eventually seek to exit to a buyer who will partner with the company in its next phase of growth.” The US$201 million investment by a Warburg Pincus-led consortium in Brazil-based hydropower developer Omega Energia Renovavel demonstrates the thinking behind this growth-oriented greenfield model (see Exhibit 15).
EMPEA • 17
Investor Perspectives: Fund Structures and Power Project DevelopmentThe lifecycle of power assets is important to understand for any investor looking to get involved in EM power. The longevity of many power assets, in particular, calls attention to a key underlying question: is a fund structure the best way to invest in the sector? For greenfield investors in particular, the challenge of building and exiting an infrastructure asset within the parameters of a fund’s life, which is generally much shorter than 20 years, is immense. In this regard, the reality of the development process for power assets is an important consideration for institutional investors with shorter investment horizons. Commenting on this, Reyaz Ahmad, Chief Investment Officer and Head of IFC Catalyst Fund at IFC Asset Management Company, says, “Since the development risk of earlier stage investments can lead to long gestation periods, fund managers that focus on this stage in the development cycle of a project can prove challenging for an investor. As a fund of funds, some early development projects might have made sense for us earlier in our fund’s life, but it’s difficult to assess and time the probability of the managers returning capital to us.” While fund managers may face pressure to invest and exit, for some investors, selling assets may not even be appropriate given their desire to match long-term liabilities with equally long-term assets. A fund vehicle brings a familiar, approachable investment structure in which institutional investors are well versed. But the limitations of this structure are accentuated in a power context. Mounir Guen, CEO of global placement agent MVision Private Equity Advisers, highlights that the characteristics of operational power assets that make them attractive in the first place may lead LPs to consider alternatives to the traditional fund model: “The return profiles of real assets are very attractive. These are yield-producing, long-term assets. It’s a dream for pension plan sponsors, but ultimately, investors want to be able to hold these assets for 15, 20 or 25 years.” Some GPs have begun striking arrangements under which they “manage out” an asset on behalf of their LPs for a longer term beyond a fund’s life, but this model has not yet been widely adopted. In the end, assessing the likelihood, timing and even the desirability of an exit is important for any LP looking to gain exposure to this opportunity-laden asset class.
Investor Perspectives: How One Pension Fund Views Allocation CategoriesAllocation categories for institutional investors vary greatly. For some, EM power investing may fall within private equity, and, for others, it may be in be included in infrastructure, real estate, real assets or even a broader fixed-income grouping. According to an investment officer at one U.S. state pension fund, his insti-tution “views power investing as a real asset play, since the fund manager is buying and building an asset-based company.” For this investor, the risk and return characteristics of investing in power are commensurate with a real asset approach. Power in emerging markets, more specifically, helps them to try and reach overall returns goals: “We want investments in real assets to provide some inflation protection and current income. Since our pension fund assumes an earnings rate of about 8%, we’re trying
to reach that, but it’s a difficult level to hit. We are having to look elsewhere for opportunities—outside of the U.S. and outside of the traditional core-type infrastructure investments—that can earn more than 12% or 13% and can make up for that amount.” While this is just one example, understanding how this U.S. pen-sion fund classifies EM power investing sheds light on its role in broader institutional allocation strategies. Practically speaking, it is often challenging for a fund manager to find the right per-son to talk to in prospective LP organizations. The institutional investor community still appears far off from a consensus view that infrastructure, regardless of the development stage of the projects or platforms in question, can be seen as an asset class sui generis with its own characteristics and risk-return spectrum.
For other managers, especially those with an investment approach closer to traditional infrastructure, entering slightly later in the process means sacrificing return for greater assurance that a project is viable. Javier Chavarria, Senior Vice President at Partners Group, a global private markets investment manager active in infrastructure, states, “We focus on either brownfield or greenfield assets where most of the development work has been completed, the project is on the last stretch to reach financial close, it has permits and most of the legwork on the PPA and the financing is done. As infrastructure investors, we target lower returns than private equity on behalf of our clients. The only ways you can get private equity-type returns are by tak-ing more risks and investing much earlier in the development stage of the project.”
It may be tempting at this point to divide the power infrastructure market in two, with “build, commission and sell” growth capital private equity investments on one hand, and “buy and hold” infrastructure investments with fixed-income characteristics on the other. Yet overly-rigid investment buckets defined only by return objectives obscure the commonalities of these approaches (see Investor Perspectives: Allocation Categories). Ultimately, opportunities to invest in power exist along a continuum, with risk and return characteristics a func-tion of not only the relative maturity of the asset(s) in question, but also other return-en-hancing strategies undertaken by the fund manager, such as asset aggregation.
18 • SPECIAL REPORT: PRIVATE INVESTING IN THE POWER SECTOR IN EMERGING MARKETS
Fund Manager(s)
Asset/ Platform Name
Country/Region
Asset Description (Installed Capacity, Megawatts)
Year of Investment
Capital Invested (US$m) Exit Date(s) Exit and Return Detail
Morgan Stanley Infrastructure (MSI)
Continuum Wind Energy India Wind power development
platform (242MW) 2012 210 Pending Pending strategic sale to global renewable energy group SunEdison
ActisGlobeleq Mesoamerica Energy (GME)
Central America
Wind and solar power development platform (193MW) 2010 N/A Jun-15
Strategic sale of combined 100% stake by Actis and advisory firm Mesoamerica to global renewable energy group SunEdison
Tribeca Asset Management
Termocandelaria and Termobarranquilla (TEBSA)
Colombia Thermal power plants (314MW and 918MW, respectively) 2009, 2010 N/A May-15
Secondary sale of 100% of Termocandelaria and 57% of Termobarranquilla to SCL Energia Activa, Vince Business and International Currency; reported MOIC of 2.2x and IRR of 17%
CapAsia, IL&FS Investment Managers Malakoff Malaysia IPP with coal, oil and gas plants
(6,035MW) 2007, 2008 110 May-15IPO on Bursa Malaysia raising MYR2.7B (US$768m); Standard Charter IL&FS divested shares worth US$35m, CapAsia divestiture undisclosed
IDFC Alternatives Green Infra India Wind power development platform (516MW)
2008, 2009, 2011, 2013 158 Feb-15
Strategic sale of 60% to utility company Sembcorp for INR10.6B (US$170m); IDFC holds remaining 40% stake
African Frontier Capital Partners
ElectroMaxx (Uganda) Uganda Thermal power plant (90MW) N/A N/A Aug-14 Exit to undisclosed buyer
Darby Private Equity Bioenergy Geradora de Energia Brazil
Wind power-focused development platform (1,500MW)
2011 N/A May-14 Strategic sale to undisclosed buyer
Arqaam CapitalSalalah Independent Water and Power Project
Oman Natural gas-fired power plant (445MW) 2011 N/A Oct-13 IPO on Muscat Exchange raised OMR53m
(US$173m); Arqaam disposed of 1.9% stake
Nature Elements Capital
Chongqing Sanfeng Environmental Industry Group
China Waste to energy power development platform 2011 N/A May-13 Strategic sale of entire stake to holding company
Chongqing Water Group
Denham Capital Management GNPower Mariveles Philippines Coal-fired plant (600MW) 2007, 2010 N/A Dec-12 Strategic sale to holding company Ayala
Corporation for US$155m
SwicorpCreative Energy Resources (Uch Power)
Pakistan Natural gas-fired combined cycle power plant (585MW) 2008 100 Apr-12 Strategic sale to International Power; Swicorp
originally invested in development platform CER
Mantiq Investimentos Renova Energia Brazil Wind-focused development platform (42MW) 2006 N/A Jul-10 IPO on Brazil Stock Market raising BRL172m
(US$97m); no share disposal disclosed
Source: EMPEA. Data as of 9 September 2015.
Exhibit 17: Sampling of EM Private Fund Exits from Power Generation Assets, 2008-1H 2015
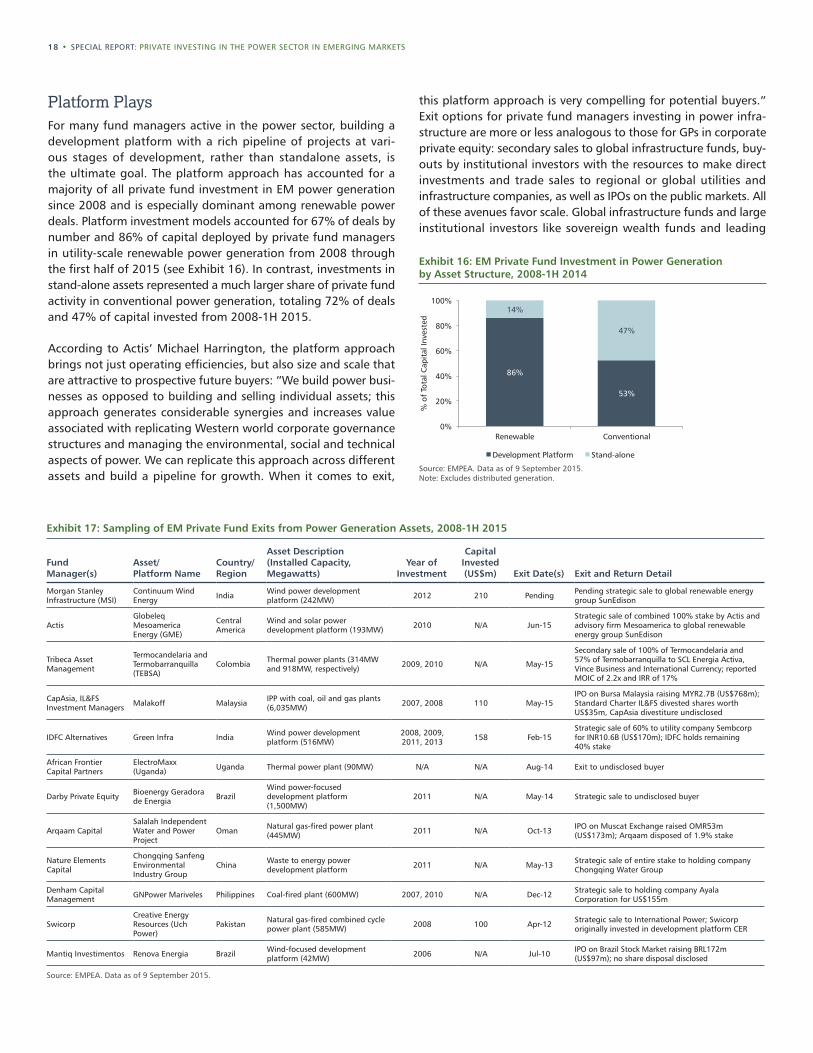
Platform PlaysFor many fund managers active in the power sector, building a development platform with a rich pipeline of projects at vari-ous stages of development, rather than standalone assets, is the ultimate goal. The platform approach has accounted for a majority of all private fund investment in EM power generation since 2008 and is especially dominant among renewable power deals. Platform investment models accounted for 67% of deals by number and 86% of capital deployed by private fund managers in utility-scale renewable power generation from 2008 through the first half of 2015 (see Exhibit 16). In contrast, investments in stand-alone assets represented a much larger share of private fund activity in conventional power generation, totaling 72% of deals and 47% of capital invested from 2008-1H 2015.
According to Actis’ Michael Harrington, the platform approach brings not just operating efficiencies, but also size and scale that are attractive to prospective future buyers: “We build power busi-nesses as opposed to building and selling individual assets; this approach generates considerable synergies and increases value associated with replicating Western world corporate governance structures and managing the environmental, social and technical aspects of power. We can replicate this approach across different assets and build a pipeline for growth. When it comes to exit,
this platform approach is very compelling for potential buyers.” Exit options for private fund managers investing in power infra-structure are more or less analogous to those for GPs in corporate private equity: secondary sales to global infrastructure funds, buy-outs by institutional investors with the resources to make direct investments and trade sales to regional or global utilities and infrastructure companies, as well as IPOs on the public markets. All of these avenues favor scale. Global infrastructure funds and large institutional investors like sovereign wealth funds and leading
Exhibit 16: EM Private Fund Investment in Power Generation by Asset Structure, 2008-1H 2014
Source: EMPEA. Data as of 9 September 2015.Note: Excludes distributed generation.
86%
53%
14%
47%
0%
20%
40%
60%
80%
100%
Renewable Conventional
% o
f To
tal C
apit
al In
vest
ed
Development Platform Stand-alone
EMPEA • 19
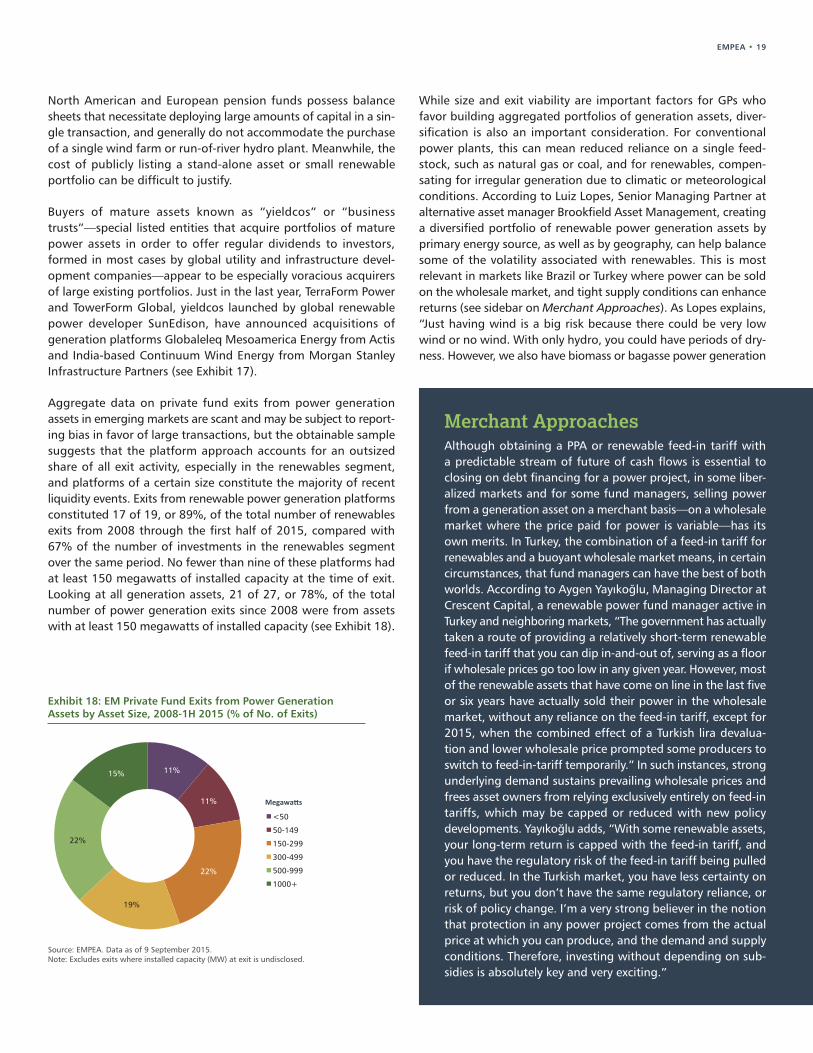
Exhibit 18: EM Private Fund Exits from Power Generation Assets by Asset Size, 2008-1H 2015 (% of No. of Exits)
Source: EMPEA. Data as of 9 September 2015.Note: Excludes exits where installed capacity (MW) at exit is undisclosed.
11%
11%
22%
19%
22%
15%
<50
50-149
150-299
300-499
500-999
1000+
Megawatts
North American and European pension funds possess balance sheets that necessitate deploying large amounts of capital in a sin-gle transaction, and generally do not accommodate the purchase of a single wind farm or run-of-river hydro plant. Meanwhile, the cost of publicly listing a stand-alone asset or small renewable portfolio can be difficult to justify.
Buyers of mature assets known as “yieldcos” or “business trusts”—special listed entities that acquire portfolios of mature power assets in order to offer regular dividends to investors, formed in most cases by global utility and infrastructure devel-opment companies—appear to be especially voracious acquirers of large existing portfolios. Just in the last year, TerraForm Power and TowerForm Global, yieldcos launched by global renewable power developer SunEdison, have announced acquisitions of generation platforms Globaleleq Mesoamerica Energy from Actis and India-based Continuum Wind Energy from Morgan Stanley Infrastructure Partners (see Exhibit 17).
Aggregate data on private fund exits from power generation assets in emerging markets are scant and may be subject to report-ing bias in favor of large transactions, but the obtainable sample suggests that the platform approach accounts for an outsized share of all exit activity, especially in the renewables segment, and platforms of a certain size constitute the majority of recent liquidity events. Exits from renewable power generation platforms constituted 17 of 19, or 89%, of the total number of renewables exits from 2008 through the first half of 2015, compared with 67% of the number of investments in the renewables segment over the same period. No fewer than nine of these platforms had at least 150 megawatts of installed capacity at the time of exit. Looking at all generation assets, 21 of 27, or 78%, of the total number of power generation exits since 2008 were from assets with at least 150 megawatts of installed capacity (see Exhibit 18).
While size and exit viability are important factors for GPs who favor building aggregated portfolios of generation assets, diver-sification is also an important consideration. For conventional power plants, this can mean reduced reliance on a single feed-stock, such as natural gas or coal, and for renewables, compen-sating for irregular generation due to climatic or meteorological conditions. According to Luiz Lopes, Senior Managing Partner at alternative asset manager Brookfield Asset Management, creating a diversified portfolio of renewable power generation assets by primary energy source, as well as by geography, can help balance some of the volatility associated with renewables. This is most relevant in markets like Brazil or Turkey where power can be sold on the wholesale market, and tight supply conditions can enhance returns (see sidebar on Merchant Approaches). As Lopes explains, “Just having wind is a big risk because there could be very low wind or no wind. With only hydro, you could have periods of dry-ness. However, we also have biomass or bagasse power generation
Merchant ApproachesAlthough obtaining a PPA or renewable feed-in tariff with a predictable stream of future of cash flows is essential to closing on debt financing for a power project, in some liber-alized markets and for some fund managers, selling power from a generation asset on a merchant basis—on a wholesale market where the price paid for power is variable—has its own merits. In Turkey, the combination of a feed-in tariff for renewables and a buoyant wholesale market means, in certain circumstances, that fund managers can have the best of both worlds. According to Aygen Yayıkoğlu, Managing Director at Crescent Capital, a renewable power fund manager active in Turkey and neighboring markets, “The government has actually taken a route of providing a relatively short-term renewable feed-in tariff that you can dip in-and-out of, serving as a floor if wholesale prices go too low in any given year. However, most of the renewable assets that have come on line in the last five or six years have actually sold their power in the wholesale market, without any reliance on the feed-in tariff, except for 2015, when the combined effect of a Turkish lira devalua-tion and lower wholesale price prompted some producers to switch to feed-in-tariff temporarily.” In such instances, strong underlying demand sustains prevailing wholesale prices and frees asset owners from relying exclusively entirely on feed-in tariffs, which may be capped or reduced with new policy developments. Yayıkoğlu adds, “With some renewable assets, your long-term return is capped with the feed-in tariff, and you have the regulatory risk of the feed-in tariff being pulled or reduced. In the Turkish market, you have less certainty on returns, but you don’t have the same regulatory reliance, or risk of policy change. I’m a very strong believer in the notion that protection in any power project comes from the actual price at which you can produce, and the demand and supply conditions. Therefore, investing without depending on sub-sidies is absolutely key and very exciting.”
20 • SPECIAL REPORT: PRIVATE INVESTING IN THE POWER SECTOR IN EMERGING MARKETS
Investor Perspectives: Co-InvestmentOne issue that any discussion of large-scale infra-structure investment inevitably turns to is that of co-investment. For LPs, co-investing rights can provide auxiliary opportunity to their initial fund commitment. From the GP side, co-investments can be particularly relevant for smaller funds that may want to engage in projects too large for their fund remit. According to Partners Group’s Javier Chavarria, “When assessing fund invest-ments, we also target co-investment opportuni-ties. Co-investing is a viable option, particularly in Latin America, because power-focused funds solely dedicated to the region are relatively small in size, which means their investments are also relatively small on a project level. When these smaller funds assess larger opportunities on their own, they appreciate the capital co-investments can bring to the deal.” While data on power co-in-vestments in emerging markets is scarce and it is difficult to glean far-reaching conclusions on the extent that co-investing occurs, it is clear that for many institutional investors, co-investments are front of mind.
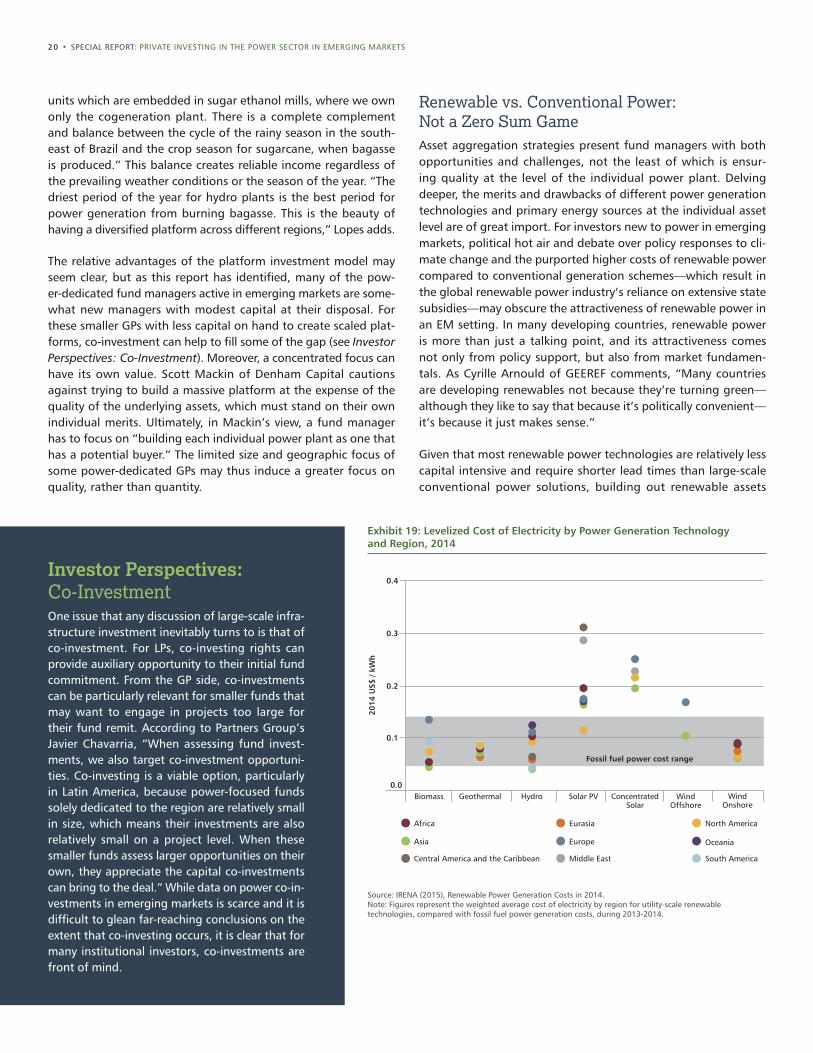
Exhibit 19: Levelized Cost of Electricity by Power Generation Technology and Region, 2014
Source: IRENA (2015), Renewable Power Generation Costs in 2014.Note: Figures represent the weighted average cost of electricity by region for utility-scale renewable technologies, compared with fossil fuel power generation costs, during 2013-2014.
Africa
Biomass Geothermal Hydro Solar PV Wind Offshore
ConcentratedSolar
Wind Onshore
0.3
Fossil fuel power cost range
Asia
Central America and the Caribbean
2014
US$
/ kW
h
Eurasia
Europe
Middle East
North America
Oceania
South America
0.4
0.2
0.1
0.0
units which are embedded in sugar ethanol mills, where we own only the cogeneration plant. There is a complete complement and balance between the cycle of the rainy season in the south-east of Brazil and the crop season for sugarcane, when bagasse is produced.” This balance creates reliable income regardless of the prevailing weather conditions or the season of the year. “The driest period of the year for hydro plants is the best period for power generation from burning bagasse. This is the beauty of having a diversified platform across different regions,” Lopes adds.
The relative advantages of the platform investment model may seem clear, but as this report has identified, many of the pow-er-dedicated fund managers active in emerging markets are some-what new managers with modest capital at their disposal. For these smaller GPs with less capital on hand to create scaled plat-forms, co-investment can help to fill some of the gap (see Investor Perspectives: Co-Investment). Moreover, a concentrated focus can have its own value. Scott Mackin of Denham Capital cautions against trying to build a massive platform at the expense of the quality of the underlying assets, which must stand on their own individual merits. Ultimately, in Mackin’s view, a fund manager has to focus on “building each individual power plant as one that has a potential buyer.” The limited size and geographic focus of some power-dedicated GPs may thus induce a greater focus on quality, rather than quantity.
Renewable vs. Conventional Power: Not a Zero Sum GameAsset aggregation strategies present fund managers with both opportunities and challenges, not the least of which is ensur-ing quality at the level of the individual power plant. Delving deeper, the merits and drawbacks of different power generation technologies and primary energy sources at the individual asset level are of great import. For investors new to power in emerging markets, political hot air and debate over policy responses to cli-mate change and the purported higher costs of renewable power compared to conventional generation schemes—which result in the global renewable power industry’s reliance on extensive state subsidies—may obscure the attractiveness of renewable power in an EM setting. In many developing countries, renewable power is more than just a talking point, and its attractiveness comes not only from policy support, but also from market fundamen-tals. As Cyrille Arnould of GEEREF comments, “Many countries are developing renewables not because they’re turning green—although they like to say that because it’s politically convenient—it’s because it just makes sense.”
Given that most renewable power technologies are relatively less capital intensive and require shorter lead times than large-scale conventional power solutions, building out renewable assets
EMPEA • 21
Distributed Generation in Emerging MarketsUtility-scale, grid-connected generation assets have accounted for the majority of private investment in EM power since 2008, but investors exploring the EM opportunity set should not overlook other means of producing power for consumers and businesses, especially in regions like Sub-Saharan Africa char-acterized by persistent gaps in grid connectivity. According to Matt Tilleard, co-Managing Partner at CrossBoundary, a frontier markets-focused advisory and energy investment firm, “Investing in power in Africa is not a monolithic opportunity. Without the burden of legacy infrastructure, Africa has become a laboratory for pioneering new methods of energy delivery.” Companies spe-cializing in distributed generation, like Kenya-based M-KOPA and Uganda-based SolarNow, exemplify the alternative approach of meeting demand for power in emerging markets at the point of use, rather than via centralized plants.
Private fund managers have completed 26 investments with dis-closed value of US$258 million in EM-focused companies specializing in distributed generation since 2008. Moreover, 20 of the 26 invest-ments in the segment supported companies focused on solar power, a technology particularly amenable to the distributed model, since it can be installed relatively quickly and at variable scale and does not
rely on access to feedstock like biomass or diesel—fuels that can be difficult or expensive to source in remote villages or industrial sites. Through its SolarAfrica platform, Tilleard’s CrossBoundary “finances solar installations for large commercial and industrial customers, so they can purchase power directly from panels on their own roofs,” providing companies with a rapidly deployable, modular electricity solution that can provide cleaner, cheaper power and reduce reliance on diesel-powered backup generators.
Deal activity in EM distributed generation, particularly rooftop solar, likely will grow as large developed markets-based specialists expand internationally and look to partner with or acquire local businesses. SolarCity, the United States market leader, announced the acquisi-tion of Mexico-based solar developer ILIOSS, its first international foray, in August of 2015. Global private fund managers have also taken notice of the EM opportunity. According to Saurabh Agarwal of Warburg Pincus, “Internationally, we are looking more closely at the rooftop solar space, which has done well in North America, mainly driven by government subsidies and investment tax credits. Given that the cost of solar panels is declining and the spot price of power has been very high in most emerging markets, rooftop solar power is a potentially interesting opportunity.”
allows private fund managers to make an impact on the power supply situation quickly and shorten the time horizon from entry to exit. Conventional assets, on the other hand, can take many years to develop, and fuel supply issues can create additional uncertainty. As Krishna Kumar of IL&FS Investment Managers illus-trates, “There are multiple levels of approvals, permissions and consents required for developing a greenfield thermal project. Even in case of an operating power plant under a long-term PPA, you would still need to ensure that there is a regular fuel sup-ply arrangement in place. This scenario is witnessing a marked improvement with the government focused on making fuel sup-ply available on a regular basis.” Many renewable technologies, in contrast, rely only on the natural potential of the project site. For solar power in particular, many emerging economies in Latin America, Africa and the Middle East possess extremely favorable climatic conditions.
Supply and demand dynamics, as well as natural environments, play a large role in the appeal of EM renewable power, but so too does the evolving cost picture for these technologies (see Exhibit 19). While hydroelectric, geothermal and biomass power have long been cost competitive, recent reductions in the price of wind and, most critically, solar, mean the industry is moving closer to the day when renewable subsidies and feed-in tariffs are no longer needed. Armstrong’s Andrew Affleck attests, “The cost
for renewables continues to drop, moving us closer to the point of grid parity, what many consider the Holy Grail for renewables. I’m most excited about the potential for renewables to compete with conventional fuel sources on a wider scale.” The decreasing price of solar power also means it can be effectively deployed on a smaller scale and even in distributed generation setups, where it compares favorably with diesel generators, which are powered by expensive fuel (see sidebar on Distributed Generation).
The recent buzz around renewables does not mean that fund managers are ignoring conventional generation assets, which have accounted for nearly half of capital deployed by private fund managers in utility-scale power generation since 2008. Indeed, coal and natural gas still enjoy economies of scale, and many emerging markets have extensive reserves of fossil fuels. Provided governments and private investors are able to build the extensive midstream infrastructure necessary to supply conventional power plants—including pipelines, ports and storage facilities—tradi-tional power technologies may play a leading role by virtue of their scale and lingering cost advantages. All of this implies the future energy mix in emerging markets is likely to be diverse, with many different technologies employed in the quest to address the overriding need for power.
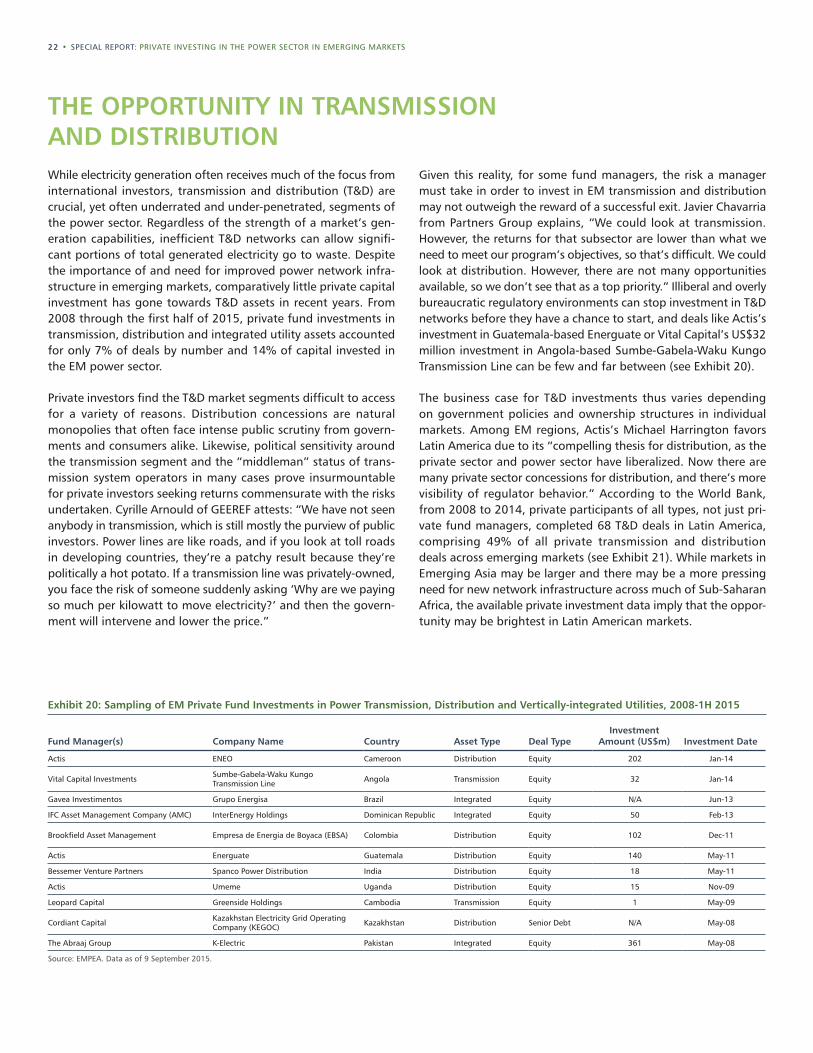
22 • SPECIAL REPORT: PRIVATE INVESTING IN THE POWER SECTOR IN EMERGING MARKETS
Fund Manager(s) Company Name Country Asset Type Deal TypeInvestment
Amount (US$m) Investment Date
Actis ENEO Cameroon Distribution Equity 202 Jan-14
Vital Capital Investments Sumbe-Gabela-Waku Kungo Transmission Line Angola Transmission Equity 32 Jan-14
Gavea Investimentos Grupo Energisa Brazil Integrated Equity N/A Jun-13
IFC Asset Management Company (AMC) InterEnergy Holdings Dominican Republic Integrated Equity 50 Feb-13
Brookfield Asset Management Empresa de Energia de Boyaca (EBSA) Colombia Distribution Equity 102 Dec-11
Actis Energuate Guatemala Distribution Equity 140 May-11
Bessemer Venture Partners Spanco Power Distribution India Distribution Equity 18 May-11
Actis Umeme Uganda Distribution Equity 15 Nov-09
Leopard Capital Greenside Holdings Cambodia Transmission Equity 1 May-09
Cordiant Capital Kazakhstan Electricity Grid Operating Company (KEGOC) Kazakhstan Distribution Senior Debt N/A May-08
The Abraaj Group K-Electric Pakistan Integrated Equity 361 May-08
Source: EMPEA. Data as of 9 September 2015.
Exhibit 20: Sampling of EM Private Fund Investments in Power Transmission, Distribution and Vertically-integrated Utilities, 2008-1H 2015
THE OPPORTUNITY IN TRANSMISSION AND DISTRIBUTIONWhile electricity generation often receives much of the focus from international investors, transmission and distribution (T&D) are crucial, yet often underrated and under-penetrated, segments of the power sector. Regardless of the strength of a market’s gen-eration capabilities, inefficient T&D networks can allow signifi-cant portions of total generated electricity go to waste. Despite the importance of and need for improved power network infra-structure in emerging markets, comparatively little private capital investment has gone towards T&D assets in recent years. From 2008 through the first half of 2015, private fund investments in transmission, distribution and integrated utility assets accounted for only 7% of deals by number and 14% of capital invested in the EM power sector.
Private investors find the T&D market segments difficult to access for a variety of reasons. Distribution concessions are natural monopolies that often face intense public scrutiny from govern-ments and consumers alike. Likewise, political sensitivity around the transmission segment and the “middleman” status of trans-mission system operators in many cases prove insurmountable for private investors seeking returns commensurate with the risks undertaken. Cyrille Arnould of GEEREF attests: “We have not seen anybody in transmission, which is still mostly the purview of public investors. Power lines are like roads, and if you look at toll roads in developing countries, they’re a patchy result because they’re politically a hot potato. If a transmission line was privately-owned, you face the risk of someone suddenly asking ‘Why are we paying so much per kilowatt to move electricity?’ and then the govern-ment will intervene and lower the price.”
Given this reality, for some fund managers, the risk a manager must take in order to invest in EM transmission and distribution may not outweigh the reward of a successful exit. Javier Chavarria from Partners Group explains, “We could look at transmission. However, the returns for that subsector are lower than what we need to meet our program’s objectives, so that’s difficult. We could look at distribution. However, there are not many opportunities available, so we don’t see that as a top priority.” Illiberal and overly bureaucratic regulatory environments can stop investment in T&D networks before they have a chance to start, and deals like Actis’s investment in Guatemala-based Energuate or Vital Capital’s US$32 million investment in Angola-based Sumbe-Gabela-Waku Kungo Transmission Line can be few and far between (see Exhibit 20).
The business case for T&D investments thus varies depending on government policies and ownership structures in individual markets. Among EM regions, Actis’s Michael Harrington favors Latin America due to its “compelling thesis for distribution, as the private sector and power sector have liberalized. Now there are many private sector concessions for distribution, and there’s more visibility of regulator behavior.” According to the World Bank, from 2008 to 2014, private participants of all types, not just pri-vate fund managers, completed 68 T&D deals in Latin America, comprising 49% of all private transmission and distribution deals across emerging markets (see Exhibit 21). While markets in Emerging Asia may be larger and there may be a more pressing need for new network infrastructure across much of Sub-Saharan Africa, the available private investment data imply that the oppor-tunity may be brightest in Latin American markets.
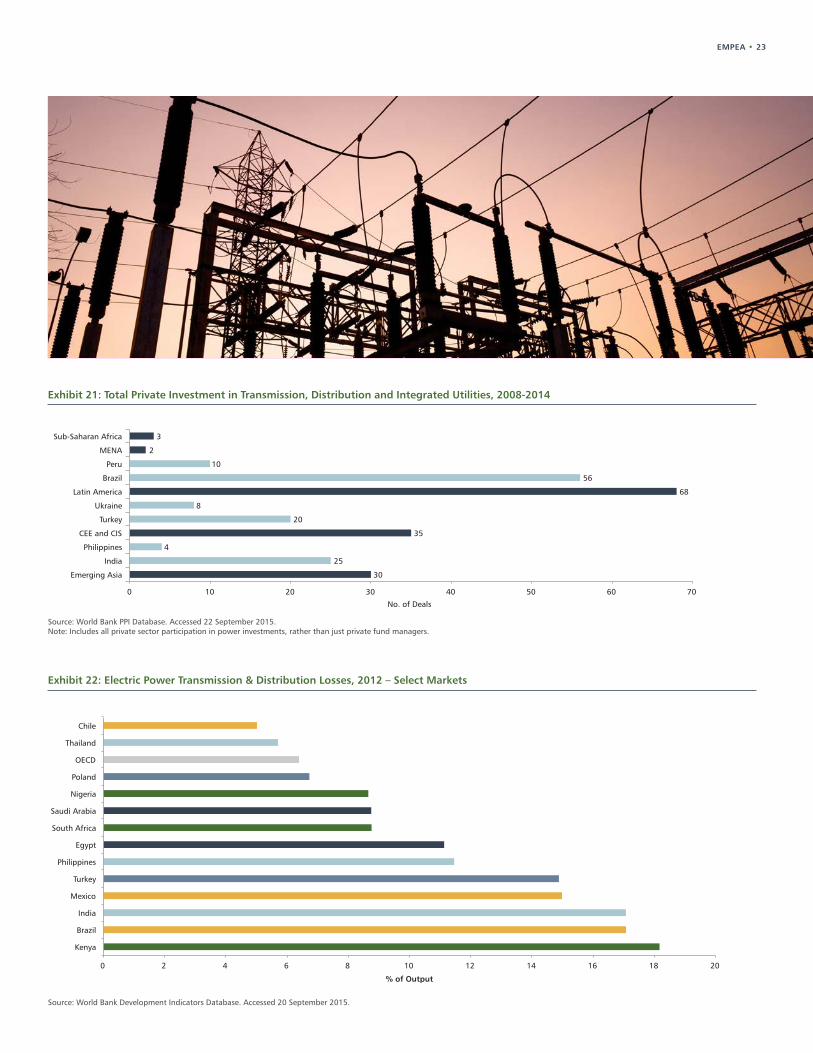
EMPEA • 23
Exhibit 21: Total Private Investment in Transmission, Distribution and Integrated Utilities, 2008-2014
Source: World Bank PPI Database. Accessed 22 September 2015.Note: Includes all private sector participation in power investments, rather than just private fund managers.
30
25
4
35
20
8
68
56
10
2
3
0 10 20 30 40 50 60 70
Emerging Asia
India
Philippines
CEE and CIS
Turkey
Ukraine
Latin America
Brazil
Peru
MENA
Sub-Saharan Africa
No. of Deals
Exhibit 22: Electric Power Transmission & Distribution Losses, 2012 – Select Markets
Source: World Bank Development Indicators Database. Accessed 20 September 2015.
0 2 4 6 8 10 12 14 16 18 20
Kenya
Brazil
India
Mexico
Turkey
Philippines
Egypt
South Africa
Saudi Arabia
Nigeria
Poland
OECD
Thailand
Chile
% of Output
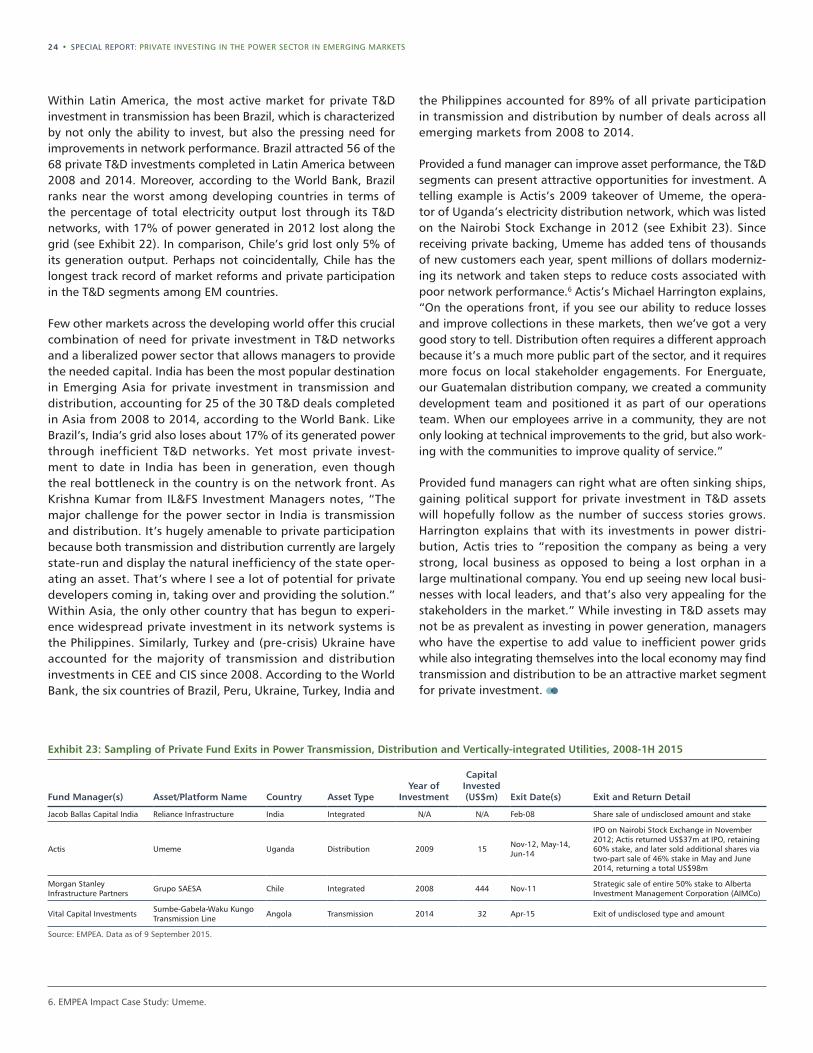
24 • SPECIAL REPORT: PRIVATE INVESTING IN THE POWER SECTOR IN EMERGING MARKETS
Fund Manager(s) Asset/Platform Name Country Asset TypeYear of
Investment
Capital Invested (US$m) Exit Date(s) Exit and Return Detail
Jacob Ballas Capital India Reliance Infrastructure India Integrated N/A N/A Feb-08 Share sale of undisclosed amount and stake
Actis Umeme Uganda Distribution 2009 15 Nov-12, May-14, Jun-14
IPO on Nairobi Stock Exchange in November 2012; Actis returned US$37m at IPO, retaining 60% stake, and later sold additional shares via two-part sale of 46% stake in May and June 2014, returning a total US$98m
Morgan Stanley Infrastructure Partners Grupo SAESA Chile Integrated 2008 444 Nov-11 Strategic sale of entire 50% stake to Alberta
Investment Management Corporation (AIMCo)
Vital Capital Investments Sumbe-Gabela-Waku Kungo Transmission Line Angola Transmission 2014 32 Apr-15 Exit of undisclosed type and amount
Source: EMPEA. Data as of 9 September 2015.
Exhibit 23: Sampling of Private Fund Exits in Power Transmission, Distribution and Vertically-integrated Utilities, 2008-1H 2015
6. EMPEA Impact Case Study: Umeme.
Within Latin America, the most active market for private T&D investment in transmission has been Brazil, which is characterized by not only the ability to invest, but also the pressing need for improvements in network performance. Brazil attracted 56 of the 68 private T&D investments completed in Latin America between 2008 and 2014. Moreover, according to the World Bank, Brazil ranks near the worst among developing countries in terms of the percentage of total electricity output lost through its T&D networks, with 17% of power generated in 2012 lost along the grid (see Exhibit 22). In comparison, Chile’s grid lost only 5% of its generation output. Perhaps not coincidentally, Chile has the longest track record of market reforms and private participation in the T&D segments among EM countries.
Few other markets across the developing world offer this crucial combination of need for private investment in T&D networks and a liberalized power sector that allows managers to provide the needed capital. India has been the most popular destination in Emerging Asia for private investment in transmission and distribution, accounting for 25 of the 30 T&D deals completed in Asia from 2008 to 2014, according to the World Bank. Like Brazil’s, India’s grid also loses about 17% of its generated power through inefficient T&D networks. Yet most private invest-ment to date in India has been in generation, even though the real bottleneck in the country is on the network front. As Krishna Kumar from IL&FS Investment Managers notes, “The major challenge for the power sector in India is transmission and distribution. It’s hugely amenable to private participation because both transmission and distribution currently are largely state-run and display the natural inefficiency of the state oper-ating an asset. That’s where I see a lot of potential for private developers coming in, taking over and providing the solution.” Within Asia, the only other country that has begun to experi-ence widespread private investment in its network systems is the Philippines. Similarly, Turkey and (pre-crisis) Ukraine have accounted for the majority of transmission and distribution investments in CEE and CIS since 2008. According to the World Bank, the six countries of Brazil, Peru, Ukraine, Turkey, India and
the Philippines accounted for 89% of all private participation in transmission and distribution by number of deals across all emerging markets from 2008 to 2014.
Provided a fund manager can improve asset performance, the T&D segments can present attractive opportunities for investment. A telling example is Actis’s 2009 takeover of Umeme, the opera-tor of Uganda’s electricity distribution network, which was listed on the Nairobi Stock Exchange in 2012 (see Exhibit 23). Since receiving private backing, Umeme has added tens of thousands of new customers each year, spent millions of dollars moderniz-ing its network and taken steps to reduce costs associated with poor network performance.6 Actis’s Michael Harrington explains, “On the operations front, if you see our ability to reduce losses and improve collections in these markets, then we’ve got a very good story to tell. Distribution often requires a different approach because it’s a much more public part of the sector, and it requires more focus on local stakeholder engagements. For Energuate, our Guatemalan distribution company, we created a community development team and positioned it as part of our operations team. When our employees arrive in a community, they are not only looking at technical improvements to the grid, but also work-ing with the communities to improve quality of service.”
Provided fund managers can right what are often sinking ships, gaining political support for private investment in T&D assets will hopefully follow as the number of success stories grows. Harrington explains that with its investments in power distri-bution, Actis tries to “reposition the company as being a very strong, local business as opposed to being a lost orphan in a large multinational company. You end up seeing new local busi-nesses with local leaders, and that’s also very appealing for the stakeholders in the market.” While investing in T&D assets may not be as prevalent as investing in power generation, managers who have the expertise to add value to inefficient power grids while also integrating themselves into the local economy may find transmission and distribution to be an attractive market segment for private investment.
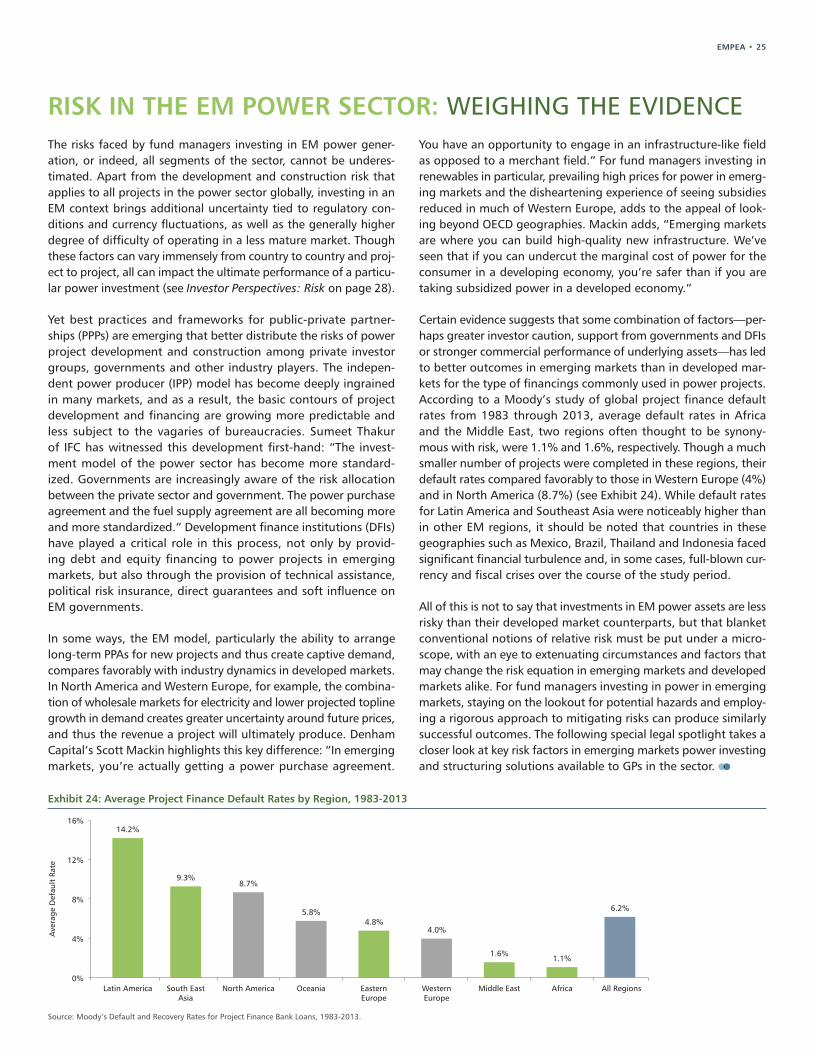
EMPEA • 25
Exhibit 24: Average Project Finance Default Rates by Region, 1983-2013
Source: Moody’s Default and Recovery Rates for Project Finance Bank Loans, 1983-2013.
14.2%
9.3% 8.7%
5.8% 4.8%
4.0%
1.6% 1.1%
6.2%
0%
4%
8%
12%
16%
Latin America South East Asia
North America Oceania Eastern Europe
Western Europe
Middle East Africa All Regions
Ave
rage
Def
ault
Rat
e
RISK IN THE EM POWER SECTOR: WEIGHING THE EVIDENCEThe risks faced by fund managers investing in EM power gener-ation, or indeed, all segments of the sector, cannot be underes-timated. Apart from the development and construction risk that applies to all projects in the power sector globally, investing in an EM context brings additional uncertainty tied to regulatory con-ditions and currency fluctuations, as well as the generally higher degree of difficulty of operating in a less mature market. Though these factors can vary immensely from country to country and proj-ect to project, all can impact the ultimate performance of a particu-lar power investment (see Investor Perspectives: Risk on page 28).
Yet best practices and frameworks for public-private partner-ships (PPPs) are emerging that better distribute the risks of power project development and construction among private investor groups, governments and other industry players. The indepen-dent power producer (IPP) model has become deeply ingrained in many markets, and as a result, the basic contours of project development and financing are growing more predictable and less subject to the vagaries of bureaucracies. Sumeet Thakur of IFC has witnessed this development first-hand: “The invest-ment model of the power sector has become more standard-ized. Governments are increasingly aware of the risk allocation between the private sector and government. The power purchase agreement and the fuel supply agreement are all becoming more and more standardized.” Development finance institutions (DFIs) have played a critical role in this process, not only by provid-ing debt and equity financing to power projects in emerging markets, but also through the provision of technical assistance, political risk insurance, direct guarantees and soft influence on EM governments.
In some ways, the EM model, particularly the ability to arrange long-term PPAs for new projects and thus create captive demand, compares favorably with industry dynamics in developed markets. In North America and Western Europe, for example, the combina-tion of wholesale markets for electricity and lower projected topline growth in demand creates greater uncertainty around future prices, and thus the revenue a project will ultimately produce. Denham Capital’s Scott Mackin highlights this key difference: “In emerging markets, you’re actually getting a power purchase agreement.
You have an opportunity to engage in an infrastructure-like field as opposed to a merchant field.” For fund managers investing in renewables in particular, prevailing high prices for power in emerg-ing markets and the disheartening experience of seeing subsidies reduced in much of Western Europe, adds to the appeal of look-ing beyond OECD geographies. Mackin adds, “Emerging markets are where you can build high-quality new infrastructure. We’ve seen that if you can undercut the marginal cost of power for the consumer in a developing economy, you’re safer than if you are taking subsidized power in a developed economy.”
Certain evidence suggests that some combination of factors—per-haps greater investor caution, support from governments and DFIs or stronger commercial performance of underlying assets—has led to better outcomes in emerging markets than in developed mar-kets for the type of financings commonly used in power projects. According to a Moody’s study of global project finance default rates from 1983 through 2013, average default rates in Africa and the Middle East, two regions often thought to be synony-mous with risk, were 1.1% and 1.6%, respectively. Though a much smaller number of projects were completed in these regions, their default rates compared favorably to those in Western Europe (4%) and in North America (8.7%) (see Exhibit 24). While default rates for Latin America and Southeast Asia were noticeably higher than in other EM regions, it should be noted that countries in these geographies such as Mexico, Brazil, Thailand and Indonesia faced significant financial turbulence and, in some cases, full-blown cur-rency and fiscal crises over the course of the study period.
All of this is not to say that investments in EM power assets are less risky than their developed market counterparts, but that blanket conventional notions of relative risk must be put under a micro-scope, with an eye to extenuating circumstances and factors that may change the risk equation in emerging markets and developed markets alike. For fund managers investing in power in emerging markets, staying on the lookout for potential hazards and employ-ing a rigorous approach to mitigating risks can produce similarly successful outcomes. The following special legal spotlight takes a closer look at key risk factors in emerging markets power investing and structuring solutions available to GPs in the sector.
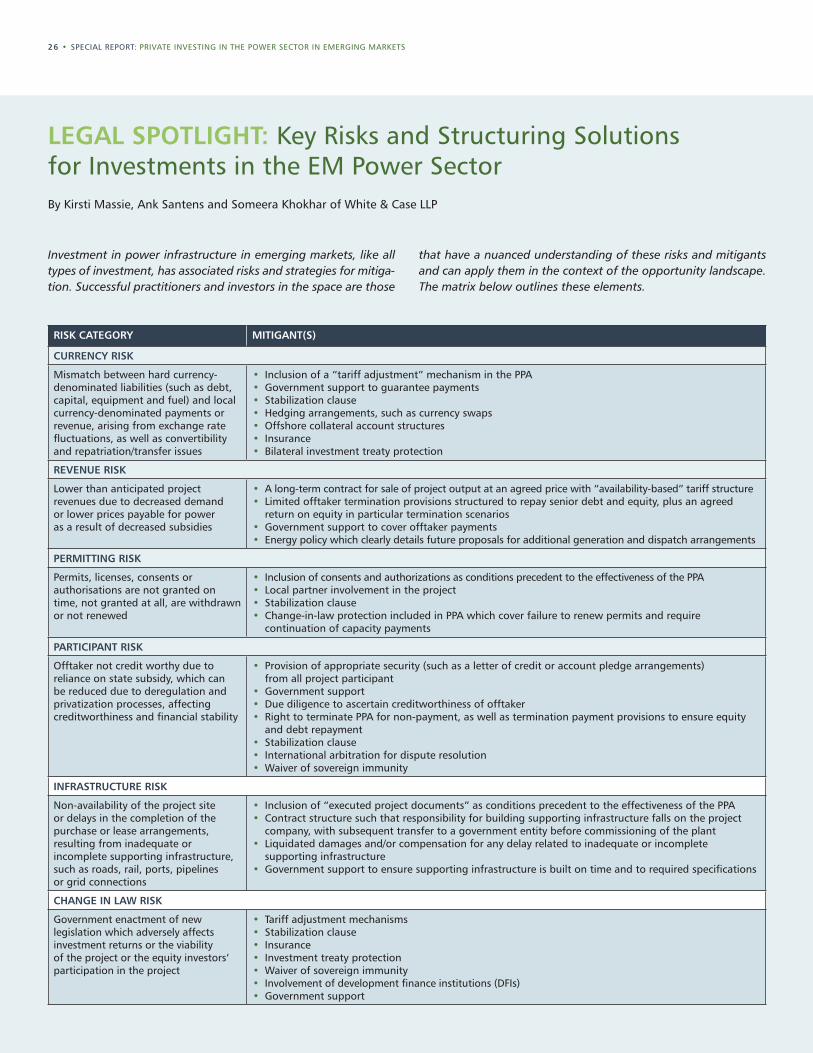
26 • SPECIAL REPORT: PRIVATE INVESTING IN THE POWER SECTOR IN EMERGING MARKETS
LEGAL SPOTLIGHT: Key Risks and Structuring Solutions for Investments in the EM Power SectorBy Kirsti Massie, Ank Santens and Someera Khokhar of White & Case LLP
RISK CATEGORY MITIGANT(S)
CURRENCY RISK
Mismatch between hard currency-denominated liabilities (such as debt, capital, equipment and fuel) and local currency-denominated payments or revenue, arising from exchange rate fluctuations, as well as convertibility and repatriation/transfer issues
• Inclusion of a “tariff adjustment” mechanism in the PPA • Government support to guarantee payments• Stabilization clause• Hedging arrangements, such as currency swaps• Offshore collateral account structures• Insurance• Bilateral investment treaty protection
REVENUE RISK
Lower than anticipated project revenues due to decreased demand or lower prices payable for power as a result of decreased subsidies
• A long-term contract for sale of project output at an agreed price with “availability-based” tariff structure • Limited offtaker termination provisions structured to repay senior debt and equity, plus an agreed
return on equity in particular termination scenarios• Government support to cover offtaker payments• Energy policy which clearly details future proposals for additional generation and dispatch arrangements
PERMITTING RISK
Permits, licenses, consents or authorisations are not granted on time, not granted at all, are withdrawn or not renewed
• Inclusion of consents and authorizations as conditions precedent to the effectiveness of the PPA• Local partner involvement in the project• Stabilization clause• Change-in-law protection included in PPA which cover failure to renew permits and require
continuation of capacity payments
PARTICIPANT RISK
Offtaker not credit worthy due to reliance on state subsidy, which can be reduced due to deregulation and privatization processes, affecting creditworthiness and financial stability
• Provision of appropriate security (such as a letter of credit or account pledge arrangements) from all project participant
• Government support• Due diligence to ascertain creditworthiness of offtaker• Right to terminate PPA for non-payment, as well as termination payment provisions to ensure equity
and debt repayment• Stabilization clause• International arbitration for dispute resolution• Waiver of sovereign immunity
INFRASTRUCTURE RISK
Non-availability of the project site or delays in the completion of the purchase or lease arrangements, resulting from inadequate or incomplete supporting infrastructure, such as roads, rail, ports, pipelines or grid connections
• Inclusion of “executed project documents” as conditions precedent to the effectiveness of the PPA• Contract structure such that responsibility for building supporting infrastructure falls on the project
company, with subsequent transfer to a government entity before commissioning of the plant• Liquidated damages and/or compensation for any delay related to inadequate or incomplete
supporting infrastructure• Government support to ensure supporting infrastructure is built on time and to required specifications
CHANGE IN LAW RISK
Government enactment of new legislation which adversely affects investment returns or the viability of the project or the equity investors’ participation in the project
• Tariff adjustment mechanisms• Stabilization clause• Insurance• Investment treaty protection• Waiver of sovereign immunity• Involvement of development finance institutions (DFIs)• Government support
Investment in power infrastructure in emerging markets, like all types of investment, has associated risks and strategies for mitiga-tion. Successful practitioners and investors in the space are those
that have a nuanced understanding of these risks and mitigants and can apply them in the context of the opportunity landscape. The matrix below outlines these elements.
EMPEA • 27
Key terms explained:• “Government support” can take many forms ranging from soft support (such as a comfort letter) to more binding arrangements, typically contained in a concession-type agreement.• “Stabilization clause” is a reference to contractual provisions that seek to protect and maintain the legal environment and regime that was in place at the time a contract enters into force and that
trigger government compensation obligations in the event the legal environment changes.• “Insurance” can be provided by public institutions or DFIs (such as MIGA, IFC or the World Bank) or by private sources. While insurance may cover currency repatriation and convertibility risks,
it will not typically cover exchange rate fluctuations or currency.
The Importance of International Arbitration and Investment TreatiesInternational arbitration is a binding form of alternative dispute resolution, and the preferred method for resolving international commercial and investment disputes, particularly in the emerging markets power sector. Arbitration is often favored because it is perceived as more neutral than litigation in local courts, which may favor local companies or the host state; parties generally are the ones who select the arbitrators, which can ensure decision makers have the necessary expertise; and it is generally private, and the parties can also agree to make it confidential.
However, because international arbitration is based on party con-sent, the parties must have agreed to arbitrate, typically in an arbitration clause in a contract between the parties.
Alternatively, an investor also may be able to arbitrate against a host state based upon an arbitration clause in an international investment agreement. International investment agreements are agreements between two or more states for the reciprocal promotion and protection of certain foreign investments and investors. International investment agreements exist in three pri-mary forms: bilateral investment treaties (BITs) concluded between two states, which are the most common international investment agreements; multilateral investment treaties (MITs); and free trade agreements (FTAs) containing investment protection provisions.
Strategic ConsiderationsIn choosing arbitration rules to be included in a contract or conces-sion agreement, parties have a choice between institutional arbitra-tion (under an administrative body) and ad hoc arbitration (where there is no administrative body). While ad hoc arbitration can work well, administered arbitration is generally recommended in relation to power projects in emerging markets, where there is a risk that the local party may not cooperate in the arbitration. One promi-nent institution for resolving international investment disputes is
the International Centre for Settlement of Investment Disputes (ICSID), which is the arbitration arm of The World Bank based in Washington, DC and established under a multilateral treaty ratified by 151 states. Another body, the International Court of Arbitration of the International Chamber of Commerce (ICC) in Paris, France, is the most preferred and widely-used institution for international commercial arbitration (including where a state or state entity is a party) according to a survey of 136 corporate counsel undertaken by White & Case and Queen Mary College.
One major concern when investing in the power sector in emerg-ing markets is that the courts of the host state may not be neu-tral or may be hostile to arbitration. The best method to guard against the risk of a state obstructing the results of international arbitration through local courts is to seat the arbitration offshore or pursue arbitration under the rules of ICSID, which operates outside the realm of domestic courts.
International investment agreements protect only certain “invest-ments” of certain “investors.” Before any dispute arises, the inves-tor thus should structure its investment so as to ensure that it will benefit from the protections of at least one international invest-ment agreement.
Experience of Private Equity Firms in International Investment ArbitrationPrivate investment funds active in emerging markets have been able to benefit from international investment arbitration. In AIG Capital Partners Inc. v. Kazakhstan, for example, Kazakhstan’s political sub-divisions expropriated an AIG private equity fund’s investments in a real estate development project. The investors commenced ICSID arbitration pursuant to the US-Kazakhstan BIT, and the ICSID tribunal awarded them US$9.9 million. In Rurelec v. Bolivia, Bolivia similarly expropriated a British company’s private equity investment in a power generation company. The investor commenced an ad hoc arbitration pursuant to the US-Bolivia BIT and UK-Bolivia BIT, and the tribunal ultimately awarded it US$35.5 million.
RISK CATEGORY MITIGANT(S)
COUNTRY/POLITICAL RISK
Arbitrary cancellation of licenses and concessions, expropriation and nationalization or change in government support and subsidies resulting from political developments or regime change
• Investment treaty protection and international arbitration• Insurance• Stabilization clause• Government support• Involvement of DFIs
CORRUPTION RISK
Bribery or corruption risk in respect of project
• Transparency• Involvement of DFIs• Robust internal systems on the part of investors
28 • SPECIAL REPORT: PRIVATE INVESTING IN THE POWER SECTOR IN EMERGING MARKETS
Investor Perspectives: Risk
Underlying Market and Regulatory ConditionsMarket conditions set the stage for what can be either an exciting risk-adjusted investment opportunity or one that is weighted too heavily either by high risk or unsatisfactory returns. According to Reyaz Ahmad of IFC Asset Management Company’s IFC Catalyst Fund, the skill sets, experience and chosen strategy of a fund team must be placed in the context of the regulatory conditions prevailing in the manager’s target markets. Ahmad notes, “There are some countries where the regulatory system is relatively uncertain. Those regimes are potentially attractive if the returns are commensurate with the risks that you’re taking.” On the other hand, in certain mar-kets, regulations and the investment model are so well devel-oped that competition for assets rises and may influence the level of returns on offer. Ahmad adds that, “The other extreme is a country like South Africa, where the regulatory system and the entire structure of the field are tried and tested. They are in the fourth round of bidding for renewable projects, and prices have been bid down to an extent. The regulatory infrastructure is so well-accepted and understood, and the financing is so well lined up that the equity returns are actu-ally less attractive.” Underlying market conditions thus require a balancing act on the part of investors: too risky, and real investment opportunities may be scarce; too safe, and the return profile is no longer attractive.
CurrencyFor investors based in the European Union and North America with experience investing in emerging markets, currency risk is not a new concept. Although investments in power assets are structured to ensure a high degree of certainty regarding the revenue a project will ultimately create, in many emerging markets, these contracts are denominated in local currency. This can create challenges for institutional investors whose liabilities are in dollars. As one U.S.-based public pension officer explains: “Power investments often bring on currency exposure, and a lot of this exposure hasn’t necessarily been favorable. All of our liabilities, of course, are denominated in U.S. dollars, so we view the world in dollar terms.” Public pen-sion funds are not alone in worrying about foreign currency risk. Javier Chavarria of Partners Group, adds, “As dollar or euro investors, we need to make returns in those currencies
on behalf of our clients. Brazil, for example, is a local currency market with contracts done in reais, so currency movements can make that very difficult.” Moreover, excessive currency volatility can also feed back into counter-party risk—that is, the risk that the buyer or offtaker of power from a genera-tion project may not fulfill the terms of the power purchase agreement (PPA). Chavarria explains, “If you have a PPA signed with a government-sponsored entity or a local subsidiary of a large industrial corporation, you may benefit from the credit rating or credit risk of such government or parent company.”
Communicating RiskThe risk-return proposition for LPs investing in power infra-structure is influenced by many factors, and unpacking poten-tial risks for investors can be helpful in accurately assessing various portfolio exposures. According to Mounir Guen of MVision Private Equity Advisers, especially in a sensitive sec-tor like power, LPs will ultimately back fund managers who provide transparency into underlying risks. Guen explains: “In an environment where governance, transparency and com-munication are essential, the ability for a fund manager to convey risks to LPs is very important. If you can show me how I can understand the risk to my money, and I can see that you have governance in place to manage or mitigate those risks, then I’ll take the risk.” This risk-return proposition is already quite familiar to any GP operating in emerging markets, as factors like political risk can be major deterrents to LPs. For traditional private equity, many LPs thus expect a “return-pre-mium” from their EM private equity portfolios, and this is no different for power investments. According to one U.S.-based public pension fund investment officer, “We always think in a risk-adjusted framework; I should get a higher rate of return in EM power than developed markets power, or it doesn’t make sense to pursue.” For GPs, finding and pre-senting investible opportunities that mitigate risk can go a long way in securing commitments. The public pension fund employee confirms this, saying that, “If fund managers are able to mitigate a lot of the risks, then they do a pretty effec-tive job in our estimation. While there is some diversification benefit from power investing from a portfolio standpoint, a big part of making the capital commitment comes from the risk mitigation.” To GPs, presenting a fund opportunity in risk-adjusted and transparent terms can play an important role in facilitating commitments.
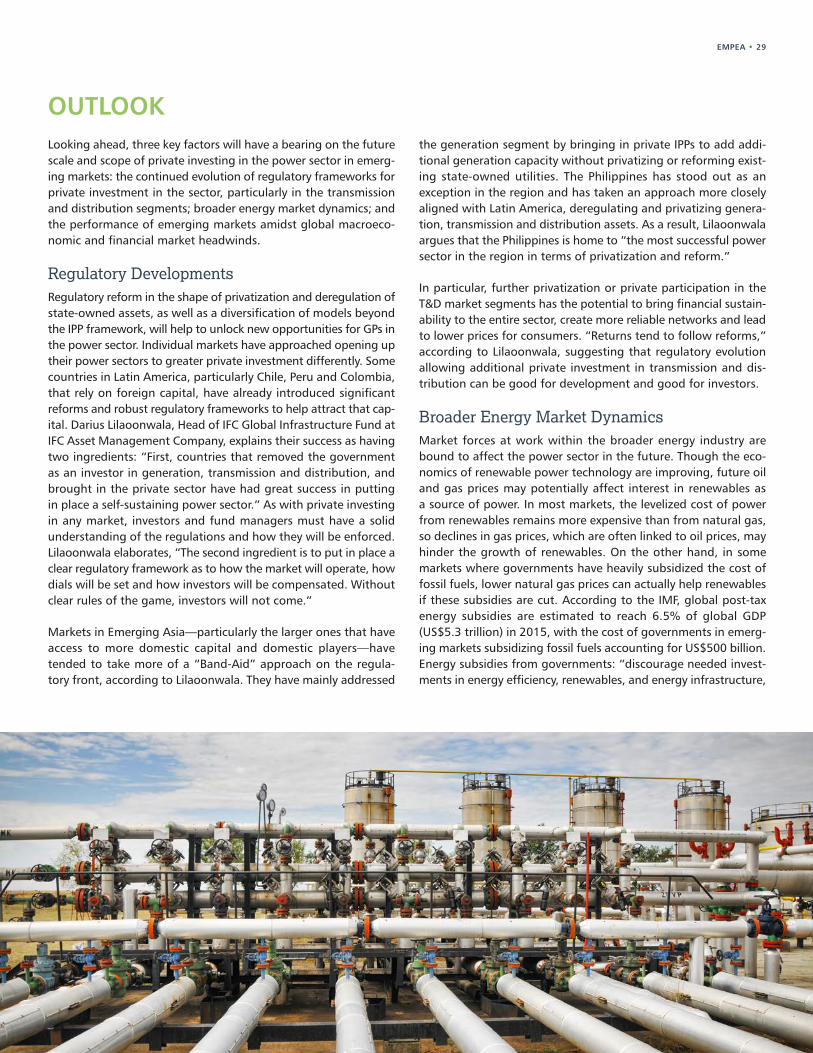
EMPEA • 29
OUTLOOKLooking ahead, three key factors will have a bearing on the future scale and scope of private investing in the power sector in emerg-ing markets: the continued evolution of regulatory frameworks for private investment in the sector, particularly in the transmission and distribution segments; broader energy market dynamics; and the performance of emerging markets amidst global macroeco-nomic and financial market headwinds.
Regulatory DevelopmentsRegulatory reform in the shape of privatization and deregulation of state-owned assets, as well as a diversification of models beyond the IPP framework, will help to unlock new opportunities for GPs in the power sector. Individual markets have approached opening up their power sectors to greater private investment differently. Some countries in Latin America, particularly Chile, Peru and Colombia, that rely on foreign capital, have already introduced significant reforms and robust regulatory frameworks to help attract that cap-ital. Darius Lilaoonwala, Head of IFC Global Infrastructure Fund at IFC Asset Management Company, explains their success as having two ingredients: “First, countries that removed the government as an investor in generation, transmission and distribution, and brought in the private sector have had great success in putting in place a self-sustaining power sector.” As with private investing in any market, investors and fund managers must have a solid understanding of the regulations and how they will be enforced. Lilaoonwala elaborates, “The second ingredient is to put in place a clear regulatory framework as to how the market will operate, how dials will be set and how investors will be compensated. Without clear rules of the game, investors will not come.”
Markets in Emerging Asia—particularly the larger ones that have access to more domestic capital and domestic players—have tended to take more of a “Band-Aid” approach on the regula-tory front, according to Lilaoonwala. They have mainly addressed
the generation segment by bringing in private IPPs to add addi-tional generation capacity without privatizing or reforming exist-ing state-owned utilities. The Philippines has stood out as an exception in the region and has taken an approach more closely aligned with Latin America, deregulating and privatizing genera-tion, transmission and distribution assets. As a result, Lilaoonwala argues that the Philippines is home to “the most successful power sector in the region in terms of privatization and reform.”
In particular, further privatization or private participation in the T&D market segments has the potential to bring financial sustain-ability to the entire sector, create more reliable networks and lead to lower prices for consumers. “Returns tend to follow reforms,” according to Lilaoonwala, suggesting that regulatory evolution allowing additional private investment in transmission and dis-tribution can be good for development and good for investors.
Broader Energy Market DynamicsMarket forces at work within the broader energy industry are bound to affect the power sector in the future. Though the eco-nomics of renewable power technology are improving, future oil and gas prices may potentially affect interest in renewables as a source of power. In most markets, the levelized cost of power from renewables remains more expensive than from natural gas, so declines in gas prices, which are often linked to oil prices, may hinder the growth of renewables. On the other hand, in some markets where governments have heavily subsidized the cost of fossil fuels, lower natural gas prices can actually help renewables if these subsidies are cut. According to the IMF, global post-tax energy subsidies are estimated to reach 6.5% of global GDP (US$5.3 trillion) in 2015, with the cost of governments in emerg-ing markets subsidizing fossil fuels accounting for US$500 billion. Energy subsidies from governments: “discourage needed invest-ments in energy efficiency, renewables, and energy infrastructure,
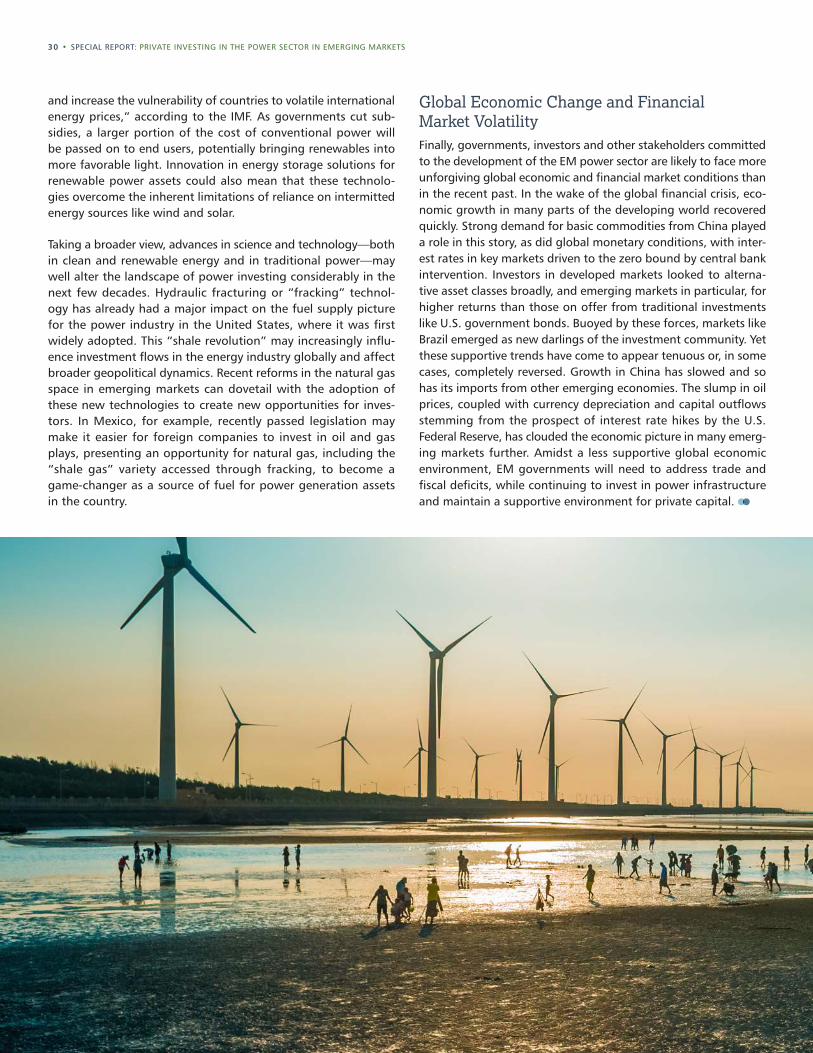
30 • SPECIAL REPORT: PRIVATE INVESTING IN THE POWER SECTOR IN EMERGING MARKETS
and increase the vulnerability of countries to volatile international energy prices,” according to the IMF. As governments cut sub-sidies, a larger portion of the cost of conventional power will be passed on to end users, potentially bringing renewables into more favorable light. Innovation in energy storage solutions for renewable power assets could also mean that these technolo-gies overcome the inherent limitations of reliance on intermitted energy sources like wind and solar.
Taking a broader view, advances in science and technology—both in clean and renewable energy and in traditional power—may well alter the landscape of power investing considerably in the next few decades. Hydraulic fracturing or “fracking” technol-ogy has already had a major impact on the fuel supply picture for the power industry in the United States, where it was first widely adopted. This “shale revolution” may increasingly influ-ence investment flows in the energy industry globally and affect broader geopolitical dynamics. Recent reforms in the natural gas space in emerging markets can dovetail with the adoption of these new technologies to create new opportunities for inves-tors. In Mexico, for example, recently passed legislation may make it easier for foreign companies to invest in oil and gas plays, presenting an opportunity for natural gas, including the “shale gas” variety accessed through fracking, to become a game-changer as a source of fuel for power generation assets in the country.
Global Economic Change and Financial Market VolatilityFinally, governments, investors and other stakeholders committed to the development of the EM power sector are likely to face more unforgiving global economic and financial market conditions than in the recent past. In the wake of the global financial crisis, eco-nomic growth in many parts of the developing world recovered quickly. Strong demand for basic commodities from China played a role in this story, as did global monetary conditions, with inter-est rates in key markets driven to the zero bound by central bank intervention. Investors in developed markets looked to alterna-tive asset classes broadly, and emerging markets in particular, for higher returns than those on offer from traditional investments like U.S. government bonds. Buoyed by these forces, markets like Brazil emerged as new darlings of the investment community. Yet these supportive trends have come to appear tenuous or, in some cases, completely reversed. Growth in China has slowed and so has its imports from other emerging economies. The slump in oil prices, coupled with currency depreciation and capital outflows stemming from the prospect of interest rate hikes by the U.S. Federal Reserve, has clouded the economic picture in many emerg-ing markets further. Amidst a less supportive global economic environment, EM governments will need to address trade and fiscal deficits, while continuing to invest in power infrastructure and maintain a supportive environment for private capital.
EMPEA • 31
CONCLUSION Investing in power assets is challenging and requires significant technical expertise and patient, long-term capital. While the fun-damentals for power investing in emerging markets are there, a number of stars have to align before LPs are willing to commit capital to the sector. According to Saurabh Agarwal of Warburg Pincus, “All of the ingredients seem to be there: the capital mar-ket, the macro and the capital. The challenge is the execution, which can be difficult due to supply issues and political dynamics. If investors can find strong management teams who can man-age through those challenges and build businesses, they’ll be rewarded.” Though this at first may sound like a familiar man-tra to LPs looking for exposure to any sector via private invest-ment funds in emerging markets, it is all the more significant for investing in power assets, particularly greenfield opportunities in which risks are heightened. As those interviewed for this report explained, fund managers can spend time and capital that can generate outsized returns for investors or potentially yield no project at all.
Ultimately, given the staggering need for investment in EM power, a potential multi-decade window exists for private investors to earn compelling returns while increasing access to power for local consumers and businesses, alleviating pressure on national
budgets and making a significant developmental impact. This sen-timent is further echoed by Actis’s Michael Harrington: “Working with governments and other capital providers to build large assets that help to reduce energy costs ends up helping all consumers’ pockets; it helps businesses become more competitive, and it makes economies more competitive. Creating efficiencies, reduc-ing distribution losses and improving the quality of service goes beyond the ‘nuts and bolts investing’ – you’re actually making an impact.”
Oftentimes, a market’s perceived risks and headline news can deter long-term investors; however, the imperative of providing power in those markets will remain a constant. Laird Reed of IFC Asset Management Company, who recently completed a due diligence trip and received approval for a project in the Middle East, perhaps best summarizes this dynamic: “We all see clips of the Middle East on CNN and sometimes think, ‘Oh my God, the wheels are coming off!’ Yet the one thing that’s a necessity to all people and to every government is power. Without it, people are overheating in their homes, their refrigerators don’t work, the hospitals don’t work, protestors move into the street and then the wheels can indeed come off. A steady supply of energy is something that, regardless of the instability in a country, you have to have.”
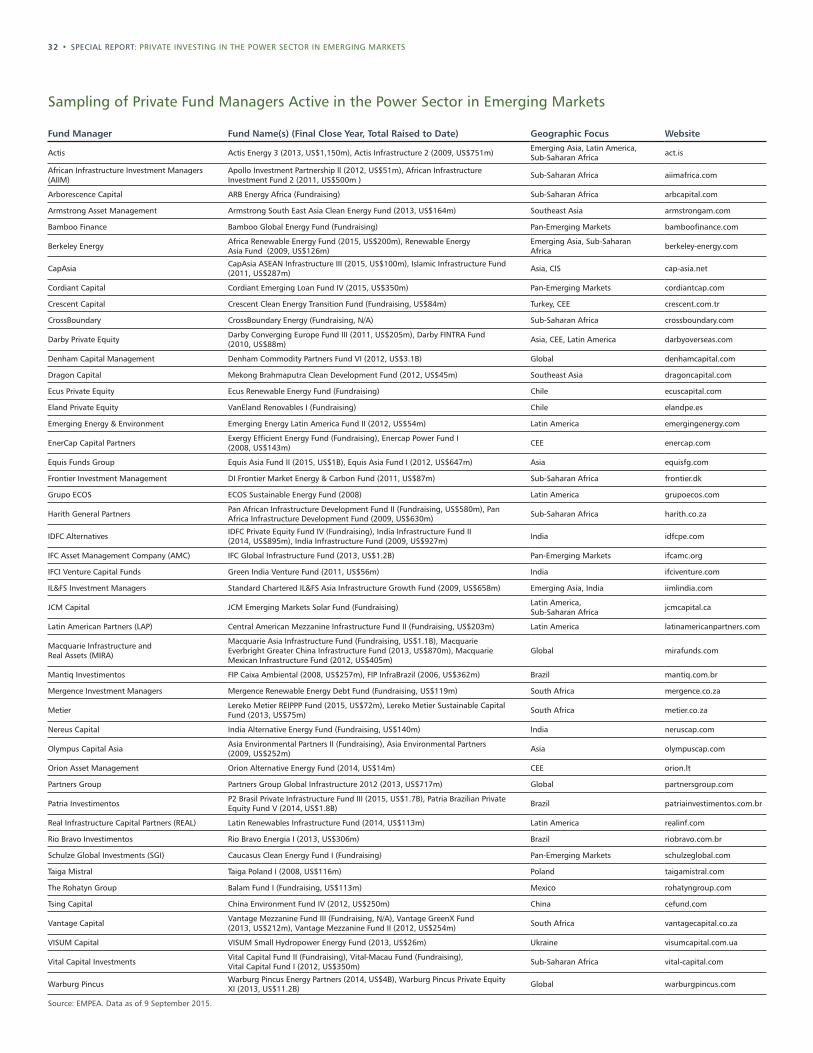
32 • SPECIAL REPORT: PRIVATE INVESTING IN THE POWER SECTOR IN EMERGING MARKETS
Fund Manager Fund Name(s) (Final Close Year, Total Raised to Date) Geographic Focus Website
Actis Actis Energy 3 (2013, US$1,150m), Actis Infrastructure 2 (2009, US$751m) Emerging Asia, Latin America, Sub-Saharan Africa act.is
African Infrastructure Investment Managers (AIIM)
Apollo Investment Partnership ll (2012, US$51m), African Infrastructure Investment Fund 2 (2011, US$500m ) Sub-Saharan Africa aiimafrica.com
Arborescence Capital ARB Energy Africa (Fundraising) Sub-Saharan Africa arbcapital.com
Armstrong Asset Management Armstrong South East Asia Clean Energy Fund (2013, US$164m) Southeast Asia armstrongam.com
Bamboo Finance Bamboo Global Energy Fund (Fundraising) Pan-Emerging Markets bamboofinance.com
Berkeley Energy Africa Renewable Energy Fund (2015, US$200m), Renewable Energy Asia Fund (2009, US$126m)
Emerging Asia, Sub-Saharan Africa berkeley-energy.com
CapAsia CapAsia ASEAN Infrastructure III (2015, US$100m), Islamic Infrastructure Fund (2011, US$287m) Asia, CIS cap-asia.net
Cordiant Capital Cordiant Emerging Loan Fund IV (2015, US$350m) Pan-Emerging Markets cordiantcap.com
Crescent Capital Crescent Clean Energy Transition Fund (Fundraising, US$84m) Turkey, CEE crescent.com.tr
CrossBoundary CrossBoundary Energy (Fundraising, N/A) Sub-Saharan Africa crossboundary.com
Darby Private Equity Darby Converging Europe Fund III (2011, US$205m), Darby FINTRA Fund (2010, US$88m) Asia, CEE, Latin America darbyoverseas.com
Denham Capital Management Denham Commodity Partners Fund VI (2012, US$3.1B) Global denhamcapital.com
Dragon Capital Mekong Brahmaputra Clean Development Fund (2012, US$45m) Southeast Asia dragoncapital.com
Ecus Private Equity Ecus Renewable Energy Fund (Fundraising) Chile ecuscapital.com
Eland Private Equity VanEland Renovables I (Fundraising) Chile elandpe.es
Emerging Energy & Environment Emerging Energy Latin America Fund II (2012, US$54m) Latin America emergingenergy.com
EnerCap Capital Partners Exergy Efficient Energy Fund (Fundraising), Enercap Power Fund I (2008, US$143m) CEE enercap.com
Equis Funds Group Equis Asia Fund II (2015, US$1B), Equis Asia Fund I (2012, US$647m) Asia equisfg.com
Frontier Investment Management DI Frontier Market Energy & Carbon Fund (2011, US$87m) Sub-Saharan Africa frontier.dk
Grupo ECOS ECOS Sustainable Energy Fund (2008) Latin America grupoecos.com
Harith General Partners Pan African Infrastructure Development Fund II (Fundraising, US$580m), Pan Africa Infrastructure Development Fund (2009, US$630m) Sub-Saharan Africa harith.co.za
IDFC Alternatives IDFC Private Equity Fund IV (Fundraising), India Infrastructure Fund II (2014, US$895m), India Infrastructure Fund (2009, US$927m) India idfcpe.com
IFC Asset Management Company (AMC) IFC Global Infrastructure Fund (2013, US$1.2B) Pan-Emerging Markets ifcamc.org
IFCI Venture Capital Funds Green India Venture Fund (2011, US$56m) India ifciventure.com
IL&FS Investment Managers Standard Chartered IL&FS Asia Infrastructure Growth Fund (2009, US$658m) Emerging Asia, India iimlindia.com
JCM Capital JCM Emerging Markets Solar Fund (Fundraising) Latin America, Sub-Saharan Africa jcmcapital.ca
Latin American Partners (LAP) Central American Mezzanine Infrastructure Fund II (Fundraising, US$203m) Latin America latinamericanpartners.com
Macquarie Infrastructure and Real Assets (MIRA)
Macquarie Asia Infrastructure Fund (Fundraising, US$1.1B), Macquarie Everbright Greater China Infrastructure Fund (2013, US$870m), Macquarie Mexican Infrastructure Fund (2012, US$405m)
Global mirafunds.com
Mantiq Investimentos FIP Caixa Ambiental (2008, US$257m), FIP InfraBrazil (2006, US$362m) Brazil mantiq.com.br
Mergence Investment Managers Mergence Renewable Energy Debt Fund (Fundraising, US$119m) South Africa mergence.co.za
Metier Lereko Metier REIPPP Fund (2015, US$72m), Lereko Metier Sustainable Capital Fund (2013, US$75m) South Africa metier.co.za
Nereus Capital India Alternative Energy Fund (Fundraising, US$140m) India neruscap.com
Olympus Capital Asia Asia Environmental Partners II (Fundraising), Asia Environmental Partners (2009, US$252m) Asia olympuscap.com
Orion Asset Management Orion Alternative Energy Fund (2014, US$14m) CEE orion.lt
Partners Group Partners Group Global Infrastructure 2012 (2013, US$717m) Global partnersgroup.com
Patria Investimentos P2 Brasil Private Infrastructure Fund III (2015, US$1.7B), Patria Brazilian Private Equity Fund V (2014, US$1.8B) Brazil patriainvestimentos.com.br
Real Infrastructure Capital Partners (REAL) Latin Renewables Infrastructure Fund (2014, US$113m) Latin America realinf.com
Rio Bravo Investimentos Rio Bravo Energia I (2013, US$306m) Brazil riobravo.com.br
Schulze Global Investments (SGI) Caucasus Clean Energy Fund I (Fundraising) Pan-Emerging Markets schulzeglobal.com
Taiga Mistral Taiga Poland I (2008, US$116m) Poland taigamistral.com
The Rohatyn Group Balam Fund I (Fundraising, US$113m) Mexico rohatyngroup.com
Tsing Capital China Environment Fund IV (2012, US$250m) China cefund.com
Vantage Capital Vantage Mezzanine Fund III (Fundraising, N/A), Vantage GreenX Fund (2013, US$212m), Vantage Mezzanine Fund II (2012, US$254m) South Africa vantagecapital.co.za
VISUM Capital VISUM Small Hydropower Energy Fund (2013, US$26m) Ukraine visumcapital.com.ua
Vital Capital Investments Vital Capital Fund II (Fundraising), Vital-Macau Fund (Fundraising), Vital Capital Fund I (2012, US$350m) Sub-Saharan Africa vital-capital.com
Warburg Pincus Warburg Pincus Energy Partners (2014, US$4B), Warburg Pincus Private Equity XI (2013, US$11.2B) Global warburgpincus.com
Source: EMPEA. Data as of 9 September 2015.
Sampling of Private Fund Managers Active in the Power Sector in Emerging Markets
EMPEA • 33
REPORT METHODOLOGYThis report provides an overview of fundraising, investment and exit activ-ity among institutionally-backed private alternative asset managers active in the power sector in the emerging markets of Africa, Asia, Europe, Latin America and the Middle East. Unless stated otherwise, the information presented in this report is drawn from EMPEA’s proprietary research data-base, FundLink, and is based on data obtained from surveys of industry participants, direct communications with fund managers, press releases, trade publications and exchanges with regional and local venture capi-tal associations. Fundraising, investment and exit amounts in this report have been confirmed wherever possible directly by fund managers. EMPEA updates historical data on a quarterly basis as new data from fund manag-ers and other sources is compiled in FundLink. Any discrepancies between the aggregate statistics published by EMPEA and the constituent data on individual funds and transactions included in tables and raw data files can be attributed to confidential information that has been omitted from public reporting.
This report covers activity by long-term, private, direct investment funds backed by institutional investors—collectively “private funds” or “private capital”—across the following fund strategies: power-dedicated, clean technology, infrastructure and generalist or multi-sector private equity. EMPEA data and statistics exclude activity from real estate funds, funds of funds, secondaries funds, traditional investment holding companies, corporate strategic investors, government-owned or managed entities and captive investment vehicles, as well as funds investing primarily in public-ly-traded equity or debt securities. Reported fundraising totals reflect only official closes (interim and/or final) as reported in primary and secondary sources or directly by fund managers. Capital commitments accruing prior to or between official closes are not included in reporting.
Investment data in this report includes all activity by private fund man-agers in the following segments of the power sector: generation (both utility-scale and distributed), transmission and distribution. Electricity trading is also included. Manufacturing of energy equipment (such as solar panels or wind turbines) and efficiency or conservation services are outside the scope of this report. In addition to market segment, invest-ments have been classified by deal type—equity, senior debt, mezzanine and PIPE—and for power generation, by development stage and deal thesis: “greenfield” or pre-operational assets or platforms; “buy and build” investments; “expansion” of existing facilities or platforms; and “buyout” or “replacement” capital for mature, operational assets without significant expansion plans. Secondary investments (both traditional and direct) are excluded from investment reporting. In addition, wherever possible, bank financing and co-investment from excluded entities (mentioned in the second paragraph of this note) are excluded from reported investment values, both to ensure continuity across regions and to provide a more accurate picture of the scale and pace of capital deployment by the funds that are the primary focus of EMPEA’s research. Investment totals also exclude co-investments and direct investments made by LPs.
Due to selection bias in reporting, exit data included in this report should not be treated as a comprehensive picture of all EM power sector exit activity, but as a sampling of exits from a given market or time period.
EMPEA data and statistics are compiled based on the “market” approach. Fundraising activity is categorized based on the countries, sub-regions or regions in which fund managers intend to invest, while investment activity is categorized based on the country headquarters of investee companies. For companies registered in offshore financial cen-ters or developed markets, but operating exclusively or predominately in emerging markets, investment activity is categorized based on the geo-graphic footprint of the operations of investee companies. In the case of global or multi-regional funds, only those funds investing primarily in emerging markets are included in fundraising totals (e.g., pan-Asia funds with a significant portion of capital intended for investment in China and India). Country-dedicated fundraising data and statistics reflect only those funds with a single-country strategy or mandate. Target allocations to individual markets within a broader global or regional fund are not attributed to single-country fundraising totals.
Regions in this report are defined as:Emerging Asia: Asia-Pacific, excluding Japan, Australia and New Zealand. Central and Eastern Europe (CEE) and Commonwealth of Independent States (CIS): European Union accession countries (2004), Southeastern Europe (excluding Greece) and Turkey, as well as Russia and other CIS countries. Latin America: Mexico, Central and South America and the Caribbean (excluding Puerto Rico and other overseas territories and departments). Middle East and North Africa (MENA): Gulf Cooperation Council (GCC), Afghanistan, Iran, Iraq, Jordan, Lebanon, Pakistan, Palestinian Territories, Syria and Yemen, as well as North Africa (Algeria, Egypt, Libya, Morocco, Sudan and Tunisia). Sub-Saharan Africa: Africa, excluding North Africa as defined above.
Additional NotesAbbreviations commonly used in this report:
EM – Emerging markets GP – General partner (fund manager) LP – Limited partner (fund investor)
In some exhibits in EMPEA publications, percentage labels may not sum to 100% due to rounding. In all tables in which it appears, “N/A” denotes a confidential or otherwise undisclosed value.
For any additional questions, please contact [email protected].
Disclaimer: This information is intended to provide an indication of industry activity based on the best information available from public and proprietary sources. EMPEA has taken measures to validate the information presented herein but cannot guarantee the ultimate accuracy or completeness of the data provided. EMPEA is not responsible for any decision made or action taken based on information drawn from this report.
34 • SPECIAL REPORT: PRIVATE INVESTING IN THE POWER SECTOR IN EMERGING MARKETS


