General rights Copyright and moral rights for the publications made accessible in the public portal are retained by the authors and/or other copyright owners and it is a condition of accessing publications that users recognise and abide by the legal requirements associated with these rights. Users may download and print one copy of any publication from the public portal for the purpose of private study or research. You may not further distribute the material or use it for any profit-making activity or commercial gain You may freely distribute the URL identifying the publication in the public portal If you believe that this document breaches copyright please contact us providing details, and we will remove access to the work immediately and investigate your claim. Downloaded from orbit.dtu.dk on: Nov 18, 2021 Speciation analysis of trace elements in foodstuffs by HPLC- and GC-ICPMS Sloth, Jens Jørgen Publication date: 2012 Document Version Publisher's PDF, also known as Version of record Link back to DTU Orbit Citation (APA): Sloth, J. J. (Author). (2012). Speciation analysis of trace elements in foodstuffs by HPLC- and GC-ICPMS. Sound/Visual production (digital)
Transcript
General rights Copyright and moral rights for the publications made accessible in the public portal are retained by the authors and/or other copyright owners and it is a condition of accessing publications that users recognise and abide by the legal requirements associated with these rights.
Users may download and print one copy of any publication from the public portal for the purpose of private study or research.
You may not further distribute the material or use it for any profit-making activity or commercial gain
You may freely distribute the URL identifying the publication in the public portal If you believe that this document breaches copyright please contact us providing details, and we will remove access to the work immediately and investigate your claim.
Downloaded from orbit.dtu.dk on: Nov 18, 2021
Speciation analysis of trace elements in foodstuffs by HPLC- and GC-ICPMS
Sloth, Jens Jørgen
Publication date:2012
Document VersionPublisher's PDF, also known as Version of record
Link back to DTU Orbit
Citation (APA):Sloth, J. J. (Author). (2012). Speciation analysis of trace elements in foodstuffs by HPLC- and GC-ICPMS.Sound/Visual production (digital)
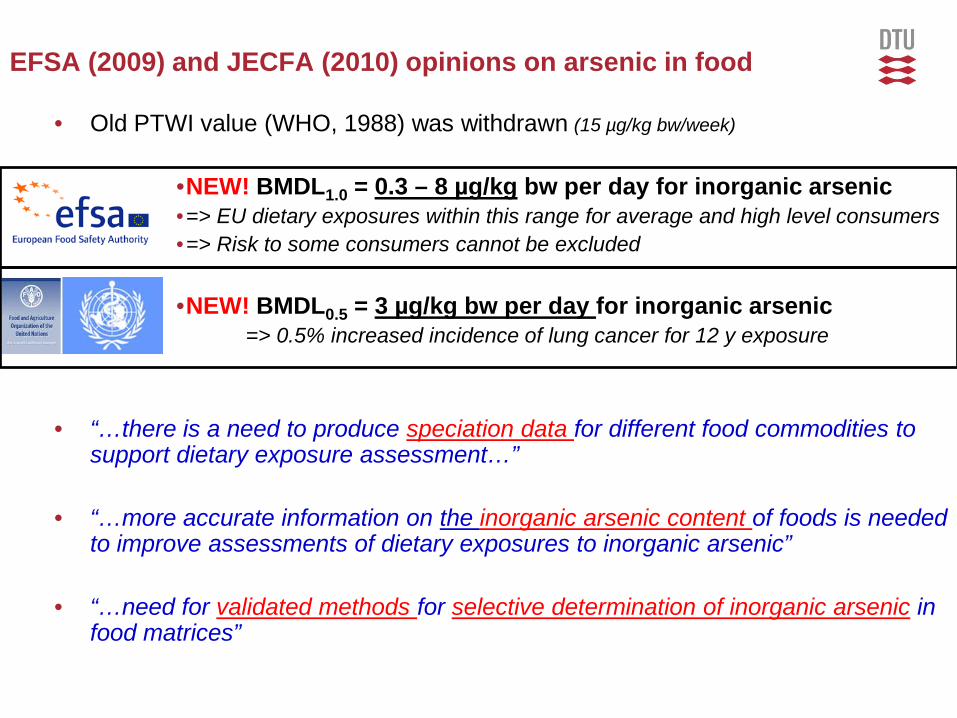
EFSA (2009) and JECFA (2010) opinions on arsenic in food
• Old PTWI value (WHO, 1988) was withdrawn (15 µg/kg bw/week)
•NEW! BMDL1.0 = 0.3 – 8 µg/kg bw per day for inorganic arsenic •=> EU dietary exposures within this range for average and high level consumers •=> Risk to some consumers cannot be excluded
•NEW! BMDL0.5 = 3 µg/kg bw per day for inorganic arsenic => 0.5% increased incidence of lung cancer for 12 y exposure
• “…there is a need to produce speciation data for different food commodities to
support dietary exposure assessment…”
• “…more accurate information on the inorganic arsenic content of foods is needed to improve assessments of dietary exposures to inorganic arsenic”
• “…need for validated methods for selective determination of inorganic arsenic in
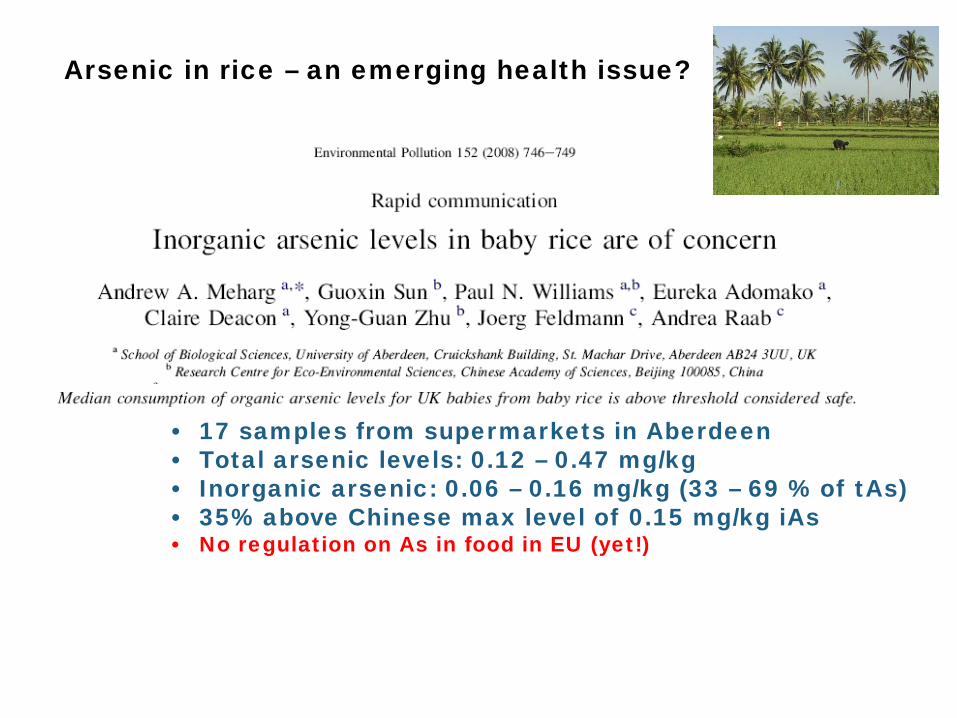
• 17 samples from supermarkets in Aberdeen • Total arsenic levels: 0.12 – 0.47 mg/kg • Inorganic arsenic: 0.06 – 0.16 mg/kg (33 – 69 % of tAs) • 35% above Chinese max level of 0.15 mg/kg iAs • No regulation on As in food in EU (yet!)
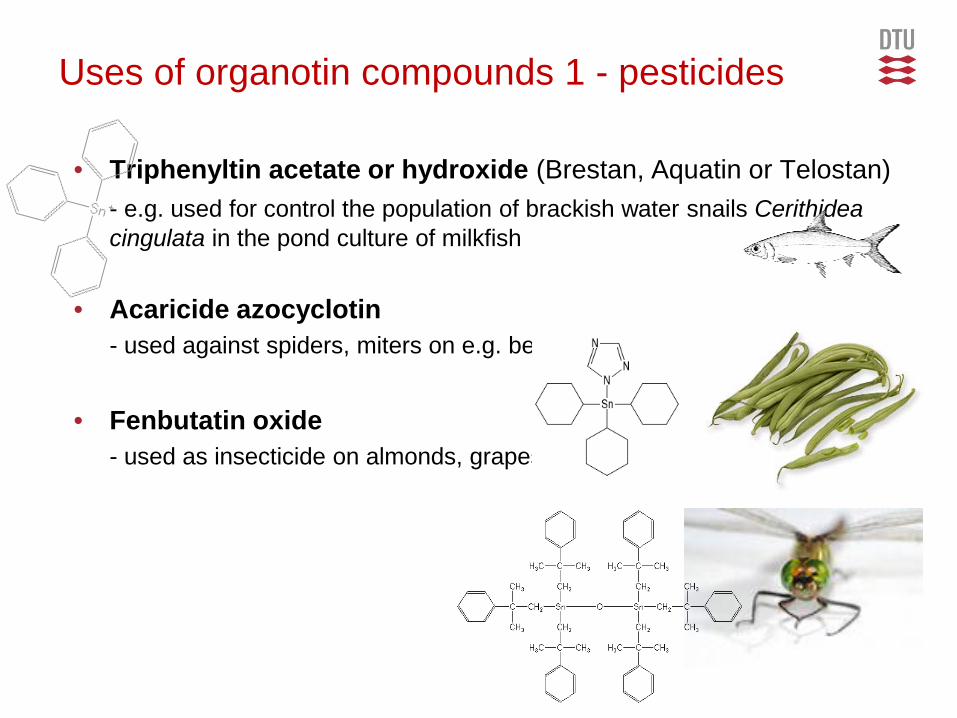
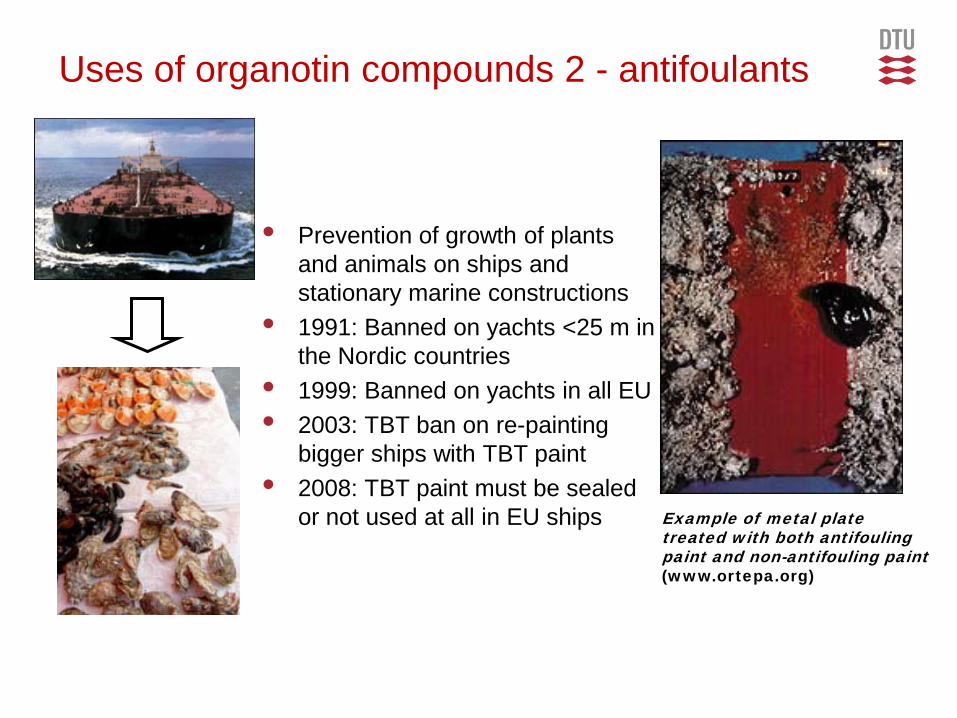
• Prevention of growth of plants and animals on ships and stationary marine constructions
• 1991: Banned on yachts <25 m in the Nordic countries
• 1999: Banned on yachts in all EU • 2003: TBT ban on re-painting
bigger ships with TBT paint • 2008: TBT paint must be sealed
or not used at all in EU ships Example of metal plate treated with both antifouling paint and non-antifouling paint (www.ortepa.org)
Hoch, A
ppl. Geochem
., 2001, 719-43
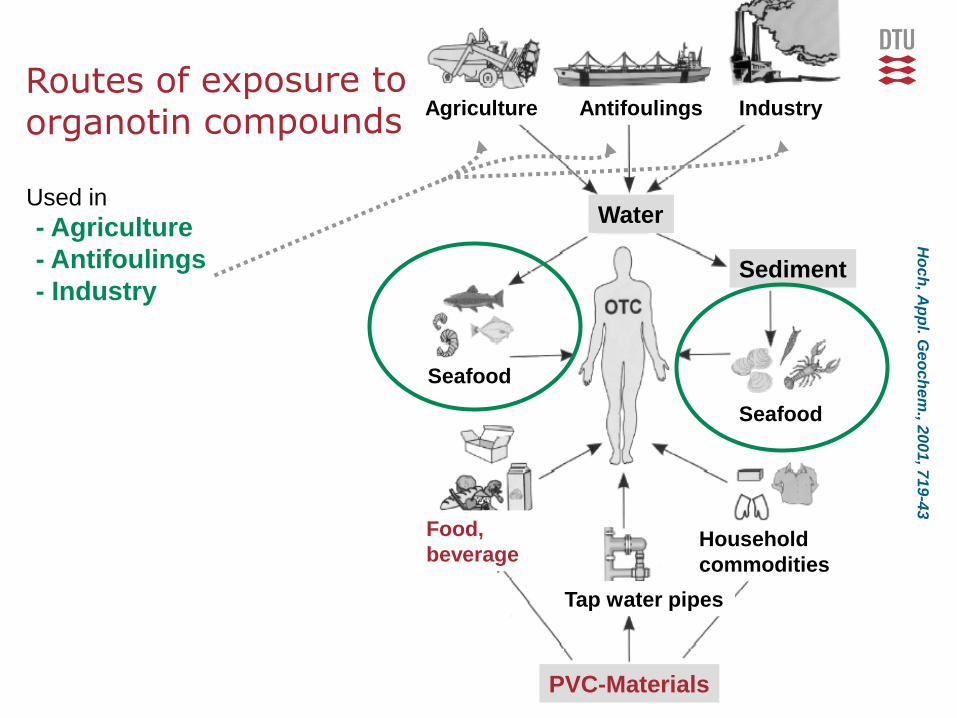
Seafood
Household commodities
Agriculture Antifoulings Industry
Sediment
Water
Seafood
Tap water pipes
Food, beverage
PVC-Materials
- Agriculture - Antifoulings - Industry
Used in
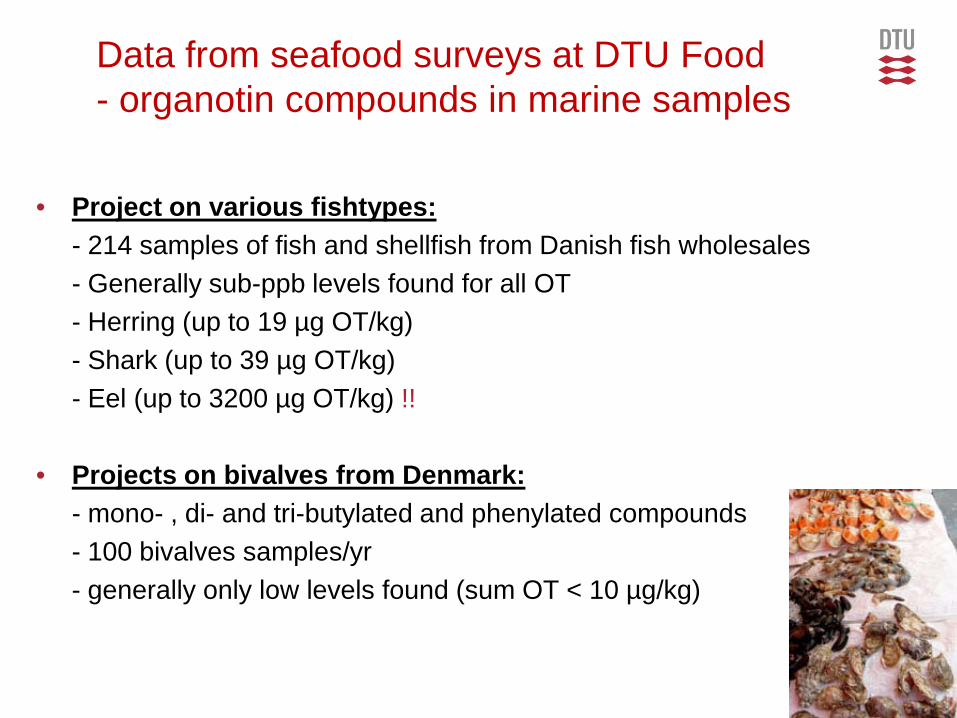
Data from seafood surveys at DTU Food - organotin compounds in marine samples
• Project on various fishtypes: - 214 samples of fish and shellfish from Danish fish wholesales - Generally sub-ppb levels found for all OT - Herring (up to 19 µg OT/kg) - Shark (up to 39 µg OT/kg) - Eel (up to 3200 µg OT/kg) !!
• Projects on bivalves from Denmark: - mono- , di- and tri-butylated and phenylated compounds - 100 bivalves samples/yr - generally only low levels found (sum OT < 10 µg/kg)
Hoch, A
ppl. Geochem
., 2001, 719-43
Seafood
Household commodities
Agriculture Antifoulings Industry
Sediment
Water
Seafood
Tap water pipes
Food, beverage
PVC-Materials
- Agriculture - Antifoulings - Industry
Used in
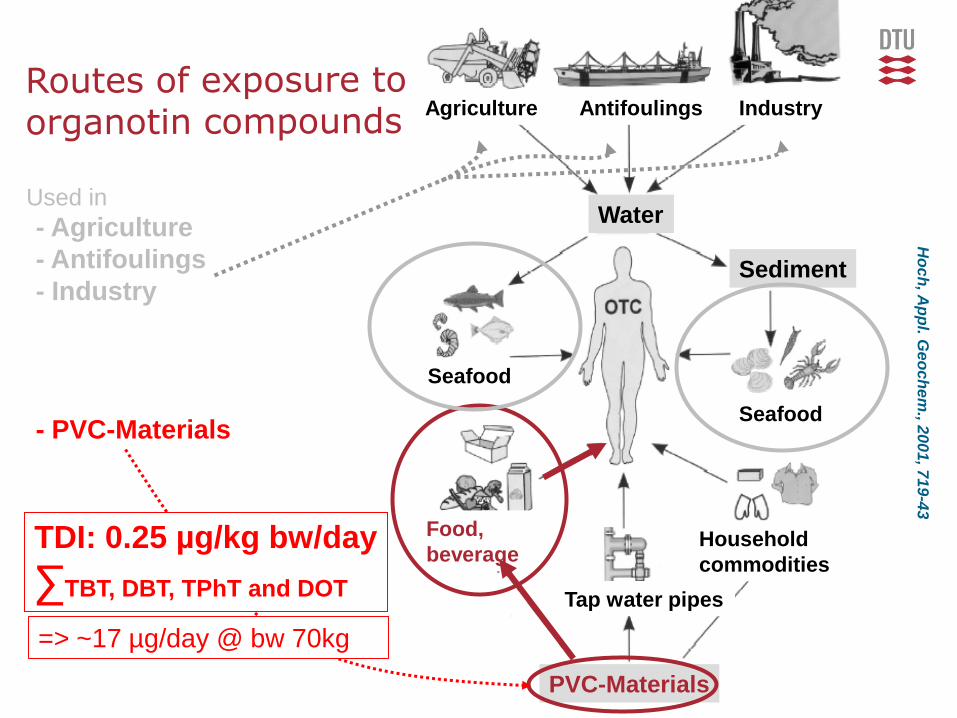
- PVC-Materials
TDI: 0.25 µg/kg bw/day ∑TBT, DBT, TPhT and DOT
=> ~17 µg/day @ bw 70kg
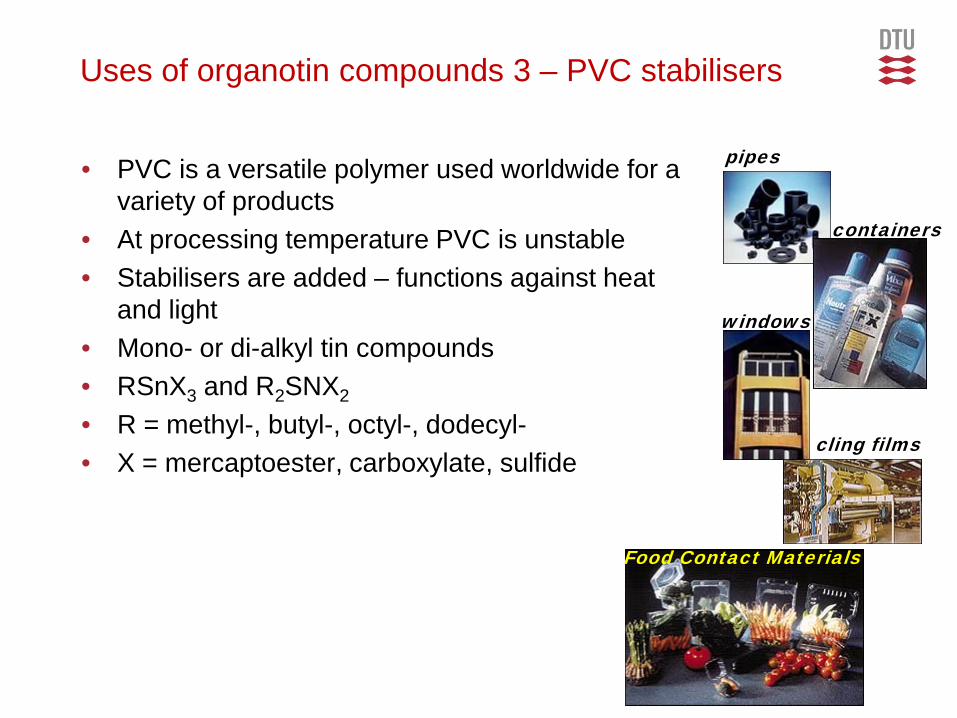
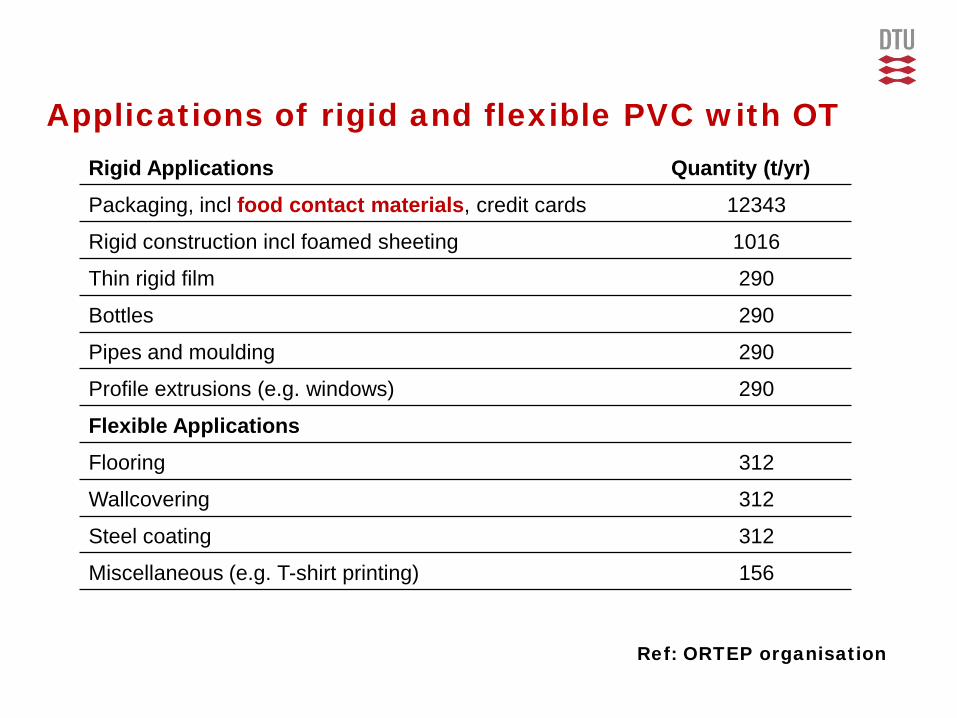
• PVC is a versatile polymer used worldwide for a variety of products
• At processing temperature PVC is unstable • Stabilisers are added – functions against heat
and light • Mono- or di-alkyl tin compounds • RSnX3 and R2SNX2
• R = methyl-, butyl-, octyl-, dodecyl- • X = mercaptoester, carboxylate, sulfide
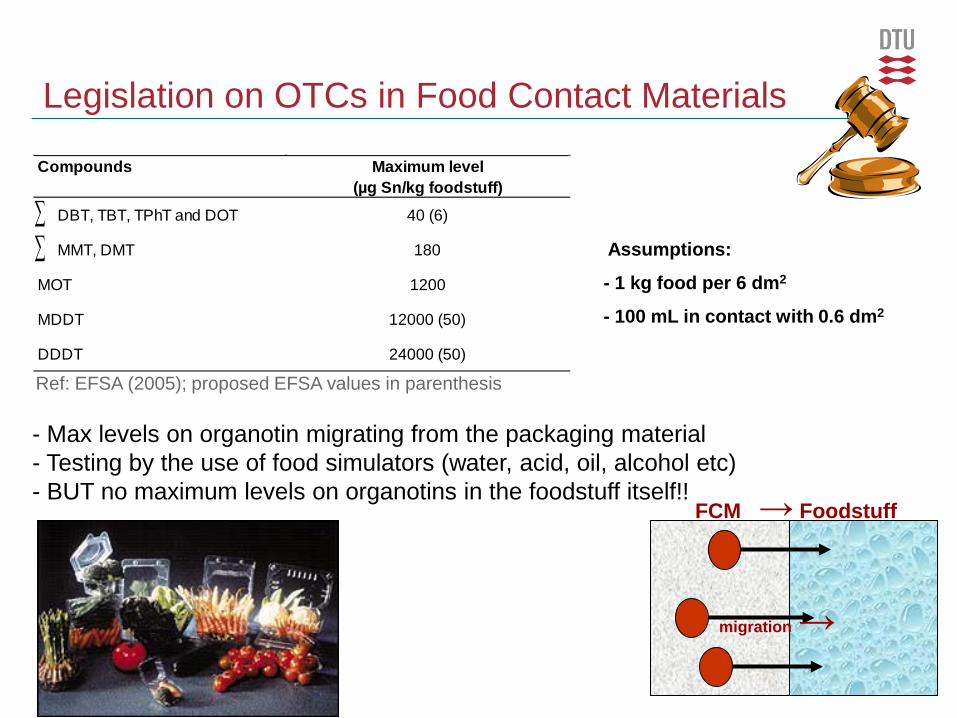
- Max levels on organotin migrating from the packaging material - Testing by the use of food simulators (water, acid, oil, alcohol etc) - BUT no maximum levels on organotins in the foodstuff itself!!
Ref: EFSA (2005); proposed EFSA values in parenthesis
FCM → Foodstuff
migration →
Assumptions:
- 1 kg food per 6 dm2
- 100 mL in contact with 0.6 dm2
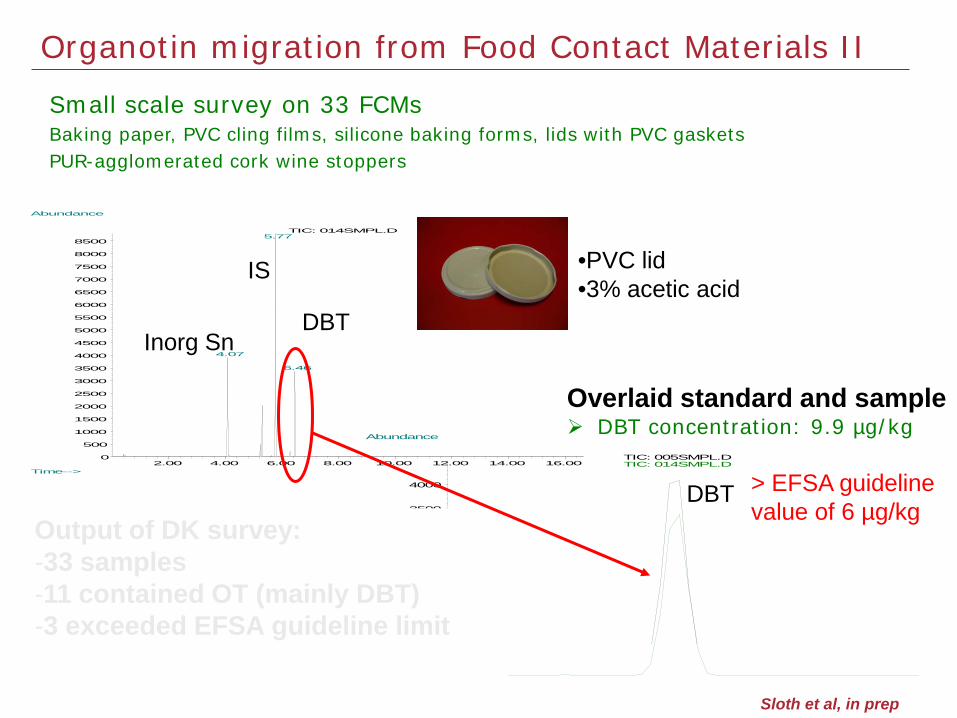
Organotin migration from Food Contact Materials II