Species limits and phylogeography of North American cricket frogs (Acris: Hylidae) Tony Gamble a, * , Peter B. Berendzen b , H. Bradley Shaffer c , David E. Starkey d , Andrew M. Simons e a Conservation Biology Graduate Program, Bell Museum of Natural History, University of Minnesota, 100 Ecology, 1987 Upper Buford Circle, St. Paul, MN 55108, USA b Department of Biology, University of Northern Iowa, Cedar Falls, IA, 50614, USA c Section of Evolution & Ecology and Center for Population Biology, University of California, Davis, CA 95616, USA d Department of Biology, University of Central Arkansas, Conway, AR 72035, USA e Department of Fisheries, Wildlife, and Conservation Biology & Bell Museum of Natural History, University of Minnesota, St. Paul, MN 55108, USA article info Article history: Received 15 October 2007 Revised 22 February 2008 Accepted 10 March 2008 Available online 16 March 2008 Keywords: Acris Amphibian decline Cryptic species Mitochondrial gene Nuclear gene Phylogeography Species delimitation abstract Cricket frogs are widely distributed across the eastern United States and two species, the northern cricket frog (Acris crepitans) and the southern cricket frog (A. gryllus) are currently recognized. We generated a phylogenetic hypothesis for Acris using fragments of nuclear and mitochondrial genes in separate and combined phylogenetic analyses. We also used distance methods and fixation indices to evaluate species limits within the genus and the validity of currently recognized subspecies of A. crepitans. The distribu- tions of existing A. crepitans subspecies, defined by morphology and call types, do not match the distri- butions of evolutionary lineages recovered using our genetic data. We discuss a scenario of call evolution to explain this disparity. We also recovered distinct phylogeographic groups within A. crepitans and A. gryllus that are congruent with other codistributed taxa. Under a lineage-based species concept, we rec- ognize Acris blanchardi as a distinct species. The importance of this revised taxonomy is discussed in light of the dramatic declines in A. blanchardi across the northern and western portions of its range. Ó 2008 Elsevier Inc. All rights reserved. 1. Introduction Named taxa are implicitly assumed to represent distinct evolu- tionary lineages (de Quieroz, 2005). Advances in phylogenetics, particularly the use of DNA sequence data, have allowed biologists to test the validity of taxonomic nomenclature against phyloge- netic hypotheses. A number of recent studies have shown that many subspecies designations do not in fact represent valid evolu- tionary lineages (Burbrink et al., 2000; Starkey et al., 2003; Zink, 2004). Amphibian systematics and taxonomy in particular has ben- efited from detailed molecular studies that identified morphologi- cally ‘‘cryptic” species and highlighted incongruence between morphology-based taxonomies and evolutionary lineages (Chek et al., 2001; Hanken, 1999; Pauly et al., 2007; Lemmon et al., 2007a). For example, recent molecular phylogenies of taxa within the genus Pseudacris (Hylidae) demonstrated that named subspe- cies of Pseudacris crucifer and Pseudacris nigrita did not correspond to recognizable evolutionary lineages (Austin et al., 2002; Moriarty and Cannatella, 2004). These studies and others have recom- mended sweeping taxonomic changes to reflect historical lineages. Mitochondrial DNA (mtDNA), because of its faster substitution rate and small effective population size, will typically coalesce fas- ter than nuclear DNA (Palumbi et al., 2001; Hudson and Coyne, 2002). Coalescent mtDNA lineages offer diagnostic characters that satisfy the requirements of lineage-based species definitions (de Queiroz, 1998; Wiens and Penkrot, 2002), and mtDNA has been widely used to recover species relationships and to delimit species. However, as gene tree/species tree conflicts continue to be identi- fied in mtDNA analyses, nuclear DNA (nDNA) is being used more frequently to answer questions at and below the species level (Bal- lard and Whitlock, 2004; Hare, 2001; Howes et al., 2006; Weisrock et al., 2006). The use of nDNA to resolve species relationships in- curs new problems related to operational species definitions and the interpretation of conflicts among datasets, with little consen- sus on their resolution in the systematics literature (Baker and DeSalle, 1997; Huelsenbeck et al., 1996; Moore, 1995). The lack of phylogenetic information often present in nDNA phylogenies, due to incomplete lineage sorting, raises the question of how nDNA information can be incorporated into a lineage-based species con- cept. Two strategies may be employed. First, nDNA can be used in a combined phylogenetic analysis with mtDNA (e.g. Egge and Si- mons, 2006; Rokas et al., 2003). However, given the low resolution found in many nuclear-gene trees, this is often tantamount to rely- ing on mtDNA results alone (Spinks and Shaffer, 2005). The second strategy is to use nDNA to test for gene flow, or a lack thereof, be- tween mitochondrially diagnosed lineages using fixation indices and distance methods (e.g. Sota and Sasabe, 2006). We address these issues by examining North American cricket frogs in the genus Acris (Hylidae). Cricket frogs are widely 1055-7903/$ - see front matter Ó 2008 Elsevier Inc. All rights reserved. doi:10.1016/j.ympev.2008.03.015 * Corresponding author. E-mail address: [email protected](T. Gamble). Molecular Phylogenetics and Evolution 48 (2008) 112–125 Contents lists available at ScienceDirect Molecular Phylogenetics and Evolution journal homepage: www.elsevier.com/locate/ympev
Transcript
Molecular Phylogenetics and Evolution 48 (2008) 112–125
Contents lists available at ScienceDirect
Molecular Phylogenetics and Evolution
journal homepage: www.elsevier .com/locate /ympev
Species limits and phylogeography of North American cricket frogs (Acris: Hylidae)
Tony Gamble a,*, Peter B. Berendzen b, H. Bradley Shaffer c, David E. Starkey d, Andrew M. Simons e
a Conservation Biology Graduate Program, Bell Museum of Natural History, University of Minnesota, 100 Ecology, 1987 Upper Buford Circle, St. Paul, MN 55108, USAb Department of Biology, University of Northern Iowa, Cedar Falls, IA, 50614, USAc Section of Evolution & Ecology and Center for Population Biology, University of California, Davis, CA 95616, USAd Department of Biology, University of Central Arkansas, Conway, AR 72035, USAe Department of Fisheries, Wildlife, and Conservation Biology & Bell Museum of Natural History, University of Minnesota, St. Paul, MN 55108, USA
a r t i c l e i n f o a b s t r a c t
Article history:Received 15 October 2007Revised 22 February 2008Accepted 10 March 2008Available online 16 March 2008
1055-7903/$ - see front matter � 2008 Elsevier Inc. Adoi:10.1016/j.ympev.2008.03.015
* Corresponding author.E-mail address: [email protected] (T. Gamble).
Cricket frogs are widely distributed across the eastern United States and two species, the northern cricketfrog (Acris crepitans) and the southern cricket frog (A. gryllus) are currently recognized. We generated aphylogenetic hypothesis for Acris using fragments of nuclear and mitochondrial genes in separate andcombined phylogenetic analyses. We also used distance methods and fixation indices to evaluate specieslimits within the genus and the validity of currently recognized subspecies of A. crepitans. The distribu-tions of existing A. crepitans subspecies, defined by morphology and call types, do not match the distri-butions of evolutionary lineages recovered using our genetic data. We discuss a scenario of call evolutionto explain this disparity. We also recovered distinct phylogeographic groups within A. crepitans and A.gryllus that are congruent with other codistributed taxa. Under a lineage-based species concept, we rec-ognize Acris blanchardi as a distinct species. The importance of this revised taxonomy is discussed in lightof the dramatic declines in A. blanchardi across the northern and western portions of its range.
� 2008 Elsevier Inc. All rights reserved.
1. Introduction
Named taxa are implicitly assumed to represent distinct evolu-tionary lineages (de Quieroz, 2005). Advances in phylogenetics,particularly the use of DNA sequence data, have allowed biologiststo test the validity of taxonomic nomenclature against phyloge-netic hypotheses. A number of recent studies have shown thatmany subspecies designations do not in fact represent valid evolu-tionary lineages (Burbrink et al., 2000; Starkey et al., 2003; Zink,2004). Amphibian systematics and taxonomy in particular has ben-efited from detailed molecular studies that identified morphologi-cally ‘‘cryptic” species and highlighted incongruence betweenmorphology-based taxonomies and evolutionary lineages (Cheket al., 2001; Hanken, 1999; Pauly et al., 2007; Lemmon et al.,2007a). For example, recent molecular phylogenies of taxa withinthe genus Pseudacris (Hylidae) demonstrated that named subspe-cies of Pseudacris crucifer and Pseudacris nigrita did not correspondto recognizable evolutionary lineages (Austin et al., 2002; Moriartyand Cannatella, 2004). These studies and others have recom-mended sweeping taxonomic changes to reflect historical lineages.
Mitochondrial DNA (mtDNA), because of its faster substitutionrate and small effective population size, will typically coalesce fas-ter than nuclear DNA (Palumbi et al., 2001; Hudson and Coyne,
ll rights reserved.
2002). Coalescent mtDNA lineages offer diagnostic characters thatsatisfy the requirements of lineage-based species definitions (deQueiroz, 1998; Wiens and Penkrot, 2002), and mtDNA has beenwidely used to recover species relationships and to delimit species.However, as gene tree/species tree conflicts continue to be identi-fied in mtDNA analyses, nuclear DNA (nDNA) is being used morefrequently to answer questions at and below the species level (Bal-lard and Whitlock, 2004; Hare, 2001; Howes et al., 2006; Weisrocket al., 2006). The use of nDNA to resolve species relationships in-curs new problems related to operational species definitions andthe interpretation of conflicts among datasets, with little consen-sus on their resolution in the systematics literature (Baker andDeSalle, 1997; Huelsenbeck et al., 1996; Moore, 1995). The lackof phylogenetic information often present in nDNA phylogenies,due to incomplete lineage sorting, raises the question of how nDNAinformation can be incorporated into a lineage-based species con-cept. Two strategies may be employed. First, nDNA can be used in acombined phylogenetic analysis with mtDNA (e.g. Egge and Si-mons, 2006; Rokas et al., 2003). However, given the low resolutionfound in many nuclear-gene trees, this is often tantamount to rely-ing on mtDNA results alone (Spinks and Shaffer, 2005). The secondstrategy is to use nDNA to test for gene flow, or a lack thereof, be-tween mitochondrially diagnosed lineages using fixation indicesand distance methods (e.g. Sota and Sasabe, 2006).
We address these issues by examining North Americancricket frogs in the genus Acris (Hylidae). Cricket frogs are widely
T. Gamble et al. / Molecular Phylogenetics and Evolution 48 (2008) 112–125 113
distributed across the eastern United States and consist of twocurrently recognized species, the northern cricket frog (Acris crep-itans) and the southern cricket frog (A. gryllus; Conant and Collins,1998). The northern cricket frog is currently separated into threesubspecies. The eastern cricket frog, A. c. crepitans occurs fromsoutheastern New York south to the Florida Panhandle and westto eastern Texas, generally east and south of the Appalachian/Cen-tral Highlands. Blanchard’s cricket frog, A. c. blanchardi occurs inthe Midwest and Great Plains from South Dakota to west Texasand east to the Appalachian/Central Highlands. The coastal cricketfrog, A. c. paludicola, occupies a limited area along the Gulf Coastfrom Houston, Texas to central Louisiana (Fig. 1; Gray et al.,2005). The southern cricket frog is separated into two subspecies,both of which occur in coastal habitats below the Fall Line alongthe Atlantic and Gulf Coasts. The Coastal Plain cricket frog, A. g.gryllus occupies the southeastern US from the Mississippi Riverto the Atlantic coast as far north as Virginia, but excluding penin-sular Florida. Replacing it in peninsular Florida is the Florida cricketfrog, A. g. dorsalis (Jensen, 2005).
Acris crepitans and A. gryllus are morphologically similar andhave previously been treated both as distinct species and as con-specific subspecies, leading to taxonomic and systematic confusionwithin the genus (Chantell, 1967; Harper, 1947; Mecham, 1964;Wright and Wright, 1949; McCallum and Trauth, 2006; Frost,2007). Call data support the species status of A. crepitans and A.gryllus as well as the geographic distribution of currently describedsubspecies within A. crepitans (Nevo and Capranica, 1985). Allo-zyme data show a different geographic pattern within A. crepitans,which Dessauer and Nevo (1969) divided into: a ‘‘Plains group”containing individuals from north of the Ohio River and west ofthe lower Mississippi River; a ‘‘Delta group” consisting of individ-uals from southern Louisiana, which shared many of the same pro-teins as the ‘‘Plains group” but differed at a few key polypeptides;and an ‘‘Appalachian group” that consisted of frogs from Alabamaand Georgia northeast to New York and considered more divergent
Fig. 1. Map of eastern North America showing the approximate geographic range of Acris
from the ‘‘Plains group” than is the ‘‘Delta group”. Additionally, themorphological data used to differentiate A. c. crepitans from A. c.blanchardi fail to adequately discriminate the two forms (McCal-lum and Trauth, 2006). Given the taxonomic confusion within Acrisand the precipitous declines of A. c. blanchardi across the northernand western portions of its range (Gray and Brown, 2005), weundertook a broad-scale genetic analysis of the complex to helpclarify the evolutionary distinctiveness and relationships amongcurrently recognized taxa.
We conducted a phylogenetic analysis of the genus Acris withthe goal of determining how many species occur in the genusand whether currently recognized subspecies within A. crepitansrepresent distinct evolutionary lineages. Molecular systematistsincreasingly view single gene trees as tentative hypotheses oforganismal lineages and their interrelationships, and mtDNA inparticular can show quite different evolutionary relationshipscompared to that of the actual organisms (Ballard and Rand,2005; Funk and Omland, 2003; Weisrock et al., 2006). Therefore,we examined the phylogenetic relationships within Acris usingfour distinct loci: a fragment of the mitochondrial cytochrome bgene; protein-coding fragments of the nuclear genes tyrosinaseand proopiomelanocortin (POMC); and nuclear intron 4 of beta-crystallin (cryB). Analyses of these data provide a novel hypothesisregarding the species boundaries in Acris. We use this hypothesisto reinterpret aspects of the biogeography, behavioral evolution,taxonomy and conservation of Acris.
2. Materials and methods
2.1. Material examined
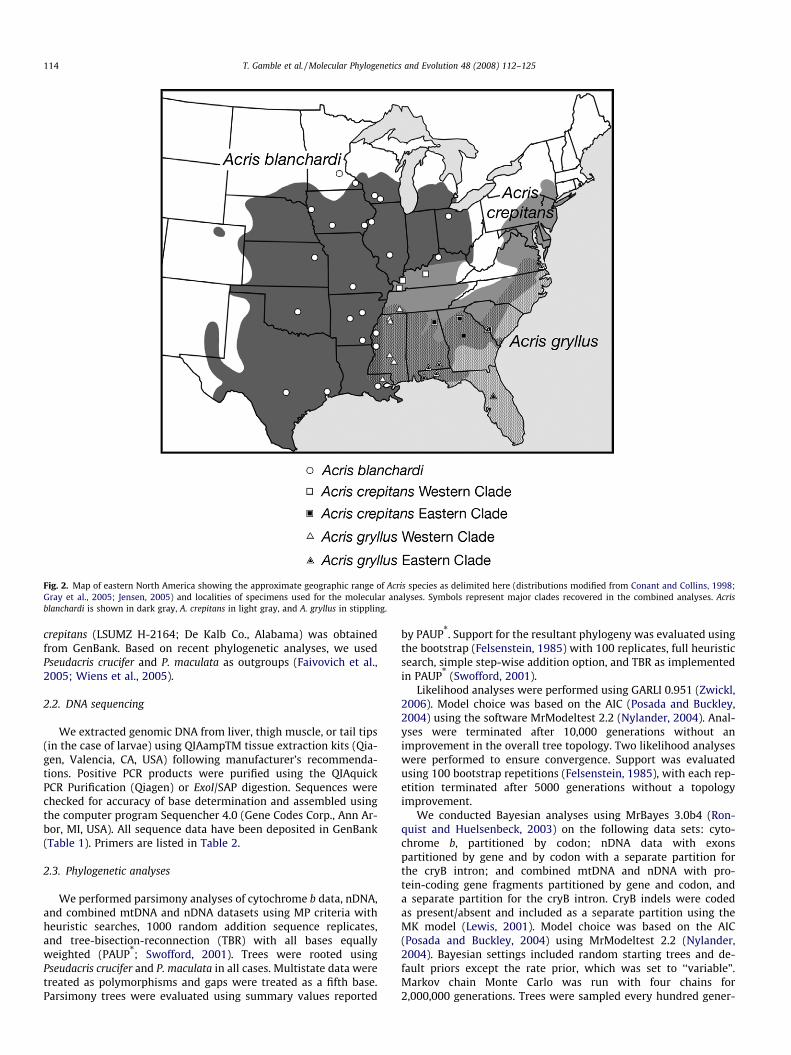
We examined 64 specimens of A. crepitans and A. gryllus from 42localities including all three described A. crepitans subspecies andboth A. gryllus subspecies (Fig. 2; Table 1). Tissues were frozen inliquid nitrogen or stored in 95% ethanol. Sequence data from A.
crepitans subspecies, modified from Conant and Collins (1998) and Gray et al. (2005).
Fig. 2. Map of eastern North America showing the approximate geographic range of Acris species as delimited here (distributions modified from Conant and Collins, 1998;Gray et al., 2005; Jensen, 2005) and localities of specimens used for the molecular analyses. Symbols represent major clades recovered in the combined analyses. Acrisblanchardi is shown in dark gray, A. crepitans in light gray, and A. gryllus in stippling.
114 T. Gamble et al. / Molecular Phylogenetics and Evolution 48 (2008) 112–125
crepitans (LSUMZ H-2164; De Kalb Co., Alabama) was obtainedfrom GenBank. Based on recent phylogenetic analyses, we usedPseudacris crucifer and P. maculata as outgroups (Faivovich et al.,2005; Wiens et al., 2005).
2.2. DNA sequencing
We extracted genomic DNA from liver, thigh muscle, or tail tips(in the case of larvae) using QIAampTM tissue extraction kits (Qia-gen, Valencia, CA, USA) following manufacturer’s recommenda-tions. Positive PCR products were purified using the QIAquickPCR Purification (Qiagen) or ExoI/SAP digestion. Sequences werechecked for accuracy of base determination and assembled usingthe computer program Sequencher 4.0 (Gene Codes Corp., Ann Ar-bor, MI, USA). All sequence data have been deposited in GenBank(Table 1). Primers are listed in Table 2.
2.3. Phylogenetic analyses
We performed parsimony analyses of cytochrome b data, nDNA,and combined mtDNA and nDNA datasets using MP criteria withheuristic searches, 1000 random addition sequence replicates,and tree-bisection-reconnection (TBR) with all bases equallyweighted (PAUP*; Swofford, 2001). Trees were rooted usingPseudacris crucifer and P. maculata in all cases. Multistate data weretreated as polymorphisms and gaps were treated as a fifth base.Parsimony trees were evaluated using summary values reported
by PAUP*. Support for the resultant phylogeny was evaluated usingthe bootstrap (Felsenstein, 1985) with 100 replicates, full heuristicsearch, simple step-wise addition option, and TBR as implementedin PAUP* (Swofford, 2001).
Likelihood analyses were performed using GARLI 0.951 (Zwickl,2006). Model choice was based on the AIC (Posada and Buckley,2004) using the software MrModeltest 2.2 (Nylander, 2004). Anal-yses were terminated after 10,000 generations without animprovement in the overall tree topology. Two likelihood analyseswere performed to ensure convergence. Support was evaluatedusing 100 bootstrap repetitions (Felsenstein, 1985), with each rep-etition terminated after 5000 generations without a topologyimprovement.
We conducted Bayesian analyses using MrBayes 3.0b4 (Ron-quist and Huelsenbeck, 2003) on the following data sets: cyto-chrome b, partitioned by codon; nDNA data with exonspartitioned by gene and by codon with a separate partition forthe cryB intron; and combined mtDNA and nDNA with pro-tein-coding gene fragments partitioned by gene and codon, anda separate partition for the cryB intron. CryB indels were codedas present/absent and included as a separate partition using theMK model (Lewis, 2001). Model choice was based on the AIC(Posada and Buckley, 2004) using MrModeltest 2.2 (Nylander,2004). Bayesian settings included random starting trees and de-fault priors except the rate prior, which was set to ‘‘variable”.Markov chain Monte Carlo was run with four chains for2,000,000 generations. Trees were sampled every hundred gener-
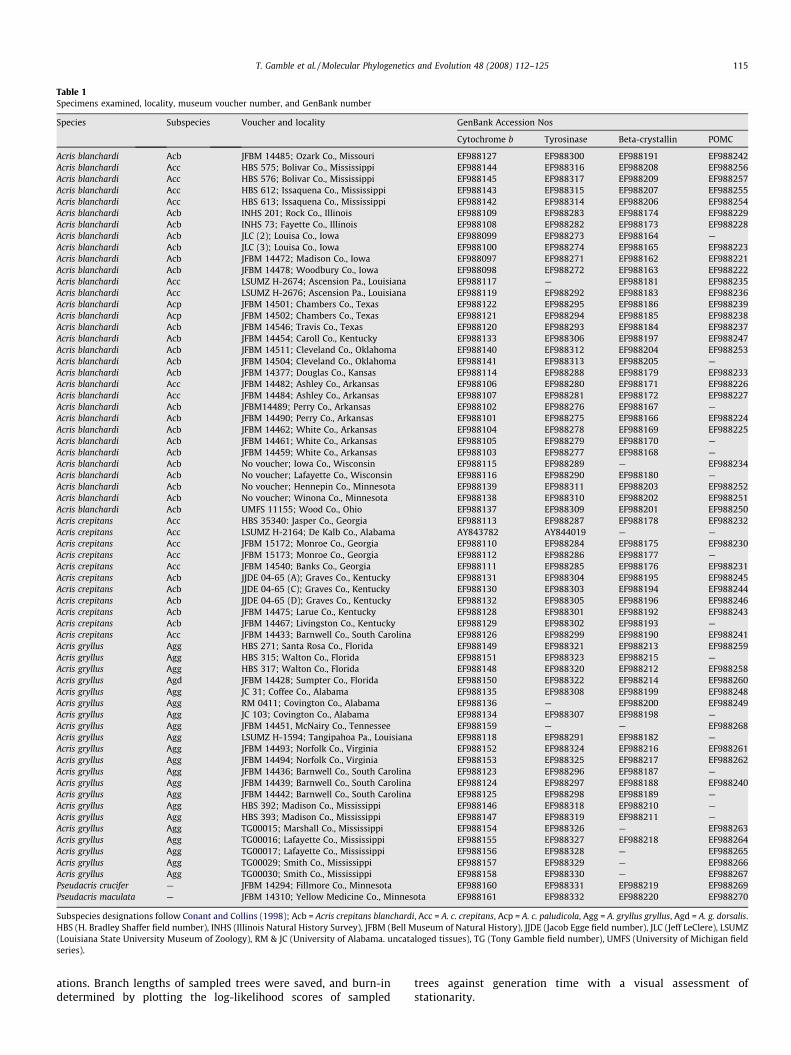
Table 1Specimens examined, locality, museum voucher number, and GenBank number
Species Subspecies Voucher and locality GenBank Accession Nos
Subspecies designations follow Conant and Collins (1998); Acb = Acris crepitans blanchardi, Acc = A. c. crepitans, Acp = A. c. paludicola, Agg = A. gryllus gryllus, Agd = A. g. dorsalis.HBS (H. Bradley Shaffer field number), INHS (Illinois Natural History Survey), JFBM (Bell Museum of Natural History), JJDE (Jacob Egge field number), JLC (Jeff LeClere), LSUMZ(Louisiana State University Museum of Zoology), RM & JC (University of Alabama. uncataloged tissues), TG (Tony Gamble field number), UMFS (University of Michigan fieldseries).
T. Gamble et al. / Molecular Phylogenetics and Evolution 48 (2008) 112–125 115
ations. Branch lengths of sampled trees were saved, and burn-indetermined by plotting the log-likelihood scores of sampled
trees against generation time with a visual assessment ofstationarity.
Table 2Primers used in this study
Primer name Primer sequence (50–30) Source
Cytochrome bMVZ16-H AAA TAG GAA RTA TCA YTC TGG TTT RAT Moritz et al. (1992)MVZ15-L GAA CTA ATG GCC CAC ACW WTA CGN AA Moritz et al. (1992)
Tyrosinase, exon 1Fx3 TCA TCT CCC GYC AYC TTC TGG AT Vences et al. (2003)1G TGC TGG GCR TCT CTC CAR TCC CA Bossuyt and Milinkovitch (2000)
POMC, exon 3POMC1 GAA TGT ATY AAA GMM TGC AAG ATG GWC CT Wiens et al. (2005)POMC-R GGG TCA TGA ATC CTC CRT ATC T This study
CRYB, intron 4CRYB1Ls CGC CTG ATG TCT TTC CGC C Dolman and Phillips (2004)CRYB2Ls CCA ATG AAG TTC TCT TTC TCA A Dolman and Phillips (2004)
116 T. Gamble et al. / Molecular Phylogenetics and Evolution 48 (2008) 112–125
We used Partitioned Bremer Support to calculate the relativecontribution of each gene to a given clade on the combined phylog-eny (Baker and DeSalle, 1997). Partitioned Bremer Support was cal-culated using TreeRot (Sorenson, 1999) with data partitioned bygene.
2.4. Hypothesis testing
To test whether current subspecies designations were sup-ported by our data, we tested subspecies validity within A. crepi-tans by comparing the maximum likelihood tree from thecombined data against trees constrained to reflect monophyly ofA. c. crepitans, A. c. blanchardi, and A. c. paludicola (subspecificassignment is listed in Table 1). Because morphological character-istics used to define A. crepitans subspecies perform poorly at dif-ferentiating subspecies (McCallum and Trauth, 2006) we assignedindividuals to subspecific taxa based on locality using the mapfrom Conant and Collins (1998). An additional tree was constrainedto reflect two lineages within A. crepitans taking into account therecent findings of Rose et al. (2006) that synonomizes A. c. paludi-cola with A. c. blanchardi. Alternative phylogenetic hypotheseswere constructed using the constraint function in GARLI 0.951(Zwickl, 2006) which finds the maximum likelihood tree given aparticular constraint. The Shimodaira–Hasegawa test (SH test, Shi-modaira and Hasegawa, 1999) was implemented in PAUP� with1000 Resampling Estimated Log Likelihood bootstraps (Kishinoet al., 1990).
2.5. Genetic divergence and species limits
We generated rooted phylograms of each nuclear gene data par-tition using neighbor-joining (NJ) in PAUP*. Viewing the nucleargene data as NJ networks allows clustering of alleles with respectto the mtDNA lineages, but does not necessarily represent the truephylogeny (Sota and Sasabe, 2006).
Net between-group mean distances between all of the majormtDNA lineages were determined using the formula: d = dxy-(dx + dy)/2 where dx and dy are the mean distances within groupsx and y and dxy is the average distance between groups x and y(Nei and Li, 1979). This correction is important for recently di-verged lineages to ensure that divergences are not overestimated(Edwards, 1997). Mean sequence divergence within each majorclade was calculated using MEGA3 (Kumar et al., 2004). Distancesand standard error, using 500 bootstrap replicates, were calculatedusing the Kimura 2-parameter (K2P) model in MEGA3.
Population subdivision (FST) among mtDNA lineages was esti-mated using pairwise distances (Reynolds et al., 1983) under theK2P model (Arlequin 2.0, Schneider et al., 2000). We tested the nullhypotheses of no population differentiation among the major
mtDNA lineages for all four loci separately (FST = 0) using the per-mutation test. Significant FST values provide evidence of reducedgene flow regardless of monophyly, and can thus provide addi-tional insight into the validity of non-monophyletic groups as dis-tinct evolutionary lineages (Hudson et al., 1992).
3. Results
3.1. Phylogenetic analyses
The cytochrome b fragment (725 base pairs in length) was se-quenced for all 64 Acris individuals and Pseudacris outgroups andhad 281 variable sites of which 199 were parsimony informative;within Acris, 225 characters were variable and 48 were parsimonyinformative. Models of sequence evolution, as determined by theAIC were: k80+I (1st codon); F81+I (2nd codon); and GTR+G (3rdcodon). The tyrosinase gene fragment (446 base pairs) was se-quenced for 61 Acris individuals and outgroups and had 104 vari-able sites of which 55 were parsimony informative; within Acris,49 characters were variable and 29 were parsimony informative.Models of sequence evolution, as determined by the AIC were:SYN+I (1st codon); K80+I (2nd codon); and HKY+G (3rd codon).The POMC gene fragment (487 base pairs) was sequenced for 48Acris individuals and outgroups. A total of 60 sites were variableof which 27 were parsimony informative; within Acris, 19 charac-ters were variable and 11 were parsimony informative. Models ofsequence evolution, as determined by the AIC were: F81 (1st co-don); HKY (2nd codon); and GTR+G (3rd codon). The cryB intron(263 base pairs) was sequenced for 57 Acris individuals and out-groups and had 123 variable sites of which 76 were parsimonyinformative; within Acris, 18 characters were variable and 12 wereparsimony informative. The model of sequence evolution, as deter-mined by the AIC was: HKY+G. The model of sequence evolution, asdetermined by the AIC, for the combined dataset was: GTR+I+G.
Cytochrome b: The consensus Bayesian tree (harmonic mean�lnL = 3643.8930), the maximum likelihood tree (�lnL3322.5241), and parsimony trees (>10,000 equally parsimonioustrees, TL = 550, CI = 0.675, RI = 0.940, RC = 0.634) all recovered amonophyletic Acris and reciprocally monophyletic A. gryllus andA. crepitans with additional genetic structure within each of thoseclades (Fig. 3). All analyses recovered three clades within A. crepi-tans: the A. blanchardi clade, distributed west of the MississippiRiver and north of the Ohio River with several populations in wes-tern Mississippi and one individual from northern Kentucky thatappear on the southeastern side of this tentative boundary; A. crep-itans Western clade, composed of specimens from southwesternKentucky; and A. crepitans Eastern clade, containing specimensfrom Alabama, Georgia, and South Carolina. The A. blanchardi cladewas the sister taxon to the A. crepitans clade in the Bayesian and
AR, White Co., JFBM 14461AR, Ashley Co., JFBM 14484
MS, Bolivar Co., HBS575
TX, Chambers Co., JFBM 14501
MN, Hennepin Co.
GA, Banks Co., JFBM 14540
FL, Santa Rosa Co., HBS271
Pseudacris maculata
SC, Barnwell Co., JFBM 14442
MN, Winona Co.MO, Ozark Co., JFBM 14485
IL, Rock Island Co., INHS 201
Pseudacris crucifer
VA, Norfolk Co., JFBM 14494
MS, Issaquena Co., HBS100613
LA, Ascension Pa., LSUMZ H-2674
MS, Marshall Co., TG00015
MS, Smaith Co., TG00029
MS, Madison Co., HBS 100392
WI, Iowa Co.
MP/ML/BPP
Acris gryllusWestern clade
Acris gryllusEastern clade
Acris crepitansWestern clade
Acris crepitansEastern clade
Acris blanchardi
Fig. 3. Bayesian phylogeny of the frog genus Acris, using mitochondrial cytochrome b data. Nodal support, parsimony and likelihood bootstrap (100 replicates) and Bayesianposterior probabilities (BPP < 0.50 not shown), are indicated. Clade names are shown on the right.
T. Gamble et al. / Molecular Phylogenetics and Evolution 48 (2008) 112–125 117
parsimony analyses but this relationship was not recovered withthe maximum likelihood analysis. Within A. gryllus we recoveredEastern and Western clades. The Eastern A. gryllus clade containedspecimens from South Carolina, Virginia, Alabama, and Florida. TheWestern A. gryllus clade was composed of specimens from Louisi-ana, Mississippi, and Tennessee.
Nuclear gene data: The combined nuclear gene analyses (Fig. 4)recovered a monophyletic Acris and well-supported A. gryllus (interms of Bayesian posterior probabilities and maximum likelihoodbootstrap values), but otherwise recovered little structure amongthe parsimony (>10,000 equally parsimonious trees; TL = 363,CI = 0.791, RI = 0.915, RC = 0.724), maximum likelihood (�lnL3286.5774), and Bayesian analyses (harmonic mean �lnL3294.6410). The topology was characterized by a relatively undif-ferentiated collection of Acris blanchardi samples with no evidenceof monophyly, a monophyletic, but weakly supported A. crepitans,and a monophyletic and well-supported A. gryllus. The strong geo-graphic structure observed in cytochrome b data within A. crepitansand A. gryllus was not observed in the nDNA data. However, a Geor-gia-plus-South Carolina clade of A. crepitans was similar to the A.
crepitans Eastern mtDNA clade. The two A. gryllus clades, consistingof samples from Mississippi plus Tennessee, and from Alabama,Florida, Louisiana, South Carolina, and Virginia were similar in con-tent to the A. gryllus Western and Eastern clades, respectively,(with the POMC NJ network, discussed below, showing a clusteringof samples from the A. gryllus Western clade).
Combined data: The parsimony trees (>10,000 equally parsi-monious trees, TL = 1058, CI = 0.741, RI = 0.928, RC = 0.688), themaximum likelihood tree (�lnL 7019.2932), and the consensusBayesian tree (harmonic mean �lnL = �7073.93) recoveredwell-supported (Figs. 5 and 6), reciprocally monophyletic A.gryllus and A. crepitans + A. blanchardi. Overall, the topologywas similar to the cytochrome b phylogenies (Fig. 3), althoughfor a few clades (Eastern and Western A. gryllus, and A. crepi-tans) support levels increased with the addition of the nucleardata. The primary difference between parsimony + maximumlikelihood topologies and the Bayesian analysis was theplacement of the A. gryllus from Sumpter County in peninsularFlorida. The Bayesian analyses place the specimen from penin-sular Florida as the sister taxon to a clade consisting of
Fig. 4. Bayesian phylogeny of the frog genus Acris, from a combined analysis of the nuclear gene fragments: tyrosinase, POMC, and beta-crystallin. Nodal support, parsimonyand likelihood bootstrap (100 replicates) and Bayesian posterior probabilities (BPP < 0.50 not shown), are indicated. Clade names are shown on the right.
118 T. Gamble et al. / Molecular Phylogenetics and Evolution 48 (2008) 112–125
Western + Eastern A. gryllus specimens, whereas the parsimonyand maximum likelihood analyses grouped the Sumpter County,Florida specimen with the eastern A. gryllus as in the mtDNAanalyses. Additionally, the model-based methods (maximumlikelihood and Bayesian analyses) had no nodal support forthe relationship between A. crepitans and A. blanchardi. Onlythe combined parsimony analyses produced strong bootstrapvalues supporting the sister-group relationship between thesetwo clades.
Partitioned Bremer Support values (Fig. 7) indicate overall sup-port provided by each gene for a given node. The sum of parti-tioned support values at a node from each partition equals theBremer support value from the combined analysis at that node (Ba-ker and DeSalle, 1997). Negative values indicate conflicting supportat a node and values of zero indicate neither support nor conflictfor a node. Overall, the nuclear loci provided strong support forthe monophyly of Acris (node A, Fig. 7) and limited support or con-flict for all other groups, with the strongest support for the mono-phyly of A. gryllus Western and Eastern clades. Across all clades,POMC often supports the mtDNA results, while the other two nu-clear genes are frequently in conflict. Cytochrome b data providestrong support for most clades, although support was low for Wes-tern and Eastern A. gryllus clades.
3.2. Hypothesis testing
The constrained A. crepitans subspecies trees had significantlylower likelihood scores than the unconstrained combined-datamaximum likelihood tree (3 subspecies: difference in�lnL = 165.75637, P = <0.001; 2 subspecies: difference in�lnL = 133.28955, P = <0.001). The SH test strongly rejected thehypothesis that each A. crepitans subspecies, sensu Conant and Col-lins (1998) represent a distinct evolutionary lineage.
3.3. Genetic divergence and species limits
Neighbor-joining networks of nuclear loci (Fig. 8) show patternsindicating incomplete lineage sorting as evidenced by their lack ofmonophyly among mtDNA-defined clades. Tyrosinase and POMCshow individual clusters largely congruent with the A. gryllus, A.crepitans, and A. blanchardi clades. The cryB network indicatedexclusivity between A. gryllus and A. crepitans + A. blanchardi cladesbut not between the A. crepitans and A. blanchardi clades. Tyrosi-nase and cryB analyses recover no structure between Eastern andWestern A. gryllus clades, while analyses of POMC recovered eachclade as exclusive. When all three nuclear genes are considered,there are no shared alleles between the Eastern and Western A.
MS, Madison Co., HBS 100393TN, McNairy Co., JFBM 14451
MS, Smith Co., TG00030LA, Tangipahoa Pa., LSUMZ H-1594
MS, Lafayette Co., TG00017
MS, Lafayette Co., TG00016
MS, Marshall Co., TG00015MS, Smith Co., TG00029
MS, Madison Co., HBS 100392 Acris gryllusWestern clade
77/58
100/100
73/6360/60
80/69
100/97
100/99
100/-
91/65
100/95
100/99
100/91
0.03 substitutions/site
Fig. 5. Maximum likelihood phylogeny of the frog genus Acris, from a combined analysis of the nuclear genes tyrosinase, POMC, and cryB and the mitochondrial genecytochrome b. Nodal support, parsimony and likelihood bootstrap (100 replicates), is indicated. Clade names are shown on the right. Photo by T. Gamble.
T. Gamble et al. / Molecular Phylogenetics and Evolution 48 (2008) 112–125 119
gryllus clades whereas Western and Eastern A. crepitans cladesshared alleles at all nuclear loci.
Net between-group mean sequence divergences for all loci be-tween major clades are provided in Table 3. Sequence divergencesnot shown in Table 3 included the net between-group mean se-quence divergences using the K2P model for cytochrome b be-tween the A. crepitans + blanchardi clade and A. gryllus (0.129,SE = 0.014) and between the A. crepitans clade and A. blanchardi(0.097, SE = 0.012). Population subdivision, measured as pairwiseFST, was significantly different from zero in all pairwise compari-sons with the exception of Eastern A. crepitans �Western A. crepi-
tans for the tyrosinase dataset and Eastern A. gryllus �Western A.gryllus for the cryB dataset (Table 3).
4. Discussion
4.1. Phylogenetic analyses
Our combined analyses provide a robust phylogeny for thegenus Acris. The combined data topology was strongly concordantwith the cytochrome b topology, which is not unexpected given thestrong phylogenetic signal from the mtDNA (Fig. 7). Differences in
MS, Madison Co., HBS 100392Acris gryllusWestern clade
Acris gryllusEastern clade
Acris crepitansWestern clade
Acris crepitansEastern clade
Acris blanchardi
Acris blanchardi
0.69
Fig. 6. Bayesian phylogeny of the frog genus Acris, from a combined analysis of the nuclear genes tyrosinase, POMC, and cryB and the mitochondrial gene cytochrome b.Bayesian posterior probabilities (BPP < 0.50 not shown) are indicated. Clade names are shown on the right. Photo by T. Gamble.
120 T. Gamble et al. / Molecular Phylogenetics and Evolution 48 (2008) 112–125
resolution seen between the nuclear and mitochondrial datasetsseemed to be due to incomplete lineage sorting and/or slower sub-stitution rates in the nDNA, rather than any obvious conflict be-tween the two data partitions. In some studies, positivelydifferent results have been found between nuclear and mitochon-drial datasets, which are often interpreted as indicating introgres-sive hybridization or natural selection on mtDNA. These conflictingsignals have led many authors to advocate the use of nuclear genesto provide independent estimates of phylogeny (e.g. Dettman et al.,2003; Gaines et al., 2005; Giannasi et al., 2001; Prytchitko andMoore, 1997). Here, we saw little conflict, and some increase inresolution with the addition of nDNA (Cunningham, 1997; Gaineset al., 2005; Rokas et al., 2003; Wiens, 1998). The posterior proba-bility for the node connecting A. crepitans to A. blanchardi de-creased in the combined Bayesian analyses (0.69) compared tothe mtDNA only Bayesian analyses (0.96). This decrease in nodalsupport may be related to conflict among the data partitions at thatnode, particularly from the tyrosinase gene (Fig. 8). Post hoc exam-
ination of NJ networks and FST values were consistent with thecombined phylogenetic analyses, and the combination of NJ net-works and FST methods provide an intuitive means of evaluatingdata conflict and interpreting results.
4.2. Species limits
The phylogenetic hypothesis recovered in the present analy-sis identifies several lineages within what is called A. crepitans,but their geographic distributions do not precisely match therecognized A. crepitans subspecies (sensu Conant and Collins,1998). The primary division of Acris among A. crepitans, A.blanchardi, and A. gryllus clades is well-supported. Cytochromeb distances between all three lineages are comparable to dis-tances between other recognized anuran sister species, whichcan vary from 7% to 15% (Austin et al., 2002; García Parísand Jockusch, 1999; Shaffer et al., 2004; Vences et al., 2005).A complete synonymy for the genus Acris was presented in
Fig. 7. Partitioned Bremer Support for nodes delimiting major Acris clades. Nodes are indicated on the maximum likelihood phylogram of the combined data to the right. Thetopology of the phylogram is the same as in Fig. 5.
Tyrosinase 0.001 substitutions/site
POMC0.0005 substitutions/site
Acris gryllus East
Acris blanchardi
Acris crepitans West
Acris crepitans East
Acris gryllus West
Beta-crystallin0.0005 substitutions/site
Root
Root
Root
Fig. 8. Unrooted NJ networks of individual nuclear genes within the frog genus Acris. Circle shade represents an individual’s membership in the major clades from thecombined and cytochrome b analyses. Circle size indicates the relative number of individuals sharing a particular haplotype. The root, as determined from outgroup analysis,is indicated by the arrow.
T. Gamble et al. / Molecular Phylogenetics and Evolution 48 (2008) 112–125 121
Frost (2007), and the oldest name available for populationswest of the Mississippi River is A. blanchardi. Based on our
combined mitochondrial and nuclear analyses we thereforepropose to elevate A. blanchardi (Harper, 1947) to species status
Table 3On diagonals (in bold) are within group average genetic distances [and standard error] for each locus
Gene Species/Clade A. blanchardi A. crepitans West A. crepitans East A. gryllus East A. gryllus West
Cytochrome b A. blanchardi 0.008 [0.001] 0.95055 0.95908 0.9571 0.97149A. crepitans West 0.114 [0.014] 0.009 [0.002] 0.93569 0.94119 0.96997A. crepitans East 0.130 [0.014] 0.093 [0.011] 0.006 [0.002] 0.9437 0.98104A. gryllus East 0.170 [0.017] 0.194 [0.020] 0.173 [0.018] 0.013 [0.002] 0.71532A. gryllus West 0.141 [0.014] 0.161 [0.018] 0.144 [0.016] 0.019 [0.004] 0.041 [0.004]
Below each diagonal are net between group average genetic distances [and standard error] between populations. Above each diagonal are pairwise FST, based on pairwisedistance (all values significantly different from zero at P = 0.05, except those marked with an �). All distances estimated using the K2P model.
122 T. Gamble et al. / Molecular Phylogenetics and Evolution 48 (2008) 112–125
and retain A. crepitans for frogs in the eastern and central portions ofthe range (see Fig. 2).
Previous allozyme, ecological, and mate-choice data provideadditional support for this taxonomic decision. Dessauer and Nevo(1969) found that four of 20 proteins surveyed showed populationsubstructure within A. crepitans sensu lato with western and east-ern subgroups that approximately correspond to our A. crepitansand A. blanchardi lineages. An examination of habitat preferencesand mate choice (Nevo and Capranica, 1985), indicated that A. c.crepitans and A. c. blanchardi may be incipient ecological speciesalthough the proposed geographic distributions better match A.crepitans subspecies (sensu Conant and Collins, 1998) because ofreliance on call data.
Morphological data, which have historically been used to defineA. crepitans subspecies, provide a somewhat mixed signal with re-spect to variation within A. crepitans. Although originally used todelimit subspecies, a recent analysis indicates that the tradition-ally-used morphological features do not adequately differentiatelineages within A. crepitans sensu lato. Thus, McCallum and Trauth(2006) found the morphological characters used to diagnose A. c.blanchardi: ‘‘greater bulk”; ‘‘somewhat more extensive webbingof the toes”; and ‘‘the more extensive dusky area on the posteriorface of the femora in the vicinity of the vent” (Harper, 1947), werenot well defined and did not consistently discriminate betweenspecimens of A. c. blanchardi and A. c. crepitans. Based on their anal-yses, McCallum and Trauth (2006) recommended synonymizing A.c. blanchardi and A. c. crepitans. While there has been no morpho-logical reanalysis of A. c. paludicola, the coastal subspecies was sim-ilarly defined by qualitative characters including color, pattern, toedisk size, and extent of toe webbing (Burger et al., 1949). However,recent mtDNA analysis (Rose et al., 2006), consistent with ourmtDNA results, indicates that A. c. paludicola is nested within A.c. blanchardi and does not warrant subspecific status.
Reciprocal monophyly with mtDNA satisfies the requirementsof lineage-based species concepts (de Queiroz, 1998; Wiens andPenkrot, 2002), as long as the true species tree is reflected inmtDNA gene trees. The inclusion of nuclear gene data allowed usto test the validity of identified mitochondrial lineages as defensi-ble species. Monophyly or exclusivity at a majority of nucleargenes is not necessarily a reasonable assumption in recently and/or rapidly radiating lineages (Hudson and Coyne, 2002), where
the time to monophyly of nuclear loci (coalescence) is expectedto be great, and a strict reliance on monophyly may often overlookrecently-derived species (Shaffer and Thomson, 2007). Reciprocalmonophyly, at least with mtDNA, for A. blanchardi, A. crepitans,and A. gryllus suggests that these taxa represent good lineage-based species. Shared alleles at all the nuclear loci between Easternand Western A. crepitans clades suggest either incomplete lineagesorting or continued gene flow between populations. In either case,Western and Eastern A. crepitans lineages are distinct based on FST/genetic distance approaches (Table 3), but additional sampling andpreferably, call analyses, are needed to determine if they warrantspecies status. The same is true for Eastern and Western A. gryllusgroups, which showed significant FST values for mtDNA and two ofthree nuclear loci (Table 3). Lack of structure between Eastern andWestern A. gryllus for beta-crystallin as well as shallow mtDNAdivergence suggests, as with A. crepitans, additional sampling andcall analyses are needed before a firm taxonomic decision can bereached.
4.3. Biogeography
The biogeographic pattern evident in the A. crepitans + A. blanc-hardi group (western and eastern clades) is consistent with manyother co-distributed vertebrate species such as ratsnakes (Burbrinket al., 2000), spring peepers (Austin et al., 2002), chorus frogs (Lem-mon et al., 2007a,b), painted turtles (Starkey et al., 2003), andshort-tailed shrews (Brant and Orti, 2003). The Mississippi andOhio Rivers form the primary eastern boundary for A. blanchardiwith A. crepitans found south of the Ohio River and east of the low-er Mississippi River. The confluence of the Mississippi and OhioRivers is an area where a number of taxonomic groups have mul-ti-lineage contact (Austin et al., 2002; Starkey et al., 2003; Lemmonet al., 2007a,b). The southern Mississippi River has been shown tobe a prominent barrier to gene flow in numerous species includingfish, ratsnakes, spiny lizards, and shrews (Berendzen et al., 2003;Brant and Orti, 2003; Burbrink et al., 2000; Leache and Reeder,2002; Mayden, 1988; Moriarty and Cannatella, 2004) although ithas not been absolute and there are several taxa where easternhaplotypes occur on the west side of the river or vice versa (Bur-brink et al., 2000; Shaffer and McKnight, 1996; Starkey et al.,2003; Lemmon et al., 2007a,b). In our dataset, for example, cricket
T. Gamble et al. / Molecular Phylogenetics and Evolution 48 (2008) 112–125 123
frogs from Issaquena and Bolivar counties in Mississippi, east of theMississippi River, are genetically part of A. blanchardi. Further sam-pling is needed to determine if these populations are the result of a‘leaky’ barrier to gene flow due to the dynamic boundaries of riv-ers, or a more widespread distribution of A. blanchardi haplotypeseast of the Mississippi River. Incomplete geographic sampling inthe south-eastern US made it difficult to ascertain precisely wherethe boundary occurred between Western and Eastern A. crepitansclades. The Mobile Bay and Tombigbee River, like the MississippiRiver, have been proposed to be a significant biogeographic bound-ary (Gill et al., 1993; Lawson, 1987) and may be a potential bound-ary between Eastern and Western A. crepitans clades.
Additional phylogeographic structure was found within A. gryl-lus. Most obvious is the split between Eastern and Western haplo-types, which appear to be separated by the Mobile basin. Theposition of the Sumpter County, Florida frog as either part of theEastern A. gryllus clade or sister taxon to the Eastern + Western A.gryllus clades suggests that additional sampling from peninsularFlorida is needed. The existence of a third A. gryllus clade from pen-insular Florida would not be too surprising given Florida’s biogeog-raphy and the morphological distinctness of Florida specimens(Conant and Collins, 1998).
4.4. Call evolution in the genus Acris
Nevo and Capranica (1985) grouped cricket frogs into three dis-tinct groups based on multivariate analysis of 16 call variables. Thedistinction among calls was attributed to environmental andacoustic differences in the three broad habitat types occupied bycricket frogs: grasslands (A. c. blanchardi, sensu Conant and Collins,1998), deciduous woodlands (A. c. crepitans, sensu Conant and Col-lins, 1998), and meadows within pine forests (A. gryllus). These dif-ferent call types were used as evidence for subspecific boundarieswithin A. crepitans sensu lato (Nevo and Capranica, 1985). In a moredetailed analysis, Ryan and Wilczynski (1991) found a similar pat-tern in cricket-frog calls across a longitudinal environmental gradi-ent in east Texas, with habitat type (forest or open habitats) havingthe greatest influence on call characteristics.
Based on our new phylogenetic results, we asked whether callvariation within Acris now appears to reflect lineages, habitats, orboth. Although we did not record any call data ourselves, Nevoand Capranica’s (1985) data indicate that both A. gryllus and A.crepitans have unique calls that correspond with, and help to diag-nose these genetic lineages. However, A. blanchardi, as diagnosedby our DNA analyses, contains both the ‘‘grassland” (A. c. blanchardisensu Conant and Collins, 1998) and ‘‘deciduous woodland” (A. c.crepitans sensu Conant and Collins, 1998) call types identified bythese authors. Calls of cricket frogs from the forested areas of eastTexas and Louisiana, part of the A. blanchardi clade, are of particularinterest. Calls from cricket frogs in this region show similaritieswith calls from cricket frogs further east from Alabama, Georgia,New Jersey, and New York, which comprise the A. crepitans cladein our analysis. This apparent polymorphism of A. blanchardi callswas the source of much of the taxonomic confusion in the genus.At this point, we cannot say whether the two call types found with-in A. blanchardi represent distinct, but very recently-derived evolu-tionary lineages or a true within-species polymorphism.
4.5. Conservation
We used mtDNA monophyly along with nuclear gene FST dataand the presence of private nuclear alleles to support our recogni-tion of A. blanchardi as a full species. Such taxonomic decisions,resulting from phylogenetic analyses, have consequences outsidethe realm of systematic biology. Conservation decisions are oftenmade based on the assumption that named taxonomic units repre-
sent evolutionary lineages (Mayden and Wood, 1995). The failureto diagnose biological diversity can hamper conservation efforts,as well as basic scientific inquiry (Mayden and Wood, 1995; Met-calf et al., 2007). The northern cricket frog (A. blanchardi) hasexhibited dramatic population declines in the northern portion ofits range (Baker, 1997; Gray and Brown, 2005; Hammerson andLivo, 1999; Hay, 1998; Lannoo, 1998; Lehtinen and Skinner,2006). This phenomenon first came to light in the 1970s, and hascontinued to the present (Hay, 1998; Lehtinen, 2002; Vogt,1981). These declines have been characterized by the disappear-ance of cricket frogs from apparently suitable habitat with no con-current decline in populations of other amphibian species (Lannoo,1998). Possible causes include climate (Hay, 1998; Irwin, 2005),habitat alteration (Lannoo, 1998), pollution (Reeder et al., 2005),and habitat fragmentation (Hay, 1998). Understanding the biolog-ical diversity within northern cricket frogs is an essential step inthe deeper understanding of the patterns, causes, and reversal ofthese declines. Although we cannot condone the recognition ofso-called ‘‘conservation species” (Gamauf et al., 2005), the recogni-tion of valid, defensible cryptic species diversity within an already-recognized declining taxon implies that each of the new species’distributions will be smaller than that of the formerly recognizedspecies. In that sense, each newly recognized species must be atgreater risk than was formerly considered for the more inclusivetaxon. Recent work on the severely-declining flatwoods salaman-der, Ambystoma cingulatum/bishopi, is a case in point (Pauly et al.,2007). Recognizing A. blanchardi, where its northerly range encom-passes the majority of the most severe Acris declines, highlights thedelicate status of this distinct evolutionary lineage.
5. Conclusions
Our data indicate that genetic diversity within the genus Acris isnot reflected in its current taxonomy. As a result, we recognizethree distinct species within the genus: A. blanchardi, A. crepitans,and A. gryllus. Additional sampling across the southeastern US willbe needed to determine the extent of the diversity and geograph-ical range of Acris species. Further work is also needed to evaluatethe genetic diversity within A. crepitans and the status of A. gryllusfrom peninsular Florida. A reexamination of morphology and calldata in light of results presented here would provide additional in-sight into the diversity and evolution of this genus.
Acknowledgments
We would like to thank A. Chase, K. Dahl, and N. Weinstein forhelp in the laboratory. J. Caldwell, J.J.D. Egge, J. Gerholdt, B. Hay, L.Irwin, J. Jensen, M. Lanoo, J. LeClere, R. Lehtinen, Louisiana StateUniversity Museum of Natural Science Collection of Genetic Re-sources, J. MacGregor, R. McInnes, B. Metts, J. Moriarty, E. Mori-arty-Lemmon, B. Nagle, J. Parmelee, J. Pramuk, C. Philips, L.Rissler, and J. Simmons generously provided specimens. Fundingwas provided by a grant to AMS by the Minnesota Department ofNatural Resources; the Department of Fisheries, Wildlife and Con-servation Biology, University of Minnesota; Bell Museum of Natu-ral History, University of Minnesota; the National ScienceFoundation; and the UC Davis Agriculture Experiment Station.
References
Austin, J.D., Lougheed, S.C., Neidrauer, L., Chek, A.A., Boag, P.T., 2002. Crypticlineages in a small frog: the post-glacial history of the spring peeper, Pseudacriscrucifer (Anura: Hylidae). Mol. Phylogenet. Evol. 25, 316–329.
Baker, R.H., DeSalle, R., 1997. Multiple sources of character information and thephylogeny of wild Drosophilids. Syst. Biol. 46, 654–673.
Baker, R.J., 1997. Revising Minnesota’s list of endangered and threatened species:amphibians and reptiles. In: Moriarty, J.J., Jones, D. (Eds.), Minnesota’s
124 T. Gamble et al. / Molecular Phylogenetics and Evolution 48 (2008) 112–125
Amphibians and Reptiles: Their Conservation and Status. Serpent’s Tale NaturalHistory Book Distributors, Lanesboro, pp. 11–14.
Ballard, J.W.O., Rand, D.M., 2005. The population biology of mitochondrial DNA andits phylogenetic implications. Ann. Rev. Ecol. Syst. 36, 621–642.
Ballard, J.W.O., Whitlock, M.C., 2004. The incomplete natural history ofmitochondria. Mol. Ecol. 13, 729–744.
Berendzen, P.B., Simons, A.M., Wood, R.W., 2003. Phylogeography of the northernhogsucker, Hypentelium nigricans (Teleostei: Cypriniformes): genetic evidencefor the existence of the ancient Teays River. J. Biogeogr. 30, 1139–1152.
Bossuyt, F., Milinkovitch, M.C., 2000. Convergent adaptive radiations in Madagascanand Asian ranid frogs reveal covariation between larval and adult traits. Proc.Natl. Acad. Sci. USA 97, 6385–6590.
Brant, S., Orti, G., 2003. Phylogeography of the northern short-tailed shrew, Blarinabrevicauda (Insectivora: Soricidae): past fragmentation and postglacialcolonization. Mol. Ecol. 12, 1435–1449.
Burbrink, F.T., Lawson, R., Slowinski, J.B., 2000. Mitochondrial DNA phylogeographyof the polytypic North American ratesnake (Elaphe obsoleta): a critique of thesubspecies concept. Evolution 54, 2107–2118.
Burger, W.L., Smith, P.W., Smith, H.M., 1949. Notable records of reptiles andamphibians in Oklahoma, Arkansas, and Texas. J. Tennessee Acad. Sci. 24, 130–134.
Chantell, C.J., 1967. The osteology of Acris and Limnaoedus (Amphibia: Hylidae). Am.Midl. Nat. 79, 169–182.
Chek, A.A., Lougheed, S.C., Bogart, J.P., Boag, P.T., 2001. Perception and history:molecular phylogeny of a diverse group of neotropical frogs, the 30-chromosome Hyla (Anura: Hylidae). Mol. Phylogenet. Evol. 18, 370–385.
Conant, R., Collins, J.T., 1998. A Field Guide to Reptiles and Amphibians Eastern andCentral North America, third ed. Houghton Mifflin Co., Boston.
Cunningham, C.W., 1997. Can three incongruence tests predict when data should becombined? Mol. Biol. Evol. 14, 733–740.
de Queiroz, K., 1998. The general lineage concept of species, species criteria, and theprocess of speciation: a conceptual unification and terminologicalrecommendations. In: Howard, D.J., Berlocher, S.H. (Eds.), Endless Forms:Species and Speciation. Oxford University Press, Oxford, pp. 57–75.
de Quieroz, K., 2005. Different species problems and their resolution. Bioessays 27,1263–1269.
Dessauer, H.C., Nevo, E., 1969. Geographic variation of blood and liver proteins incricket frogs. Biochem. Genet. 2, 171–188.
Dettman, J.R., Jacobson, D.J., Taylor, J.W., 2003. A multilocus genealogical approachto phylogenetic species recognition in the model eukaryote Neurospora.Evolution 57, 2703–2720.
Dolman, G., Phillips, B., 2004. Single copy nuclear DNA markers characterized forcomparative phylogeography in Australian wet tropics rainforest skinks. Mol.Ecol. Notes 2004, 185–187.
Edwards, S.V., 1997. Relevance of microevolutionary processes to higher levelmolecular systematics. In: Mindell, D.P. (Ed.), Avian Molecular Systematics andEvolution. Academic Press, New York, pp. 251–278.
Egge, J.J.D., Simons, A.M., 2006. The challenge of truly cryptic diversity: diagnosisand description of a new madtom catfish (Ictaluridae: Noturus). Zool. Scr. 35,581–595.
Faivovich, J., Haddad, C.F.B., Garcia, P.C.A., Frost, D.R., Campbell, J.A., Wheeler, W.C.,2005. Systematic review of the frog family Hylidae, with special reference toHylinae: phylogenetic analysis and taxonomic revision. Bull. Am. Mus. Nat. Hist.294, 1–240.
Felsenstein, J., 1985. Confidence limits on phylogenies, an approach using thebootstrap. Evolution 39, 783–791.
Frost, D.R., 2007. Amphibian Species of the World: an Online Reference. Version 5.0(1 February, 2007). Electronic Database accessible at http://research.amnh.org/herpetology/amphibia/index.php. American Museum of Natural History, NewYork, USA.
Funk, D.J., Omland, K.E., 2003. Species-level paraphyly and polyphyly: frequency,causes, and consequences, with insights from animal mitochondrial DNA. Annu.Rev. Ecol. Evol. Syst. 34, 397–423.
Gaines, C.A., Hare, M.P., Beck, S.E., Rosenbaum, H.C., 2005. Nuclear markers confirmtaxonomic status and relationships among highly endangered and closelyrelated right whale species. Proc. R. Soc. Lond., B, Biol. Sci. 272, 533–542.
Gamauf, A., Gjershaug, J.O., Røv, N., Kvaløy, K., Haring, E., 2005. Species orsubspecies? The dilemma of taxonomic ranking of some South-East Asianhawk-eagles (genus Spizaetus). Bird Conserv. Int. 15, 99–117.
García París, M., Jockusch, E.L., 1999. A mitochondrial DNA perspective on theevolution of Iberian Discoglossus (Amphibia: Anura). J. Zool. (Lond.) 248, 209–218.
Giannasi, N., Malhotra, A., Thorpe, R.S., 2001. Nuclear and mtDNA phylogenies of theTrimeresurus complex: implications for the gene versus species tree debate.Mol. Phylogenet. Evol. 19, 57–66.
Gill, E.B., Mostrom, A.M., Mack, A.L., 1993. Speciation in North American chickadees.I. Patterns of mtDNA genetic divergence. Evolution 47, 195–212.
Gray, R.H., Brown, L.E., 2005. Decline of northern cricket frogs (Acris crepitans). In:Lanoo, M.J. (Ed.), Amphibian Declines: The Conservation Status of United StatesSpecies. University of California Press, Berkeley, California, USA, pp. 47–54.
Gray, R.H., Brown, L.E., Blackburn, L., 2005. Acris crepitans. In: Lanoo, M.J. (Ed.),Amphibian Declines: The Conservation Status of United States Species.University of California Press, Berlin, pp. 441–443.
Hammerson, G.A., Livo, L.J., 1999. Conservation status of the northern cricket frog(Acris crepitans) in Colorado and adjacent areas at the northwestern extent ofthe range. Herpetol. Rev. 30, 78–80.
Hanken, J., 1999. Why are there so many new amphibian species when amphibiansare declining? Trends Ecol. Evol. 14, 7–8.
Hare, M.P., 2001. Prospects for a nuclear gene phylogeography. Trends Ecol. Evol. 16,700–706.
Harper, F., 1947. A new cricket frog (Acris) from the middle western states. Proc.Biol. Soc. Wash. 60, 39–40.
Hay, R., 1998. Blanchard’s cricket frogs in Wisconsin: a status report. In: Lanoo, M.J.(Ed.), Status and Conservation of Midwestern Amphibians. University of IowaPress, Iowa City, pp. 79–82.
Huelsenbeck, J.P., Bull, J.J., Cunningham, C.W., 1996. Combining data in phylogeneticanalysis. Trends Ecol. Evol. 11, 152–158.
Hudson, R.H., Coyne, J.A., 2002. Mathematical consequences of the genealogicalspecies concept. Evolution 56, 1557–1565.
Hudson, R.H., Slatkin, M., Maddison, W.P., 1992. Estimation of levels of gene flowfrom DNA sequence data. Genetics 132, 583–589.
Irwin, J.T., 2005. Overwintering in northern cricket frogs (Acris crepitans). In: Lanoo,M.J. (Ed.), Amphibian Declines: The Conservation Status of United StatesSpecies. University of California Press, Berkeley, CA, pp. 55–58.
Jensen, J.B., 2005. Acris gryllus. In: Lanoo, M.J. (Ed.), Amphibian Declines: TheConservation Status of United States Species. University of California Press,Berkeley, CA, pp. 443–445.
Kishino, H., Miyata, T., Hasegawa, M., 1990. Maximum likelihood inference ofprotein phylogeny and the origin of chloroplasts. J. Mol. Evol. 31, 151–160.
Kumar, S., Tamura, K., Nei, M., 2004. MEGA3: integrated software for molecularevolutionary genetics analysis and sequence alignment. Brief. Bioinform. 5,150–163.
Lannoo, M.J., 1998. Amphibian conservation and wetland management in the upperMidwest: a catch-22 for the cricket frog? In: Lanoo, M.J. (Ed.), Status andConservation of Midwestern Amphibians. University of Iowa Press, Iowa City,pp. 330–339.
Lawson, R., 1987. Molecular studies of Thamnophiine snakes. 1. The phylogeny ofthe genus Nerodia. J. Herp. 21, 140–157.
Leache, A.D., Reeder, T.W., 2002. Molecular systematics of the Eastern Fence Lizard(Sceloporus undulatus): a comparison of parsimony, likelihood, and Bayesianapproaches. Syst. Biol. 51, 44–68.
Lehtinen, R.M., 2002. A historical study of the distribution of Blanchard’s cricket frog(Acris crepitans blanchardi) in southeastern Michigan. Herpetol. Rev. 33, 194–197.
Lehtinen, R.M., Skinner, A.A., 2006. The enigmatic decline of Blanchard’s cricketfrog: a test of the habitat acidification hypothesis. Copeia 2006, 159–167.
Lemmon, E.M., Lemmon, A.R., Cannatella, D.C., 2007a. Geological and climatic forcesdriving speciation in the continentally distributed trilling chorus frogs(Pseudacris). Evolution 61, 2086–2103.
Lemmon, E.M., Lemmon, A.R., Lee-Yaw, J.A., Collins, J.T., Cannatella, D.C., 2007b.Phylogeny-based delimitation of species boundaries and contact zones in thetrilling chorus frogs (Pseudacris). Mol. Phylogenet. Evol. 44, 1068–1082.
Lewis, P.O., 2001. A likelihood approach to estimating phylogeny from discretemorphological character data. Syst. Biol. 50, 913–925.
Mayden, R.L., 1988. Vicariance biogeography, parsimony, and evolution of NorthAmerican freshwater fishes. Syst. Zool. 37, 329–355.
Mayden, R.L., Wood, R.W., 1995. Systematics, species concepts, and the evolutionarysignificant unit in biodiversity and conservation biology. In: Nielson, J.L. (Ed.),Evolution and the aquatic ecosystem: defining unique units in populationconservation. Am. Fisheries Soc. Symp. 17, Bethesda, MD, pp. 58-113.
McCallum, M.L., Trauth, S.E., 2006. An evaluation of the subspecies Acris crepitansblanchardi (Anura, Hylidae). Zootaxa 1104, 1–21.
Mecham, J.S., 1964. Ecological and genetic relationships of the two cricket frogs,genus Acris, in Alabama. Herpetologica 20, 84–91.
Metcalf, J.L., Pritchard, V.L., Silvestri, S.M., Jenkins, J.B., Wood, J.S., Cowley, D.E.,Evans, R.P., Shiozawa, D.K., Martin, A.P., 2007. Across the great divide: geneticforensics reveals misidentification of endangered cutthroat trout populations.Mol. Ecol. 16, 4445–4454.
Moore, W.S., 1995. Inferring phylogenies from mtDNA variation-mitochondrial-gene trees versus nuclear-gene trees. Evolution 49, 718–726.
Moriarty, E.C., Cannatella, D.C., 2004. Phylogenetic relationships of the NorthAmerican chorus frogs (Pseudacris: Hylidae). Mol. Phylogenet. Evol. 30, 409–420.
Moritz, C., Schneider, C.J., Wake, D.B., 1992. Evolutionary relationships within theEnsatina eschscholtzii complex confirm the ring species interpretation. Syst. Biol.41, 273–291.
Nei, M., Li, W.H., 1979. Mathematical model for studying genetic variation in termsof restriction endonucleases. Proc. Nat. Acad. Sci. USA 76, 5269–5273.
Nevo, E., Capranica, R.R., 1985. Evolutionary origin of ethological reproductiveisolation in cricket frogs, Acris. Evol. Biol. 19, 147–214.
Nylander, J.A.A., 2004. MrModeltest v2. Program distributed by the author.Evolutionary Biology Centre, Uppsala University.
Pauly, G.B., Piskurek, O., Shaffer, H.B., 2007. Phylogeographic concordance in thesoutheastern United States: the flatwoods salamander, Ambystoma cingulatum,as a test case. Mol. Ecol. 16, 415–429.
Posada, D., Buckley, T.R., 2004. Model selection and model averaging inphylogenetics: advantages of the AIC and Bayesian approaches over likelihoodratio tests. Syst. Biol. 53, 793–808.
T. Gamble et al. / Molecular Phylogenetics and Evolution 48 (2008) 112–125 125
Prytchitko, T.M., Moore, W.S., 1997. The utility of DNA sequences of an Intron fromthe b–fibrinogen gene in phylogenetic analysis of Woodpeckers (Aves: Picidae).Mol. Phylogenet. Evol. 8, 193–204.
Reeder, A.L., Ruiz, M.O., Pessier, A., Brown, L.E., Levengood, J.M., Phillips, C.A.,Wheeler, M., Warner, R.E., Beasley, V.R., 2005. Intersexuality and the cricket frogdecline: Historic and geographic trends. Environ. Health Perspect. 113, 261–265.
Reynolds, J., Weir, B.S., Cockerham, C.C., 1983. Estimation of the coancestrycoefficient: Basis for a short-term genetic distance. Genetics 105, 767–779.
Rokas, A., Williams, B.L., King, N., Carroll, S.B., 2003. Genome-scale approaches toresolving incongruence in molecular phylogenies. Nature 425, 798–804.
Rose, F.L., Simpson, T.R., Forstner, M.R.J., McHenry, D.J., Williams, J., 2006.Taxonomic status of Acris crepitans palludicola: in search of the pink frog. J.Herp. 40, 428–434.
Ryan, M.J., Wilczynski, W., 1991. Evolution of intraspecific variation in theadvertisement call of a cricket frog (Acris crepitans, Hylidae). Biol. J. Linn. Soc.44, 249–271.
Schneider, S., Roessli, D., Excoffier, L., 2000. ARLEQUIN 2.0: As Software forPopulation Genetic Data Analysis. Genetics and Biometry Laboratory, Universityof Geneva, Geneva.
Shaffer, H.B., Feelers, G.M., Voss, S.R., Oliver, C., Pauley, G.B., 2004. Speciesboundaries, phylogeography and conservation of the red-legged frog (Ranaaurora/draytonii) complex. Mol. Ecol. 13, 2667–2677.
Shaffer, H.B., McKnight, M.L., 1996. The polytypic species revisited: geneticdifferentiation and molecular phylogenetics of the tiger salamander(Ambystoma tigrinum) (Amphibia: Caudata) complex. Evolution 50, 417–433.
Shaffer, H.B., Thomson, R.C., 2007. Delimiting species in recent radiations. Syst. Biol.56, 896–906.
Shimodaira, H., Hasegawa, M., 1999. Multiple comparisons of log-likelihoods withapplications to phylogenetic inference. Mol. Biol. Evol. 16, 1114–1116.
Sorenson, M.D., 1999. TreeRot, version 2. Boston University, Boston, MA.Sota, T., Sasabe, M., 2006. Utility of nuclear allele networks for the analysis of closely
related species in the genus Carabus, subgenus Ohomopterus. Syst. Biol. 55, 329–344.
Spinks, P.Q., Shaffer, H.B., 2005. Range-wide molecular analysis of the western pondturtle (Emys marmorata): cryptic variation, isolation by distance, and theirconservation implications. Mol. Ecol. 14, 2047–2064.
Vences, M., Vieites, D.R., Glaw, F., Binkmann, H., Kosuch, J., Veith, M., Meyer, A.,2003. Multiple overseas dispersal in amphibians. Proc. R. Soc. Lond., B Biol. Sci.270, 2435–2442.
Vences, M., Thomas, M., Bonett, R.M., Vieites, D.R., 2005. Deciphering amphibiandiversity through DNA barcoding: chances and challenges. Phil. Trans. R. Soc. B360, 1859–1868.
Vogt, R.C., 1981. Natural History of Amphibians and Reptiles of Wisconsin. TheMilwaukee Public Museum, Milwaukee.
Weisrock, D.W., Shaffer, H.B., Storz, B.L., Storz, S.R., Voss, S.R., 2006. Multiple nucleargene sequences identify phylogenetic species boundaries in the rapidlyradiating clade of Mexican ambystomatid salamanders. Mol. Ecol. 15, 2489–2503.
Wiens, J.J., 1998. Combining data sets with different phylogenetic histories. Syst.Biol. 47, 568–581.
Wiens, J.J., Penkrot, T.A., 2002. Delimiting species using DNA and morphologicalvariation and discordant species limits in spiny lizards (Sceloporus). Syst. Biol.51, 69–91.
Wright, A.H., Wright, A.A., 1949. Handbook of Frogs and Toads of the United Statesand Canada. Comstock Publishing Associates, Ithaca.
Zink, RM., 2004. The role of subspecies in obscuring avian biological diversityand misleading conservation policy. Proc. R. Soc. Lond., B Biol. Sci. 271, 561–564.
Zwickl, D.J., 2006. Genetic algorithm approaches for the phylogenetic analysis oflarge biological sequence datasets under the maximum likelihood criterion.Ph.D. dissertation, The University of Texas at Austin.