Specification Biases in Estimates of Socioeconomic Returns to Schooling Author(s): Larry Griffin Source: Sociology of Education, Vol. 49, No. 2 (Apr., 1976), pp. 121-139 Published by: American Sociological Association Stable URL: http://www.jstor.org/stable/2112517 . Accessed: 25/06/2014 01:52 Your use of the JSTOR archive indicates your acceptance of the Terms & Conditions of Use, available at . http://www.jstor.org/page/info/about/policies/terms.jsp . JSTOR is a not-for-profit service that helps scholars, researchers, and students discover, use, and build upon a wide range of content in a trusted digital archive. We use information technology and tools to increase productivity and facilitate new forms of scholarship. For more information about JSTOR, please contact [email protected]. . American Sociological Association is collaborating with JSTOR to digitize, preserve and extend access to Sociology of Education. http://www.jstor.org This content downloaded from 188.72.126.196 on Wed, 25 Jun 2014 01:53:00 AM All use subject to JSTOR Terms and Conditions
Transcript
Specification Biases in Estimates of Socioeconomic Returns to SchoolingAuthor(s): Larry GriffinSource: Sociology of Education, Vol. 49, No. 2 (Apr., 1976), pp. 121-139Published by: American Sociological AssociationStable URL: http://www.jstor.org/stable/2112517 .
Accessed: 25/06/2014 01:52
Your use of the JSTOR archive indicates your acceptance of the Terms & Conditions of Use, available at .http://www.jstor.org/page/info/about/policies/terms.jsp
.JSTOR is a not-for-profit service that helps scholars, researchers, and students discover, use, and build upon a wide range ofcontent in a trusted digital archive. We use information technology and tools to increase productivity and facilitate new formsof scholarship. For more information about JSTOR, please contact [email protected].
.
American Sociological Association is collaborating with JSTOR to digitize, preserve and extend access toSociology of Education.
http://www.jstor.org
This content downloaded from 188.72.126.196 on Wed, 25 Jun 2014 01:53:00 AMAll use subject to JSTOR Terms and Conditions
Specification Biases in Estimates of Socioeconomic Returns to Schooling*
LARRY GRIFFIN
The Johns Hopkins University
Sociology of Education 1976, Vol. 49 (April):121-139
This paper, based on a reanalysis of published data from seven sources and on new data, attempts to quantify the specification bias in estimates of the socioeconomic returns to school- ing owing to the omission from earnings functions of socioeconomic status (SES) origins and ability. The results suggest that estimates of the occupational status returns to schooling are not seriously inflated. The biases in earnings returns are more pronounced, however, and, for those data sets which allow controls for parental wealth or income, the biases approach 40 percent. Thus, the practice of calculating economic returns to educational attainment without adequate controls for ability and social origins is seriously questioned. Moreover, the bias due to the omission of ability and the bias due to the omission of SES are almost additive. Researchers, therefore, could not control for either SES only or ability only and eradicate the bias due to the omission of both SES and ability from status or earnings functions.
Introduction
Since the original work of Becker (1964) and Mincer (1958), an enormous amount of economic and sociological research has been devoted to estimating the returns to "invest- ment in human capital." Such investments are thought to include a variety of labor-force ex- periences, migration, work experience, and on-the-job training, for example, but the most researched skill-producing activity has been schooling. The amount of schooling attained by individuals may be the most easily manipu- lable of all investments and, as Bowles (1972) observes, may be the most politically viable option for achieving greater social equality. Formal educational attainment does enhance the earnings potential of indivdiuals: for white men aged 45-54 of non-farm origin, each addi- tional year of schooling is worth around $755 (calculated from data presented in Duncan, Featherman, and Duncan, 1972:38). A recur-
ring problem in interpreting such results, how- ever, concerns possible specification biases in the estimation process. That is, the coefficient attached to schooling may include not only legitimate "returns" but also the effects of variables not included in earnings functions. This problem is hardly unique to estimating rates of return to education, but economists have been particularly concerned about the ef- fects of an omitted "mental ability" variable.
Individuals who are of higher ability tend not only to acquire more schooling but also more earnings. To the extent that ability directly (i.e., net of education) enhances earn- ings or other adult socioeconomic achieve- ments, and to the extent that ability is not included in the earnings equation, returns to schooling will be overestimated. Despite much research, evidence regarding the extent of specification bias due to the omission of abil- ity from earnings functions is equivocal. Some studies (Rogers, 1969; Gintis, 1971; Griliches, 1970; Griliches and Mason, 1973; Ashenfelter and Mooney, 1968; Weisbrod and Karpoff, 1968) report that this upward bias in returns to educational attainment is marginal in im- portance. Others (Denison, 1964; Taubman and Wales, 1972, 1973; Hause, 1972; Hansen, Weisbrod, and Scanlon, 1970; Sewell and Hauser, 1975) suggest that the bias is too im- portant to ignore. Much of this ambiguity
* I would like to thank Karl Alexander, Bruce Eckland, Robert Hauser, and William Mason for fur- nishing me with unpublished data and Karl Alexan- der, Martha Cook, Charles Mallar, Ross Stolzenberg and an anonymous referee for their comments on this paper. This research was partially supported by the Center for Social Organization of Schools, The Johns Hopkins University.
121
This content downloaded from 188.72.126.196 on Wed, 25 Jun 2014 01:53:00 AMAll use subject to JSTOR Terms and Conditions
may spring from differences in and peculiar- ities of the populations sampled. For further evidence on the ability-education-income nexus, see Duncan (1968), Hause (1971), Dickinson (1974), Link and Ratledge (1975), Alexander, Eckland, and Griffin (1975), and Jencks, et al. (1972).
While there is little agreement among re- searchers conceming the importance of the omission of mental ability, the potential bias is well known and widely discussed. The same cannot be said of the potential bias resulting from the exclusion from earnings functions of socioeconomic status (SES) origins. SES origins are routinely neglected as direct deter- minants of earnings by economists (see, for example, Flanigan, 1974), though their impor- tance for educational attainment is noted (see, especially, the discussion by Becker, 1972). Recently, however, Bowles (1972, 1973) has suggested that social class is much more influ- ential and schooling less efficacious in the de- termination of earnings or income than previ- ously believed. He observes, as do some soci- ologists (Haug, 1973; Haug and Sussman, 1971; Hodge, 1970) that socioeconomic ori- gins are not adequately specified by father's education and father's occupation-the most frequently used indicators of SES origins-and are subject to severe errors of measurement. Both problems-inadequate conceptualization and measurement of SES origins or social class-lead to the attenuation of SES origin effects on earnings and to an artifactually in- flated estimate of the returns to schooling. Adequate measurement and specification of socioeconomic origins, including measures of parental wealth and income, would, according to Bowles, result in the following: (1) the at- tainment of schooling would be shown to be more heavily dependent on class background than previous empirical investigations indi- cate, (2) SES origins would register reasonably strong unmediated effects on earnings, and the coefficient attached to schooling would be notably lower, and (3) because of (1) and (2) above, schooling would be found to function primarily to transmit the effects of SES ori- gins on, rather than uniquely enhance and in- duce variation in, adult socioeconomic
achievement. If supported, Bowles' hypothe- ses would seriously question the assumption that the attainment of schooling is the "great equalizer" in American society.
Bowles' thesis has not been thoroughly tested because most data sets do not have the requisite measures (on parental income, for example). Bowles (1972, 1973), Bowles and Nelson (1974), and Duncan, Featherman, and Duncan (1972) were forced to use hypothe- tical correlations involving parental income due to a paucity of data. Their results, there- fore, are suggestive but unverified. Many studies (Spaeth, 1973; Griliches and Mason, 1973; Blinder, 1973; Jencks, et al. 1972; Link and Ratledge, 1975; Duncan, 1968; Duncan, Featherman, and Duncan, 1972; Featherman, 1972; Coleman, Berry, and Blum, 1972; Dick- inson, 1974) report the direct dependence of earnings or income on the traditional indica- tors of SES origins (father's occupation and father's education), net of other explanatory variables. The not-too-surprising results indi- cate generally small or non-significant effects, a finding consistent with Bowles' position. Two recent studies (Sewell and Hauser, 1972, 1975; Alexander, Eckland, and Griffin, 1975) report, however, that indicators of parental wealth or income do directly and significantly affect earnings, controlling for a variety of other variables, including educational attain- ment and occupational status. Thus, while Bowles' thesis has received partial support, few of these studies have attempted to quanti- fy the bias in returns to schooling due to the omission of SES origins (notable exceptions being Sewell and Hauser, 1975 and Griliches and Mason, 1973).
In this paper I will reanalyze previously published data and present new data with the aim of assessing more systematically the con- sequences of the possible specification biases discussed above than has previously been done. Almost all of the studies cited above focus on the specification bias in earnings equations; I will expand the focus to include occupational status returns in addition to earnings (or income) returns to schooling. Finally, I will attempt to determine the sever- ity of the bias under different conditions con-
This content downloaded from 188.72.126.196 on Wed, 25 Jun 2014 01:53:00 AMAll use subject to JSTOR Terms and Conditions
cerning the inclusion or exclusion of mental ability or SES origins. Where data permit, I will also reexamine the same questions with expanded indices of socioeconomic origins, which include parental income, to ascertain the plausibility of Bowles' (1972) argument.
Before I continue, one point deserves em- phasis. The issues raised by this body of litera- ture are neither merely scholarly debates over the "correctness" of an esoteric model of soci- al process nor an academic game, as Welch (1975) seems to imply. The implications of research on the "payoffs" to schooling often have profound implications for social policy and for the efficient allocation of personal and private resources. The "human capital" paradigm, for example, has been used to study economic discrimination against blacks and women and to determine the differential ef- fects of schooling for blacks and whites. Most of the research in this tradition, however, has been based on data which do not include eith- er ability or SES origins, such as the Census Bureau's 1960 and 1970 Public Use Samples and the 1966 and 1967 Survey of Economic Opportunity. This includes some of the most widely cited literature in the field (Hanoch, 1967; Weiss, 1970; Harrison, 1972; Welch, 1973; Mincer, 1974). New research is being conducted and published from these same data sources on highly political and important issues (Masters, 1974; Stolzenberg, 1975; Os- terman, 1975; Haworth, Gwartney, and Haworth, 1975). If the bias in returns to schooling is truly trivial, researchers can ap- proach these data banks with renewed con- fidence that their conclusions are reasonably accurate and will stand the test of time. If, on the other hand, the bias is shown to be im- portant, than we may have to reconsider the findings and policy implications of much otherwise excellent research.
A Basic Model of Socioeconomic Achievement
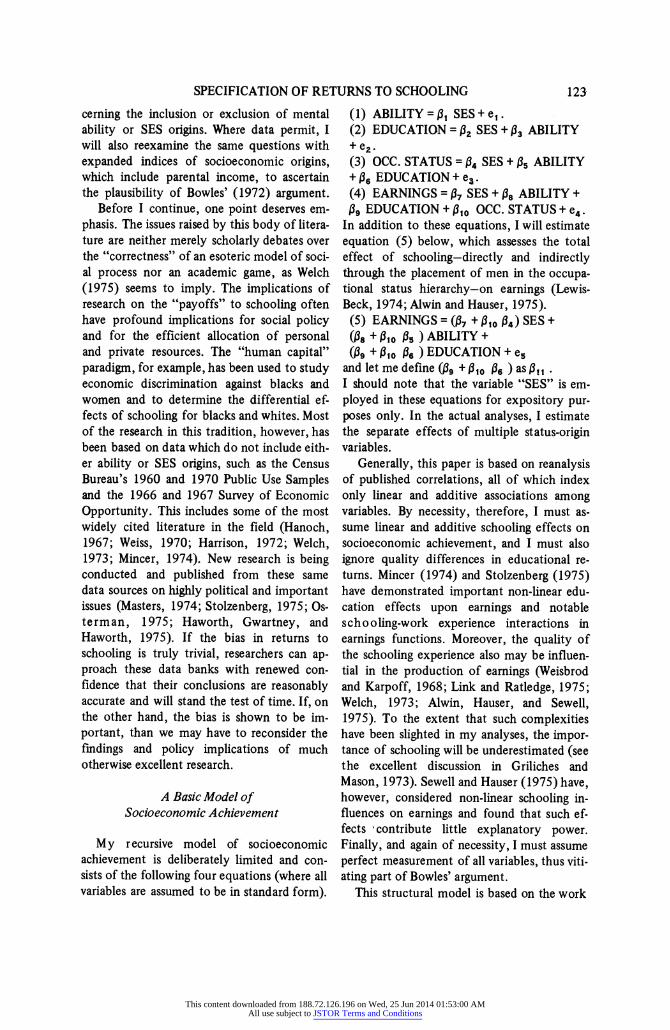
My recursive model of socioeconomic achievement is deliberately limited and con- sists of the following four equations (where all variables are assumed to be in standard form).
(1) ABILITY = 11 SES + e,. (2) EDUCATION =132 SES + ,3 ABILITY + e2. (3) OCC. STATUS = 04 SES +,B5 ABILITY + 16 EDUCATION + e^. (4) EARNINGS = ,7 SES + ,B8 ABILITY + 19 EDUCATION + ,Bl OCC. STATUS + e4.
In addition to these equations, I will estimate equation (5) below, which assesses the total effect of schooling-directly and indirectly through the placement of men in the occupa- tional status hierarchy-on earnings (Lewis- Beck, 1974; Alwin and Hauser, 1975). (5) EARNINGS = (,B7 + 00 14) SES + (18 + 110 15 )ABILITY+ (19 + 10 16 ) EDUCATION + e5
and let me define (139 + j3 13 6 ) as 0 1 1 I should note that the variable "SES" is em- ployed in these equations for expository pur- poses only. In the actual analyses, I estimate the separate effects of multiple status-origin variables.
Generally, this paper is based on reanalysis of published correlations, all of which index only linear and additive associations among variables. By necessity, therefore, I must as- sume linear and additive schooling effects on socioeconomic achievement, and I must also ignore quality differences in educational re- tums. Mincer (1974) and Stolzenberg (1975) have demonstrated important non-linear edu- cation effects upon earnings and notable scho oling-work experience interactions in earnings functions. Moreover, the quality of the schooling experience also may be influen- tial in the production of earnings (Weisbrod and Karpoff, 1968; Link and Ratledge, 1975; Welch, 1973; Alwin, Hauser, and Sewell, 1975). To the extent that such complexities have been slighted in my analyses, the impor- tance of schooling will be underestimated (see the excellent discussion in Griliches and Mason, 1973). Sewell and Hauser (1975) have, however, considered non-linear schooling in- fluences on earnings and found that such ef- fects contribute little explanatory power. Finally, and again of necessity, I must assume perfect measurement of all variables, thus viti- ating part of Bowles' argument.
This structural model is based on the work
This content downloaded from 188.72.126.196 on Wed, 25 Jun 2014 01:53:00 AMAll use subject to JSTOR Terms and Conditions
of Duncan (1968), Duncan, Featherman, and Duncan (1972), and Sewell and Hauser (1975). This model clearly does not exhaust the vari- ety of experiences or career contingencies known to influence socioeconomic achieve- ment. In particular the earnings equation is deficient.in that no measure of labor force experience is included. There is no reason to believe, however, that such omissions would seriously affect my conclusions (see Sewell and Hauser's (1975:87) observations on this issue). Rather, such a model purports to "ex- haust the influence of fundamental conditions of ascription and achievement" (Sewell and Hauser, 1975:184) and establishes concems over and above returns to schooling.
Let me hypothesize that equations (1) through (5) represent the "true" model, but the model estimated is (6) ABILITY= ,B, SES + e. (7) EDUCATION = 12 SES + 13 ABILITY +e2. (8) OCC. STATUS = 06 EDUCATION + u,. (9) EARNINGS = ,, EDUCATION + u2.
Equations (6) and (7) are identical to (1) and (2) above. Equations (8) and (9) differ from (3) and (5), however, in that SES and ability are no longer allowed to affect socioeconomic achievement directly. This "false" model would result from the incorrect assumption (given knowledge of the true state of affairs) that education entirely mediates all of the in- fluence of SES and ability on subsequent labor market success.
Estimation of (8) and (9) by ordinary least squares (OLS) will yield biased estimates of 16 and t,, because in (8) education and u, and in (9) education and u2 are correlated. In particular, the estimate of 06 (say, b6 ) will be (10) b6 = 16 + 12 04 + 15 03 + 12 10105 +
14 131 033
Thus the OLS estimate of 16 [b6 I will in- clude 06 , the "true" occupational status re- turns to schooling; plus the summation of the second through the fifth terms on the right side of (10). Given single equation estimation procedures (such as OLS), estimates of pl, 2, and j3will be identical for both models and in all probability positive. Thus it can be seen that the bias is entirely a function of the
degree to which socioeconomic origins and mental ability directly determine occupational status. If there is no direct SES effect on status, 02 14 = 04 11 13 = 0 and the bias is re- duced. If it is further demonstrated that abil- ity exerts no independent status effects, then 03 15 = 023 13 15 = 0, and the bias entirely disappears. In that case, b6 is an unbiased esti- mate of 06 . Clearly, then, quantification of the bias rests upon adequate specification and measurement of both mental ability and socioeconomic origins.
Estimation of (9) will yield the following result: (11) bl =01, + 02 07+ 03 8 + 02. 1 08
+ 07 11 3 - The remarks concerning (10) above are en- tirely appropriate for (11): 0,, is biased to the extent that SES origins and mental ability directly influence earnings. (See Appendix A for a complete exposition of the estimation of the bias.)
Data and Variables
Table 1 summarizes the data and variables to be used in this paper. A more detailed description of the data is presented in Appen- dix B. All data pertain to men only. The first six data sources are national in scope, though the MICH-PANEL and EEO samples are not representative of all employed men in the United States.
My conclusions will be based on three sets of statistics: (1) the amount of explained vari- ance in occupational status and earnings or income uniquely attributable to schooling. This statistic, while of limited utility, is neces- sary to explore Bowles' thesis fully; (2) the proportional reduction in socioeconomic re- turns to schooling controlling SES origins and/or mental ability; and (3) the reduced- form and structural estimates of the earnings equations for the WISC and EEO data, the only data sets with indices of parental wealth or income.
Results
Schooling and Occupational Status
Table 2 presents two statistics for each en-
This content downloaded from 188.72.126.196 on Wed, 25 Jun 2014 01:53:00 AMAll use subject to JSTOR Terms and Conditions
a The first entry for each data set under each column in the table is the variance explained in occupational status that can be uniquely attributable to education; the entry in parentheses for a data set under each column in the table is the proportion of explained variance in occupational status due to the unique explana- tory power of education. b Father's Occupation only.
try in the table. The top statistic represents the variance in occupational status that can be uniquely attributable to schooling. It is cal- culated by subtracting the R2 in occupational status generated by the equations which ex- clude schooling (SES (columns 1 and 2), abil- ity (column 3), and SES and ability (columns 4 and 5)] from that generated by the corre- sponding equations which include schooling. The increment to R2 is owing to that portion of the variance in schooling which is ortho- gonal to SES origins and/or ability, and it is
the squared part correlation of schooling and occupational status (Linn and Werts, 1969). This is a clearly conservative estimate of the efficacy of schooling since all variance in labor market success attributable to the covariance of schooling, SES origins, and ability is allo- cated to the latter two regressors. The second statistic, in parentheses, is the proportion of the total explained variance in occupational status that is due to the unique effect of schooling.
Column 1 indicates the addition to R2 due
This content downloaded from 188.72.126.196 on Wed, 25 Jun 2014 01:53:00 AMAll use subject to JSTOR Terms and Conditions
to schooling after first controlling father's oc- cupation and father's education. While this statistic differs according to data set, from .03 (CPS-NORC II, logged) to .32 (PFS), the proportion of total explained variance due to the unique contribution of schooling is much more stable. (See Appendix B, under the description of the CPS-NORC II data, for an explanation of the anomalous results yielded by these data.) The figures in parentheses (in column 1) show that, with the exception of CPS-NORC II, between 53 and 76 percent of the total explained variation in occupational status is due solely to the unique effect of schooling. Moreover, adding mother's educa- tion and parental income (in the WISC data set) and material possessions and parental in- come (in the EEO data set) as additional con- trol variables (in column 2) hardly reduces this unique effect of schooling. From columns 1 and 2 I conclude that, insofar as occupation- al status achievement is concerned, education- al attainment is an important mechanism for freeing men from their socioeconomic status origins, however such origins are measured.
The unique explanatory effect of school- ing, with only mental ability controlled, is presented in column 3. The unique contribu- tion of schooling is generally somewhat small- er than that registered in columns 1 and 2 (controlling for SES origins only), but the dif- ferences are not great. Schooling still uniquely accounts for about 50-60 percent of the ex- plained variation in occupational status (again excepting CPS-NORC II). The reduction in the unique contribution of schooling, how- ever, is somewhat more marked if we first en- ter into the regression equation father's occu- pation, father's education, and mental ability (column 4). Estimates of the influence of schooling, net of its covariance with back- ground and ability, are reduced to between a fifth (CPS-NORC II) and a half (WISC) of the total variance explained in occupational status attainment. Addition of the auxillary in- dicators of socioeconomic status origins-for the WISC and EEO data sets (column 5)-leaves the results unchanged.
The robustness of this net schooling effect is impressive: even though one controls for
three, and sometimes five, modestly powerful determinants of educational attainment (be- tween 20 and 40 percent of the variance in educational attainment is explained by this model), schooling uniquely explains from a third to a half of the total variance accounted for in occupational status. Given equations (1)-(5), this estimate of the "uniqueness" of schooling should be considered the absolute minimum amount of influence associated with the attainment of formal education. &hooling does much more than simply signal that a man has the "right" social origins or measured abil- ity; indeed, it appears to allow educationally certified men partially to overcome deficits in status origins or ability and to induce con- siderable variation in occupational status inde- pendent of social background.
Table 3 presents the proportional reduc- tion in occupational status returns to schooling after controlling socioeconomic ori- gins and/or mental ability. This is the degree of specification bias and is estimated as
by,E-C 1bY,EC by ,E
where by,E C, is the partial slope of status on education (controlling either SES, ability or both) and by,E is the bivariate slope. If the two slopes are equal, the ratio is unity and the bias is zero.
The proportional reduction, controlling on- ly father's occupation and father's education, is presented in column 1 and shows that the bias in occupational status returns is small in all data sets, ranging from 6 (WISC) to 13-14 percent (NLS, CPS-NORC II, CPS-OCG 55-64). And, as in Table 2, further controlling for material possessions, parental income, and mother's education (in the EEO and WISC data) makes essentially no difference (column 2). An example of the essential irrelevance of this bias is that each additional year of school- ing for the CPS-OCG 55-64 cohort (where the bias is the largest) is worth 3.8 status points before controls are added. After controlling for father's occupation and father's education, the status return to a year's schooling is 3.3 points. Thus, the estimated occupational status "payoff' of a college education versus
This content downloaded from 188.72.126.196 on Wed, 25 Jun 2014 01:53:00 AMAll use subject to JSTOR Terms and Conditions
that of a high school education, assuming line- arity of effects, is biased upward by only 2 status points (15.2 points - 13.2 points). This is indeed inconsequential.
The reduction in status returns to school- ing due to controlling ability only (column 3) is about the same as that in column 1 and is, again, trivial. Column 4 presents the degree of bias due to omission of father's occupation, father's education, and mental ability. The bias is larger, on the order of 13 (WISC) to 20 percent (CPS-NORC II, NLS, CPS-NORC I). The bias due to SES origins (column 1) and the bias due to ability (column 3) are almost additive, suggesting that researchers cannot control for either SES origins only or ability only and expect to account for the bias due to both. The covariance of socioeconomic origins and ability is too modest to use one as a proxy for the other (see Duncan, 1968).
Biases approaching 20 percent may, de- pending on one's perspective, appear either large or small. Several examples illustrate the impact of a bias of this size. Consider the bias of 14 percent obtained in the WISC data (column 5) due to omission of the four status
variables and ability. In the WISC data, an in- cremental year of schooling is worth, gross, 8.65 occupational status points. Net of the above variables, a year's education is worth 7.44 status points. The return to an invest- ment in four years of college, for example, is worth 34.6 (gross) and 29.8 (net) status points, an inflated estimate of less than 5 status points. Consider now the 22 percent bias observed in the CPS-NORC II study of veterans (row 7). As occupational status is logged, we can interpret retums to years of schooling in terms of percentage increments of occupational status. The gross status return to each additional year of schooling is worth 10 percent. After controlling for father's oc- cupation, father's education, and ability (AFQT), a year's schooling yields an 8 percent return. The bias, then, is around 2 percent per year of schooling. In neither the WISC nor the CPS-NORC II data sets is the actual impact of the bias especially severe.
Results presented in Tables 2 and 3, based on several sets of data on predominantly white males of a variety of ages, suggest that schooling functions largely to disengage men
This content downloaded from 188.72.126.196 on Wed, 25 Jun 2014 01:53:00 AMAll use subject to JSTOR Terms and Conditions
from unfavorable social backgrounds rather than to transmit the deleterious effects of these backgrounds, though, of course, it also performs this function. These results also indi- cate that estimates of the occupational status returns to educational attainment are only modestly inflated due to the omission of socioeconomic status origins (including in- dices of parental income) and mental ability. The specifilcation bias appears to be, at most, around 20 percent, a bias shown to be of rela- tively minor importance in terms of actual status "payoffs."
These results, I should note, do not imply that status origins have no direct conse- quences for status outcomes. For most of the data sets analyzed here, there does appear to be a small degree of direct intergenerational occupational status "inheritance" (see Blau and Duncan, 1967; Duncan, Featherman, and Duncan, 1972; Sewell and Hauser, 1975; and Alexander, Eckland, and Griffin, 1975).
Schooling and Earnings All estimates of the returns to education
reported in this section are estimates of the
TABLE 4 Unique Contribution of Schooling to Explained Variance in Earnings Controlling
for Other Variablesa
Data Set (1) (2) (3) (4) (5) Father's Occupation, Father's Occupation, Ability Ability Ability Father's Education Father's Education, and (1) and (2)
Parental Income, Mother's Education (WISC), Material Possessions (EEO)
a The first entry for each data set under each column in the table is the variance explained in earnings that can be uniquely attributable to education; the entry in parentheses for a data set under each column in the table is the proportion of explained variance in earnings due to the unique explanatory power of education. b Father's Occupation only.
This content downloaded from 188.72.126.196 on Wed, 25 Jun 2014 01:53:00 AMAll use subject to JSTOR Terms and Conditions
total effect of education, i.e., directly and in- directly through the placement of men in the occupational structure. The unique explana- tory contribution of schooling on eamings (or income) (Table 4) has the same interpretation as in Table 2 for occupational status. Thus column 1 presents the unique effect of educa- tion after first entering father's occupation and father's education into the eamings equa- tion. Here schooling is much less effective in explaining variation in eamings that it was in explaining variation in occupational status. The percent of variation in earnings that can be uniquely allocated to schooling ranges from 2-3 (NLS, CPS-NORC II, EEO, WISC) to 15 percent (MICH). The MICH study is clearly discrepant from the remaining data sets, and this may be due to the outcome variable, hourly wage rates, being more sensitive to educational attainment than annual eamings or income. This hypothesis, however, does not hold for the NLS data which also employed hourly wage rates.
Of the total variance explained in eamings by father's occupation, father's education, and son's education, the proportion uniquely attributable to schooling ranges from around .3-.4 (CPS-OCG 35-44, CPS-OCG 45-54, EEO, NLS, CPS-NORC II) to .7-.8 (WISC, MICH, PFS). With the exception of the last three data sets, this unique proportion is about two- thirds as large as that registered for occupa- tional status (compare the second statistic in the first column of Tables 2 and 4).
This unique proportion is reduced by half in data which allow prior controls for moth- er's education and parental income (WISC) or material possessions and parental income (EEO), as well as father's occupation and father's education (see column 2). The EEO results are particularly striking: only 16 per- cent of the total variation in annual eamings explained by the four status origin variables and schooling can be uniquely allocated to schooling. Results from both the WISC and EEO data suggest that attainment of formal education does not generate earnings later in the socioeconomic career of young white men largely independent of social class origins. This was not found to be the case for occupa-
tional status, and tends to support Bowles' thesis that an adequate specification of socio- economic origins (including measures of parental wealth and income) reduces estimates of the unique explanatory power of schooling on eamings.
After controlling first for mental ability only (column 3) the unique contribution of schooling ranges from .2-.3 (NLS, CPS-NORC I, CPS- NORC II) to.7 (EEO) (bottom statis- tic). More consistent and stable estimates of the unique explanatory impact of schooling are presented in column 4. It shows the incre- ment to R2 by the addition of schooling to the earnings equation containing SES origins and mental ability. Of the total explained vari- ation in eamings, between 14 (CPS-NORC II, logged) and 44 (MICH) percent can be unique- ly attributed to schooling. These results are similar to the comparable equation for occu- pational status. Finally, we estimate school- ing's unique contribution to the explanation of earnings after first entering into the re- gression equation the four SES origin variables and mental ability for the EEO and WISC data sets (column 5). The percent of total ex- plained variation due to that component of schooling that is independent of SES origins and ability is small, around 20 percent. Net of status origins and ability, schooling explains only 1 to 2 percent of the variance in annual eamings (not income). Again, this is consis- tent with Bowles' (1972) conclusions.
Based on the results in Table 4, I conclude that for eamings, schooling operates mainly in concert with, rather than independently of, socioeconomic status origins and ability. That is, at least for the eamings of relatively young white men (25-34), schooling appears neither to liberate men from their class backgrounds nor to substantially enhance and explain eam- ings. Bowles (1972:S240), basing his argu- ment on similar "unique contribution" statis- tics, concluded that "the educational system is a major vehicle for the transmission of eco- nomic status from one generation to the next." As an anonymous referee for this paper observed, however, Bowles' thesis likely exag- gerates the transmission power of schooling. The degree to which schooling transmits SES
This content downloaded from 188.72.126.196 on Wed, 25 Jun 2014 01:53:00 AMAll use subject to JSTOR Terms and Conditions
effects on earnings depends upon the degree to which schooling, net of SES, directly influ- ences earnings. If the direct relationship be- tween educational attainment and earnings is reduced by controlling SES, and it is to a con- siderable degree (see Table 5), then the "status transmission" function of schooling is similarly reduced.
The implication of the data presented in Table 4 is that the economic returns to schooling may be non-trivially overestimated in the absence of adequate controls for back- ground and ability. This conjecture is ex- plored in Table 5 which presents the propor- tional reduction in earnings (or income) re- turns to schooling when controlling socio- economic origins and/or mental ability. This statistic, the extent of specification bias, is the earnings analogue to the statistic presented in Table 3 for occupational status. Column 1 presents the reduction in the schooling coef- ficient after controlling father's occupation and father's education. Estimates of this bias vary considerably, from .04 (PFS, MICH) to around .25 (EEO, CPS-OCG 45-54). The aver- age estimate appears to lie between .10 and .15.
While a bias of this magnitude is not large, the actual impact in dollars is sizeable. Con- sider, for example, the bias of .216 for the CPS-OCG 45-54 cohort. One year of schooling is worth $755 for these men. Net of father's occupation and father's education, an addi- tional year of education is worth $592, a dif- ference of $163 a year. Hence, four years of college is worth, annually, $652 less than the bivariate relationship between schooling and income would indicate. The estimate for the EEO data set (metric) is inflated by $84 a year. On the other hand, the return to an ad- ditional year of schooling for the WISC men is overestimated by only $26 a year.
The extent of specification bias doubles for the WISC data when further controls for mother's education and parental income are added (see column 2). This increment to the bias is, as I shall show below, due almost en- tirely to the parental income variable (see also the discussion in Sewell and Hauser, 1975). For the WISC men, this 19 percent bias trans- lates into $58 a year. Adding parental income and material possessions as further controls in the EEO data set increases the bias by about 50 percent to .37. For the logged EEO earn-
This content downloaded from 188.72.126.196 on Wed, 25 Jun 2014 01:53:00 AMAll use subject to JSTOR Terms and Conditions
ings data, the bias is .395. Controlling for these four status origin variables reduces the return to a year's schooling by $130 (metric) and 1.2 percent (logged; from 3.0 to 1.8 per- cent) for the EEO men. Hence, controlling on- ly for socioeconomic status origins, ade- quately specified, reduces the estimate of the purely economic returns to schooling by be- tween 20 and 40 percent. These data, I be- lieve, strongly support Bowles' contention that returns to education have been inflated due to the omission of a well-specified status origin variable.
Estimates of the returns to schooling are also sensitive to controls for ability (see column 3). The reduction in the size of the schooling coefficient varies from 9 (MICH) to 32 (NLS) percent. In the EEO data, the return to a year's schooling increases because, net of education, ability slightly depresses earnings (see Alexander, Eckland, and Griffin, 1975). With the exceptions of the EEO and CPS- NORC II data, the reduction due to con- trolling only ability is about twice as great as the comparable reduction due to controlling father's occupation and father's education on- ly. Moreover, for the CPS-NORC I, NLS, and WISC data, the bias in earnings returns due to ability is about twice as great as the compara- ble bias in occupational status returns (com- pare columns 3 in Tables 3 and 5).
Controlling for father's occupation, father's education, and mental ability (column 4) reduces the schooling coefficient still fur- ther, from about 13 (MICH, EEO) to 37 (CPS-NORC I) percent. As with occupational status, the biases due to SES origins and abil- ity are almost additive (compare column 4 with columns 1 and 3) and imply that one variable cannot serve as a proxy for the other. For the WISC and CPS-NORC I men, the bias in the earnings equation is about twice as large as the bias in the occupational status equa- tion. For the NLS men, the bias is half again as large. For the EEO men, the biases in earn- ings and occupational status are very similar (due to the depressant effect of ability on earnings).
Biases on the order of .25 to .35 (as regis- tered in column 4) certainly are not trivial.
The standardized effect of schooling on earn- ings for the CPS-NORC I men is reduced from .35 to .22. For the WISC men, the economic return to an additional year of schooling is overestimated by $80 a year. Thus, the degree of specification bias attributed to only three variables-father's occupation, father's educa- tion, and mental ability- is large enough, in my opinion, to question the utility of estimat- ing simple economic returns to education for white males aged 25-34.
I examine, finally, the bias in economic re- turns to schooling after adding further con- trols for material possessions and parental in- come (EEO) and mother's education and parental income (WISC) in column 5. These data indicate that, for the WISC men, the "payoff" to an additional year of school is reduced by 35 percent, from $314 to $206. This is a reduction of $108 per year. For the EEO men, the return is reduced by 27 per- cent, or $94 a year, from $353 to $259 per year of schooling.
The EEO, NLS, and CPS-NORC I results support, in my opinion, Sewell and Hauser's (1975:185) remark, based upon their analysis of the WISC data, about "the naivete of ef- forts to measure economic returns to educa- tion without controlling socioeconomic back- ground and ability." And both the EEO and the WISC results-demonstrating markedly larger biases after controlling for parental wealth or income in addition to father's edu- cation and occupation-provide adequate sup- port for Bowles' hypothesis discussed in detail above.
I should note that, while the socioeconom- ic returns to schooling are reduced consider- ably, they are not reduced to zero. This "re- sidual" education effect is open to interpreta- tion (see Blaug, 1972; Gordon, 1972). It may be, as "human capital" economists argue, that highly educated individuals are potentially (from the employer's perspective) more pro- ductive, and thus are more likely to be hired for higher status and higher paying jobs (Hanoch, 1967; Mincer, 1958, 1974). No con- sensus exists on this point, however, and several researchers (Gintis, 1971; Berg, 1970; Collins, 1971; Arrow, 1973; Taubman and
This content downloaded from 188.72.126.196 on Wed, 25 Jun 2014 01:53:00 AMAll use subject to JSTOR Terms and Conditions
Wales, 1973) argue that educational creden- tials signify largely whether a prospective em- ployee has acquired or retained "proper" work attitudes (rather than specific functional skills), and that this is the role of such certi- fication in positioning men in the occupation- al structure. Layard and Psacharopoulous (1974) summarize the results of several per- tinent studies regarding the "productivity" versus the "screening" hypotheses.
Do Socioeconomic Status Origins Directly Influence Earnings?
In equation 11 above, I noted that the economic returns to education would be biased upward only if socioeconomic status origins and/or ability directly affected earn- ings. Table 5 showed that the returns to schooling are inflated by 35 to 40 percent, given adequate controls for ability and status origins. The inference, therefore, is that either ability or SES background, or both, register(s)
a direct causal impact on earnings. Becker (1972:S252) states that "one must adopt a skeptical attitude [on this contingency] until evidence is provided." Becker also argues that if family background affects earnings it does so primarily by influencing occupational placement. Well, the evidence is now pro- vided, at least for men early in the socio- economic career, and Becker probably is wrong.
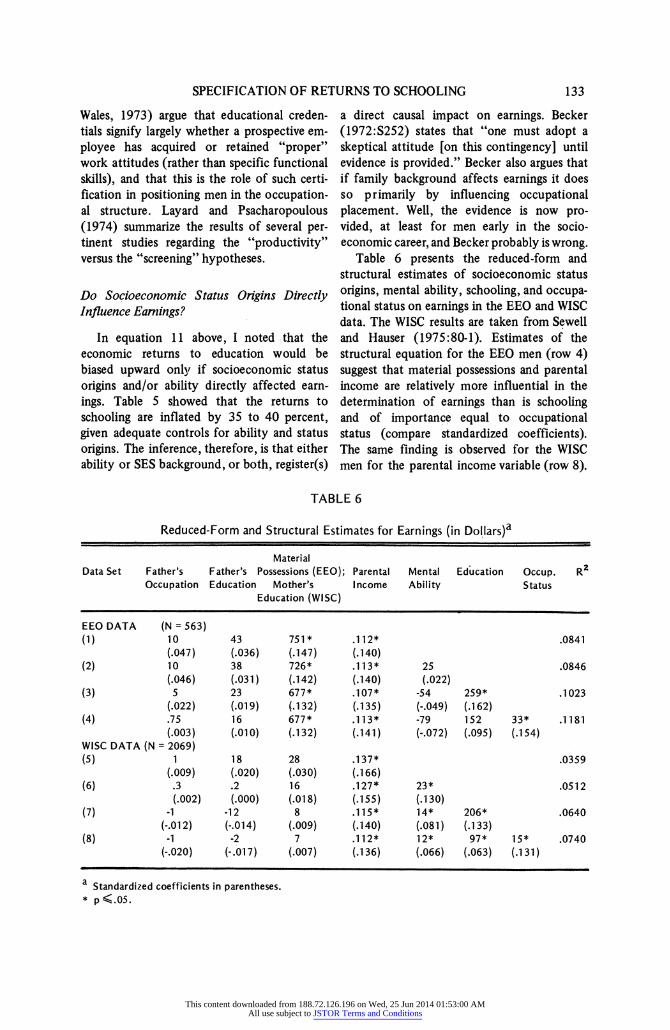
Table 6 presents the reduced-form and structural estimates of socioeconomic status origins, mental ability, schooling, and occupa- tional status on earnings in the EEO and WISC data. The WISC results are taken from Sewell and Hauser (1975:80-1). Estimates of the structural equation for the EEO men (row 4) suggest that material possessions and parental income are relatively more influential in the determination of earnings than is schooling and of importance equal to occupational status (compare standardized coefficients). The same finding is observed for the WISC men for the parental income variable (row 8).
TABLE 6
Reduced-Form and Structural Estimates for Earnings (in Dollars)a
Material Data Set Father's Father's Possessions (EEO); Parental Mental Education Occup. R2
Occupation Education Mother's I ncome Ability Status Education (WISC)
Net of all other variables in the equation, in- cluding the achieved educational and occupa- tional statuses, a thousand dollars of parental income is worth about $110 in son's annual earnings for both the EEO and WISC men. Moreover, only 10 percent of the material possessions effect is mediated by ability, schooling, and occupational status and none of the parental income effect is so mediated in the EEO sample (compare rows 1 and 4). On- ly 18 percent of the parental income effect is mediated by the same variables in the WISC sample (compare rows 5 and 8). Hence, some dimensions of a young man's socioeconomic background, especially those tapping the material resources of parents, (1) appear to in- fluence eamings directly, (2) are as important as occupational status and more important than schooling, and (3) are largely unmediated by the remaining variables in the model. It should be remembered that the dependent variable is eamings, not income.
Becker states (1972) that such results-if they exist-may be the result of measurement error. Respondents, he argues, are asked to report on the income of their household while they were adolescents and this may result in errors of recall or deliberate misinformation. Conceivably, this may be true for the EEO data set; it is not a valid criticism of the WISC data, however. In that data set, parental in- come is taken from Wisconsin state tax re- cords and son's earnings are taken from U.S. Social Security Administration records. Measurement error, in such circumstances, would be minimal. The correlations among the status origin and status destination vari- ables are extremely similar in the EEO and WISC data sets; this extemal validity check on the accuracy of the EEO data is reassuring. Thus, in my opinion, these effects-first docu- mented in the WISC data and labeled the "direct social inheritance of earnings per- formance" by Sewell and Hauser (1975:87)-are not measurement artifacts in the EEO data set.
Conclusions
Several caveats are in order before present-
ing my concluding remarks. First, this dis- cussion is limited to relatively young white males. Because a sufficient number of compar- able analyses have yet to be conducted for blacks and women, the biases in retums to schooling for these populations are unknown. Probably SES and ability affect the socio- economic achievements of men differently from those of women (Alexander and Eck- land, 1975; Treiman and Terrell, 1975; Carter, 1972) and those of blacks differently from those of whites (Porter, 1974; Duncan, 1969). The biases may thus differ for these popula- tions. This suggests, however, the possibly misleading nature of race or sex comparisons of the retums to years of schooling in the absence of controls for SES and ability.
Second, most of the data analyzed here pertain to young workers, a population for which the schooling-earnings correlation is low (Mincer, 1974; Duncan, Featherman, and Duncan, 1972). The biases for more experi- enced workers may be less severe than those estimated in this paper. Analyses employing well-specified SES origin and ability variables have yet to be conducted for older cohorts of workers, but the evidence available does not support this hypothesis (compare the results for the four CPS-OCG cohorts in Tables 4 and 5).
Third, as Griliches and Mason (1973) have demonstrated, the introduction of other vari- ables into earnings equations reduces the direct effects of father's education, father's occupa- tion, and ability and therefore deflates the re- duction in socioeconomic returns attributable to these variables. Inclusion of these addi- tional variables, however, is also likely to re- duce estimates of the retums to educational attainment. Thus the "true" schooling retums will be, if anything, even smaller than those estimated in this paper. Research thus far con- ducted with a multitude of other variables -including high school and college "quality," educational and occupational aspirations, academic performance in high school and col- lege, and course of study in college-have failed, however, to explain, or even substan- tially reduce, the parental income effect on son's eamings reported in this paper for both
This content downloaded from 188.72.126.196 on Wed, 25 Jun 2014 01:53:00 AMAll use subject to JSTOR Terms and Conditions
the EEO and WISC men (Alwin, Hauser, and Sewell, 1975; Sewell and Hauser, 1972, 1975; Alexander, Eckland, and Griffin, 1975; Alex- ander, personal communication). And, as I have demonstrated, the bias attributed to SES can be zero only if the partial regression coef- ficients linking SES indicators and eamings are zero.
Finally, I should note that I estimated biases only for occupational status and earn- ings (or income). We know very little about the potential biases in non-pecuniary retums to educational attainment or the degree and manner by which schooling contributes to the acquisition of wealth (rather than eamings or income). My results, therefore, should be in- terpreted only with respect to the outcome variables considered in this paper.
More research on these critical issues clear- ly is needed; nevertheless, results presented here suggest that occupational status retums to schooling are not seriously inflated due to the omission of mental ability or socioeco- nomic status origins. Economic retums to schooling, however, are overestimated by around 35 to 40 percent. Simply put, without adequate controls for ability and SES origins, estimates of the earnings "payoff" of formal education for white men early in their occupa- tional careers are seriously biased.
References
Alexander, K. L., and B. K. Eckland. 1973 Effects of Education on the Social Mobil-
ity of High School Sophomores Fifteen Years Later (1955-1970). Final Report to the National Institute of Education.
1975 "School experience and status attain- ment." Pp. 171-210 in S. Dragastin and G. Elder (eds.), Adolescence in the Life Cycle. Washington, D.C.: Hemisphere.
Alexander, K. L., B. K. Eckland, and L. J. Griffin. 1975 "The Wisconsin model of socioeconomic
achievement: A replication." American Journal of Sociology 81:324-42.
Alwin, D., and R. Hauser. 1975 "The decomposition of path effects."
American Sociological Review 40: 37-47. Alwin, D., R. M. Hauser, and W. H. Sewell. 1975 "Colleges and achievement." Pp. 11342
in W. H. Sewell and R. M. Hauser (eds.),
Education, Occupation, and Earnings: Achievement in the Early Career. New York: Academic Press.
Arrow, K. 1973 "Higher education as a filter." Journal of
Public Economics 2:193-216. Ashenfelter, 0. A., and J. Mooney. 1968 "Graduate education, ability, and earn-
ings." Review of Economics and Statistics 50: 78-86.
Becker, G. 1964 Human Capital. New York: National
Bureau of Economic Research. 1972 "Comment on Bowles." Journal of Politi-
cal Economy 80:S252-53. Berg, I. 1970 Education and Jobs: The Great Training
Robbery. New York: Praeger Publishers. Blau, P. M., and 0. D. Duncan. 1967 The American Occupational Structure.
New York: John Wiley and Sons. Blaug, M. 1972 "The correlation between education and
earnings: What does it signify?" Higher Education 1:53-76.
Blinder, A. 1973 "Wage discrimination: Reduced form and
structural estimates." Journal of Human Resources 8:436-55.
Bowles, S. 1972 "Schooling and inequality fronm generation
to generation." Journal of Political Economy 80:S219-51.
Denison, E. 1964 "Measuring the contribution of educa-
tion." Pp. 13-102 in The Residual Factor and Economic Growth. Organization for Economic Cooperation and Development. Paris:OECD.
Dickinson, K. 1974 "Wage rates of heads and wives." Pp.
123-77 in J. Morgan (ed.), Five Thousand American Families-Patterns of Economic Progress, Vol. 1. Survey Research Center, University of Michigan.
Duncan, 0. D. 1961 "A socioeconomic index for all occupa-
tions." Pp. 109-38 in A. J. Reiss, Jr. (ed.), Occupations and Social Status. New York: Free Press.
1968 "Ability and achievement." Eugenics Quarterly 15 :1-1 1.
1969 "Inheritance of poverty or inheritance of race?" Pp. 85-110 in D. P. Moynihan (ed.). On Understanding Poverty. New York: Basic Books.
1975 Introduction to Structural Equation Models. New York: Academic Press.
Duncan, 0. D., D. L. Featherman, and B. Duncan. 1972 Socioeconomic Background and Achieve-
ment. New York: Seminar Press. Featherman, D. L. 1972 "Achievement orientations and socio-
economic career attainments." American Sociological Review 37:131-43.
Flanagan, R. 1974 "Labor force experience, job turnover, and
racial wage differentials." Review of Eco- nomics and Statistics 56:5 21-29.
Gintis, H. 1971 "Education, technology, and the character-
istics of worker productivity." American Economic Review 61:266-79.
Gordon, D. M. 1972 Theories of Poverty and Underemploy-
ment. Lexington, Mass.: D.C. Heath. Griliches, Z. 1970 "Notes on the role of education in produc-
tion functions and growth account- ing." Pp. 71-127 in W. L. Hansen (ed.), Education, Income, and Human Capital. New York- National Bureau of Economic Research.
Griliches, Z., and W. Mason. 1973 "Education, ability, and income." Pp.
285-316 in A. Goldberger and 0. D. Dun- can (eds.), Structural Equation Models in the Social Sciences. New York: Seminar Press.
Hanoch, G. 1967 "An economic analysis of earnings and
schooling." Journal of Human Resources 2:310-29.
Hansen, W., B. Weisbrod, and W. Scanlon. 1970 "Schooling and earnings of low achiev-
ers." American Economic Review 60:409-18.
Harrison, B. 1972 "Education and underemployment in the
urban ghetto." American Economic Review 62:796-812.
Haug, M. 1973 "Social class measurement and women's oc-
cupational roles." Social Forces 52:86-98. Haug, M., and M. Sussman. 1971 "The indiscriminate state of social class
measurement." Social Forces 49:549-63. Haworth, J., J. Gwartney, and C. Haworth. 1975 "Earnings, productivity, and changes in em-
ployment discrimination during the 1960's." American Economic Review 65:158-68.
Hause, J. 1971 "Ability and schooling as determinants of
lifetime earnings: Or if you're so smart, why aren't you rich?" American Economic Review 61:289-98.
1972 "Earnings profile: Ability and schooling." Journal of Political Economy 80:S108-38.
Hodge, R. 1970 "Social integration, psychological well-
being, and their socioeconomic correlates." Sociological Inquiry 40:182-206.
Jencks, C., et al. 1972 Inequality: A Reassessment of the Effect
of Family and Schooling in America. New York: Basic Books.
Kohen, A. 1971 "Determinants of early labor market suc-
cess among young men: Ability, quantity, and quality of schooling." Paper presented at American Educational Reserach Associa- tion Meetings.
Layard, R., and G. Psacharopoulos. 1974 "The screening hypothesis and the retruns
to education." Journal of Political Economy 82:985-98.
Lewis-Beck, M. 1974 "Determining the importance of an inde-
pendent variable: A path analytic solu- tion." Social Science Research 3:95-107.
Link, C., and E. Ratledge. 1975 "Social returns to quantity and quality of
education: A further statement." Journal of Human Resources 10: 78-89.
Linn, R., and C. Werts. 1969 "Assumptions in making causal inferences
from part correlations, partial correlations, and partial regression coefficients." Psychological Bulletin 72:307-10.
Masters, S. 1974 "The effect of educational differences and
labor market discrimination on the relative
This content downloaded from 188.72.126.196 on Wed, 25 Jun 2014 01:53:00 AMAll use subject to JSTOR Terms and Conditions
where X1 = SES, X2 = ability, X3 = educa- tion, and X4 = occupational status. Next ob- tain the covariances of X1 and X2, X1 and X3, X2 and X3, and X3 and X4.
a22 = 1 and the resulting expression is iden- tical to equation (10) in the text. Thus, OLS estimation of (10), or (8) in the text, yields a biased estimate of 16, the "true" occupational status returns to education. Identical pro- cedures can be used to estimate the bias in earnings returns to schooling. The standardiza- tion procedure is employed simply for con- venience and in no way affects the estimate of the bias. See Deegan (1974) and Duncan (1975) for cogent expositions of the algebra of and types of specification bias.
APPENDIX B
Data and Variables
1. Current Population Survey-Occupation- al Changes in a Generation (CPS- OCG) Sur- vey of March, 1962. The data to be re- analyzed here are for non-Negro males of non- farm origin. The results are presented for four age cohorts: 25-34 (N = 3,141); 35-44 (N = 3,214); 45-54 (N = 2,569); 55-64 (N = 1,482). SES origins are indexed by father's occupa- tion and father's education. Occupational status is measured by Duncan's SEI scale (Duncan, 1961). Annual income is used a proxy for annual earnings. No measure of abil- ity is available. Correlations are from Duncan, Featherman, and Duncan (1972).
2. Current Population Survey-National Opinion Research Center (CPS-NORC I) Sur- vey of October, 1964. The data are for white males of farm and non-farm origin, 25-34 years of age (N = 3,000). SES origins are measured by father's occupation and father's education. Mental ability is assessed by the Armed Forces Qualification Test (AFQT). Oc- cupational status is that of Duncan's SEI scale. Earnings refer to expected earnings in 1964. Correlations are reported in Duncan (1968).
3. CPS-NORC II Survey of October, 1964. This is a subsample of (2) above and pertains to 1,454 veterans between the ages of 21 and 34 (x = 29). Ninety-six percent of the sample is white. All variables are measured as in (2), except that weekly earnings are employed.
Most correlations are reported in Griliches and Mason (1973).
Certain results are anomalous (compared to the results obtained with other data sets) be- cause I use the amount of schooling attained after entrance into the Armed Forces as my measure of educational attainment rather than total years of schooling completed. The zero- order correlations between this schooling in- crement (SI) and occupational status and in- come are only half as large as those between total educational attainment and socio- economic achievements. Therefore, SI can ex- plain uniquely only half as much variance in either labor market outcome. Because SI was ascertained after the measurement of ability (AFQT), a desirable property not shared by either the CPS-NORC I or MICH data, SI con- forms to the theoretical assumptions of the model specified above and is technically the most appropriate measure of educational at- tainment for the purpose of evaluating biases in schooling returns (see the discussion in Griliches and Mason, 1973). Using the total educational attainment variable in the CPS-NORC II data yields "unique" estimates of the importance of schooling on status and income rather comparable to those obtained with the CPS-NORC I data.
4. University of Michigan-Survey Research Center's "Panel Study of Income Dynamics" (MICH-PANEL) for the years 1968-1972. The data are for male heads of households, with a mean age of 45. Ninety-two percent are white (N = 2,186). SES origins are measured by father's occupation and father's education. Occupation was presented (in the report) as a series of dummies and is not used here. Abil- ity was measured by a test administered by the SRC interviewers. Earnings are hourly wage rate. Correlations are from Dickinson (1974).
5. Explorations in Equality of Opportunity (EEO) Survey of 1970. The subsample to be studied here are white males of non-farm ori- gin, all of an approximate age of 30 in 1970 (N = 563). SES origins are indexed by father's occupation, father's education, parental in- come when the respondent was in high school, and a 13-item factor weighted acquisition in-
This content downloaded from 188.72.126.196 on Wed, 25 Jun 2014 01:53:00 AMAll use subject to JSTOR Terms and Conditions
dex of possessions in the respondent's high school household. Ability is assessed by a 20-item test administered by ETS in 1955 when the respondents were sophomores in high school. Occupational status is measured by Duncan's SEI. Earnings are annual earnings for 1969. Correlations among all of the vari- ables have not been published; see Alexander and Eckland (1973) for sampling and mea- surement details and Alexander, Eckland, and Griffin (1975) for analyses of the eamings data.
6. National Longitudinal Survey (NLS) of 1966. The data pertain to 669 respondents who were employed in the civilian labor force, were not enrolled in school, and had attended at least the first year of high school. SES ori- gins are measured by the number of family members who ever attended college and fath- er's occupation. Ability scores were taken from school records. Occupational status is as- sessed by Duncan's SEI scale, while earnings are hourly wage rate. Correlations are re- ported in Kohen (1971).
7. Princeton Fertility Study (PFS) of
1957-1967. These data are limited to 715 male members of native white couples residing in seven of the largest SMSA's in the U.S. over the years 1957-1967. Occupational status is coded in NORC prestige scores (NORC, 1947). Earnings are assessed by reported in- come in 1957. No measure of ability is avail. able. Correlations are from Featherman (1972).
8. Wisconsin Surveys (WISC) of 1957 and 1964. The sample consists of 2,069 Wisconsin seniors in 1957, almost exclusively white, and around 25 years of age in 1964 (when occupa- tional status was measured). SES origins are measured by father's education, father's occu- pation, mother's education, and average parental income over the years 1957-1959. Ability is measured by the Henmon-Nelson test, administered yearly to all Wisconsin juniors. Occupational status is indexed by Duncan's SEI. Earnings are based on a canon- ically weighted average of annual earnings for the years 1965, 1966, 1967, when respon- dents were about 27 years of age. Correlations are reported in Sewell and Hauser (1975).
University Faculty and Attitudinal Militancy toward the Employment Relationship*
PETER FEUILLE
State University of New York at Buffalo
JAMES BLANDIN
U.S. Naval Postgraduate School
Sociology of Education 1976, Vol. 49 (April): 139-145
Several possible determinants of militant attitudes toward the employer-employee relationship among 454 faculty members at one medium-sized university were investigated. Dissatisfaction with several job and organizational context characteristics (especially with the campus adminis- tration) were significant predictors of militant attitudes, but demographic characteristics (e.g., sex, academic rank, tenure status, academic department, faculty organization membership) had very little predictive value. Faculty militancy may be more a function of perceptions of the employing organizational context than of standard demographic characteristics.
* The authors are indebted to the Graduate School, the College of Business Administration Re- search and Publications Committee, and the Institute of Industrial and Labor Relations at the University of Oregon for financial support of the research. Re- sponsibility for the statements and conclusions ex- pressed here are solely the authors', however.
In recent years faculty members on almost four hundred college and university campuses have voted to replace the traditional indi- vidual employee-employer interaction system with collective bargaining (The Chronicle of Higher Education, 1975:5). These collective bargaining arrangements reflect an increasing
This content downloaded from 188.72.126.196 on Wed, 25 Jun 2014 01:53:00 AMAll use subject to JSTOR Terms and Conditions