WP 2016-01 January 2016 Working Paper The Charles H. Dyson School of Applied Economics and Management Cornell University, Ithaca, New York 14853-7801 USA Specification of Spatial-Dynamic Externalities and Implications for Strategic Behavior in Disease Control Shady S. Atallah, Department of Natural Resources and the Environment, University of New Hampshire, Durham NH 03824, USA E-mail: [email protected]Miguel I. Gómez, Dyson School of Applied Economics and Management, Cornell University, Ithaca NY 14853, USA E-mail: [email protected]Jon M. Conrad, Dyson School of Applied Economics and Management, Cornell University, Ithaca NY 14853, USA E-mail: [email protected]
Transcript
WP 2016-01 January 2016
Working Paper The Charles H. Dyson School of Applied Economics and Management Cornell University, Ithaca, New York 14853-7801 USA
Specification of Spatial-Dynamic Externalities and Implications for Strategic Behavior in Disease Control
Shady S. Atallah, Department of Natural Resources and the Environment, University of New Hampshire, Durham NH 03824, USA
1 The problems faced by the two managers differ only in their initial conditions and bioeconomic parameters. We therefore describe the model using the notation of one of them only, namely GH.
11
subject to
E(𝒔𝒔𝑖𝑖,𝑗𝑗,𝑡𝑡+1) = 𝑷𝑷T 𝒔𝒔𝑖𝑖,𝑗𝑗,𝑡𝑡, (2)
where Eq. (2) is the cell-level infection state transition equation and PT is the transpose of the
infection state transition matrix P.
The objective function accounts for the total amount, the timing and the location of control
effort. If a vineyard manager decides to remove and replant a vine in cell (i, j) in period t - τmax,
then 𝑢𝑢𝑤𝑤𝑖𝑖,𝑗𝑗,𝑡𝑡−𝜏𝜏 is equal to 1 and the revenue (first expression in Eq. 1) is multiplied by zero for
periods t – τ + 1, t – τ + 2,…, t – τ + τmax, where τmax is the time it takes from planting to fruit
bearing . If a vineyard manager decides to remove a vine without replanting (𝑧𝑧𝑤𝑤𝑖𝑖,𝑗𝑗,𝑡𝑡 = 1), the
revenue from the cell corresponding to this vine equals zero from t to T. The second expression
in Eq. (1) has the cost of removal-and-replanting (𝑐𝑐𝑢𝑢𝑖𝑖,𝑗𝑗 ), the cost of testing (𝑐𝑐𝑣𝑣𝑖𝑖,𝑗𝑗), and the cost of
removal-without-replanting (𝑐𝑐𝑧𝑧𝑖𝑖,𝑗𝑗), all pre-multiplied by their corresponding binary decision
variables. The expression also includes vine-level operating costs (𝑐𝑐𝑖𝑖,𝑗𝑗), which are grid-level
operating costs divided by the number of cells.
Per-vine revenue, 𝑟𝑟𝑤𝑤𝑖𝑖,𝑗𝑗,𝑡𝑡 , depends on the infection and age states of each cell. Revenue is zero
if the vine’s age 𝑚𝑚𝑖𝑖,𝑗𝑗,𝑡𝑡 is below 𝜏𝜏𝑚𝑚𝑚𝑚𝑚𝑚 (Eq. 3). Beyond that age, 𝑟𝑟𝑤𝑤𝑖𝑖,𝑗𝑗,𝑡𝑡 , depends on the vine’s
infection state 𝒔𝒔𝑖𝑖,𝑗𝑗,𝑡𝑡. The disease causes a yield reduction of 𝑦𝑦𝑆𝑆𝚤𝚤,𝚥𝚥,𝑡𝑡� , compared to the yield of a
healthy vine (𝑦𝑦𝑆𝑆𝑖𝑖,𝑗𝑗,𝑡𝑡=𝐻𝐻𝐻𝐻𝑚𝑚𝐻𝐻𝑡𝑡ℎ𝑦𝑦) with different levels of yield reduction depending on the infection
state.2 In addition, grapes from disease-affected vines are subject to a price penalty 𝑝𝑝𝑠𝑠𝚤𝚤,𝚥𝚥,𝑡𝑡� (Eq. 4)
2 Yield from a vine in the Healthy state (𝑦𝑦𝑆𝑆𝑖𝑖,𝑗𝑗,𝑡𝑡=𝐻𝐻𝐻𝐻𝑚𝑚𝐻𝐻𝑡𝑡ℎ𝑦𝑦) is obtained by dividing per-acre yield in plot H over the planting density.
12
when compared to the price paid for grapes harvested from healthy vines (𝑝𝑝𝑆𝑆𝑖𝑖,𝑗𝑗,𝑡𝑡=𝐻𝐻𝐻𝐻𝑚𝑚𝐻𝐻𝑡𝑡ℎ𝑦𝑦). The
same description applies to cells (m, n) in grid (vineyard) 𝐺𝐺𝐿𝐿.
In Eq. (7a), for any vine (i, j), 𝛾𝛾𝐿𝐿,𝐻𝐻,𝑡𝑡 is inversely proportional to the distance from the shared
boundary (i.e., column j for GH and column N-n for GL). We choose a power-law specification
because it allows the disease long-distance diffusion to have new infection foci emerging beyond
the disease invading front, which is consistent with modeling the wind dispersal of insects
(Gibson 1997; Marco, Montemurro, and Cannas 2011). Parameter 𝛾𝛾𝐿𝐿,𝐻𝐻,𝑡𝑡 is also proportional to
the total number of Infective vines in GL, weighted by their column position n (numerator in Eq.
7a). Weighting each Infective vine by its column position n allows vines closer to the bordering
column to contribute more to the externality than vines situated farther from the boundary (i.e.,
cell-level distance dependence). The denominator in Eq. (7a) allows the multiplier of the power-
law expression to vary between 0 and 1 as the number of Infective vines in GL varies between 0
and M*N (i.e., density dependence). In the baseline case, we initialize the disease in GL and the
disease spreads to GH according to Eq. (7a). Once vines in vineyard GH become Infective, they
can act as a source of infection for Healthy vines in vineyard GL according to Eq. (7b), thus
16
making the externality bidirectional.5 Note that this power-law specification allows local
management and dispersal to take place at different spatial scales, a modeling challenge
identified by recent bioeconomic studies (Aadland, Sims, and Finnoff 2015). This specification
of dispersal is novel in that it allows private actions of one manager in one management unit (i.e.,
the cell) to have repercussions not only on neighboring units but also on non-neighboring units
that are managed by a different manager. Combined with short-distance dispersal, this distance
and density dependent specification of long-distance dispersal allows testing whether within-
parcel spatial considerations are also important for generating externalities. This is in contrast to
extant resource and environmental economics literature, which assumes that spatial
considerations only matter in that they define the spatial limit to private actions, and that
managers ignore how their management in one cell affects payoffs through multi-cell dispersal.
For descriptions of probabilities c, d, and f, we refer the reader to Atallah et al. (2015). Short-
and long-distance disease diffusion parameters are presented in Table 1a and Figure 1.
[Insert Table 1a here]
[Figure 1]
4. Computational experiments and solution frameworks
We conducted Monte Carlo experiments, each consisting of a set of 1,000 simulations.
Experiments differ based on the strategy pairs employed in both vineyards to control the disease.
Outcome realizations for a given run within an experiment differ due to random location of
initially infected vines in the grid where the disease is initialized (GL, for the baseline case), and
5 In applications where the externality is asymmetric (e.g., prevailing winds), γ can be given different values in Eq. 7a and Eq. 7b. Setting γL,H,t. and γH,L,t to zero collapses the disease diffusion model to a case with no externality (Atallah et al. 2015).
17
stochastic disease diffusion within and between vineyards. Data collected over simulation runs
are the NPV realizations under each strategy pair.
4.1. Model initialization
Grapevines are initialized as Healthy and of age equal to zero in both vineyards GH and GL (high-
and low-valued vineyard, respectively). At t=1, seven percent of the grapevines in GL are chosen
at random from U (0, M*N) to transition from state Healthy to state Exposed-undetectable.6
Subsequently, the disease spreads to Healthy vines within GL according to the Markov transition
process given by Eq. (2) and Eq. (5). The Infective vines in GL act as a primary source of long-
distance disease diffusion to the Healthy vines in GH. The disease spreads from GL to GH
according to the distance- and density-dependent diffusion function 𝛾𝛾𝐿𝐿,𝐻𝐻,𝑡𝑡 (Eq. 7a).
Subsequently, Infective vines in GH act as a source of reinfection in GL according to the distance-
and density-dependent diffusion function 𝛾𝛾𝐻𝐻,𝐿𝐿,𝑡𝑡 (Eq. 7b) and so on. Economic parameters are
presented in Table 1b.
[Insert Table 1b here]
4.2. Nonspatial, spatial, and fire-break strategies
Nonspatial strategies (strategies 1 to 8, Table 2) consist of removing and replacing vines based
on symptoms alone (Infective-moderate; Infective-high) or based on symptoms and age of
individual vines (Young: 0-5 years; Mature: 6-19 years; Old: 20 years and above).7 In the subset
of spatial strategies (strategies 9 to 18, Table 2), the manager removes and replants symptomatic
6 This initialization reflects findings indicating that primary infection sources are randomly spatially distributed (Cabaleiro et al. 2008). The disease is initialized in GL assuming a higher-valued vineyard is not likely to purchase infected plant material. In the sensitivity analysis sections, we consider the opposite case. 7 A manager might decide to strategically remove younger vines, which exhibit higher risk of transitioning from the Exposed to the Infective state than their older counterparts (probability d in Eq. 5).
18
vines (Infective-moderate) and tests their neighbors. Neighboring vines are removed and
replaced if they test positive. In that sense, the manager's spatial disease control decisions are
based on a vine’s own state and the state of vines in neighboring cells. For example, according to
strategy ImNS (table 2), vines in cells (i-1, j) and (i+1; j) would be removed and replaced based
on the state of vine in cell (i,j); according to strategy ImNSEW, vines in cells (i-1, j), (i+1; j), (i, j-
1) and (i, j+1) would be removed and replaced based on the state of vine in cell (i,j), and
similarly for all within-grid, spatial strategies.
The third subset of strategies includes fire-break strategies that consist of removing (without
replanting) vines in the border columns of a vineyard in order to create ‘fire-breaks’ or ‘buffer
zones’ that would reduce long-distance disease diffusion between vineyards (Strategy 19 to
Strategy 57 in Table 2). Fire-break strategies are intended to decrease the effect of spillovers
between vineyards and can give a manager control over their disease risk. All strategies are
available to both managers.
[Insert Table 2 here]
4.3. Solution frameworks and game theoretic solution concepts
We employ the objective function (Eq. 1) to rank the vineyard ENPVs under the alternative
disease control strategy pairs. We first solve the social planner problem and cooperative solution
(C). The solution to these problems is relevant for situations where one vineyard management
firm manages contiguous vineyards that produce wine grapes of different qualities. Second, we
solve for the noncooperative solution (NC). Third, whenever the cooperative surplus is strictly
positive, we find the cooperative solution that satisfies the Nash bargaining framework
19
Social planner. The social planner chooses the pair of disease management strategies
(𝒲𝒲𝐻𝐻 ,𝒲𝒲𝐿𝐿) that maximizes the total payoff (ENPVT), the sum of the expected net present values
of GL (ENPVL) and GH (ENPVH). The following maximization problem is solved:
𝑚𝑚𝑚𝑚𝑚𝑚(𝒲𝒲𝐻𝐻 ,𝒲𝒲𝐿𝐿)
𝐸𝐸𝑁𝑁𝐸𝐸𝑉𝑉𝐻𝐻 + 𝐸𝐸𝑁𝑁𝐸𝐸𝑉𝑉𝐿𝐿, (8a)
subject to:
𝐸𝐸(𝒔𝒔𝑖𝑖,𝑗𝑗,𝑡𝑡+1) = 𝑷𝑷𝑇𝑇 𝒔𝒔𝑖𝑖,𝑗𝑗,𝑡𝑡, (8b)
and
𝐸𝐸(𝒔𝒔𝑚𝑚,𝑛𝑛,𝑡𝑡+1) = 𝑷𝑷𝑇𝑇 𝒔𝒔𝑚𝑚,𝑛𝑛,𝑡𝑡 (8c)
where Eq. (8b) and Eq. (8c) are the cell-level infection state transition equations in GH and GL,
respectively. Note that the managers do not face a common or shared state variable: each
manager contends with the stochastic evolution of the disease in his vineyard (Eq. 8b and 8c)
while not knowing the status of the disease in the neighboring vineyard. They only observe the
control strategy being adopted by the neighboring manager (expect for the simultaneous-move
case).
Noncooperative disease control. We use the Nash equilibrium solution concept to solve a
simultaneous-move game where the managers do not cooperate and do not share any information
about their strategies. We use the subgame perfect Nash equilibrium concept to solve a
sequential game with asymmetry of information where one player moves first and the other
player makes his choice accordingly (Tirole, 1988). In both simultaneous and sequential move
cases, we consider situations where the disease starts in GL and in GH.
Cooperative disease control: Nash bargaining game. To solve the cooperative disease control
game, we use the static axiomatic approach, specifically the Nash bargaining game (Nash 1953;
Binmore, Rubinstein, and Wolinsky 1986). The Nash bargaining game here is similar to the one
20
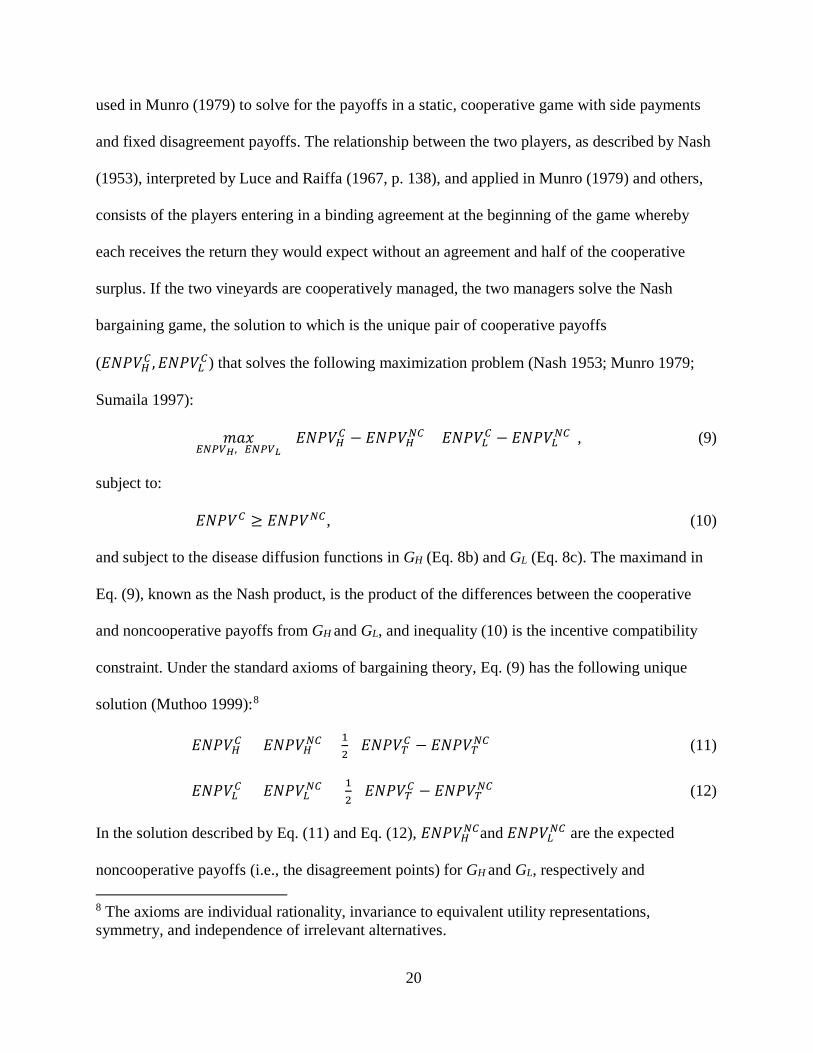
used in Munro (1979) to solve for the payoffs in a static, cooperative game with side payments
and fixed disagreement payoffs. The relationship between the two players, as described by Nash
(1953), interpreted by Luce and Raiffa (1967, p. 138), and applied in Munro (1979) and others,
consists of the players entering in a binding agreement at the beginning of the game whereby
each receives the return they would expect without an agreement and half of the cooperative
surplus. If the two vineyards are cooperatively managed, the two managers solve the Nash
bargaining game, the solution to which is the unique pair of cooperative payoffs
(𝐸𝐸𝑁𝑁𝐸𝐸𝑉𝑉𝐻𝐻𝐶𝐶 ,𝐸𝐸𝑁𝑁𝐸𝐸𝑉𝑉𝐿𝐿𝐶𝐶) that solves the following maximization problem (Nash 1953; Munro 1979;
and subject to the disease diffusion functions in GH (Eq. 8b) and GL (Eq. 8c). The maximand in
Eq. (9), known as the Nash product, is the product of the differences between the cooperative
and noncooperative payoffs from GH and GL, and inequality (10) is the incentive compatibility
constraint. Under the standard axioms of bargaining theory, Eq. (9) has the following unique
solution (Muthoo 1999):8
𝐸𝐸𝑁𝑁𝐸𝐸𝑉𝑉𝐻𝐻𝐶𝐶 = 𝐸𝐸𝑁𝑁𝐸𝐸𝑉𝑉𝐻𝐻𝑁𝑁𝐶𝐶 + 12
(𝐸𝐸𝑁𝑁𝐸𝐸𝑉𝑉𝑇𝑇𝐶𝐶 − 𝐸𝐸𝑁𝑁𝐸𝐸𝑉𝑉𝑇𝑇𝑁𝑁𝐶𝐶) (11)
𝐸𝐸𝑁𝑁𝐸𝐸𝑉𝑉𝐿𝐿𝐶𝐶 = 𝐸𝐸𝑁𝑁𝐸𝐸𝑉𝑉𝐿𝐿𝑁𝑁𝐶𝐶 + 12
(𝐸𝐸𝑁𝑁𝐸𝐸𝑉𝑉𝑇𝑇𝐶𝐶 − 𝐸𝐸𝑁𝑁𝐸𝐸𝑉𝑉𝑇𝑇𝑁𝑁𝐶𝐶) (12)
In the solution described by Eq. (11) and Eq. (12), 𝐸𝐸𝑁𝑁𝐸𝐸𝑉𝑉𝐻𝐻𝑁𝑁𝐶𝐶and 𝐸𝐸𝑁𝑁𝐸𝐸𝑉𝑉𝐿𝐿𝑁𝑁𝐶𝐶 are the expected
noncooperative payoffs (i.e., the disagreement points) for GH and GL, respectively and 8 The axioms are individual rationality, invariance to equivalent utility representations, symmetry, and independence of irrelevant alternatives.
21
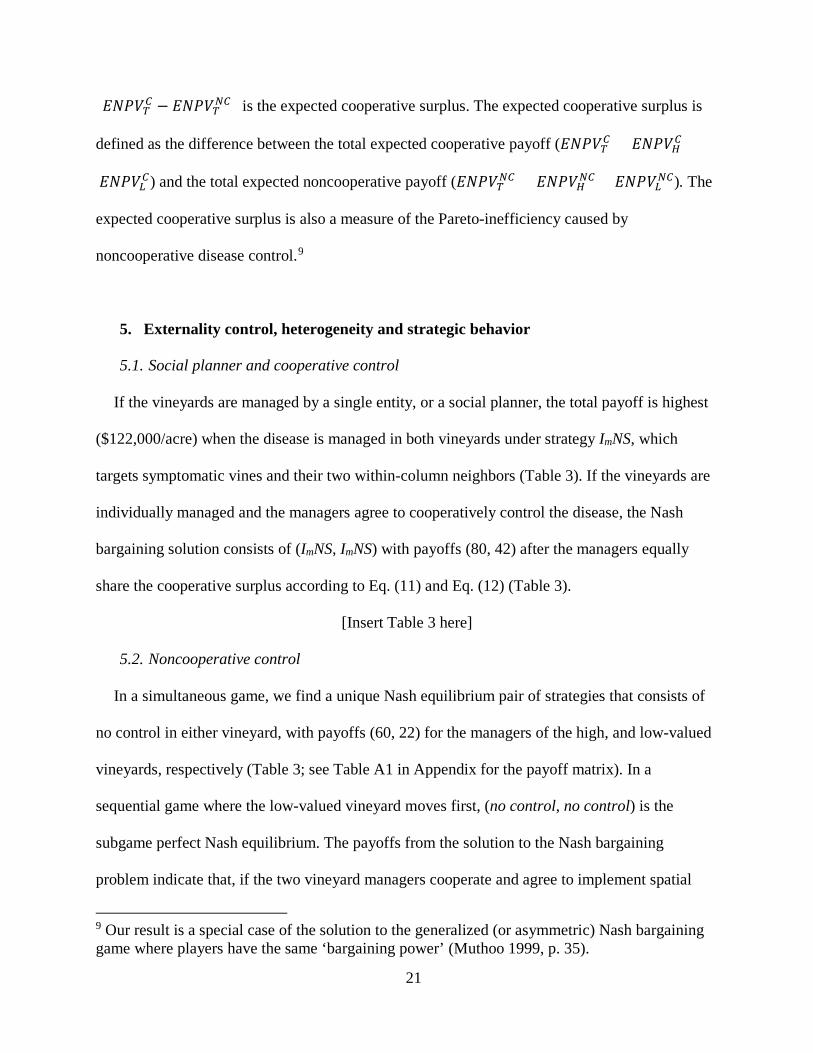
(𝐸𝐸𝑁𝑁𝐸𝐸𝑉𝑉𝑇𝑇𝐶𝐶 − 𝐸𝐸𝑁𝑁𝐸𝐸𝑉𝑉𝑇𝑇𝑁𝑁𝐶𝐶) is the expected cooperative surplus. The expected cooperative surplus is
defined as the difference between the total expected cooperative payoff (𝐸𝐸𝑁𝑁𝐸𝐸𝑉𝑉𝑇𝑇𝐶𝐶 = 𝐸𝐸𝑁𝑁𝐸𝐸𝑉𝑉𝐻𝐻𝐶𝐶 +
𝐸𝐸𝑁𝑁𝐸𝐸𝑉𝑉𝐿𝐿𝐶𝐶) and the total expected noncooperative payoff (𝐸𝐸𝑁𝑁𝐸𝐸𝑉𝑉𝑇𝑇𝑁𝑁𝐶𝐶 = 𝐸𝐸𝑁𝑁𝐸𝐸𝑉𝑉𝐻𝐻𝑁𝑁𝐶𝐶 + 𝐸𝐸𝑁𝑁𝐸𝐸𝑉𝑉𝐿𝐿𝑁𝑁𝐶𝐶). The
expected cooperative surplus is also a measure of the Pareto-inefficiency caused by
noncooperative disease control.9
5. Externality control, heterogeneity and strategic behavior
5.1. Social planner and cooperative control
If the vineyards are managed by a single entity, or a social planner, the total payoff is highest
($122,000/acre) when the disease is managed in both vineyards under strategy ImNS, which
targets symptomatic vines and their two within-column neighbors (Table 3). If the vineyards are
individually managed and the managers agree to cooperatively control the disease, the Nash
bargaining solution consists of (ImNS, ImNS) with payoffs (80, 42) after the managers equally
share the cooperative surplus according to Eq. (11) and Eq. (12) (Table 3).
[Insert Table 3 here]
5.2. Noncooperative control
In a simultaneous game, we find a unique Nash equilibrium pair of strategies that consists of
no control in either vineyard, with payoffs (60, 22) for the managers of the high, and low-valued
vineyards, respectively (Table 3; see Table A1 in Appendix for the payoff matrix). In a
sequential game where the low-valued vineyard moves first, (no control, no control) is the
subgame perfect Nash equilibrium. The payoffs from the solution to the Nash bargaining
problem indicate that, if the two vineyard managers cooperate and agree to implement spatial
9 Our result is a special case of the solution to the generalized (or asymmetric) Nash bargaining game where players have the same ‘bargaining power’ (Muthoo 1999, p. 35).
22
Strategy ImNS in their respective vineyards, there is a cooperative surplus of $40,000 for the two
acres. This surplus is statistically significant at the 1% level and represents a welfare (ENPVT)
gain of approximately 47% over the noncooperative outcome. These benefits to cooperation are
consistent with previous findings from studies on the cooperative management of fisheries
(Sumaila 1997) and nuisance wildlife species (Bhat and Huffaker 2007).
Interestingly, we find that the social planner solution can be achieved, without cooperation,
when the high-value manager moves first. In that case, his optimal strategy is spatial control
ImNS. Given GH’s commitment to spatially control the disease, GL’s value of control increases
due to the strategic complement nature of disease (or pest) control with neighbor-to-neighbor
spillovers (Fenichel, Richards, and Shanafelt 2014). GL’s optimal strategy is spatial control,
ImNS, as well, with payoff $31,000/acre. The strategic complement nature of transboundary
disease control also explains why (no control, no control) is the subgame perfect Nash
equilibrium strategy in a sequential game where GL moves first as well as in a simultaneous
game.
5.3. Welfare effects of the externality specification
We measure the welfare implications of including the detailed within-parcel, spatial,
biophysical process in our specification of the externality and its control. We do so by
comparing the model’s outcomes to those obtained from management decisions using strategies
that ignore the within-parcel spatial dynamics of the biophysical process. We restrict the set of
disease control strategies to those that are nonspatial and those that consist of ‘fire-breaks’ (1
through 8, and 10 through 57, Table 2). Including the inter-parcel, spatial strategies leads to
strategy (ImNS, ImNS), with total payoffs of $122,000. Ignoring within-parcel spatial
considerations leads to the strategy pair (no control, no control) and total payoffs of $82,000,
23
thus overestimating the social cost of the externality in the social planner setting, the Nash
bargaining game, and the noncooperative sequential game where GH moves first. 10 For the
settings where (no control, no control) is the subgame Nash perfect equilibrium strategy pairs –
the simultaneous game and the sequential game where GL moves first – welfare remains
(unsurprisingly) the same regardless of whether or not within-parcel spatial considerations are
taken into account.
5.4. Dynamic sensitivity analysis
We conduct a dynamic sensitivity analysis to examine the effect of changes in the values of
key within-parcel and across-parcel disease diffusion parameters on the externality’s welfare
impacts. These parameters are the short-distance parameter 𝛼𝛼 in Eq. 6; the long-distance
diffusion parameter 𝛾𝛾 in Eq. (7a) and Eq. (7b); the vineyard size parameters I, J, M, and N in
these same equations; and disease initialization.
First, we find that reducing the value of the short-distance parameter 𝛼𝛼 by half (from 4.2 to
2.1) causes aggregate welfare to increase by 52% in a noncooperative, simultaneous game or in a
noncooperative, sequential game where GL moves first and none of the managers controls the
disease. The increase in welfare ensuing from a reduction in 𝛼𝛼 is more modest, 3%, in a
nooncooperative game where GH moves first or in a Nash bargaining game where both managers
spatially control the disease (percent changes are obtained by comparing payoffs in Table 4 with
those in Table A2 of the appendix). Reduction in the value of the short-distance parameter can be
achieved by increasing the distance between grapevines within the grid’s columns and suggests
that individual, within-parcel choices about the physical configuration of the vineyard can
directly impact the welfare effects of an externality.
10 This welfare increase is for two one-acre vineyards, over 50 years.
24
Second, we solve the baseline problem for larger and smaller values of the long-distance
transmission coefficient 𝛾𝛾. 11 For a larger long-distance transmission coefficient (i.e., where
disease transmission is characterized by a more rapid decline over space and the vineyards are
therefore less ecologically connected), the manager of the lower-value vineyard spatially controls
the disease, in which case the GH does not need to control (Table A3-a of the appendix). The
outcome (no control, ImNS) does not depend on the type of game played. If the long-distance
transmission coefficient has a smaller value than in the baseline case, none of the managers
control the disease in any of the noncooperative game solutions and the strategy pair (ImNS, Exit)
is the central planner’s solution (Table A3-b of the appendix). These results identify an upper
bound for the long-distance diffusion coefficient where the externality does not trigger any
control in the neighboring vineyard, and a lower bound where the externality is large enough to
warrant removal of the lower-valued vineyard by a central planner. Changes in the value of 𝛾𝛾 can
be achieved by modifying the biophysical environment that affects the extent to which the
vineyards are ecologically connected, such as physical barriers or other pest management
practices that reduce the flow of insect vectors.
Third, we explore the effect of the relative vineyard size. Recall that in the baseline case, GH
is larger than GL, the NE strategy pair is (no control, no control), and the noncooperative payoffs
are 32% lower than the cooperative or social planner payoffs, generated by the strategy pair
(ImNS, ImNS). If the relative size of the vineyards is reversed (GL larger than GH) or if both
vineyards are large, we obtain the same strategy pair solutions. The noncooperative,
11 The ratio of new infections caused by long-distance diffusion between vineyards to total new
infection events is 90% for t=12 months, and decreases to 69%, 34%, and 21% for t=100, 300, and 600 months, respectively (results are expected values from 1,000 simulations conducted for GH, under the baseline case and a strategy of no control in both vineyards).
25
simultaneous game’s total payoffs are 31 and 41% lower than the cooperative payoffs, if GL is
larger or both are large, respectively (Table A4- b and c). However, if both vineyards are smaller,
strategy (ImNS, ImNS) is the strategy pair solution in all frameworks and the externality is
minimized (Table A4- c). The results from these three vineyard size scenario analysis are driven
by disease population dynamics: a larger vineyard has a larger population of Susceptible
grapevines, which speeds disease diffusion and renders disease control less effective (and less
cost-effective) than a strategy of no control.
Fourth, we explore the implications of the disease beginning in the high-valued vineyard, as
opposed to the most likely case where the disease starts in the low-valued vineyard. Initializing
the disease in GH instead of GL leads to the Nash equilibrium (ImNS, ImNS) no matter whether the
game is simultaneous or sequential, noncooperative or cooperative (Table A5 of the appendix).
In the baseline case, an uncontrolled lower-valued vineyard provides a reserve for the disease,
affects the incentives for control in GH, and leads to the Nash equilibrium (no control, no
control).
5.5. Heterogeneity, strategic behavior, and total payoff
We now turn to addressing whether and how manager heterogeneity affects strategic disease
control decisions and total payoffs. Although our focus is on strategic (noncooperative) behavior,
we also solve the Nash bargaining game to gain insight on the differences between cooperative
and noncooperarive outcomes under increased heterogeneity. To that end, we solve the problem
for five additional price pairs under all noncooperative and cooperative settings: starting with the
baseline price pair (Table 4, case 5), we consider four mean-preserving price gap contractions
(Table 4, cases 1 to 4) and two mean-preserving price gap expansions (Table 4, cases 6 and
26
7).12,13 Results in Table 4 show that the price gap has a substantial influence on the managers’
strategic behavior and their payoffs. These results can be discussed in terms of three distinct
management situations. First, in cases 1 through 4, both managers choose Strategy ImNS
regardless of whether the game is simultaneous or sequential, cooperative or noncooperative. In
these cases, prices received for grapes in both vineyards are high enough for the managers to
afford Strategy ImNS and the price gap is small enough for the incentives of both players to be
aligned.
[Insert Table 4 here]
In contrast, in cases 5 through 7, the price gap is large enough for the managers to have
different privately optimal disease control strategies. In cases 5 and 6, the strategy pair (no
control, no control) constitutes a unique Nash equilibrium in a simultaneous game. In the
baseline case 5, GL opts for no control when he moves first, while GH opts for ImNS when he
moves first. Then, because of strategic complementarity in disease control, the second mover
chooses the same strategy as the first mover. The unique subgame perfect Nash equilibrium is
therefore (no control, no control) if GL moves first and (ImNS, ImNS) if GH moves first. In case 6,
however, due to the low price received by GL, (no control, no control) is the Nash equilibrium of
the simultaneous game and the subgame perfect Nash equilibrium in the sequential game, no
matter which manager moves first (Table 4, case 6). The greater heterogeneity in prices in case 6
also causes the cooperative solution to be different compared to case 5. Here, the Nash
bargaining solution consists of GH paying GL ($34,000/acre) to exit production (Strategy 16Col
or Exit), in which case there is no externality and GH controls the disease in his vineyard through
12 Note that the price gap is equal to zero in case 1 and it increases as we move to case 7. 13 When conducting price expansions, we also increase the quality penalty (linearly with the price) up to an upper bound of 70%.
27
strategy ImNS. After this transfer, both managers are better off compared to the noncooperative
solution ($97,000 vs. $72,000 for GH and $28,000 vs. $3,000 for GL; Table 4, case 6). The Nash
bargaining solution improves the aggregate payoffs by 67% when compared with the
noncooperative solution (percent difference between $126,000 and $75,000 in Table 4, case 6).
In case 7, the price received by GL is low enough for Strategy 16Col or Exit (exiting production)
to be privately optimal, in which case GH implements spatial control ImNS regardless of whether
the game is simultaneous or sequential, cooperative or noncooperative.
Along the various degrees of manager heterogeneity represented in the six noncooperative
setting cases (cases 1 through 6, simultaneous and sequential settings), total payoff is
monotonically decreasing in the level of heterogeneity (i.e., the magnitude of price gap) between
cases 1 and 6. Cases 6 and 7, on the other hand, represent a range where the relationship between
price gap (more generally, heterogeneity) and total payoff (more generally, social welfare)
becomes U-shaped (Figure 2, panel a). The shape of the curve is unchanged in a cooperative
game but the effect of increased heterogeneity is less pronounced. First, Nash bargaining reduces
the magnitude of the decline in total payoffs for cases 5 and 6. Second, it shifts the inflexion
point of the U-shaped curve to the left, that is, the curvature takes place at a lower level of
heterogeneity (in case 5 instead of case 6) (Figure 2, panel b). Figure 2 shows that there is a
critical range of heterogeneity in resource value that substantially reduces welfare and that it is
exactly in this range that cooperative control is welfare-improving in comparison to
noncooperative control.
[Insert Figure 2 here]
6. Conclusions
28
In this paper, we examined how metapopulation models and cellular automata can be
combined to develop a novel distance- and density-dependent specification of externalities that
acknowledges the importance of inter- and intra-parcel spatial dynamics in the generation and
control of externalities. Our specification is general in that it can be collapsed to represent
metapopulation models only, cellular automata models only, or a combination of the two, with
short-distance diffusion only, long-distance diffusion only, or with both, depending on the
characteristics of the process generating the externalities.
We used this specification to solve spatial noncooperative and cooperative games that
endogenize spatial risk beyond the immediate neighborhood and capture the inter- and intra-
parcel private incentives to control. We found that within-parcel spatial decisions can generate
the externality and may lead to inefficient outcomes in the decentralized management of public
bads. We also showed that noncooperative strategic spatial decisions within the parcel can lead
to efficient outcomes even in the absence of Coasian bargaining (Coase 1960). Finally, we have
characterized the relationship among resource value heterogeneity, strategic behavior, and total
payoffs. Our analysis, with heterogeneity, allows of different, first-move-dependent,
noncooperative equilibria ranging from no control to spatial control to entire vineyard removal.
Our work contributes to the growing literature that examines the spatial-dynamic nature of
externalities by increasing the spatial dimension of the problem and the number of players
making strategic decisions. We show that increased computational power that has allowed
researchers to consider larger grids and a greater number of players, can also be used to
understand the spatial-dynamics within a parcel that determine the generation of externalities and
private incentives to control. Our results suggest that ignoring the complex biophysical details of
29
the within-parcel spatial dynamics can lead to misleading measures of welfare impacts of
externalities.
Our model makes valuable contributions to the literature can be extended to examine other
types of spatial-dynamic externalities. Yet, it has several limitations that should be addressed in
future research. For instance, the model does not offer clear insights into the cooperative
management of externalities in which disagreement payoffs (i.e., noncooperative payoffs) are not
fixed, agreement renegotiation is needed and there are more than two players. In such situations,
differential games with N players might be appropriate but solution methods for such games
require restrictive assumptions about the state equations and game solutions are not guaranteed
(Bressan 2011). In parallel to the on-going research on whether stable solutions exist, future
research might use evolutionary or learning dynamics to explore whether solutions to spatial-
dynamic externalities in N-player bargaining games are achievable (Smead et al. 2014). Such
effort might identify reasons why desirable solutions might not be attainable and the mechanisms
that might be implemented to increase the likelihood of reaching these solutions.
30
REFERENCES
D. Aadland, C. Sims, and D. Finnoff, Spatial Dynamics of Optimal Management in Bioeconomic
M. D. Smith, J. N. Sanchirico and J. E. Wilen, The economics of spatial-dynamic processes:
applications to renewable resources, Journal of Environmental Economics and Management 57
(2009) 104-121.
U. R. Sumaila, Cooperative and non-cooperative exploitation of the Arcto-Norwegian cod stock,
Environmental and Resource Economics 10 (1997) 147-165.
S.K. Swallow, D.N. Wear, Spatial Interactions in Multiple-Use Forestry and Substitution and
34
Wealth Effects for the Single Stand, Journal of Environmental Economics and Management 25
(1993) 103-120.
Tirole, J., The theory of industrial organization (1988). MIT press.
35
Fig. 1 Short-distance diffusion is governed by 𝛼𝛼 for within-column dispersal and 𝛽𝛽 for across-column dispersal; Long-distance diffusion between H (right) and L (left) is governed by 𝛾𝛾𝐻𝐻,𝐿𝐿 (from H to L) and 𝛾𝛾𝐿𝐿,𝐻𝐻 (from L to H). Shaded cell represents Infective vine.
36
Fig. 2 Total payoffs for each of the seven price differential cases, in a noncooperative, sequential game where GL moves first (panel a), and in a cooperative, Nash bargaining game (panel b). Each data point is an expected value obtained from 1,000 simulations.
case 1: (1912, 1912)
case 2:(2198, 1626)
case 3:(2485, 1339)
case 4:(2771, 1053)
case 5:(3058, 766)
case 6:(3344, 480)
case 7(3631, 194)
60
80
100
120
140
160
180
0 500 1000 1500 2000 2500 3000 3500 4000
Tota
l pay
offs
($ 1
,000
/tw
o ac
res)
Price gap ($/ton)
Panel a
case 1: (1912, 1912)
case 2:(2198, 1626)
case 3:(2485, 1339)
case 4:(2771, 1053)
case 5:(3058, 766) case 6:
(3344, 480)
case 7(3631, 194)
60
80
100
120
140
160
180
0 500 1000 1500 2000 2500 3000 3500 4000
Tota
l pay
offs
($ 1
,000
/tw
o ac
res)
Price gap ($/ton)
Panel b
37
Table 1 a Disease diffusion parameters Parameter Description Value Unit α Within-column H to Eu transition rate 4.2 month -1 β Across-column H to Eu transition rate 0.014 month -1 γ Distance-dependence, power-law
parameter 3 unitless
τmax Period from planting until fruit bearing 36 months Sources: Values of parameters α and β are obtained from model calibration in Atallah et al. (2014) using data in Charles et al. (2009) with validation using data in Cabaleiro and Segura (2006) and Cabaleiro et al. (2008). The value of parameter value γ is obtained from Cabaleiro and Segura (1997). Parameter value for τmax is from White (2008).
38
Table 1 b Economic parameters faced by managers of vineyards GH and GL Vineyard GH Vineyard GH Vineyard layout Grid dimensions (rows*columns)
Yield (tons/acre/month) 0.375 0.834 Planting density (vines/acre)
1,564
784
Yield (tons/vine/year) Yield (tons/vine/month)
0.0029 0.0002
0.0128 0.0011
Yield reduction (%)a
Depends on
Depends on
30
30
50
50
75
75
Cost parameters Roguing and replanting ($/vine)
14.6
14.6
Roguing ($/vine)
8
8
Testing ($/vine)
2.6
2.6
Operating costs ($/vine)
3.6
2.8
Discount factor (month -1) b ρ 0.9959 ρ 0.9959
a Note that managers are unable to observe yield reduction for each grapevine; instead they observe average yield. b The discount factor is equivalent to an annual discount rate of 5%. Sources: Values for vineyard H’s parameters are from Cooper, Klonsky, and De Moura (2012) and values for vineyard L’s parameters are from Verdegaal, Klonsky, and De Moura (2012). Grape prices are from the California Department of Food and Agriculture (2014). Removal and replanting costs are from Klonsky and Livingston (2009).
39
Table 2 Disease control strategies: definitions and acronyms Strategies Acronym Nonspatial strategies
1 Removing and replacing all vines that are Infective. I 2 Removing and replacing all vines that are Infective-moderate. Im 3 Removing and replacing all vines that are Infective-high. Ih 4 Removing and replacing vines that are Infective-moderate and Young. ImY 5 Removing and replacing vines that are Infective-moderate and Mature. ImM 6 Removing and replacing vines that are Infective-moderate and Old. ImO 7 Removing and replacing vines that are Infective-high and Mature. IhM 8 Removing and replacing vines that are Infective-high and Old. IhO
Spatial strategies 9
Removing and replacing Infective-moderate vines in addition to testing their two within-column neighbors then removing and replacing those that test positive.
ImNS
10 Removing and replacing Infective-moderate vines in addition to testing their two across-column neighbors and two-within column neighbors then removing and replacing those that test positive.
ImNSEW
11 Removing and replacing Infective-moderate vines in addition to testing their four within-column neighbors and two across-column neighbors then removing and replacing those that test positive.
ImNS2EW
12 Removing and replacing Infective-moderate vines in addition to testing their four within-column and four within-row neighbors then removing and replacing those that test positive.
ImNS2EW2
13 Removing and replacing Young, Infective-moderate vines in addition to testing their two within-column neighbors then removing and replacing those that test positive.
ImY-NS
14 Removing and replacing Mature, Infective-moderate vines in addition to testing their two within-column neighbors then removing and replacing those that test positive.
ImM-NS
15 Removing and replacing Old, Infective-moderate vines in addition to testing their two within-column neighbors then removing and replacing those that test positive.
ImO-NS
16 Removing and replacing Young, Infective-moderate vines in addition to testing their two across-column neighbors and two-within column neighbors then removing and replacing those that test positive.
ImY-NSEW
17 Removing and replacing Mature, Infective-moderate vines in addition to testing their two across-column neighbors and two-within column neighbors then removing and testing those that test positive.
ImM-NSEW
18 Removing and replacing Old, Infective-moderate vines in addition to testing their two across-column neighbors and two-within column neighbors then removing and replacing those that test positive.
ImO-NSEW
‘Fire-break’ strategies 19 Removing all the vines in the bordering column in GL. 1Col 20 Removing all the vines in two bordering columns in GL. 2Col … … … 34 Removing all the vines in all 16 columns GL. 16Col or Exit 35 Removing all the vines in the bordering column in GH. 1Col 36 Removing all the vines in two bordering columns in GH. 2Col … … … 57 Removing all the vines in all 23 columns GH. 23Col or Exit
Note: Strategies are assumed to be implemented at t=24, which corresponds to the moment when initially infected vines in GL develop visual symptoms. Note that strategies 25 and 42 correspond to total vineyard removal for the smaller and larger vineyards, respectively. Source: Nonspatial and spatial strategies are from Atallah et al. (2014).
40
Table 3 Expected payoffs under the social planner, noncooperative, and cooperative solutions
Expected Payoffs a ($1,000/acre over 50 years) Strategies (GH, GL)
(ImNS, ImNS) 91 (3) 31 (5) 122 40*** 80 42 Simultaneous game or sequential game, GL moves first
(no control, no control) 60 (3) 22 (1) 82 N/A N/A N/A Sequential game, GH moves first
(ImNS, ImNS) 91 (3) 31 (5) 122 N/A N/A N/A
N/A is not applicable. a Expectations are obtained from 1,000 simulations; payoffs are computed for the baseline prices pH=$5,058/ton and
pL=$726/ton. b Cooperative Surplus= Total payoff (Cooperative)-Total payoff ( Noncooperative) c Standard deviations in parentheses. *** Statistically significant at the 1% level.
41
Table 4 Solution strategy pairs and expected payoffs; disease starts in GL. Prices a Setting Solution strategy pairs Expected payoffs
Sequential-GH moves first ImNS, Exit 151, -5 146 a Recall that prices in cases 1 through 6, and prices in cases 6 and 7 are obtained through a mean-preserving
contraction and a mean-preserving expansion of prices in the baseline case (case 5), respectively. b We only report the social planner and Nash bargaining solutions when they are different from the
noncooperative solutions.
42
Appendix
Table A1 Normal form game payoff matrix for the baseline case (payoffs in $1,000)
GL
no control a ImY ImNS
GH no control 60 b 22 81 -11 98 -5 ImY 41 1 81 -11 93 -5 ImNS -20 1 25 -11 91 31
a Underbars indicate a player’s payoff of dominant strategy, given the strategy of the other player. b Payoffs of the welfare-maximizing solution pair are in bold.
Table A2 Effect of a smaller short-distance diffusion parameter (α=2.1): normal form game payoff matrix (payoffs in $1,000)
GL
no control ImNS
GH no control 60 23 98 27 ImNS -14 23 93 32
a Underbars indicate a player’s payoff of dominant strategy, given the strategy of the other player. b Payoffs of the welfare-maximizing solution pair are in bold.
Table A3 Effect of (a) larger (γ=3.5) and (b) smaller (γ=1.5) long-distance diffusion parameter: normal form game payoff matrix (payoffs in $1,000). (a) γ=3.5 GL
no control ImNS Exit
no control 78 a 23 103 29 b 93 -5
GH ImNS 12 23 95 31 110 -5
Exit -11 23 -11 31 -11 -5
(b) γ=1.5 GL no control ImNS Exit no control -13 19 34 -77 52 -5 GH ImNS -316 21 13 14 94 -5 Exit -11 23 -11 30 -11 -5
a Underbars indicate a player’s payoff of dominant strategy, given the strategy of the other player. Two underbars indicate the payoffs of the Nash equilibrium strategy pair. b Payoffs of the welfare-maximizing solution pair are in bold.
43
Table A4 Effect of vineyard relative size: normal form game payoff matrix; (a) GL is larger than GH; (b) vineyards are both big; (c) vineyards are both small (payoffs in $1,000) (a) GL larger GL
no control ImNS
GH no control -59 a 298 -59 285
ImNS -84 384 -65 414 b
(b) Both large GL no control ImNS GH no control 71 -37 104 -44 ImNS 10 -37 103 -44 (c) Both small GL no control ImNS GH no control 243 22 345 24 ImNS 208 23 368 32
a Underbars indicate a player’s payoff of dominant strategy, given the strategy of the other player. Two underbars indicate the payoffs of the Nash equilibrium strategy pair. b Payoffs of the welfare-maximizing solution pair are in bold.
44
Table A5 Expected payoffs under the social planner, noncooperative, and cooperative solutions, case where disease starts in GH
Setting Solution strategy pairs Expected Payoffs a
𝐺𝐺𝐻𝐻, 𝐺𝐺𝐿𝐿 𝐸𝐸𝐸𝐸𝐸𝐸𝑉𝑉𝐻𝐻;𝐸𝐸𝐸𝐸𝐸𝐸𝑉𝑉𝐿𝐿 𝐸𝐸𝐸𝐸𝐸𝐸𝑉𝑉𝑇𝑇
Simultaneous ImNS, ImNS 5, 76 81 Sequential-GL moves first ImNS, ImNS 5, 76 81 Sequential-GH moves first ImNS, ImNS 5, 76 81 a Expectations are obtained from 1,000 simulations over 50 years; payoffs are in $1,000/acre and are
computed for the baseline prices pH=$5,058/ton and pL=$726/ton.
WP No Title Author(s)
OTHER A.E.M. WORKING PAPERS
Fee(if applicable)
Networked Leaders in the Shadow of theMarket - A Chinese Experiment in AllocatingLand Conversion Rights
Chau, N., Qin, Y. and W. Zhang2015-13
The Impact of Irrigation Restrictions onCropland Values in Nebraska
Savage, J. and J. Ifft2015-12
The Distinct Economic Effects of the EthanolBlend Wall, RIN Prices and Ethanol PricePremium due to the RFS
de Gorter, H. and D. Drabik2015-11
Minimum Wages in Sub-Saharan Africa: APrimer
Bhorat, H., Kanbur, R. and B. Stanwix2015-10
Optimal Taxation and Public Provision forPoverty Reduction
Kanbur, R., Pirttilä, J., Tuomala, M. andT. Ylinen
2015-09
Management Areas and Fixed Costs in theEconomics of Water Quality Trading
Zhao, T., Poe, G. and R. Boisvert2015-08
Food Waste: The Role of Date Labels,Package Size, and Product Category
Wilson, N., Rickard, B., Saputo, R. and S.Ho
2015-07
Education for Climate Justice Kanbur, R.2015-06
Dynastic Inequality, Mobility and Equality ofOpportunity
Kanbur, R. and J.E. Stiglitz2015-05
The End of Laissez-Faire, The End of History,and The Structure of Scientific Revolutions
Kanbur, R.2015-04
Assessing the Economic Impacts of FoodHubs to Regional Economics: a frameworkincluding opportunity cost
Jablonski, B.B.R., Schmit, T.and D. Kay2015-03
Does Federal crop insurance Lead to higherfarm debt use? Evidence from the AgriculturalResource Management Survey
Ifft, J., Kuethe, T. and M. Morehart2015-02
Rice Sector Policy Options in Guinea Bissau Kyle, S.2015-01
Impact of CO2 emission policies on foodsupply chains: An application to the US applesector
Lee, J., Gómez, M., and H. Gao2014-22
Paper copies are being replaced by electronic Portable Document Files (PDFs). To request PDFs of AEM publications, write to (be sure toinclude your e-mail address): Publications, Department of Applied Economics and Management, Warren Hall, Cornell University, Ithaca, NY14853-7801. If a fee is indicated, please include a check or money order made payable to Cornell University for the amount of yourpurchase. Visit our Web site (http://dyson.cornell.edu/research/wp.php) for a more complete list of recent bulletins.