Spectral analysis for broadband fluorescence: temperature sensing with the YAG:Ce phosphor as an example This is the Published version of the following publication Zhang, W, Wang, G, Cai, Zibo, Baxter, Gregory and Collins, Stephen F (2016) Spectral analysis for broadband fluorescence: temperature sensing with the YAG:Ce phosphor as an example. Optical Materials Express, 6 (11). 3482 - 3490. ISSN 2159-3930 The publisher’s official version can be found at https://doi.org/10.1364/OME.6.003482 Note that access to this version may require subscription. Downloaded from VU Research Repository https://vuir.vu.edu.au/34504/
Transcript
Spectral analysis for broadband fluorescence: temperature sensing with the YAG:Ce phosphor as an example
This is the Published version of the following publication
Zhang, W, Wang, G, Cai, Zibo, Baxter, Gregory and Collins, Stephen F (2016) Spectral analysis for broadband fluorescence: temperature sensing with the YAG:Ce phosphor as an example. Optical Materials Express, 6 (11). 3482 - 3490. ISSN 2159-3930
The publisher’s official version can be found at https://doi.org/10.1364/OME.6.003482Note that access to this version may require subscription.
Downloaded from VU Research Repository https://vuir.vu.edu.au/34504/
Spectral analysis for broadband fluorescence: temperature sensing with the YAG:Ce phosphor as an example
WEIWEI ZHANG,1,2,* GUOYAO WANG,1 ZIBO CAI,2 GREG W. BAXTER,2 AND
STEPHEN F. COLLINS2
1Jiangxi Engineering Laboratory for Optoelectronics Testing Technology, Nanchang Hangkong University, Nanchang 330063, China 2Optical Technology Research Laboratory, Victoria University, P.O. Box 14428, Melbourne City, Victoria 8001, Australia *[email protected]
OCIS codes: (120.0120) Instrumentation, measurement, and metrology; (120.6780) Temperature.
References and links
1. A. P. Demchenko, Introduction to fluorescence sensing (Springer Science & Business Media, 2008). 2. X. D. Wang, O. S. Wolfbeis, and R. J. Meier, “Luminescent probes and sensors for temperature,” Chem. Soc.
Rev. 42(19), 7834–7869 (2013). 3. X. Wang, Q. Liu, Y. Bu, C. S. Liu, T. Liu, and X. Yan, “Optical temperature sensing of rare-earth ion doped
phosphors,” RSC Advances 5(105), 86219–86236 (2015). 4. P. Chamarthy, S. V. Garimella, and S. T. Wereley, “Measurement of the temperature non-uniformity in a
microchannel heat sink using microscale laser-induced fluorescence,” Int. J. Heat Mass Tran. 53(15-16), 3275–3283 (2010).
5. S. W. Allison, G. T. Gillies, A. J. Rondinone, and M. R. Cates, “Nanoscale thermometry via the fluorescence of YAG:Ce phosphor particles: measurements from 7 to 77 °C,” Nanotechnology 14(8), 859–863 (2003).
6. Y. Dong, G. Zhou, X. Jun, G. Zhao, F. Su, L. Su, G. Zhang, D. Zhang, H. Li, and J. Si, “Luminescence studies of Ce:YAG using vacuum ultraviolet synchrotron radiation,” Mater. Res. Bull. 41(10), 1959–1963 (2006).
7. V. P. Dotsenko, I. V. Berezovskaya, E. V. Zubar, N. P. Efryushina, N. I. Poletaev, Yu. A. Doroshenko, G. B. Stryganyuk, and A. S. Voloshinovskii, “Synthesis and luminescent study of Ce3+-doped terbium–yttrium aluminum garnet,” J. Alloys Compd. 550, 159–163 (2013).
8. Y. Zorenko, T. Voznyak, V. Gorbenko, E. Zych, S. Nizankovski, A. Dan’ko, and V. Puzikov, “Luminescence properties of Y3Al5O12:Ce nanoceramics,” J. Lumin. 131(1), 17–21 (2011).
9. A. Birkel, K. A. Denault, N. C. George, C. E. Doll, B. Hery, A. A. Mikhailovsky, C. S. Birkel, B. Hong, and R. Seshadri, “Rapid microwave preparation of highly efficient Ce3+-substituted garnet phosphors for solid state white lighting,” Chem. Mater. 24(6), 1198–1204 (2012).
10. S. P. Ying, P. T. Chou, and H. K. Fu, “Influence of the temperature dependent spectral power distribution of light-emitting Diodes on the illuminance responsivity of a photometer,” Opt. Lasers Eng. 51(10), 1179–1184 (2013).
11. N. Narendran, Y. Gu, and R. Hosseinzadeh, “Estimating junction temperature of high-flux white LEDs,” in Integrated Optoelectronic Devices 2004, International Society for Optics and Photonics, pp. 158–160 (2004).
12. Y. Gu and N. Narendran, “A noncontact method for determining junction temperature of phosphor-converted white LEDs,” in Optical Science and Technology, SPIE's 48th Annual Meeting, International Society for Optics and Photonics, pp. 107–114 (2004).
13. J. Barzowska, M. Grinberg, and T. Tsuboi, “High pressure spectroscopy of Ce doped YAG crystal,” Radiat. Eff. Defects Solids 158(1-6), 39–47 (2003).
14. M. Grinberg, “High pressure spectroscopy of rare earth ions doped crystals - new results,” Opt. Mater. 28(1-2), 26–34 (2006).
15. W. Zhang, Z. Li, G. W. Baxter, and S. F. Collins, “Stress- and temperature-dependent fluorescence of YAG:Ce composite for sensing application,” Exp. Mech. Online first (2016).
16. S. P. Feofilov, D. V. Arsentyev, A. B. Kulinkin, T. Gacoin, G. Mialon, R. S. Meltzer, and C. Dujardin, “Gaseous environment-sensitive fluorescence of YAG:Ce3+ nanocrystals,” J. Appl. Phys. 107(6), 064308 (2010).
17. S. Zhou, Z. Fu, J. Zhang, and S. Zhang, “Spectral properties of rare-earth ions in nanocrystalline YAG:Re (Re = Ce3+, Pr3+, Tb3+),” J. Lumin. 118(2), 179–185 (2006).
18. G. Xia, S. Zhou, J. Zhang, and J. Xu, “Structural and optical properties of YAG:Ce3+ phosphors by sol–gel combustion method,” J. Cryst. Growth 279(3-4), 357–362 (2005).
19. A. Purwanto, W. N. Wang, T. Ogi, I. W. Lenggoro, E. Tanabe, and K. Okuyama, “High luminance YAG:Ce nanoparticles fabricated from urea added aqueous precursor by flame process,” J. Alloys Compd. 463(1-2), 350–357 (2008).
20. R. Pazik, P. Głuchowski, D. Hreniak, W. Stręk, M. Roś, R. Fedyk, and W. Łojkowski, “Fabrication and luminescence studies of Ce:Y3Al5O12 transparent nanoceramic,” Opt. Mater. 30(5), 714–718 (2008).
21. K. Zhang, W. B. Hu, Y. T. Wu, and H. Z. Liu, “Synthesis, luminescence, and effect of heat treatment on the properties of Y3Al5O12:Ce phosphor,” Inorg. Mater. 44(11), 1218–1223 (2008).
22. Y. Pan, M. Wu, and Q. Su, “Tailored photoluminescence of YAG:Ce phosphor through various methods,” J. Phys. Chem. Solids 65(5), 845–850 (2004).
23. Y. X. Pan, W. Wang, G. K. Liu, S. Skanthakumar, R. A. Rosenberg, X. Z. Guo, and K. K. Li, “Correlation between structure variation and luminescence red shift in YAG:Ce,” J. Alloys Compd. 488(2), 638–642 (2009).
24. H. Shi, C. Zhu, J. Huang, J. Chen, D. Chen, W. Wang, F. Wang, Y. Cao, and X. Yuan, “Luminescence properties of YAG:Ce, Gd phosphors synthesized under vacuum condition and their white LED performances,” Opt. Mater. Express 4(4), 649–655 (2014).
25. X. Li, J. G. Li, Z. Xiu, D. Huo, and X. Sun, “Effects of Gd3+ Substitution on the Fabrication of Transparent (Y1-
xGdx)3Al5O12 Ceramics,” J. Am. Ceram. Soc. 93(8), 2229–2235 (2010). 26. S. Fujita, A. Sakamoto, and S. Tanabe, “Luminescence Characteristics of YAG Glass-Ceramic Phosphor for
White LED,” IEEE J. Sel. Top. Quantum Electron. 14(5), 1387–1391 (2008). 27. Q. Shao, H. Li, Y. Dong, J. Jiang, C. Liang, and J. He, “Temperature-dependent photoluminescence studies on
Y2.93−xLnxAl5O12:Ce0.07 (Ln = Gd, La) phosphors for white LEDs application,” J. Alloys Compd. 498(2), 199–202 (2010).
28. K. Li and C. Shen, “White LED based on nano-YAG:Ce3+/YAG:Ce3+,Gd3+ hybrid phosphors,” Optik (Stuttg.) 123(7), 621–623 (2012).
29. R. Praveena, L. Shi, K. H. Jang, V. Venkatramu, C. K. Jayasankar, and H. J. Seo, “Sol–gel synthesis and thermal stability of luminescence of Lu3Al5O12:Ce3+ nano-garnet,” J. Alloys Compd. 509(3), 859–863 (2011).
30. H. Yang, D. K. Lee, and Y. S. Kim, “Spectral variations of nano-sized Y3Al5O12:Ce phosphors via codoping/substitution and their white LED characteristics,” Mater. Chem. Phys. 114(2-3), 665–669 (2009).
31. E. J. Chung, T. Masaki, Y. H. Song, K. Senthil, M. K. Jung, and D. H. Yoon, “Enhancement of thermal quenching properties of a yellow-emitting SiO2-coated Y3Al5O12:Ce3+ phosphor for white light-emitting diode applications,” Phys. Scr. T 157, 014012 (2013).
32. D. Haranath, H. Chander, P. Sharma, and S. Singh, “Enhanced luminescence of Y3Al5O12:Ce3+ nanophosphor for white light-emitting diodes,” Appl. Phys. Lett. 89(17), 173118 (2006).
33. N. Wei, T. Lu, F. Li, W. Zhang, B. Ma, Z. Lu, and J. Qi, “Transparent Ce:Y3Al5O12 ceramic phosphors for white light-emitting diodes,” Appl. Phys. Lett. 101(6), 061902 (2012).
34. E. Antic-Fidancev, “Simple way to test the validity of 2S+1LJ barycenters of rare earth ions (e.g. 4f2, 4f3 and 4f6
configurations),” J. Alloys Compd. 300–301, 2–10 (2000). 35. W. W. Zhang, M. Yin, X. D. He, and Y. Q. Gao, “Size dependent luminescence of nanocrystalline Y2O3:Eu and
connection to temperature stimulus,” J. Alloys Compd. 509(8), 3613–3616 (2011). 36. P. A. Tanner, L. Fu, L. Ning, B. M. Cheng, and M. G. Brik, “Soft synthesis and vacuum ultraviolet spectra of
YAG:Ce3+ nanocrystals: reassignment of Ce3+ energy levels,” J. Phys. Condens. Matter 19(21), 216213 (2007). 37. J. Andriessen, E. van der Kolk, and P. Dorenbos, “Lattice relaxation study of the 4f-5d excitation of Ce3+-doped
LaCl3, LaBr3, and NaLaF4: Stokes shift by pseudo Jahn-Teller effect,” Phys. Rev. B 76(7), 075124 (2007). 38. J. L. Wu, G. Gundiah, and A. K. Cheetham, “Structure–property correlations in Ce-doped garnet phosphors for
use in solid state lighting,” Chem. Phys. Lett. 441(4-6), 250–254 (2007). 39. R. Hansel, S. Allison, and G. Walker, “Temperature-dependent luminescence of gallium-substituted YAG:Ce,”
J. Mater. Sci. 45(1), 146–150 (2010). 40. Q. Shao, Y. Dong, J. Jiang, C. Liang, and J. He, “Temperature-dependent photoluminescence properties of (Y,
Lu)3Al5O12:Ce3+ phosphors for white LEDs applications,” J. Lumin. 131(5), 1013–1015 (2011).
41. P. Ghigna, S. Pin, C. Ronda, A. Speghini, F. Piccinelli, and M. Bettinelli, “Local structure of the Ce3+ ion in the yellow emitting phosphor YAG:Ce,” Opt. Mater. 34(1), 19–22 (2011).
42. A. Katelnikovas, J. Plewa, D. Dutczak, S. Möller, D. Enseling, H. Winkler, A. Kareiva, and T. Jüstel, “Synthesis and optical properties of green emitting garnet phosphors for phosphor-converted light emitting diodes,” Opt. Mater. 34(7), 1195–1201 (2012).
43. X. Wang, Q. Liu, P. Cai, J. Wang, L. Qin, T. Vu, and H. J. Seo, “Excitation powder dependent optical temperature behavior of Er3+ doped transparent Sr0.69La0.31F2.31 glass ceramics,” Opt. Express 24(16), 17792–17804 (2016).
44. W. Zhang, S. F. Collins, G. W. Baxter, F. Sidiroglou, C. Duan, and M. Yin, “Use of cross-relaxation for temperature sensing via a fluorescence intensity ratio,” Sensor Actuat. A-Phys. 232, 8–12 (2015).
1. Introduction
It is well-known that numerous phosphors and dyes can be used as fluorescent sensors for the measurement of temperature, pH value, or other physical/chemical factors [1]. For various sensing applications, the underlying sciences are different, while the analyzed fluorescence characteristics are similar. Taking the fluorescent temperature sensing for example, the applicable spectral characteristics mainly include the emission intensity, the intensity ratio of thermally-coupled emission peaks, the full-width-at-half-magnitude of a peak/band, the peak location wavelength, and the lifetime of the fluorescence [1–3].
For a broadband fluorescence, the intensity-based sensing has been applied widely, commonly requiring an extra reference intensity [4]. Intensity fluctuation causes the corresponding sensor complicated and less precise. Peak shift technique and bandwidth measurement are not precise for a broadband emission, because the precision of locating a wavelength is limited by the spectrometer resolution and the apparatus’ signal-to-noise ratio. Therefore, novel spectral techniques with improved precision can be significant in broadband spectral analysis. The phosphor YAG:Ce is used in this study as a typical phosphor which has wide emission wavelength range.
The fluorescence of Ce3+-doped yttrium aluminum garnet (YAG:Ce) is highly intense and temperature sensitive when being pumped with blue light centered at 450 nm. This phosphor has found applications in wavelength-converted white light diodes (WLED). It has been explored as a nano-point thermometer with the fluorescence lifetime varying monotonically from 26.5 ns to 18.5 ns in the range of 10 ~77 degrees Celsius [5]. Additionally, there are alternative fluorescence characteristics of YAG:Ce that are temperature dependent, such as: when temperature increases, the peak wavelength of the emission band shifts towards red [6–9], whilst the luminescent intensity decreases monotonically [10–12]. Hence other optical thermometer methodologies may be conceived by utilizing the above mentioned thermal properties.
This article focuses on the features of fluorescence spectra of YAG:Ce for temperature sensing. Four characteristics of fluorescence are explored for this purpose, including two newly proposed characteristics – the barycenter energy of the emission band and the self-referenced fluorescence intensity ratio(s). For comparison, the peak location and the bandwidth of the emission band are the other two functions that vary with temperature.
2. Experimental arrangements
The phosphor YAG:Ce, Intematix Y4454 in this article, is widely available commercially. The material structure was analyzed on a D8ADVANCE X-ray diffractometer, using a Cu Kα X-ray source.
A laser diode with an emission wavelength of 405 nm was used as the excitation light source for the fluorescence spectra measurement. All spectra were recorded with a AvaSpec-2048TEC-USB2 fiber optical spectrometer; a dye filter removed scattered excitation light from the recorded spectra. The transmittance of the filter will be shown as an inset of the emission spectra in the following section. A temperature controller with K-type thermocouple was employed to control a heat board, providing an environmental temperature range from room temperature to over 180 °C for the phosphor powder. The powder sample was deposited
on the center of the heat board with the aid of alcohol, as close as possible to the thermocouple probe tip.
3. Results and discussions
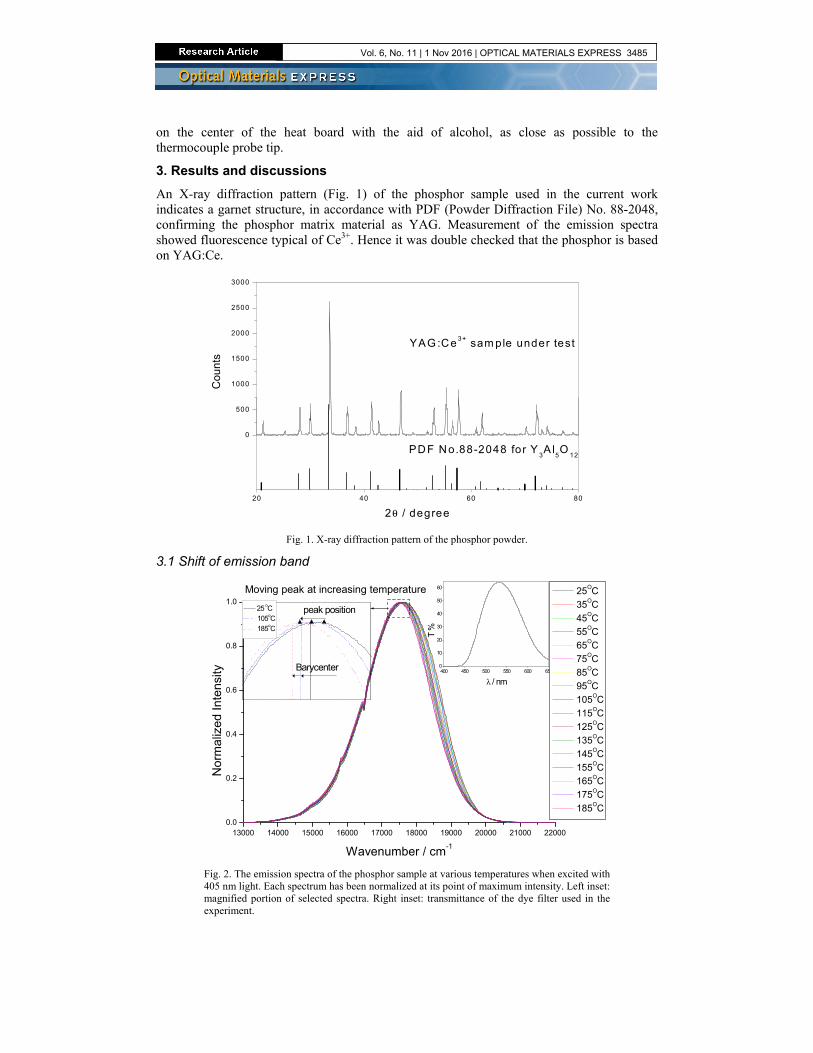
An X-ray diffraction pattern (Fig. 1) of the phosphor sample used in the current work indicates a garnet structure, in accordance with PDF (Powder Diffraction File) No. 88-2048, confirming the phosphor matrix material as YAG. Measurement of the emission spectra showed fluorescence typical of Ce3+. Hence it was double checked that the phosphor is based on YAG:Ce.
20 40 60 80
PDF No.88-2048 for Y3A l
5O
12
2θ / degree
0
500
1000
1500
2000
2500
3000
YAG :Ce3+ sam ple under test
Cou
nts
Fig. 1. X-ray diffraction pattern of the phosphor powder.
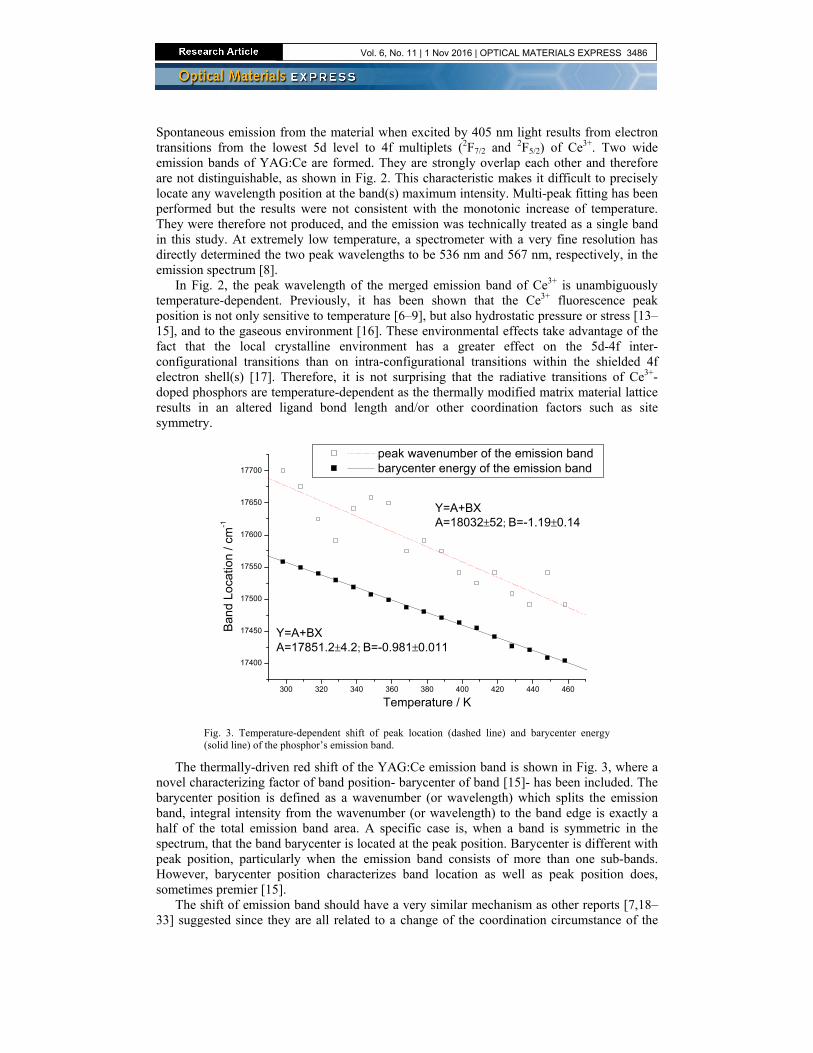
Fig. 2. The emission spectra of the phosphor sample at various temperatures when excited with 405 nm light. Each spectrum has been normalized at its point of maximum intensity. Left inset: magnified portion of selected spectra. Right inset: transmittance of the dye filter used in the experiment.
Spontaneous emission from the material when excited by 405 nm light results from electron transitions from the lowest 5d level to 4f multiplets (2F7/2 and 2F5/2) of Ce3+. Two wide emission bands of YAG:Ce are formed. They are strongly overlap each other and therefore are not distinguishable, as shown in Fig. 2. This characteristic makes it difficult to precisely locate any wavelength position at the band(s) maximum intensity. Multi-peak fitting has been performed but the results were not consistent with the monotonic increase of temperature. They were therefore not produced, and the emission was technically treated as a single band in this study. At extremely low temperature, a spectrometer with a very fine resolution has directly determined the two peak wavelengths to be 536 nm and 567 nm, respectively, in the emission spectrum [8].
In Fig. 2, the peak wavelength of the merged emission band of Ce3+ is unambiguously temperature-dependent. Previously, it has been shown that the Ce3+ fluorescence peak position is not only sensitive to temperature [6–9], but also hydrostatic pressure or stress [13–15], and to the gaseous environment [16]. These environmental effects take advantage of the fact that the local crystalline environment has a greater effect on the 5d-4f inter-configurational transitions than on intra-configurational transitions within the shielded 4f electron shell(s) [17]. Therefore, it is not surprising that the radiative transitions of Ce3+-doped phosphors are temperature-dependent as the thermally modified matrix material lattice results in an altered ligand bond length and/or other coordination factors such as site symmetry.
300 320 340 360 380 400 420 440 460
17400
17450
17500
17550
17600
17650
17700
Y=A+BXA=17851.2±4.2; B=-0.981±0.011
Ba
nd
Lo
catio
n /
cm-1
Temperature / K
peak wavenumber of the emission band barycenter energy of the emission band
Y=A+BXA=18032±52; B=-1.19±0.14
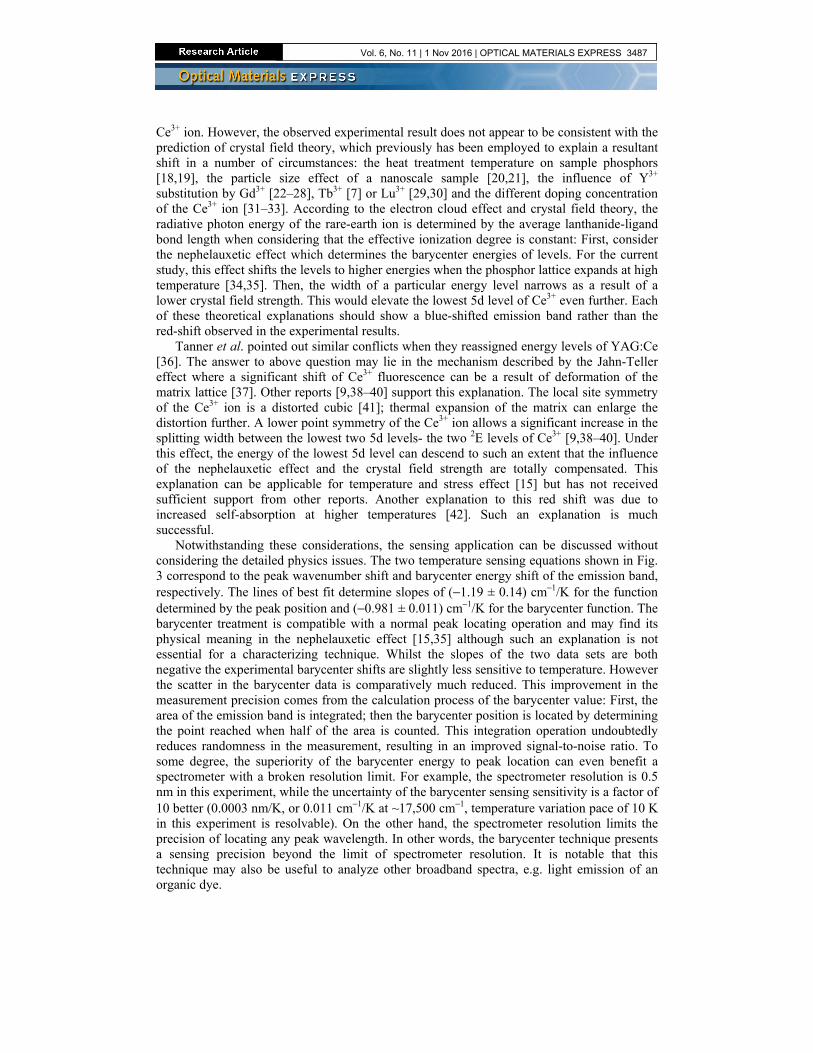
Fig. 3. Temperature-dependent shift of peak location (dashed line) and barycenter energy (solid line) of the phosphor’s emission band.
The thermally-driven red shift of the YAG:Ce emission band is shown in Fig. 3, where a novel characterizing factor of band position- barycenter of band [15]- has been included. The barycenter position is defined as a wavenumber (or wavelength) which splits the emission band, integral intensity from the wavenumber (or wavelength) to the band edge is exactly a half of the total emission band area. A specific case is, when a band is symmetric in the spectrum, that the band barycenter is located at the peak position. Barycenter is different with peak position, particularly when the emission band consists of more than one sub-bands. However, barycenter position characterizes band location as well as peak position does, sometimes premier [15].
The shift of emission band should have a very similar mechanism as other reports [7,18–33] suggested since they are all related to a change of the coordination circumstance of the
Ce3+ ion. However, the observed experimental result does not appear to be consistent with the prediction of crystal field theory, which previously has been employed to explain a resultant shift in a number of circumstances: the heat treatment temperature on sample phosphors [18,19], the particle size effect of a nanoscale sample [20,21], the influence of Y3+ substitution by Gd3+ [22–28], Tb3+ [7] or Lu3+ [29,30] and the different doping concentration of the Ce3+ ion [31–33]. According to the electron cloud effect and crystal field theory, the radiative photon energy of the rare-earth ion is determined by the average lanthanide-ligand bond length when considering that the effective ionization degree is constant: First, consider the nephelauxetic effect which determines the barycenter energies of levels. For the current study, this effect shifts the levels to higher energies when the phosphor lattice expands at high temperature [34,35]. Then, the width of a particular energy level narrows as a result of a lower crystal field strength. This would elevate the lowest 5d level of Ce3+ even further. Each of these theoretical explanations should show a blue-shifted emission band rather than the red-shift observed in the experimental results.
Tanner et al. pointed out similar conflicts when they reassigned energy levels of YAG:Ce [36]. The answer to above question may lie in the mechanism described by the Jahn-Teller effect where a significant shift of Ce3+ fluorescence can be a result of deformation of the matrix lattice [37]. Other reports [9,38–40] support this explanation. The local site symmetry of the Ce3+ ion is a distorted cubic [41]; thermal expansion of the matrix can enlarge the distortion further. A lower point symmetry of the Ce3+ ion allows a significant increase in the splitting width between the lowest two 5d levels- the two 2E levels of Ce3+ [9,38–40]. Under this effect, the energy of the lowest 5d level can descend to such an extent that the influence of the nephelauxetic effect and the crystal field strength are totally compensated. This explanation can be applicable for temperature and stress effect [15] but has not received sufficient support from other reports. Another explanation to this red shift was due to increased self-absorption at higher temperatures [42]. Such an explanation is much successful.
Notwithstanding these considerations, the sensing application can be discussed without considering the detailed physics issues. The two temperature sensing equations shown in Fig. 3 correspond to the peak wavenumber shift and barycenter energy shift of the emission band, respectively. The lines of best fit determine slopes of (−1.19 ± 0.14) cm−1/K for the function determined by the peak position and (−0.981 ± 0.011) cm−1/K for the barycenter function. The barycenter treatment is compatible with a normal peak locating operation and may find its physical meaning in the nephelauxetic effect [15,35] although such an explanation is not essential for a characterizing technique. Whilst the slopes of the two data sets are both negative the experimental barycenter shifts are slightly less sensitive to temperature. However the scatter in the barycenter data is comparatively much reduced. This improvement in the measurement precision comes from the calculation process of the barycenter value: First, the area of the emission band is integrated; then the barycenter position is located by determining the point reached when half of the area is counted. This integration operation undoubtedly reduces randomness in the measurement, resulting in an improved signal-to-noise ratio. To some degree, the superiority of the barycenter energy to peak location can even benefit a spectrometer with a broken resolution limit. For example, the spectrometer resolution is 0.5 nm in this experiment, while the uncertainty of the barycenter sensing sensitivity is a factor of 10 better (0.0003 nm/K, or 0.011 cm−1/K at ~17,500 cm−1, temperature variation pace of 10 K in this experiment is resolvable). On the other hand, the spectrometer resolution limits the precision of locating any peak wavelength. In other words, the barycenter technique presents a sensing precision beyond the limit of spectrometer resolution. It is notable that this technique may also be useful to analyze other broadband spectra, e.g. light emission of an organic dye.
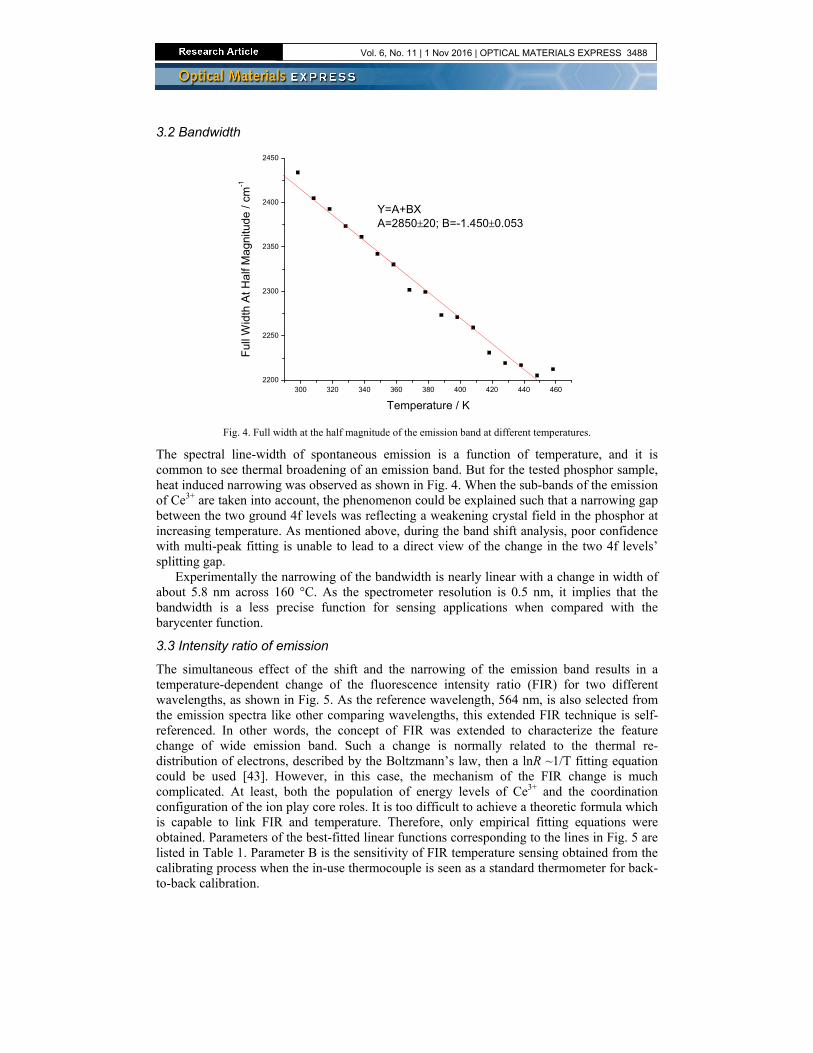
Fig. 4. Full width at the half magnitude of the emission band at different temperatures.
The spectral line-width of spontaneous emission is a function of temperature, and it is common to see thermal broadening of an emission band. But for the tested phosphor sample, heat induced narrowing was observed as shown in Fig. 4. When the sub-bands of the emission of Ce3+ are taken into account, the phenomenon could be explained such that a narrowing gap between the two ground 4f levels was reflecting a weakening crystal field in the phosphor at increasing temperature. As mentioned above, during the band shift analysis, poor confidence with multi-peak fitting is unable to lead to a direct view of the change in the two 4f levels’ splitting gap.
Experimentally the narrowing of the bandwidth is nearly linear with a change in width of about 5.8 nm across 160 °C. As the spectrometer resolution is 0.5 nm, it implies that the bandwidth is a less precise function for sensing applications when compared with the barycenter function.
3.3 Intensity ratio of emission
The simultaneous effect of the shift and the narrowing of the emission band results in a temperature-dependent change of the fluorescence intensity ratio (FIR) for two different wavelengths, as shown in Fig. 5. As the reference wavelength, 564 nm, is also selected from the emission spectra like other comparing wavelengths, this extended FIR technique is self-referenced. In other words, the concept of FIR was extended to characterize the feature change of wide emission band. Such a change is normally related to the thermal re-distribution of electrons, described by the Boltzmann’s law, then a lnR ~1/T fitting equation could be used [43]. However, in this case, the mechanism of the FIR change is much complicated. At least, both the population of energy levels of Ce3+ and the coordination configuration of the ion play core roles. It is too difficult to achieve a theoretic formula which is capable to link FIR and temperature. Therefore, only empirical fitting equations were obtained. Parameters of the best-fitted linear functions corresponding to the lines in Fig. 5 are listed in Table 1. Parameter B is the sensitivity of FIR temperature sensing obtained from the calibrating process when the in-use thermocouple is seen as a standard thermometer for back-to-back calibration.
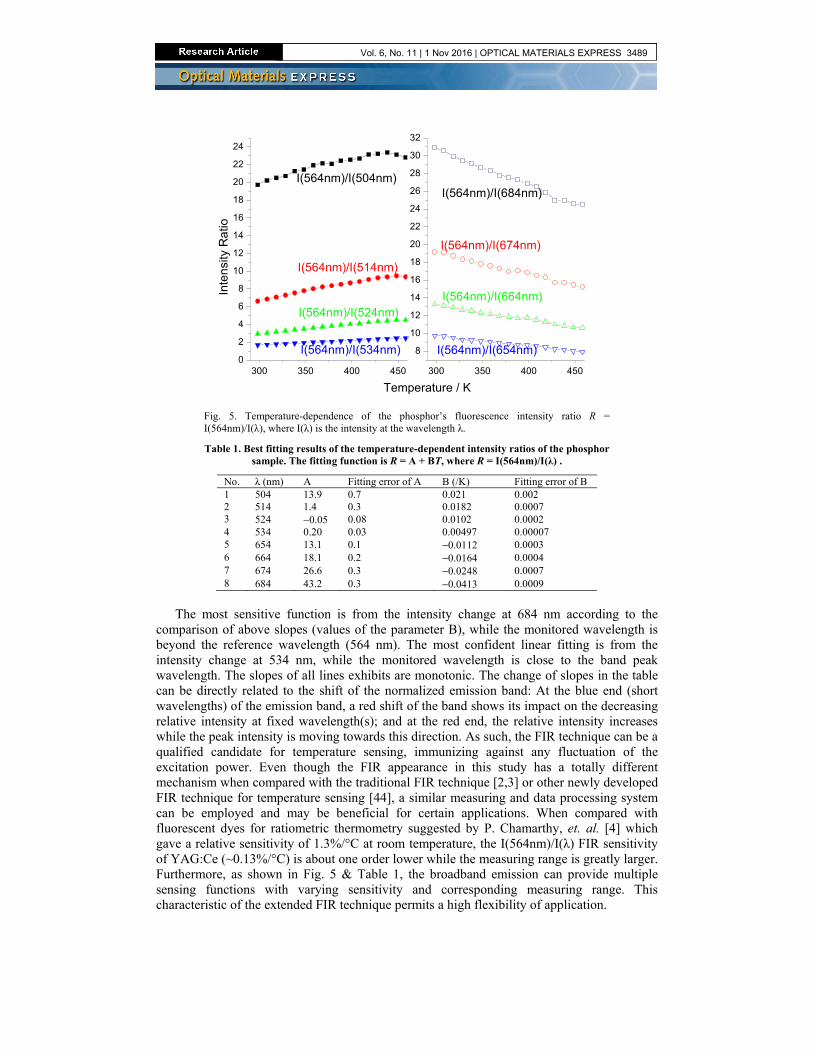
Fig. 5. Temperature-dependence of the phosphor’s fluorescence intensity ratio R = I(564nm)/I(λ), where I(λ) is the intensity at the wavelength λ.
Table 1. Best fitting results of the temperature-dependent intensity ratios of the phosphor sample. The fitting function is R = A + BT, where R = I(564nm)/I(λ) .
The most sensitive function is from the intensity change at 684 nm according to the
comparison of above slopes (values of the parameter B), while the monitored wavelength is beyond the reference wavelength (564 nm). The most confident linear fitting is from the intensity change at 534 nm, while the monitored wavelength is close to the band peak wavelength. The slopes of all lines exhibits are monotonic. The change of slopes in the table can be directly related to the shift of the normalized emission band: At the blue end (short wavelengths) of the emission band, a red shift of the band shows its impact on the decreasing relative intensity at fixed wavelength(s); and at the red end, the relative intensity increases while the peak intensity is moving towards this direction. As such, the FIR technique can be a qualified candidate for temperature sensing, immunizing against any fluctuation of the excitation power. Even though the FIR appearance in this study has a totally different mechanism when compared with the traditional FIR technique [2,3] or other newly developed FIR technique for temperature sensing [44], a similar measuring and data processing system can be employed and may be beneficial for certain applications. When compared with fluorescent dyes for ratiometric thermometry suggested by P. Chamarthy, et. al. [4] which gave a relative sensitivity of 1.3%/°C at room temperature, the I(564nm)/I(λ) FIR sensitivity of YAG:Ce (~0.13%/°C) is about one order lower while the measuring range is greatly larger. Furthermore, as shown in Fig. 5 & Table 1, the broadband emission can provide multiple sensing functions with varying sensitivity and corresponding measuring range. This characteristic of the extended FIR technique permits a high flexibility of application.
In this work, all four types of temperature sensing functions can be successfully exploited using the emission spectra. It is also possible to utilize characteristics of excitation spectra, absorption spectra, and dynamic properties, e.g. fluorescence lifetime of the mentioned phosphor for temperature sensing. This implies that an even wider variety of measurement techniques are available with each giving different levels of precision with less or greater suitability for particular application purposes. Amongst the four studied techniques, the novel barycenter shift technique gives the best precision: the relative error of the sensitivity is 1.1% (0.011/0.981), while the other three relative errors of the sensitivities are 11.8% (0.14/1.19), 3.7% (0.053/1.450), and optimally 1.4% (0.00007/0.00497) for the peak locating method, the bandwidth test, and the extended FIR technique, respectively. The extended FIR technique has a great flexibility.
4. Conclusions
In conclusion, this article has demonstrated that a common phosphor, YAG:Ce, can be used for temperature sensing using multiple sensing mechanisms. The schemes have been explained and experimentally demonstrated with the temperature-dependent fluorescence of the phosphor. Multiple sensing functions have been scrutinized to determine their suitability for temperature measurement purposes. The technique utilizing the shift of the band barycenter achieved the best precision, and the extended FIR technique provided high flexibility to various applications. The results indicate that YAG:Ce and similar active materials potentially could be widely applied into the area of temperature sensing.
Funding
National Natural Science Foundation of China (NSFC) (61167007 & 61665008); Aeronautic Science Foundation of China (2012ZD56007); China Scholarship Council (201308360026); Program for Supporting Young Scientists of Jiangxi Province (20153BCB23037).