HAL Id: hal-01285646 https://hal.archives-ouvertes.fr/hal-01285646 Submitted on 9 Mar 2016 HAL is a multi-disciplinary open access archive for the deposit and dissemination of sci- entific research documents, whether they are pub- lished or not. The documents may come from teaching and research institutions in France or abroad, or from public or private research centers. L’archive ouverte pluridisciplinaire HAL, est destinée au dépôt et à la diffusion de documents scientifiques de niveau recherche, publiés ou non, émanant des établissements d’enseignement et de recherche français ou étrangers, des laboratoires publics ou privés. Spectral and temporal phase measurement by Optical Frequency-Domain Reflectometry Bruno Robillart, Cosimo Calo, Abdoulaye Fall, François Lamare, Yaneck Gottesman, Badr-Eddine Benkelfat To cite this version: Bruno Robillart, Cosimo Calo, Abdoulaye Fall, François Lamare, Yaneck Gottesman, et al.. Spec- tral and temporal phase measurement by Optical Frequency-Domain Reflectometry. PHOTONICS WEST 2014: Fiber Lasers XI Conference, Feb 2014, San Francisco, CA, United States. pp.896134, 10.1117/12.2039600. hal-01285646
Transcript
HAL Id: hal-01285646https://hal.archives-ouvertes.fr/hal-01285646
Submitted on 9 Mar 2016
HAL is a multi-disciplinary open accessarchive for the deposit and dissemination of sci-entific research documents, whether they are pub-lished or not. The documents may come fromteaching and research institutions in France orabroad, or from public or private research centers.
L’archive ouverte pluridisciplinaire HAL, estdestinée au dépôt et à la diffusion de documentsscientifiques de niveau recherche, publiés ou non,émanant des établissements d’enseignement et derecherche français ou étrangers, des laboratoirespublics ou privés.
Spectral and temporal phase measurement by OpticalFrequency-Domain Reflectometry
Bruno Robillart, Cosimo Calo, Abdoulaye Fall, François Lamare, YaneckGottesman, Badr-Eddine Benkelfat
To cite this version:Bruno Robillart, Cosimo Calo, Abdoulaye Fall, François Lamare, Yaneck Gottesman, et al.. Spec-tral and temporal phase measurement by Optical Frequency-Domain Reflectometry. PHOTONICSWEST 2014 : Fiber Lasers XI Conference, Feb 2014, San Francisco, CA, United States. pp.896134,�10.1117/12.2039600�. �hal-01285646�
aInstitut Telecom, Telecom SudParis, SAMOVAR UMR INT-CNRS, 91011 Evry, France;bLaboratory for Photonics and Nanostructures LPN–CNRS, 91460 Marcoussis, France.
ABSTRACT
The capability of measuring the spectral and temporal phase of an optical signal is of fundamental importancefor the advanced characterization of photonic and optoelectronic components, biochemical sensors, structuralmonitoring sensors and distributed sensor networks. To address this problem, several techniques have beendeveloped (frequency-resolved optical gating (FROG), spectral phase interferometry for direct electric-field re-construction (SPIDER), stepped-heterodyne technique, laser Doppler vibrometry (LDV) and Doppler opticalcoherence tomography (OCT)). However, such techniques often lack of versatility for the mentioned applica-tions. Swept-wavelength interferometric techniques and, among these, optical frequency-domain reflectometry(OFDR) are flexible and highly sensitive tools for complete characterization of amplitude and phase of targetdevices.
In this work, we investigate the spectral and temporal phase measurement capabilities of OFDR. Precisecharacterization of spectral phase information is demonstrated by retrieving the phase response of a commercialoptical filter, the Finisar Waveshaper 1000 S/X, programmable in attenuation and phase over C+L band (1530–1625 nm). The presented results show accurate retrieval of group delay dispersion (GDD) and discrete phase shiftas well as filter attenuation profile. Although some intrinsic accuracy limitations of OFDR phase measurementsmay be encountered (and herein specified), we show that information encoded in OFDR reflectogram data is veryrich when adequately exploited. In addition to previously published results, we demonstrate the high sensitivityof the technique to Doppler effects. From practical point of view, such sensitivity can be beneficially exploitedfor the characterisation of dynamical aspects of samples under test. Unlike LDV, OFDR allows the simultaneousretrieval of the temporal position of several localised reflecting target along the beam path. All these aspectsmake OFDR a highly promising candidate for the study of both static and dynamic aspects of complex photoniccomponents or to probe a parallel sensor network, as needed for future applications.
The precise characterization of the amplitude and phase response of an optical component is of fundamentalimportance for the understanding of its properties and for the analysis of its performances. Phase features likediscrete phase shifts or chromatic dispersion, in particular, may have a significant impact on the characteristicsof optical devices and systems. Discrete optical phase shifts, for example, are typically used in the design ofdistributed feedback lasers to improve the single longitudinal mode property.1 On the other hand, group velocitydispersion (GVD) is a basic design parameter of fiber-optic transmission systems2 and significantly affects thefour-wave mixing (FWM) efficiency in the formation of optical frequency combs in microresonators3 and thechirp and stability of mode-locked laser (MLL) pulses.4
In regard to the latter issue, several techniques have been developed in the context of research on ultra-shortMLL pulses, advanced optical modulation formats and, recently, optical arbitrary waveform generation5 tofully characterize optical signals in amplitude and phase, such as frequency-resolved optical gating (FROG),6
Further author information: (Send correspondence to Yaneck Gottesman)Yaneck Gottesman: E-mail: [email protected], Telephone: +33 1 70 22 02 51
frequency-resolved Mach-Zehnder gating (FRMZG),7 spectral phase interferometry for direct electric field re-construction (SPIDER)8 and stepped heterodyne technique.9 However, such techniques are typically used tomeasure the pulse shape and chirp of the output of a MLL, rather then the laser intracavity dispersion. Gettinginsight into the laser cavity properties is desirable for a deeper understanding of its dynamical aspects.
Interferometric techniques are well known to be very sensitive and versatile for the characterization of opti-cal components and, for these reasons, they appear to be well suited to address the problem of measuring theamplitude and phase transfer function of optoelectronic devices. Indeed, techniques such as white light interfer-ometry10 and optical low-coherence reflectometry (OLCR)11 have already proven to be effective in determiningthe dispersion of both active12,13 and passive devices.11,14,15 However, these techniques often require a precisealignment of free-space optical components and use of mechanical translation stages to provide variable opticaldelays, with detrimental effects on the setup flexibility and the acquisition speed. Swept-wavelength interfero-metric techniques and, among these, coherent optical frequency-domain reflectometry (Co-OFDR) are flexibleand highly sensitive tools for the complete characterization of optical components and have been widely usedfor the detection of discrete reflections and defects in optical fibers and integrated optical devices.16 Nonethe-less, from a metrological point of view, some ambiguities have been identified16 in the past when exploiting theamplitude of recorded reflectograms.
In this paper, we aim at investigating the spectral phase measurement performances of coherent OFDRby evaluating the smallest dispersion values measurable by the tool. For this purpose, and because of theunavailability of group delay dispersion (GDD) or optical phase references, here we carry out experiments usinga commercially available optical filter (Finisar Waveshaper 1000 S/X), for which the amplitude and phase transferfunction can be precisely controlled in the C+L band (1530–1625 nm). We demonstrate that discrete phase shiftsdown to 0.05 rad and dispersion values down to 20 fs/nm (over 1 THz optical frequency span) can be measuredby Co-OFDR. In addition, we show that the smallest phase features measurable by OFDR is ultimately limitedby parasitic phase fluctuations. Specific signatures of these fluctuation are identified and studied in detail. Inparticular, we report that environmental vibrations do affect OFDR measurements and introduce additionalambiguities to those previously reported in literature.16,17 Nonetheless, understanding of this phenomenonenables new uses of OFDR setup and new opportunities for characterization of dynamical objects.The paper is organized as follows: in sec. 2 we introduce to the principles of OFDR technique and to the digitalsignal processing procedure necessary to extract the phase information; in sec. 3 we report on the spectral phasemeasurement by OFDR with the use of the programmable filter; in sec. 4 modeling and experimental evidenceof phase modulation induced by environmental fluctuation are presented; finally, discussion and conclusions aredrawn in sec. 5.
2. OFDR BASICS
2.1 OFDR Setup
An implementation of an OFDR setup in transmission configuration (denoted in the following an OFDI setup forOptical Frequency Domain Interferometry) is sketched in fig. 1. The setup is essentially composed of two parts:a core part constituted by a measurement Mach-Zehnder interferometer, with the device under test (DUT) inone of its arms (in our case the programmable filter Finisar Waveshaper 1000 S/X) and an auxiliary referenceMach-Zehnder interferometer used for triggering data acquisition purposes. The light from a tunable laser source(TLS) constitutes the input of the system.Assuming a time-linear frequency sweep ν(t) = ν0 +γt of the optical source, the electric field of the laser output
can be written as:E(t) = E0 ejφ(t) = E0 ej 2π[ν0+(γ/2)t]t%, (1)
where E0 is a constant amplitude, % is a unit polarization vector, and γ is the tuning rate of the instantaneousoptical frequency ν(t) = (1/2π)(dφ/dt). After propagation through the measurement interferometer, the optical
Figure 1. Setup for optical frequency-domain reflectometry with fiber optic components.
fields in the two paths of group delays τ1 and τ2, lead to a detector voltage given by:
U(t) = U0
∣∣∣ejφ(t−τ1) +H(ν) ejφ(t−τ2)∣∣∣2
= U0
[1 + |H(ν)|2 + 2 Re
{H(ν) ej(2πγτ0t+ϕ)
}]= U0
[1 +A(ν)2 + 2A(ν) cos(2πγτ0t+ Φ(ν) + ϕ)
], (2)
where τ0 = τ2 − τ1, ϕ is a phase constant, H(ν) = A(ν) ej Φ(ν) is the transfer function of the DUT, U0 = σE20/2
and σ depends on the detector sensitivity. Here, for sake of simplicity, assumptions on the co-polarization of theoptical fields from the two interferometer paths and on the polarization independence of the transfer functionof the DUT are made. Although these assumptions are, in general, quite strong, they are reasonable for theparticular case in exam. In fact, co-polarization of the interfering signals can be achieved over a wide wavelengthrange of several nm by adjusting the fringe visibility by means of the fiber polarization controller on one ofthe interferometer arms. If the two signals are not co-polarized, polarization fading of the interference fringesoccurs; however polarization-diverse detection can be used to avoid it.16,18 On the other hand, the assumptionon polarization independence of H(ν) is justified for the Waveshaper by the use of polarization-diverse optics.For further information on the filter, the interested reader is referred to Ref. 2.
Since in eq. 2, the DC term U0(1 +A(ν)2) does not carry any useful information, it is typically neglected andfringe equation is more conveniently written as a function of the instantaneous optical frequency ν(t) as:
U(ν) = 2U0A(ν) cos(2πντ0 + Φ(ν) + ξ)], (3)
with ξ = ϕ − 2πν0τ0. In other words, the interference fringes recorded at the output of the measurementinterferometer are amplitude modulated by the amplitude transfer function of the DUT and phase modulatedby its phase transfer function. By sampling fringes at constant frequency spacing δν and applying fast Fouriertransform (FFT) to the sampled signal, one can obtain a positive frequency peak centered at the time delayτ0. Such peak contains all the information on the DUT. A negative frequency peak at −τ0 will also be presentbecause of the hermitian properties of the FFT applied on a real signal. In case light travels along multiplepaths with different lengths in the measurement arm of the interferometer, different peaks will be present in thereflectogram at the corresponding time delays.
2.2 Digital Signal Processing for Phase Information Extraction
Given the reflectogram for the recorded fringes, digital signal processing is performed in order to extract theamplitude and phase response of the DUT whose signature is localized at the position τ0. First of all, thenegative frequencies part of the reflectogram is suppressed by setting the corresponding data points to zero (orequivalently after an Hilbert transform). Additionally, a digital band pass filter centered at τ0 (in time domain)is applied to isolate DUT signature and to reduce as much as possible the white noise (shot-noise plus dark-noise
contribution) generated by the detector. The filtered data set is finally inverse Fourier transformed. It is worthnoting that the employed digital filter width and shape influence, in spectral domain, both the sharpness andthe noise level of the retrieved amplitude and phase transfer functions: the larger the filter width, the sharperand noisier the transfer functions will be, and vice-versa.The amplitude of the DUT transfer function does not present particular difficulties and is obtained by extractingthe envelope of a fringe pattern. As an example of amplitude response extraction, Fig. 2 shows the measuredtransfer function of a 1 THz bandwidth bandpass filter generated with the Waveshaper (blue curve), in com-parison with the programmed filter shape (red curve). Conversely, spectral phase response extraction is moredelicate and requires additional signal processing since the DUT signal is centered at τ0 (in time domain). Asa consequence, a rapidly growing linear phase profile is expected for the computed Φ(ν) by virtue of the ShiftTheorem of the Fourier transform, which states that a translation in the time domain corresponds to a linearphase factor in the frequency domain. Therefore, subtraction from the unwrapped phase data of the first-orderpolynomial fit to the data, corresponding to such linear phase factor, is performed in order to suppress additionalpropagation delay (in DUT surrounding fibers) and, hence, to isolate the phase response of the DUT.
Figure 2. Measured transfer function of a 1 THz bandwidth bandpass filter generated with the Waveshaper (blue), incomparison with the programmed filter shape (red).
Furthermore, for the sake of precision, it is important to remark that not only the phase response of theDUT is encoded in the fringes, but also the group delay dispersion of the optical components that constitute themeasurement setup itself. So, in order to precisely determine the phase transfer function of the DUT, the GDDof the setup should be estimated and subtracted from the measured phase profile. For OFDI characterizationsin transmission configuration (as in Fig. 1), this can be done by performing a two step measurement: onewith the DUT and the other without, and extracting the setup GDD and the overall phase profile using theprocedure described above. For measurements in reflection configuration, only one acquisition step is needed;in this case, reflection peaks in the reflectogram corresponding to the input and the output facet of the DUTcan be separately used to determine the setup contribution and the overall phase profile (for one round tripin the DUT), respectively. In the present study, characterizations are performed in transmission configuration.However, instead of performing two separate measurements to deduce the phase transfer function of the DUT,we take advantage of the high precision of the programmable optical filter, considering it as an amplitude andphase reference component that we can use to evaluate the phase characterization performances of our OFDRsetup with just a single measurement, following the procedure described in sec. 3.
2.3 Nonlinear frequency sweep of the tunable laser source
In deriving the equations governing Coherent OFDI and the signal processing procedure used to extract amplitudeand phase information, assumptions have been made concerning the time-linear frequency sweep of the tunablelaser source and interferogram sampling at constant frequency spacing. In practice, TLSs frequency sweep maystrongly deviate from linearity, so ad hoc techniques are introduced to ensure interferogram sampling at constant
frequency spacing. Methods typically adopted for this purpose involve the use of an auxiliary interferometer toestimate the time-dependent sweep rate of the laser γ(t) and compensate its effect (see Fig. 1). The simplest andmost popular way of doing that consists in using the frequency-periodic output of the auxiliary interferometer(cf. eq. 3) as trigger signal for sampling the fringe pattern from the measurement interferometer.16,18 Thistechnique allows for fast data acquisition and real-time analysis. However, it is commonly admitted that thismethod is not necessarily the best choice when measuring phase features.19 Alternatively, a different techniqueconsists in sampling with a standard time-domain sampler the output of both interferometers and subsequentlyperforming a numerical resampling at constant frequency spacing of the measurement interferogram, based onthe time dependent sweep rate γ(t) measured from the auxiliary interferometer fringe pattern.20 Compared tothe first method, such approach offers a better control of phase information, at the expense of an oversampling ofthe interferograms and a heavier digital signal processing of the acquired data and it is preferred for our purposes.
3. SPECTRAL PHASE MEASUREMENT BY OFDR
We observe from previous sections that a large number of filtering steps are to be applied before data exploitation.Their impact on phase and amplitude characterisation of DUT have not been fully studied in literature. Thishas motivated the following experimental evaluation of coherent OFDR capabilities when measuring spectralphase/amplitude of DUT. To this end, we investigate the access to the complex transfer function of opticalcomponents by using as DUT a commercial optical filter, the Finisar Waveshaper 1000 S/X, programmable inattenuation and phase over C+L band, and following the scheme indicated in Fig. 1. In this section we describethe working principle of such programmable filter and the measurement strategy adopted for our purposes.Finally we present the discrete phase shift and group delay dispersion measurement capabilities of Co-OFDR.
3.1 Operating Principle of Programmable Filter
The programmable optical filter Finisar Waveshaper 1000 S/X, used as reference DUT in the OFDR setup, isa commercial device that can produce user-defined filter shapes with arbitrary amplitude and phase profile andminimum filter bandwidth down to 20 GHz. Its operating principle is based on the concept of 4-f Pulse Shaper,first introduced by Froehly, et al. in 1983,21 depicted in Fig. 3. It consists in angularly separating the spectralcomponents of the incoming signal by a first grating, and focusing each of them to small diffraction spots inthe Fourier plane by a lens. In this plane, a suitably patterned mask can be used to induce optical path lengthand/or optical density changes for the spatially dispersed spectral components. Shaping of the output waveformis then achieved by recombining the spectral components by a second lens and grating. Such waveform will resultfrom the mapping of the Fourier transform of the mask pattern onto the output spectrum.
Figure 3. Schematic of the 4-f Pulse Shaper concept.
In the optical filter under consideration, the spatial mask is implemented using a programmable liquid crystalmodulator array on silicon substrate (Liquid Crystal on Silicon (LCoS)) providing independent control overspectral amplitude and phase profiles. A polarization diverse optics is used to separate and align the orthogonalpolarization states of input field to match the high efficiency s-polarization state of the diffraction grating and,
thus, reduce the polarization-dependent loss of the device. For more details about the implementation and theapplication in optical fiber communications of this class of LCoS programmable optical processors, the interestedreader is referred to Ref. 2 and 22. In the present study, we take advantage of the capabilities of the Waveshaperand, using the digital signal processing procedure described in sec. 2, we investigate the OFDR performances inretrieving the amplitude and phase transfer function programmed on the optical filter. In particular, we focusour attention on the characterization of discrete phase shifts and group delay dispersion.
3.2 Discrete Phase Shift Measurement
The capability of OFDR of measuring discrete phase shifts is here evaluated using all-pass optical filters withphase shifts of different amounts applied over 100 GHz bands. The phase response of the filter is characterizedusing the procedure described in sec. 2: the cumulated delay (or, equivalently, the linear phase factor) due to lightpropagation in measurement interferometer is systematically compensated. Additionally, the global dispersionintroduced by the reference and measurement interferometers is also compensated. To this end, the nearlyparabolic phase profile corresponding to the global setup dispersion is estimated by means of polynomial fit tothe phase data and subtracted in order to retrieve the correct phase transfer function of the filter. As illustratedin sec. 2, prior to performing such operations, reflectogram data are filtered in time domain, using a narrowdigital filter around the peak corresponding to the DUT, in order to reduce as much as possible the white noisecontribution in the spectral domain.
Figure 4. Examples of discrete phase shifts measurements: (a) phase shift values ranging from -2 and 2 rad with minimumstep of 0.5 rad; (b) phase shift values from -0.2 and 0.2 rad with minimum step of 0.05 rad.
Examples of measurements of discrete phase shifts of different amounts are presented in Fig. 4. It is observedthat for phase shift of few rads down to several hundreds of mrad, the desired phase profile can be accuratelyretrieved. However, for phase shifts of several tens of mrad, a noise becomes appearent. Nonetheless, small phaseshift down to 50 mrad can be detected by OFDR.
3.3 Group Delay Dispersion Measurement
In an analogous way, group delay dispersion measurement capabilities of OFDR are evaluated by imposing aparabolic spectral phase profile to the programmable filter and retrieving it. Such phase profile is programmed onthe bandpass of a 1 THz bandwidth filter as that shown in Fig. 2. The dispersion of the OFDR setup is estimatedfrom the phase data set corresponding to the filter stop-band. Examples of dispersion measurements for GDDvalues of 1, 0.2 and 0.02 ps/ns are shown in Fig. 5. As for the case of discrete phase shift measurements, for largevalues of dispersion the retrieved phase profile accurately reproduces the programmed one. When the dispersiondecreases the impact of noise on the measurement becomes more important. Nevertheless, GDD values down to20 fs/nm can be measured over an optical bandwidth as narrow as 1 THz.
When optical filters with larger bandwidth are considered, it is observed that the noise impacting on dispersionmeasurements is not a white noise. More precisely, a periodical fluctuation seems to be superimposed to theparabolic phase related to the programmed GDD (see Fig. 5 (right)).The origin of these fluctuations needs to be be more carefully identified and is studied in the next section.
Figure 5. Examples of group delay dispersion measurements for GDD values of 1 ps/nm (left), 0.2 ps/nm (center) and0.02 ps/nm (right).
4. CONSIDERATIONS ON DOPPLER EFFECT
4.1 Specific features of phase fluctuations
In order to gain more insight into the physical properties of the fluctuation observed in the measurements reportedin the previous section, further OFDI characterizations have been performed as a function of the TLS sweeprate. Figure 6 shows the phase profiles and the raw reflectogram data recorded for an all-pass filter shape witha flat phase response, at nominal sweep rates of 10 and 20 nm/s.
Figure 6. Spectral phase measurements (left) and corresponding reflectograms (right) for nominal sweep rates of 10 and20 nm/s.
From fig. 6 two main features can be observed. First of all, the average phase variation over the opticalfrequency range of the measurement is parabolic. This can be attributed to GDD of the OFDI setup, asexplained in section 2. In the second instance, the fluctuations superimposed on the parabolic phase profile(see fig. 6, left) seem to be almost periodical. More importantly, their periods manifest to be highly dependenton the TLS tuning rate. At the same time, two symmetric sidebands are observed on both side of the mainpeak on the corresponding reflectograms (see fig. 6, right). Their positions are influenced by the tuning rateof the TLS, with a separation relatively to the central peak that decreases when the sweep rate γ is increased.These experimental results suggest that the sidebands observed in time-domain as well as the period of therecorded phase fluctuations in spectral domain are closely related one another. Furthermore, since their differentcharacteristics depend on the TLS tuning rate, and consequently, on the time needed to perform an OFDR dataacquisition, it becomes clear that the experimental conditions are changing over the data acquisition.
4.2 Dynamical aspects of OFDR measures
A phase modulation of light during its transmission through the DUT is a possible hypothesis that can explainthe previous observations. To clarify this affirmation, and in complement to usual assumptions that are implicitlyimposed when analysing OFDR signals, we consider in the following the situation in which the DUT, or part
of the OFDR setup, has characteristics that may vary over time. In other words, dynamical aspects occurringduring the OFDR data measurement are here specifically addressed. To do so, eq. 2 is reviewed assuming nowthat the time delay τ = τ2 − τ1 is not constant anymore but it can change over time. In particular, we consider
τ(t) = τ0 −∆τ(t), (4)
where τ0 is the time delay of the OFDR measurement interferometer in the absence of perturbations, while∆τ(t) � τ0 is a perturbation term that represents the time deviation from the static condition needed for thelight to propagate in the OFDR measurement interferometer.
This formulation is quite general and well suited to describe the effect induced by different physical phenom-ena, such as the refractive variations due to temperature or strain fluctiations in the fibered interferometer, orcoupling of mechanical perturbations to the DUT properties. In order to simplify the mathematical study of suchsituation, a DUT with a flat phase Φ(ν) and amplitude A(ν) response is considered. This choice correspondsto a DUT that introduces neither extra time-delay nor amplitude distortion (in agreement with experimentalconditions of measurements reported in fig. 6). With the definition in eq. 4, interference fringes in equation 2become,
U(t) = 2U0A cos(4πγ(τ0 −∆τ(t))t+ ϕ), (5)
where ϕ is the same phase constant as in equation 2. If we rearrange equation 5 to take into account theimpact of variations of τ(t) with time by further considering ν0 � γt� γτ0 (since we only address the case of aperturbation), equation 5 becomes:
U(t) = U0 cos(4πγτ0t+ Φm(t) + ϕ), (6)
whereΦm(t) = 4πν0∆τ(t) = 4π
ν0
cx(t) (7)
and x(t) represents the optical path change caused by external perturbations.
A close examination of the phase of equation 6 reveals two distinct physical contributions. The first one (i.e.the term that varies linearly with time) corresponds to the relative time delay caused by the propagation oflight in the OFDR interferometer under static conditions. The second term (Φm(t)) corresponds to dynamicalcontribution of the interferometer. It is important to remark that, since the optical path difference of the twoarms of the interferometer is not constant by definition, light passing through the interferometer will be affectedby Doppler effect and the time-varying instantaneous optical frequency of the TLS will experiences an additionalspectral shift. Using eq. 7, the signatures of Doppler effect on OFDI measurement can be conveniently modelledand studied.
a Case of a constant Doppler effect during OFDR data acquisition
In this section, we consider the most common situation when dealing with Doppler effect, that is when theoptical path length linearly changes over the measurement time. In this case, a constant Doppler frequencyshift is expected for the light that propagates through the measurement interferometer of the OFDI setup. Suchsituation is modelled by imposing that x(t) in eq. 7 varies linearly with t, i.e. x(t) = wt, where w is the rate ofchange of the optical path length, expressed in m/s.
Figure 7 shows the simulated reflectograms, obtained for two different values of the velocity w and fourdifferent tuning rates γ of the TLS, after Fourier transformation of eq. 6 and 7. In the simulations, the parameterτ0 is set to 5000 s, as can be observed from the curve for w = 0. It can be noticed that, when Doppler effectis introduced in the simulations (by setting here w = 0.1 m/s), the position of the reflectometer peak is shiftedfrom its nominal position by an amount that strongly depends on the tuning rate parameter γ. In particular,the higher the tuning rate, the lower the shift of the reflectogram peak. From the analytical expression of theFourier Transform of eq. 7, the peak shift is calculated to be ∆ = w/γ.
The simulations reported in fig. 7 show that ambiguities on the optical path length can be encountered whenexploiting the OFDR reflectogram data. Indeed, in addition to the ambiguities already identified in ref. 16, wenote that a full exploitation of reflectogram abscissa requires some extra knowledge on possible Doppler effects
Figure 7. Simulation results of reflectograms in the condition of a constant speed w = 0.1 m/s of the reflector for frequencysweep rates of 5,10, and 15 nm/s.
present when the measurements are performed. In particular, when the DUT is subject to dynamical phasevariation (as is the case, for example, of phase modulators), special care must be taken when exploiting itssignature in OFDR reflectogram.
b Case of a non-constant Doppler effect during OFDR data acquisition
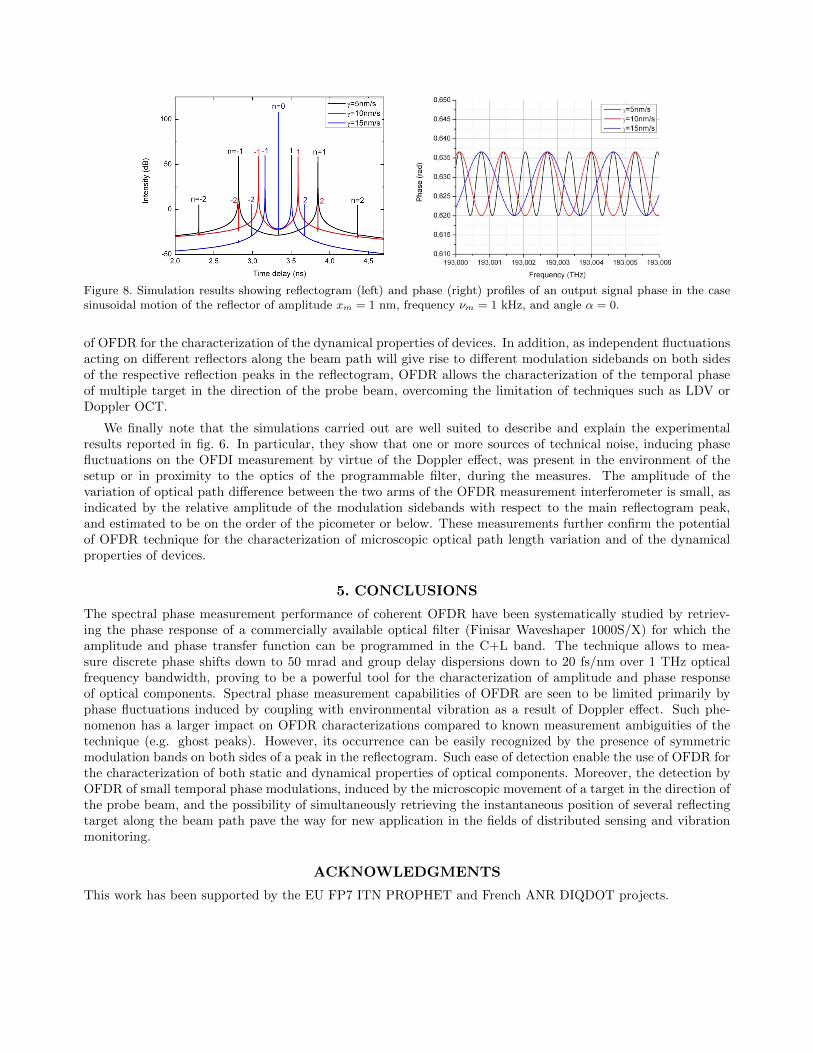
In this section, we examine the most general situation where Doppler effect is not constant during OFDRdata acquisition. To this end, let’s consider a pure harmonic perturbation described by setting in eq. 7x(t) = xm cos(2πνmt), where xm is the amplitude of the phase perturbation and νm its frequency. In thiscase, the temporal evolution of the signal recorded by the detector can be expressed (after some conventionalmathematical manipulations of eq. 6) with a series of Bessel functions of the first kind, as:
U(t) = U0
+∞∑n=−∞
Jn
(2πxmλ0
)cos [2π(γτ0 + nνm)t+ ϕ0] , (8)
with λ0 is the wavelength of the TLS. The simulated reflectogram presented in Fig. 8 are obtained after a Fouriertransform of eq. 8 for different parameters. When xm is set to 0 (i.e. no Doppler effect is simulated), only onepeak is present in the reflectogram, which in this case is identical to that reported in Fig. 7 for w = 0. On theother hand, when xm 6= 0 (i.e. in the case of pure harmonic perturbation), multiple side-peaks, regularly spacedfrom the main central peak are observed in the simulated OFDR reflectograms. More precisely, the position ofthe n-th peak is separated from the central peak by nνm/γ and its energy is Jn(2πxm/λ0), as indicated by eq. 8.When OFDI data are represented in the spectral domain, i.e. after an inverse Fourier Transform of reflectogram,the retrieved phase profile appears to be modulated, with a modulation period that strongly depends on thetuning rate of the TLS (see Fig. 8, right).It is worth to note that, although the previous formulation may appear very specific and restricted to the case
of pure harmonic modulation, it is indeed very general and it can be easily extended to the case of non-periodicmodulation by virtue of the spectral decomposition by means of the Fourier transform.
We would like to stress that, because of the high sensitivity S and dynamic range D of OFDI measurements(in our case evaluated at S = −125 dB and D = 80 dB, respectively) and because of Bessel functions properties,phase perturbation of extremely low amplitude xm (compared to the TLS wavelength) or faint temporal evolutionthe phase of the DUT can be detected by OFDI. We also further insist on the fact that, without any preciseknowledge on the temporal phase characteristics of the DUT, the interpretation of reflectograms peaks, as wellas their phase, can be ambiguous. In fact, without any a priori on the nature of the reflectogram peaks, thedifferent side peaks observed in experimental results or simulations can be attributed either to specific reflectionsin the DUT or to Doppler effect. Nonetheless, the symmetric structure of the modulation sidebands with respecta central, main peak and the tuning rate dependence of the position of the sidebands allow for an easy and fastdiscrimination of Doppler effect related peaks and reflections in the DUT. This feature enables new applications
Figure 8. Simulation results showing reflectogram (left) and phase (right) profiles of an output signal phase in the casesinusoidal motion of the reflector of amplitude xm = 1 nm, frequency νm = 1 kHz, and angle α = 0.
of OFDR for the characterization of the dynamical properties of devices. In addition, as independent fluctuationsacting on different reflectors along the beam path will give rise to different modulation sidebands on both sidesof the respective reflection peaks in the reflectogram, OFDR allows the characterization of the temporal phaseof multiple target in the direction of the probe beam, overcoming the limitation of techniques such as LDV orDoppler OCT.
We finally note that the simulations carried out are well suited to describe and explain the experimentalresults reported in fig. 6. In particular, they show that one or more sources of technical noise, inducing phasefluctuations on the OFDI measurement by virtue of the Doppler effect, was present in the environment of thesetup or in proximity to the optics of the programmable filter, during the measures. The amplitude of thevariation of optical path difference between the two arms of the OFDR measurement interferometer is small, asindicated by the relative amplitude of the modulation sidebands with respect to the main reflectogram peak,and estimated to be on the order of the picometer or below. These measurements further confirm the potentialof OFDR technique for the characterization of microscopic optical path length variation and of the dynamicalproperties of devices.
5. CONCLUSIONS
The spectral phase measurement performance of coherent OFDR have been systematically studied by retriev-ing the phase response of a commercially available optical filter (Finisar Waveshaper 1000S/X) for which theamplitude and phase transfer function can be programmed in the C+L band. The technique allows to mea-sure discrete phase shifts down to 50 mrad and group delay dispersions down to 20 fs/nm over 1 THz opticalfrequency bandwidth, proving to be a powerful tool for the characterization of amplitude and phase responseof optical components. Spectral phase measurement capabilities of OFDR are seen to be limited primarily byphase fluctuations induced by coupling with environmental vibration as a result of Doppler effect. Such phe-nomenon has a larger impact on OFDR characterizations compared to known measurement ambiguities of thetechnique (e.g. ghost peaks). However, its occurrence can be easily recognized by the presence of symmetricmodulation bands on both sides of a peak in the reflectogram. Such ease of detection enable the use of OFDR forthe characterization of both static and dynamical properties of optical components. Moreover, the detection byOFDR of small temporal phase modulations, induced by the microscopic movement of a target in the direction ofthe probe beam, and the possibility of simultaneously retrieving the instantaneous position of several reflectingtarget along the beam path pave the way for new application in the fields of distributed sensing and vibrationmonitoring.
ACKNOWLEDGMENTS
This work has been supported by the EU FP7 ITN PROPHET and French ANR DIQDOT projects.
REFERENCES
1. G. P. Agrawal, J. E. Geusic, and P. J. Anthony, “Distributed feedback lasers with multiple phase-shiftregions,” Applied Physics Letters 53, pp. 178–179, 1988.
2. M. F. Roelens, S. Frisken, J. Bolger, D. Abakoumov, G. Baxter, S. Poole, and B. Eggleton, “Dispersiontrimming in a reconfigurable wavelength selective switch,” Journal of Lightwave Technology 26(1), pp. 73–78, 2008.
3. T. Herr, K. Hartinger, J. Riemensberger, C. Y. Wang, E. Gavartin, R. Holzwarth, M. L. Gorodetsky, andT. J. Kippenberg, “Universal formation dynamics and noise of Kerr-frequency combs in microresonators,”Nature Photonics 6(7), pp. 480–487, 2012.
4. M. Schell, M. Tsuchiya, and T. Kamiya, “Chirp and stability of mode-locked semiconductor lasers,” IEEEJournal of Quantum Electronics 32(7), pp. 1180–1190, 1996.
5. S. T. Cundiff and A. M. Weiner, “Optical arbitrary waveform generation,” Nature Photonics 4(11), pp. 760–766, 2010.
6. R. Trebino, Frequency-Resolved Optical Gating: The Measurement of Ultrashort Laser Pulses, Springer,2000.
7. C. Dorrer and I. Kang, “Simultaneous temporal characterization of telecommunication optical pulses andmodulators by use of spectrograms,” Optics Letters 27(15), pp. 1315–1317, 2002.
8. C. Iaconis and I. Walmsley, “Spectral phase interferometry for direct electric-field reconstruction of ultra-short optical pulses,” Optics Letters 23(10), pp. 792–794, 1998.
9. D. A. Reid, S. G. Murdoch, and L. P. Barry, “Stepped-heterodyne optical complex spectrum analyzer,”Optics Express 18(19), pp. 19724–19731, 2010.
10. S. Diddams and J.-C. Diels, “Dispersion measurements with white-light interferometry,” JOSA B 13(6),pp. 1120–1129, 1996.
11. C. Palavicini, Y. Jaouen, G. Debarge, E. Kerrinckx, Y. Quiquempois, M. Douay, C. Lepers, A.-F. Obaton,and G. Melin, “Phase-sensitive optical low-coherence reflectometry technique applied to the characterizationof photonic crystal fiber properties,” Optics Letters 30(4), pp. 361–363, 2005.
12. K. Naganuma, “Semiconductor laser cavity dispersion measurement based on interferometric crosscorrelationof amplified spontaneous emission,” Applied Physics Letters 64(3), pp. 261–263, 1994.
13. C. Palavicini, G. Campuzano, B. Thedrez, Y. Jaouen, and P. Gallion, “Analysis of optical-injected dis-tributed feedback lasers using complex optical low-coherence reflectometry,” IEEE Photonics TechnologyLetters 15(12), pp. 1683–1685, 2003.
14. Y. Gottesman, E. V. K. Rao, H. Sillard, and J. Jacquet, “Modeling of optical low coherence reflectometryrecorded bragg reflectograms: Evidence to a decisive role of bragg spectral selectivity,” Journal of LightwaveTechnology 20(3), pp. 489–493, 2002.
15. A. Parini, P. Hamel, A. De Rossi, S. Combrie, N.-V.-Q. Tran, Y. Gottesman, R. Gabet, A. Talneau,Y. Jaouen, and G. Vadala, “Time-wavelength reflectance maps of photonic crystal waveguides: A new viewon disorder-induced scattering,” Journal of Lightwave Technology 26(23), pp. 3794–3802, 2008.
16. U. Glombitza and E. Brinkmeyer, “Coherent frequency-domain reflectometry for characterization of single-mode integrated-optical waveguides,” Journal of Lightwave Technology 11(8), pp. 1377–1384, 1993.
17. X. Fan, Y. Koshikiya, and F. Ito, “Phase-noise-compensated optical frequency-domain reflectometry,” IEEEJournal of Quantum Electronics 45(6), pp. 594–602, 2009.
18. B. J. Soller, D. K. Gifford, M. S. Wolfe, and M. E. Froggatt, “High resolution optical frequency domainreflectometry for characterization of components and assemblies,” Optics Express 13(2), pp. 666–674, 2005.
19. T.-J. Ahn, Y. Jung, K. Oh, and D. Y. Kim, “Optical frequency-domain chromatic dispersion measurementmethod for higher-order modes in an optical fiber,” Optics Express 13, pp. 10040–10048, Dec. 2005.
20. T.-J. Ahn, J. Y. Lee, and D. Y. Kim, “Suppression of nonlinear frequency sweep in an optical frequency-domain reflectometer by use of hilbert transformation,” Applied Optics 44(35), p. 7630, 2005.
21. C. Froehly, B. Colombeau, and M. Vampouille, “II shaping and analysis of picosecond light pulses,” inProgress in Optics, E. Wolf, ed., Volume 20, pp. 63–153, Elsevier, 1983.