Page 1
Vol. 6 | No.4 | 334 - 341 | October- December| 2013
ISSN: 0974-1496 | e-ISSN: 0976-0083 | CODEN: RJCABP
http://www.rasayanjournal.com
http://www.rasayanjournal.co.in
SUCCINIC- ACETIC ACID SINGLE CRYSTALS B.Ravi et. al
SPECTRAL DIFFRACTION AND OPTICAL STUDIES OF
SUCCINIC- ACETIC ACID SINGLE CRYSTALS
B.Ravi1, A.Jegathesan
2, B. Neelakanda Prasad
3, C. Sadeshkumar
4
and G.Rajarajan5*
1 Department of Physics, King College of Technology, Namakkal-637 020, T. N., India
2 Department of Physics, Paavai Group of Institutions, Pachal-637 018, T.N., India 3 Department of Physics, K.S.R College of Engineering, Tiruchengode-637 215, India
4 Department of Physics,Gnanamani College of Technology, Namakkal-637 018, T.N., India
5Selvam Centre for Materials Research, Selvam Educational Institutions
,
Namakkal-637 003, T.N., India
*E-mail: [email protected]
ABSTRACT
Single crystals of succinic-Acetic acid (SA) were grown by slow evaporation method. The grown crystals were
characterized for the structural parameters by Powder X-ray diffraction (XRD), and functional group analysis by
Fourier Transform Infra-red (FTIR), UV-Vis sbsorption, transmission studies reveals that the grown grystal was
optically transparant through the visible range. Thermal analysis was carried out by Thermogravimetry and
Differential thermogravimetry analysis methods and the SA crystal was thermaly stable upto 189oC. In the
dielectric studies, the dielectric constant and dielectric loss of the crystal were studied as a function of frequency and
the results were discussed. The optical absorption studies indicate that for the sample, optical transparency window
is quite wide, making it suitable for NLO applications.
Keywords : Crystal growth, slow evaporation process, structural studies, optical studies, dielectric studies. ©2013 RASĀYAN. All rights reserved
INTRODUCTION The ferroelectric crystals have a wide range of applications in biological and industries like in
optoelectronics field such as capacitors, nonvolatile memory devices, actuators, high-performance gate
insulators, etc. Ferro electric crystals posses’ domains of different orientations of electrical polarization
that can be reoriented and brought into alignment by an electric field1-3
. Among the most numerous
ferroelectrics are peroviskites of which a classic example is barium titanate which is widely used in
capacitors. Recently, literature reveals that extending crystals of succinic acid for high electron mobility
transistor fabrication (HEMT)2-10
. Due to their biological and industrial applications, our attention has
been focused to investigate the succinic acid crystals, doped with succinic acid crystals and its
applications. Here we report the growth of a promising new organic crystal of succinic-acetic acids (SA)
grown by slow evaporation, solution growth technique. The grown crystal was confirmed by powder
XRD studies. The functional groups of SA were identified by FT-IR and the transmission of the grown
crystal was measured using UV–Vis–NIR spectrum. Thermal stability has been studied and the
ferroelectric patterns have also been observed on the grown crystals by dielectric measurements.
EXPERIMENTAL Succinic-acetic single crystals have been grown from aqueous solution by low-temperature solution
growth technique by slow evaporation in a constant temperature bath controlled to an accuracy of
±0.01OC. The starting material was synthesized from commercially available Succinic acid (AR grade)
and Acetic acid (AR grade), taken in the equimolar ratio 1:1. Calculated amount of the reactants were
thoroughly dissolved in deionized water and stirred well for about 5 hours using a magnetic stirrer to
Page 2
Vol. 6 | No.4 | 334 - 341 | October- December| 2013
SUCCINIC- ACETIC ACID SINGLE CRYSTALS B.Ravi et. al 335
obtain a homogenous mixture.Then the solution was allowed to evaporate slowly until the solvent was
completely dried. Crystals begin to grow inside the solution and were removed from the solution after 10
days, washed and dried in air. The purity of the synthesized salt was further increased by successive re-
crystallization process. The grown crystals are shown in Figure-1.The reaction mechanism is given
below-
2(CH2COOH) + 2 (CH3COOH) →CH2-COO-CH2-CH2-COO-CH3 +2H2O + CH3COOH (1)
Characterization studies
Powder X-Ray diffraction studies were carried out using Rich Seifert diffractometer with CuKα (λ =1.54060 Ǻ) radiation. Fourier transform infrared (FTIR) spectrum of SA crystal was recorded at a
resolution 2 cm-1
in the range of 400–4000 cm-1
employing Perkin–Elmer FT-IR spectrometer model
SPECTRUMRX1 using KBr pellets technique. The optical absorption spectra of SA crystals were
recorded in the range 190 – 1100 nm using Lambda 35 double-beam spectrophotometer. Thermal stability
and physiochemical changes of the sample were analyzed by recording the TGA and DTA spectrum using
the instrument NETSZCH SDT Q 600 V8.3 Build 101, in the temperature range 0–300oC in nitrogen
atmosphere at a heating rate of 20oC/min. The dielectric constant and dielectric loss of SA crystal were
measured using HIOKI 3532 LCR HITESTER in the frequency range 50 Hz –5.5 MHz. In order to ensure
good electrical contact between the crystal and the electrodes, a sample of 5.6 mm x 2.8 mm x 2.2 mm
was coated with silver paint.
Fig.- 1: Grown Succinic-acetic acid crystals
Fig.-2: Powder xrd pattern for SA crystal
Page 3
Vol. 6 | No.4 | 334 - 341 | October- December| 2013
SUCCINIC- ACETIC ACID SINGLE CRYSTALS B.Ravi et. al 336
Fig.- 3: FT-IR spectrum of SA crystal.
RESULTS AND DISCUSSION Powder XRD analysis The structural parameters of the single crystals were studied by X-Ray powder diffraction method. X-Ray
diffraction studies were carried out using Rich Seifert diffractometer with CuKα (λ =1.54060 Ǻ)
radiation. Powder diffraction patters were scanned for the range of 2ɵ values from 20 degree to 80
degrees at the rate of 5 degrees. The well-defined peaks at specific 2ɵ values show high crystallinity of
the grown crystals of Succinic-acetic acids. The lattice parameter values of SA crystals have been
calculated by Full Prof Suite software package. The resultant peaks in the diffractogram (Figure- 2) shows
an intense peak at 26.1082(3) °(intense peak). It is observed that SA belongs to triclinic system and its
volume is 341.62oA and cell parameters values are tabulated in Table-1.
Table-1: The cell parameters of SA crystal.
A(oA) B(
oA) C(
oA) α β γ Space group Volume(
oA)
7.0511 9.7836 4.6868 93.26 91.05 96.35 P21(Triclinic) 341.62
FTIR SPECTRUM
Spectrum Name: Succinic
acid.sp
4000.0 3000 2000 1500 1000 400.0
0.0
10
20
30
40
50
60
70
80
90
100.0
cm-1
%T
3920.
82
3790.
04
3048.
04
2636.
70
2534.
91
2253.
01
1703.
30
1419.
46
1305.
07 1191.
48
909.
14
800.
89
624.
65
Page 4
Vol. 6 | No.4 | 334 - 341 | October- December| 2013
SUCCINIC- ACETIC ACID SINGLE CRYSTALS B.Ravi et. al 337
Table- 2: FTIR absorption frequencies of Succinic-acetic acid single crystal
S.No Wave Number
(cm-1
) Assignment
1 3790 O-H Stretching
2 3045 CH2 Stretching
3 2635 O-H Stretching
4 2253 C-H Stretching
5 1703 COO- Stretching
6 1419 COO- Symmetry Stretch
7 1309 CH2- wagging
8 1191 CH3 symmetry Stretching
9 909 O-H out of plane
10 800 COO- -bending
11 624 C-OH Stretching
Interpretation Of FTIR Spectrum The infrared spectrum of SA crystals have been carried out to analyse the chemical bonding and
molecular structure of the compound. The FT-IR spectrum of the crystal has recorded in the frequency
region from 400 cm−1
to 4000 cm−1
with Perkin–Elmer FTIR spectrometer model SPECTRUMRX1 using
KBr pellets containing SA powder obtained from the grown single crystals. The observed FT–IR
spectrum of SA is as shown in Figure- 3. The strong absorption at 1419 cm−1
indicates the symmetric
stretching vibration frequency of carbonyl group. The bending and rocking vibrations of COO− are
observed at 800.89 cm−1
and 624.65 cm−1
, respectively. CH2 wagging (1305cm−1
) and C-CH3 stretching
(1191cm−1
) vibrations are also observed. The frequency of absorption of O-H Stretching at 3048.04 cm−1
confirms the presence of succinic acid.
Fig.- 4: Absorption spectrum of LAS crystal.
UV spectrum
Spectrum Name: SUUC-AC.SP
Instrument Model: Lambda 35
190.0 300 400 500 600 700 800 900 1000 1100.0 -0.05
0.0
0.1
0.2
0.3
0.4
0.5
0.6
0.7
0.8
0.9
1.0
1.1
1.2
1.3
1.4
1.5
1.6
1.7
1.80
nm
A
204.50,0.88734
196.12,0.94797
Page 5
Vol. 6 | No.4 | 334 - 341 | October- December| 2013
SUCCINIC- ACETIC ACID SINGLE CRYSTALS B.Ravi et. al 338
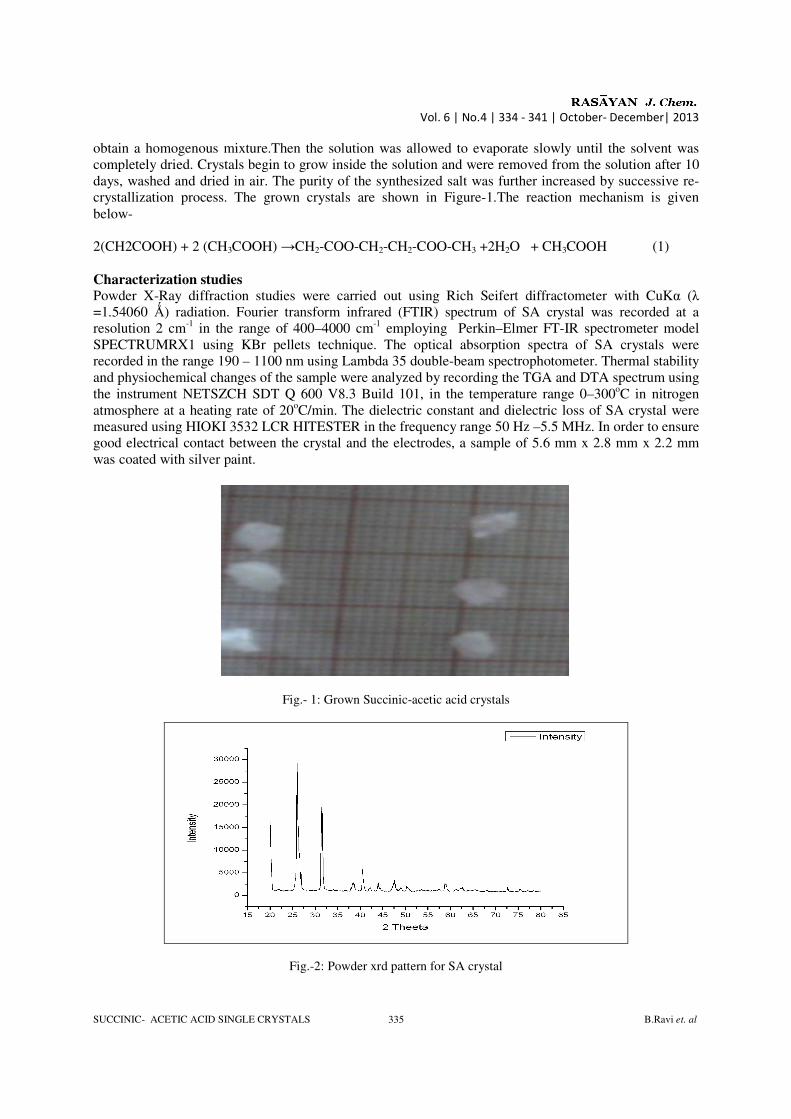
UV-Vis Transmittance -Absorption studies The optical transmittance and absorption spectrum of grown SA crystal has been recorded with a Lambda
35 double-beam spectrophotometer in the range 190–1100 nm to find the suitability of crystal for optical
applications. The crystal shows a good transmittance (Figure- 5)in the visible region which enables it to
be a good material for optoelectronic applications12
. From the spectrum (Figure-4), there is no significant
absorption in the entire range tested. A good optical transmittance from ultraviolet to infrared region is
very useful for optical applications13
. From the UV–Vis–NIR spectrum, it is clear that the transparency of
the grown crystals extends up to UV region. The lower cut-off wavelength is as low at 384 nm. The lower
cut-off near 384 nm in transmittance spectrum combined with the very good transparency, makes the
usefulness of this material for optoelectronic and nonlinear optical applications.
Fig.- 5: Transmission spectrum of SA crystal.
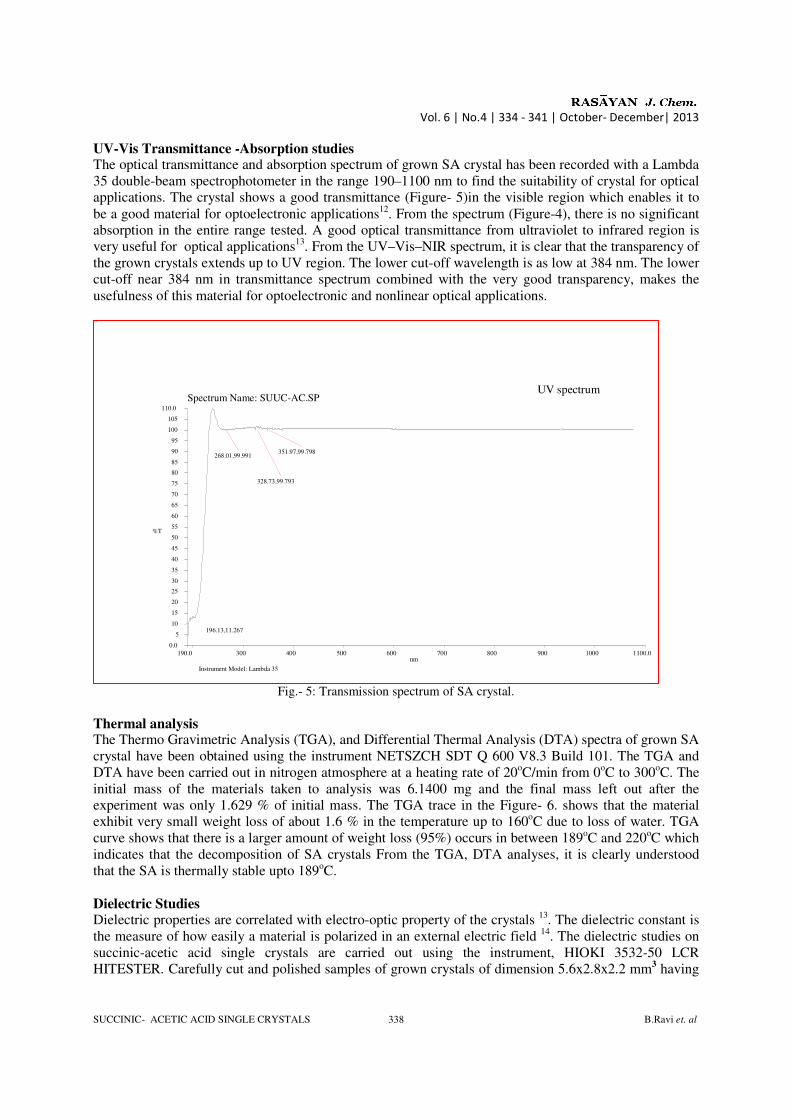
Thermal analysis The Thermo Gravimetric Analysis (TGA), and Differential Thermal Analysis (DTA) spectra of grown SA
crystal have been obtained using the instrument NETSZCH SDT Q 600 V8.3 Build 101. The TGA and
DTA have been carried out in nitrogen atmosphere at a heating rate of 20oC/min from 0
oC to 300
oC. The
initial mass of the materials taken to analysis was 6.1400 mg and the final mass left out after the
experiment was only 1.629 % of initial mass. The TGA trace in the Figure- 6. shows that the material
exhibit very small weight loss of about 1.6 % in the temperature up to 160oC due to loss of water. TGA
curve shows that there is a larger amount of weight loss (95%) occurs in between 189oC and 220oC which
indicates that the decomposition of SA crystals From the TGA, DTA analyses, it is clearly understood
that the SA is thermally stable upto 189oC.
Dielectric Studies Dielectric properties are correlated with electro-optic property of the crystals 13. The dielectric constant is
the measure of how easily a material is polarized in an external electric field 14
. The dielectric studies on
succinic-acetic acid single crystals are carried out using the instrument, HIOKI 3532-50 LCR
HITESTER. Carefully cut and polished samples of grown crystals of dimension 5.6x2.8x2.2 mm3 having
UV spectrum Spectrum Name: SUUC-AC.SP
Instrument Model: Lambda 35
190.0 300 400 500 600 700 800 900 1000 1100.0
0.0
5
10
15
20
25
30
35
40
45
50
55
60
65
70
75
80
85
90
95
100
105
110.0
nm
%T
351.97,99.798
328.73,99.793
268.01,99.991
196.13,11.267
Page 6
Vol. 6 | No.4 | 334 - 341 | October- December| 2013
SUCCINIC- ACETIC ACID SINGLE CRYSTALS B.Ravi et. al 339
silver coating on opposite faces is placed between the two copper electrodes and thus a parallel plate
capacitor is formed15.
The capacitance is measured in the frequency range of 100Hz to 5.5MHz. The
dielectric constant is calculated using the relation-
εr =Cd/A ε0 (2)
where C-capacitance and d-thickness of the crystal.
Fig.- 6: TGA/DTA curve of SA crystal.
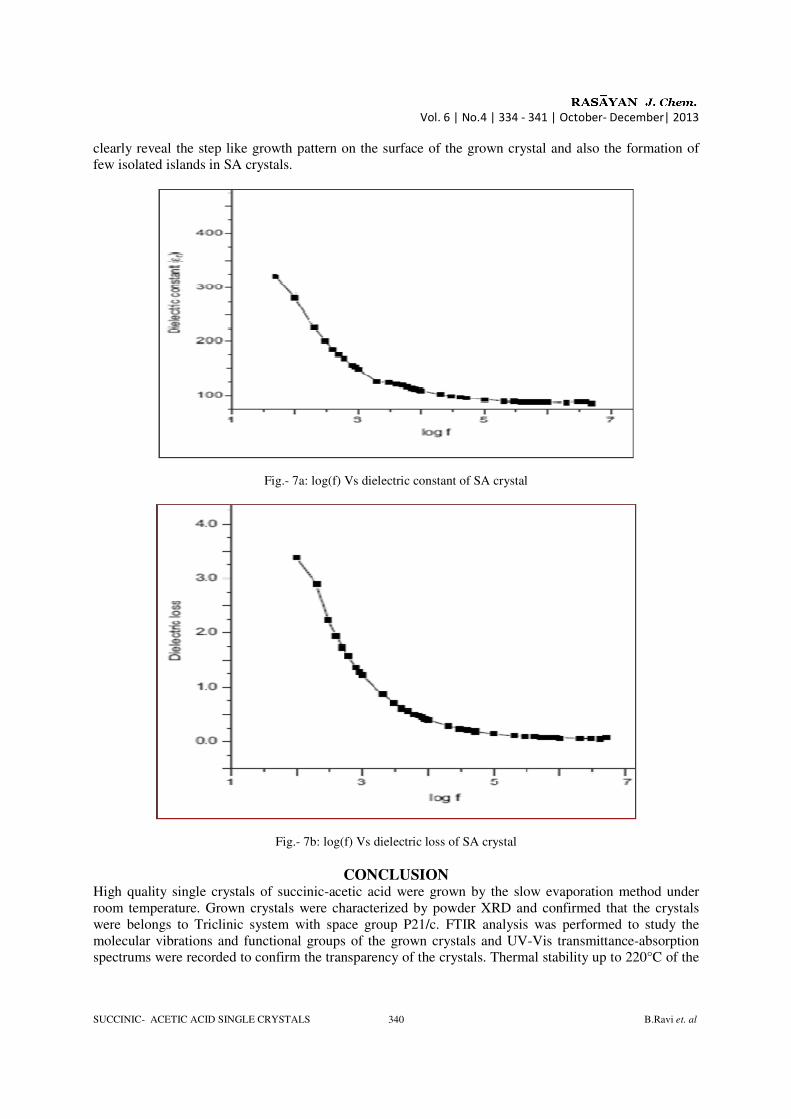
Figure-3 shows the plot of dielectric constant (εr) versus applied frequency. It is observed from the plot
(Figure-7a and b) that the dielectric constant decreases exponentially with increasing frequency and then
attains almost a constant value in the high frequency region. The larger values of dielectric constant at
lower frequencies are due to the impedance to the motion of charge carriers at the electrodes, space
charge and macroscopic distortion results16
. The dielectric constant is low at high frequencies. This is due
to the fact that at higher frequencies the ionic and electronic polarizations are only active17. According to
Miller rule, the lower values of dielectric constant are a suitable parameter for the enhancement of the
optical properties18
. The dielectric loss is studied as a function of frequency at room temperature is shown
in the Figure- 7 (b). These curves suggest that the dielectric loss is strongly dependent on the frequency of
the applied field, similar to that of dielectric constant.
SEM analysis SEM analysis gives information about the nature and suitability for device fabrication and also it is used
to check the presence of imperfections. SEM analysis was carried out using SU 6600 field emission
scanning electron microscope. The SEM micrographs of SA are shown in Figure- 8. The photographs
Page 7
Vol. 6 | No.4 | 334 - 341 | October- December| 2013
SUCCINIC- ACETIC ACID SINGLE CRYSTALS B.Ravi et. al 340
clearly reveal the step like growth pattern on the surface of the grown crystal and also the formation of
few isolated islands in SA crystals.
Fig.- 7a: log(f) Vs dielectric constant of SA crystal
Fig.- 7b: log(f) Vs dielectric loss of SA crystal
CONCLUSION High quality single crystals of succinic-acetic acid were grown by the slow evaporation method under
room temperature. Grown crystals were characterized by powder XRD and confirmed that the crystals
were belongs to Triclinic system with space group P21/c. FTIR analysis was performed to study the
molecular vibrations and functional groups of the grown crystals and UV-Vis transmittance-absorption
spectrums were recorded to confirm the transparency of the crystals. Thermal stability up to 220°C of the
Page 8
Vol. 6 | No.4 | 334 - 341 | October- December| 2013
SUCCINIC- ACETIC ACID SINGLE CRYSTALS B.Ravi et. al 341
crystal was confirmed using TGA/DTA. Very low dielectric constant values, indicating that the crystal
possesses improved pyroelectric properties and low dielectric loss revealing the purity of the crystals.
Fig.-8: SEM images of grown SA crystals
ACKNOWLEDGMENTS The authors are thankful to St. Joseph’s College, Trichy, India, and SASTRA University, Thanjavur,
India for spectral facilities. The authors also express their gratitude to, SRM University, Chennai, India
for XRD facilities.
REFERENCES 1. K. Vinod Wadhawan, Introduction to Ferroic Materials, Gordon and Breach Publishers, London
(New York)(2000).
2. Antony R.West, Solid State Chemistry, John Wiley and Sons, Singapore, p115,102(1998).
3. Kittel Charles, Introduction to Solid State Physics, New Delhi, Wiley Eastern Limited (1993).
4. Sachio Horiuchi, Reiji Kumai, Yoshinori Tokura, J. Am. Chem. Soc., 127,5010(2005).
5. B.B.Ivanova, M.Spiteller, J. Phys. Chem. A, 114(15), 5099 (2010).
6. K.Rajarajan, P.Joseph Ginson, M.Ravi Kumar, I .Vetha Potheher, A. Joseph Arul Pragasam, K.
Ambujam, P.Sagayaraj. Materials and Manufacturing Processes., 22, 370 (2007).
7. Tanusri Pal, Tanusree Kar, Gabriele Bocelli, and Lara Rigi, Synthesis, Growth, and Characterization
of l-Arginine Acetate Crystal- A Potential NLO Material, Cryst. Growth Des., 3(1), 13(2003).
8. O. Auciello, J.F. Scott, and R. Ramesh, Phys. Today, 51, 22 (1998).
9. J. Dolinsek, D. Arcon, Hae Jin Kim, J. Seliger, V. Zagar, P. Vanek, J. Kroupa,Z. Zikmund, J. Petzelt,
Phys. Rev. B , 57, R8063(1998).
10. Lesley Smart and Eaine Moore, Solid State Chemistry, Chapman and Hali, 2nd
edition, p79(2004).
11. S. Krishnan, C. Justin Raj, S. Jerome Das, J. Crystal Growth, 310 ,3313(2008).
12. S. Suresh and K. Anand, Advances in Applied Science Research,3(2),815(2012).
13. S.Boomadevi, H.P.Mittal, R.Dhanasekaran, J.Cryst.Growth., 261,55(2004).
14. S.Goma, C.M.Padma, C.K.Mahadevan. Lett., 60, 3701(2006).
15. J.Madhavan, J. Cryst.Res.Technol., .42(1), 59 (2007).
16. S.K.Arora, V.Patel, B.Amin, A.Kothari., Bull.Mater.Sci., 27, 141-147(2004).
17. V.Rajendran, S.Gnanam, Der Pharma Chemica, 3 (6), 606 (2011).
18. C.Miller, Appl.Phys. Lett., 5, 17(1964).
[RJC-1075/2013]