MIT Lincoln Laboratory SIAM - 1 NTBliss 7/12/10 Spectral Methods for Subgraph Detection This work is sponsored by the Department of the Air Force under Air Force Contract FA8721-05-C-0002. Opinions, interpretations, conclusions and recommendations are those of the author and are not necessarily endorsed by the United States Government. DISTRIBUTION STATEMENT A: Approved for public release: distribution is unlimited Nadya T. Bliss & Benjamin A. Miller Embedded and High Performance Computing MIT Lincoln Laboratory Patrick J. Wolfe Statistics and Information Laboratory Harvard University 12 July 2010
Transcript
MIT Lincoln LaboratorySIAM - 1
NTBliss 7/12/10
Spectral Methods for Subgraph Detection
This work is sponsored by the Department of the Air Force under Air Force Contract FA8721-05-C-0002. Opinions, interpretations,conclusions and recommendations are those of the author and are not necessarily endorsed by the United States Government.
DISTRIBUTION STATEMENT A: Approved for public release: distribution is unlimited
Nadya T. Bliss & Benjamin A. MillerEmbedded and High Performance Computing
MIT Lincoln Laboratory
Patrick J. WolfeStatistics and Information Laboratory
Harvard University
12 July 2010
MIT Lincoln LaboratorySIAM - 2
NTBliss 7/12/10
Outline
• Introduction• Approach• Handling Large Graphs• Summary
MIT Lincoln LaboratorySIAM - 3
NTBliss 7/12/10
Application Examples
•Detect anomalies in the social network (detection)
Goal: Develop detection framework for finding subgraphs of interest in large graphs
THRESHOLD
NOISESIGNAL
‘+’NOISE
H0 H1
Graph Detection Challenges
• Background/foreground models
• Non-Euclidean data
• High-dimensional space
•H0 : G = Gb
•H1 : G = Gb + Gf
•Detection problem:
•Given G, is H0 or H1 true?
G = Gb• background graph
G = Gb + Gf• background graph + foreground graph
MIT Lincoln LaboratorySIAM - 5
NTBliss 7/12/10
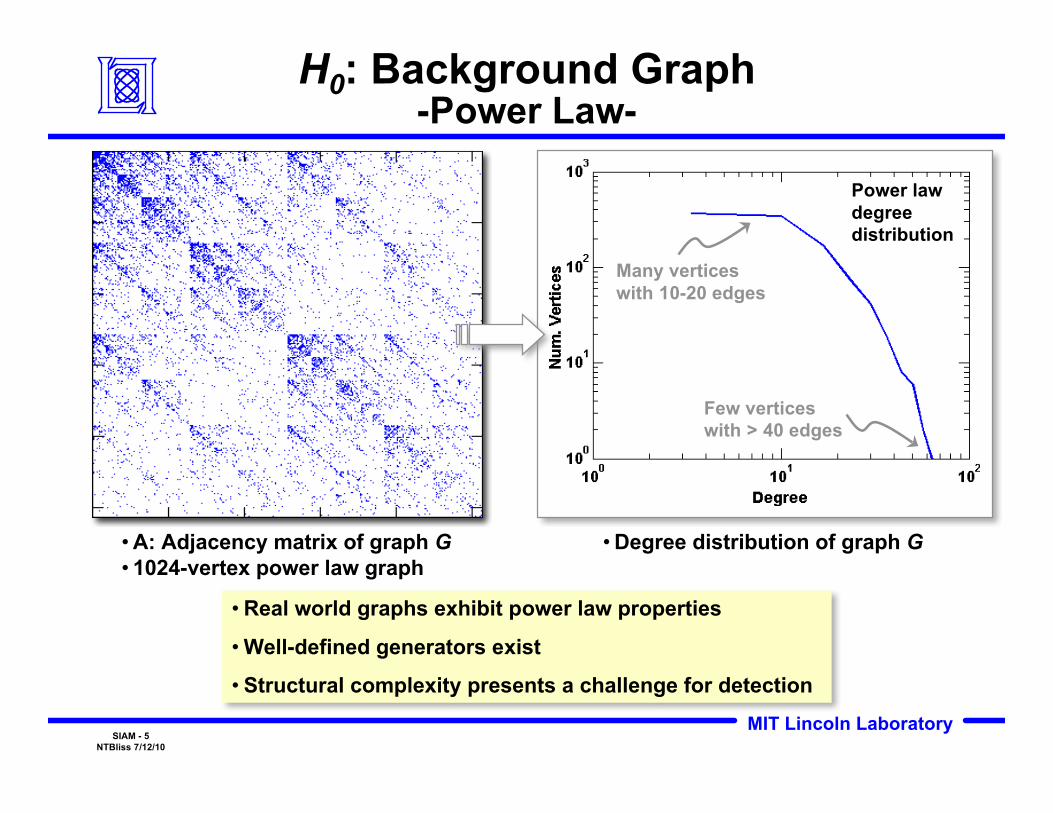
H0: Background Graph-Power Law-
• Real world graphs exhibit power law properties
•Well-defined generators exist
• Structural complexity presents a challenge for detection
•A: Adjacency matrix of graph G• 1024-vertex power law graph
•Degree distribution of graph G
Power lawdegreedistribution
Many verticeswith 10-20 edges
Few verticeswith > 40 edges
MIT Lincoln LaboratorySIAM - 6
NTBliss 7/12/10
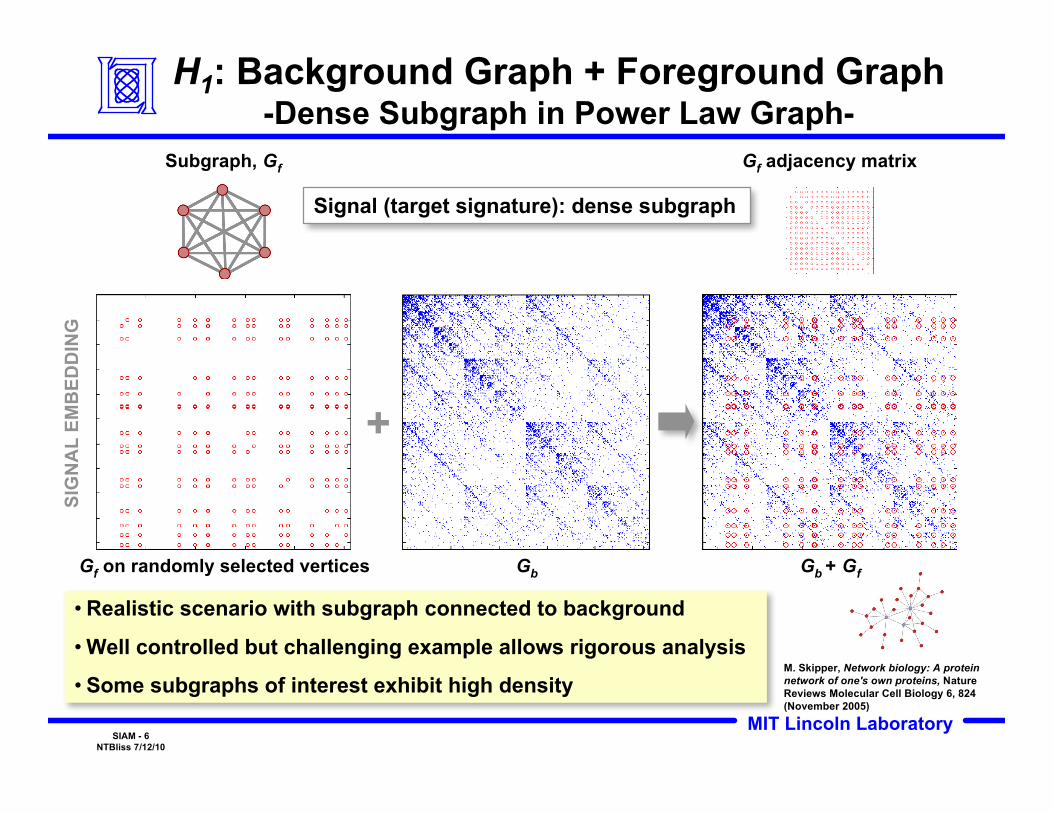
H1: Background Graph + Foreground Graph-Dense Subgraph in Power Law Graph-
Signal (target signature): dense subgraph
• Realistic scenario with subgraph connected to background
•Well controlled but challenging example allows rigorous analysis
• Some subgraphs of interest exhibit high density
Subgraph, Gf Gf adjacency matrix
+
Gf on randomly selected vertices Gb Gb + Gf
SIG
NA
L EM
BED
DIN
G
M. Skipper, Network biology: A proteinnetwork of one's own proteins, NatureReviews Molecular Cell Biology 6, 824(November 2005)
MIT Lincoln LaboratorySIAM - 7
NTBliss 7/12/10
Outline
• Introduction• Approach• Handling Large Graphs• Summary
MIT Lincoln LaboratorySIAM - 8
NTBliss 7/12/10
Graph-Based Residuals Analysis
• Least-squares residualsfrom a best-fit line•Analysis of variance(ANOVA) describes fit• “Explained” vs“unexplained” variance →signal/noise discrimination
Linear Regression
AN
ALYSIS O
FM
OD
ULA
RITY
• “Residuals” from a best-fitgraph model•Analysis of variance fromexpected topology•Unexplained variance ingraph residuals →subgraph detection
Graph “Regression”
MIT Lincoln LaboratorySIAM - 9
NTBliss 7/12/10
Overview
MODULARITYMATRIX
CONSTRUCTION
EIGENDECOMPOSITION
COMPONENTSELECTION DETECTION IDENTIFICATION
Input:
•A, adjacency matrixrepresentation of G
•No cue
Output:
• vs, set of vertices identifiedas belonging to subgraph Gf
Processing chain for subgraph detection analogous to a traditional signal processing chain
MIT Lincoln LaboratorySIAM - 10
NTBliss 7/12/10
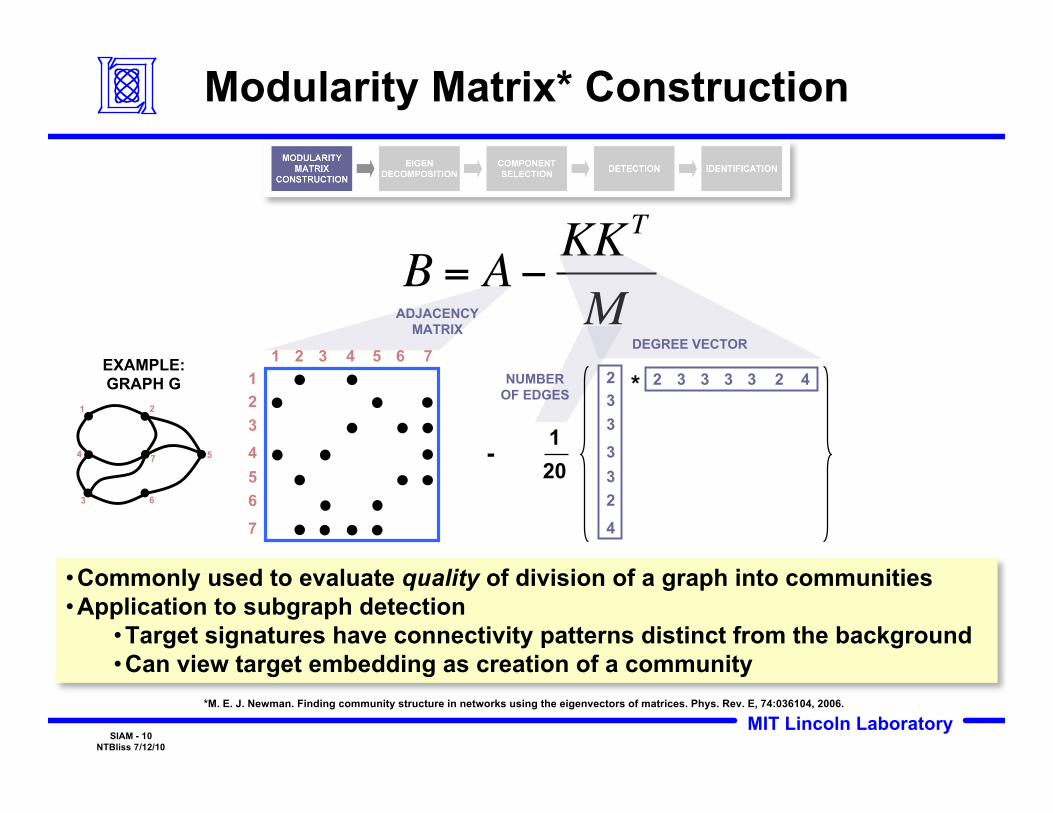
Modularity Matrix* Construction
•Commonly used to evaluate quality of division of a graph into communities•Application to subgraph detection
•Target signatures have connectivity patterns distinct from the background•Can view target embedding as creation of a community
*M. E. J. Newman. Finding community structure in networks using the eigenvectors of matrices. Phys. Rev. E, 74:036104, 2006.
!
B = A" KKT
MEXAMPLE:GRAPH G
1 2
3
4 7
6
5
201-
NUMBEROF EDGES
ADJACENCYMATRIX
123456
7
1 2 3 4 5 6 7
*
DEGREE VECTOR
233
332
4
2 3 3 3 3 2 4
MIT Lincoln LaboratorySIAM - 11
NTBliss 7/12/10
Eigen Decomposition
!
B =UDUT
Projection onto principal components of the modularity matrixyields good separation between background and foreground
Eigenvalues, sortedby magnitude
Correspondingeigenvectors
Principalcomponents
• Each point represents a vertex in G• Vertices in G: 1024• Vertices in Gf: 12• Uncued background/foreground separation
COLORING BASEDON KNOWN TRUTH
!
u1 | u2 | ... | uN"1 | uN[ ]
!
"1"2
..."N#1
"N
$
%
& & & & & &
'
(
) ) ) ) ) )
MIT Lincoln LaboratorySIAM - 12
NTBliss 7/12/10
Detection
MULTIPLE TRIALS, Gb ONLY
MULTIPLE TRIALS, Gb + Gf
H0
H1
H0 and H1 distributions are well separated
TEST STATISTIC:
SYMMETRY OF THEPROJECTION ONTO
SELECTEDCOMPONENTS H0 H1
Powerlaw Background, 12-Vertex Dense Subgraph
Test Statistic
MIT Lincoln LaboratorySIAM - 13
NTBliss 7/12/10
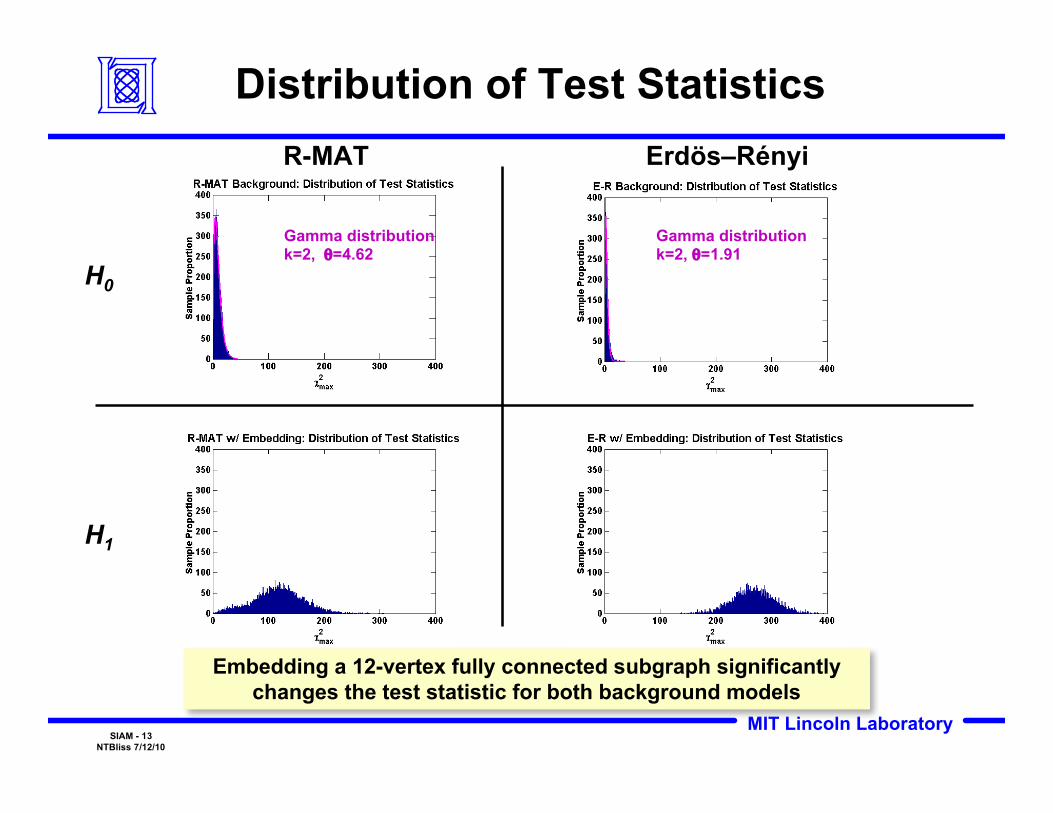
Distribution of Test Statistics
Embedding a 12-vertex fully connected subgraph significantlychanges the test statistic for both background models
Gamma distributionk=2, θ=4.62
Gamma distributionk=2, θ=1.91
H1
H0
R-MAT Erdös–Rényi
MIT Lincoln LaboratorySIAM - 14
NTBliss 7/12/10
Detection Performance
Pd: True Positive Rate
Pfa: False Positive Rate
!
TPR =TPP
positives identified
all positives
!
FPR =FPN
negatives identifiedas positives
all negatives
Detection:Positive: G contains Gf
Variable Detector Characteristic:Threshold
Reliable, uncued detection oftightly connected groups
SUBGRAPHDENSITY
Power Law Background, 12-Vertex Dense Subgraph
MIT Lincoln LaboratorySIAM - 15
NTBliss 7/12/10
Outline
• Introduction• Approach• Handling Large Graphs• Summary
MIT Lincoln LaboratorySIAM - 16
NTBliss 7/12/10
Eigendecomposition of the Modularity Matrix-Revisited-
MKKAUDUB
TT !==
Eigenvalues, sortedby magnitude
!
"1"2
..."N#1
"N
$
%
& & & & & &
'
(
) ) ) ) ) )
Correspondingeigenvectors
!
u1 | u2 | ... | uN"1 | uN[ ]
• B is dense and thuscannot be stored forlarge graphs
• Solution: computeeigenvectors withoutstoring B in memory
Approach: create a function that accepts a vector x and returns Bxwithout computing B; compute the eigenvectors of this function
MIT Lincoln LaboratorySIAM - 17
NTBliss 7/12/10
Computing Eigenvectors of Large Graphs
• Bx can be computed without computing B– Multiplication by B can be expressed as multiplication by a sparse
matrix (A), plus a vector dot product and scalar-vector product– This method is both space- and time-efficient
• The eigenvectors of f(x)= Ax – K(KTx)/M are the eigenvectors of B
Bx = Ax – K(KTx)/M
= –
dot product: O(|V|)scalar-vector product: O(|V|)
dense matrix-vectorproduct: O(|V|2)
sparse matrix-vectorproduct: O(|E|)
MIT Lincoln LaboratorySIAM - 18
NTBliss 7/12/10
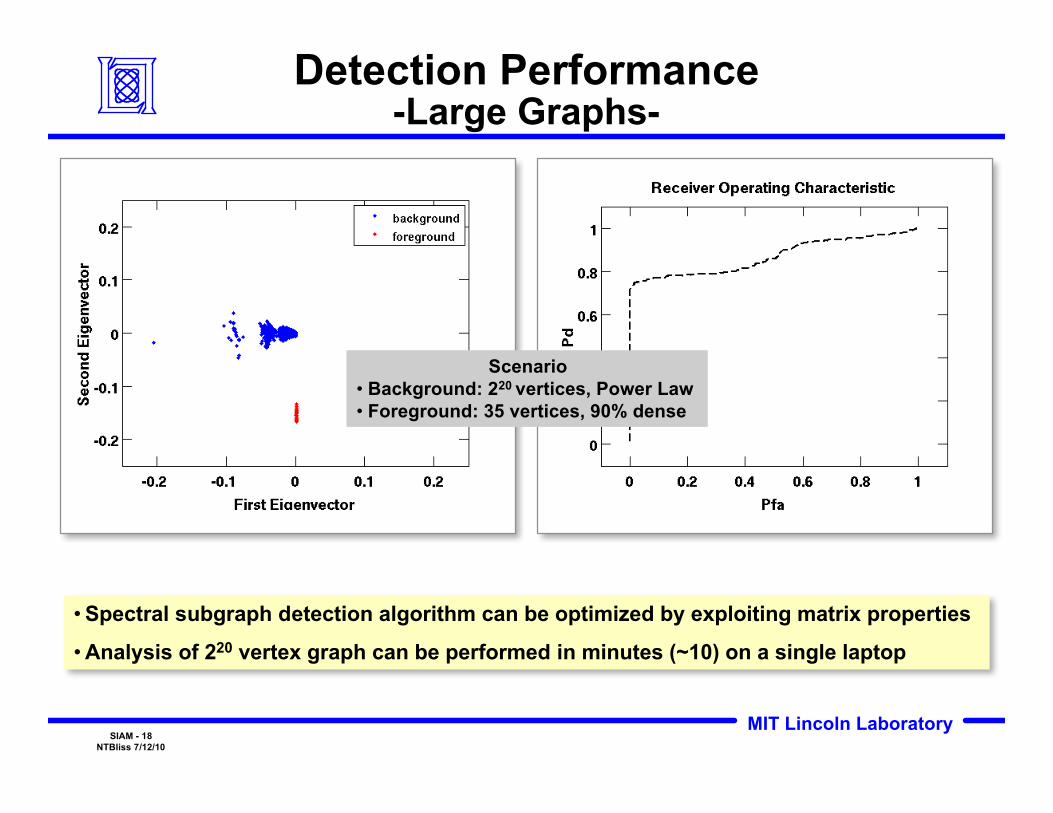
Detection Performance-Large Graphs-
•Spectral subgraph detection algorithm can be optimized by exploiting matrix properties
•Analysis of 220 vertex graph can be performed in minutes (~10) on a single laptop
Scenario• Background: 220 vertices, Power Law • Foreground: 35 vertices, 90% dense
MIT Lincoln LaboratorySIAM - 19
NTBliss 7/12/10
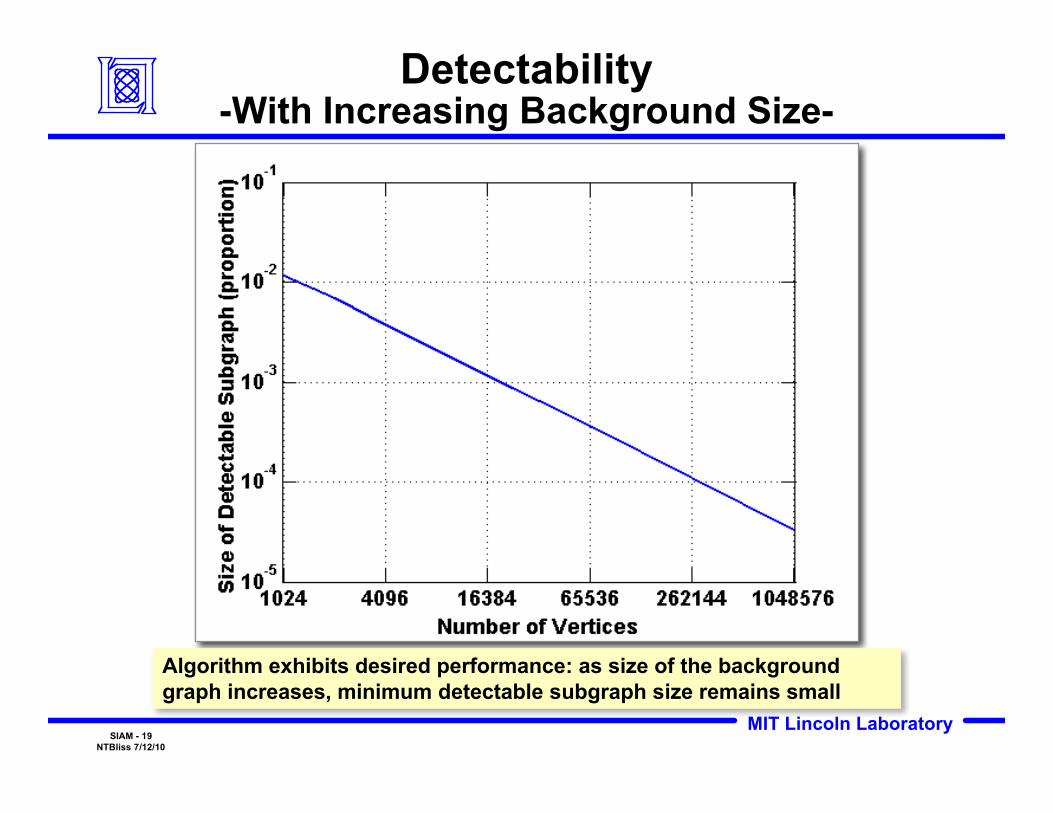
Detectability-With Increasing Background Size-
Algorithm exhibits desired performance: as size of the backgroundgraph increases, minimum detectable subgraph size remains small
MIT Lincoln LaboratorySIAM - 20
NTBliss 7/12/10
Epinions Data Analysis-Large Graph Example-
• Who-trusts-whom network from the Epinions consumer review site– 75,879 vertices, 405,740 edges
• Modularity matrix: too large to store in memory• Approach: compute eigenvectors of f(x)= Ax – K(KTx)/M
– 200 eigenvectors in 155 seconds using MATLAB
Eigenvector 36
Eige
nvec
tor 4
5
Eigenvector Index
36th and 45th
largest eigenvectorsdensely-connected
clusters
MIT Lincoln LaboratorySIAM - 21
NTBliss 7/12/10
Summary
• Subgraph detection is an important problem
• Detection framework for graphs enables algorithmsand metrics development
• Results on simulated and real datasets demonstratethe power of the approach– Demonstrated good detection performance– Extended approach to very large graphs
• Understanding background statistics (noise andclutter model) is of key importance
• Current research– Weak signature foregrounds– Subgraph formation detection


![Legend Global = Subgraph call Make Data Dir = Step Load Genomic Sequence & Annotation = Subgraph reference Proteome Analysis = Optional step [Taxon] Pk.](https://static.documents.pub/doc/80x56/56649f4d5503460f94c6d2a2/legend-global-subgraph-call-make-data-dir-step-load-genomic-sequence-.jpg)
