Jeffrey Hilton Miles Glenn Research Center, Cleveland, Ohio Spectral Separation of the Turbofan Engine Coherent Combustion Noise Component NASA/TM—2008-215157 May 2008 AIAA–2008–50 https://ntrs.nasa.gov/search.jsp?R=20080023303 2019-04-11T11:49:02+00:00Z
Transcript
Jeffrey Hilton MilesGlenn Research Center, Cleveland, Ohio
Spectral Separation of the Turbofan EngineCoherent Combustion Noise Component
Since its founding, NASA has been dedicated to the advancement of aeronautics and space science. The NASA Scientifi c and Technical Information (STI) program plays a key part in helping NASA maintain this important role.
The NASA STI Program operates under the auspices of the Agency Chief Information Offi cer. It collects, organizes, provides for archiving, and disseminates NASA’s STI. The NASA STI program provides access to the NASA Aeronautics and Space Database and its public interface, the NASA Technical Reports Server, thus providing one of the largest collections of aeronautical and space science STI in the world. Results are published in both non-NASA channels and by NASA in the NASA STI Report Series, which includes the following report types: • TECHNICAL PUBLICATION. Reports of
completed research or a major signifi cant phase of research that present the results of NASA programs and include extensive data or theoretical analysis. Includes compilations of signifi cant scientifi c and technical data and information deemed to be of continuing reference value. NASA counterpart of peer-reviewed formal professional papers but has less stringent limitations on manuscript length and extent of graphic presentations.
• TECHNICAL MEMORANDUM. Scientifi c
and technical fi ndings that are preliminary or of specialized interest, e.g., quick release reports, working papers, and bibliographies that contain minimal annotation. Does not contain extensive analysis.
• CONTRACTOR REPORT. Scientifi c and
technical fi ndings by NASA-sponsored contractors and grantees.
• CONFERENCE PUBLICATION. Collected
papers from scientifi c and technical conferences, symposia, seminars, or other meetings sponsored or cosponsored by NASA.
• SPECIAL PUBLICATION. Scientifi c,
technical, or historical information from NASA programs, projects, and missions, often concerned with subjects having substantial public interest.
• TECHNICAL TRANSLATION. English-
language translations of foreign scientifi c and technical material pertinent to NASA’s mission.
Specialized services also include creating custom thesauri, building customized databases, organizing and publishing research results.
For more information about the NASA STI program, see the following:
• Access the NASA STI program home page at http://www.sti.nasa.gov
• E-mail your question via the Internet to help@
sti.nasa.gov • Fax your question to the NASA STI Help Desk
at 301–621–0134 • Telephone the NASA STI Help Desk at 301–621–0390 • Write to:
NASA Center for AeroSpace Information (CASI) 7115 Standard Drive Hanover, MD 21076–1320
Jeffrey Hilton MilesGlenn Research Center, Cleveland, Ohio
Spectral Separation of the Turbofan EngineCoherent Combustion Noise Component
NASA/TM—2008-215157
May 2008
AIAA–2008–50
National Aeronautics andSpace Administration
Glenn Research CenterCleveland, Ohio 44135
Prepared for the46th AIAA Aerospace Sciences Meeting and Exhibitsponsored by the American Institute of Aeronautics and AstronauticsReno, Nevada, January 7–10, 2008
Acknowledgments
The acoustic time histories analyzed herein were made available by Honeywell Aerospace as part of the NASA/Honeywell Engine Validation of Noise and Emissions Reduction Technology (EVNERT) program under provisions of NASA Contract
NASA33–01136 from tests conducted by Honeywell Aerospace at the San Tan test site located southeast of Phoenix, Arizona. Special thanks go to Jeff Mendoza and Don Weir for helpful discussions, comments, site fi gures, and engine installation photos
of the test site.
Available from
NASA Center for Aerospace Information7115 Standard DriveHanover, MD 21076–1320
National Technical Information Service5285 Port Royal RoadSpringfi eld, VA 22161
Available electronically at http://gltrs.grc.nasa.gov
This work was sponsored by the Fundamental Aeronautics Program at the NASA Glenn Research Center.
Level of Review: This material has been technically reviewed by technical management.
The study of combustion noise from turbofan engines has become more important asother noise sources like the airframe, the fan and the jet are reduced. However, modernengines are based on new materials and a longer history of experience in turbofan enginemanufacturing, design, analysis, and optimization, which has led to engines with reducedcoherent combustor noise. In addition, the jet mixing noise from near the end of thepotential core masks the low-frequency core noise. This makes it necessary to update thecoherent output power spectrum method so that the coherent combustion noise spectrumcan be determined in spite of its low level. The core noise components of a dual spoolturbofan engine (Honeywell TECH977) for engine power settings of 48, 54, and 60 percentwere separated by the use of a coherence function. A method has been developed to helpidentify combustion noise coherence using an aligned and unaligned coherence technique,which enables the validation of low levels of coherence as being due to core noise byidentifying the coherence noise floor. A statistical procedure is also used to establishthis threshold level. The use of both methods provides a high confidence level for thecoherence function values calculated. A source location technique based on adjusting thetime delay between the combustor pressure sensor signal and the far-field microphone signalto maximize the coherence and remove as much variation of the phase angle with frequencyas possible was used. These techniques make it possible to quantify the weak coherent corenoise in the aft quadrant instead of dismissing it as negligible.
While adjusting the time delay to maximize the coherence and minimize the cross-spectrum phase angle variation with frequency, the discovery was made that for the 130o
microphone a 90.027 ms time shift worked best for the frequency band from 0 to 200 Hzwhile a 86.975 ms time shift worked best for the frequency band from 200 to 400 Hz.Since the 0 to 200 Hz band signal took more time to travel the same distance, it is slowerthan the 200 to 400 Hz band signal. This suggests the 0 to 200 Hz coherent cross-spectraldensity band signal is partly due to “indirect” combustion noise attributed to “hot spots”interacting with the turbine. The net travel time of the indirect combustion noise signalfrom the combustor to the far field is increased since the travel velocity of the hot spotsto the turbine and in the turbine is the flow velocity, which is some small fraction of thespeed of sound. The indirect combustion noise signal does not travel with the speed of anacoustic wave until it interacts with the turbine. The signal in the 200 to 400 Hz frequencyband is attributed mostly to “direct” combustion noise, which has the travel time of theacoustic wave in the combustor and turbine. Beyond the turbine both direct and indirectpressure signals travel at the speed of an acoustic wave to the far field. Consequently, thissource separation method identifies in the turbofan engine direct combustion noise andindirect combustion noise due to hot spots convecting through the turbine.
Nomenclature
Be resolution bandwidth, Hz, Be = 1/Td = r/NP = 16 HzD propagation time delay or Lag, secf frequency, Hz
NASA/TM—2008-215157 1
Spectral Separation of the Turbofan Engine Coherent Combustion Noise Component
Jeffrey Hilton Miles
National Aeronautics and Space Administration Cleveland, Ohio 44135
fc upper frequency limit, fc = 1/2∆t = r/2, Hz (32 768 Hz)Gxx(f) auto power spectral density function defined for non-negative frequencies only (one-sided)Gxy(f) cross power spectral density function defined for non-negative frequencies only (one-sided)h(τ) weighting functionH(f) transfer function frequency responseh(τ) weighting function or unit impulse response functionLy number of frequencies, fc/∆f = N/2 (2048)N segment length, number of data points per segment (4096)Ns number of disjoint (independent) data segments/blocks, Ns = BeTtotal = 1120P P-percent confidence intervalr sample rate, samples/sec (65 536)sc(t) combustor input signalsF (t) far-field output signalTtotal total record length, sec (≈ 70 sec)
Td(i) record length of segment i, N/r, 0.0625 secWsF sF
(f) coherent output power spectral function
Subscripts
i running segment indexK(t) combustor pressure transducer sensor signalM(t) far-field microphone signaln(t) signal noisex(t) signal xy(t) signal y
The National Aeronautics and Space Administration (NASA) Aeronautics program is involved increating noise reduction technology, which is an improvement over the 1997 state-of-the-art noise reductiontechnology. NASA is completing engine test programs to identify dominant noise sources. Core noise is ofinterest since it might become a significant contributor to the overall turbofan engine noise during takeoffor approach when the fan and jet noise are reduced because of forward velocity effects. In addition, futureadvances in fan and jet noise reduction technologies may cause core noise to be a more significant contributorto the overall turbofan engine noise.
The data analyzed is from a Honeywell TECH977 dual spool, turbofan engine. The engine is similarto the TECH7000, which is a development version of the Honeywell HTF7000 engine that currently powersthe Challenger 300 aircraft. The test was conducted as part of the NASA/Honeywell Engine Validationof Noise and Emissions Reduction Technology (EVNERT) program. The particular set of test data wascollected to test source separation procedures as part of a team effort with the Georgia Tech ResearchInstitute. Consequently, in addition to eight far-field microphones signals from one pressure transducer inthe combustor, two pressure transducers in the Low Pressure Turbine Exit, and two pressure transducers inthe bypass duct were available.
The results presented are based on coherence function calculations using the far-field microphoneand the combustor pressure transducer. Similar coherence function analysis was used starting 30 years agoto evaluate core noise from several engines. The following examples come to mind: an AVCO Lycoming YF–102 by Karchmer and Reshotko (1976),1 Karchmer (1977),2 Reshotko et al. (1977),3 and Krejsa (1987);4
an APU by Shivashankara (1978);5 the General Electric CF6–50 by Doyle and Moore (1980);6 the Pratt& Whitney JT15D by Reshotko and Karchmer (1980);7 and the Pratt & Whitney JT9D by Shivashankara(1983).8 In the same time period, the coherence function between a combustor pressure sensor and a far-field
NASA/TM—2008-215157 2
microphone was measured for a gas turbine combustor using a single fuel spray nozzle assembly taken froma Boeing 502–7D gas turbine unit by Strahle et al. (1977)9 and Muthukrishnan et al. (1978)10 in studies ofturbofan engine core noise.
Recently similar coherence function analysis techniques were used to evaluate core noise from aPratt & Whitney PW4098 by Miles (2006).11 The data evaluated was acquired from a test conducted aspart of the NASA Engine Validation of Noise Reduction Concepts (EVNRC) Program in 2001. In the timeinterval between these two sets of tests, that is, from 1980 to 2000, turbofan engines have changed withnewer engines such as the Pratt & Whitney PW4098 and the Honeywell TECH977 being based on newmaterials and a longer history of experience in turbofan manufacturing, design, analysis, and optimization.In evaluating the PW4098 core noise data, it was found that one consequence of these design changes is thatthe coherent part of the core noise signal has decreased.11 In order to evaluate small coherence functionvalues, a new diagnostic tool using aligned and unaligned coherence functions was developed. This toolwhich is explained by Miles11 also needs to be applied to signals acquired in this Honeywell TECH977 testprogram since the core noise coherence values are small.
Core noise of a Rolls-Royce BR700 aero-engine has also been studied with the aid of a phased lineararray of microphones by Siller et al. (2001)12 and a combustor pressure sensor. Coherence between thecombustor pressure sensor and a phased-array signal was obtained and the coherent array output powerspectrum was measured.
One source of turbofan engine combustion noise is attributed to an unsteady combustion process,which produces unsteady pressures that propagate through the turbine to the far field. This is known as“direct” combustion noise mechanism. The relation between heat release and pressure waves was studied byChu (1955).13 Strahle (1971)14 developed a framework that explained past experimental studies of directcombustion generated noise from flames using an approach similar to the one Lighthill (1952, 1954)15, 16
used in his studies of aerodynamic noise. Further developments in scaling laws were derived by Strahle(1972, 1975)17, 18 involving the first Eulerian time derivative of the chemical reaction rate integrated overthe reacting volume. A review of current theories of scaling laws is given by Strahle (1975).19 The studyof combustion generated noise from turbulent flames is a continuing area of research. For example, thespectral characteristics of premixed flame noise has been studied by Rajaram (2003, 2006)20, 21 and largeeddy simulation computations to predict combustion-generated noise in nonpremixed turbulent jet flameshave been conducted by Ihme et al. (2006).22 Thermoacoustic sources and instabilities are discussed byDowling (1992).23
Another source of turbofan engine combustion noise is known as the “indirect” mechanism in whichthe noise is generated in the turbine by the interaction of entropy fluctuations (“hot spots”) from thecombustion chamber. This indirect source was studied by Pickett (1975),24 Cumpsty and Marble (1977),25, 26
Cumpsty (1979),27 and Gliebe (2000).28 The indirect mechanism also functions when an entropy fluctuationinteracts with an area change as shown by Cuadra (1967)29 or a nonuniform flow as shown by Goldstein(1979)30 and when an entropy or density nonuniformity is convected through a nozzle as shown by Williamsand Howe (1970)31 and Marble and Candel (1977).32
Strahle et al. (1977)9 investigate direct combustion noise from an isolated combustor and discussthe problem of the mixture of “pseudosound” and sound in a combustor. The coherent combustion noiseis discussed and the presence of incoherent noise is noted. Coherence between pressure measurements inthe can combustor and far-field microphones are discussed and analyzed using a combustion acoustic model.Muthukrishnan et al. (1978)33 discuss tests using a nozzle attached to the combustor can. The importance ofdirect noise and indirect noise (noise from hot spots passing through area changes and gradients) is discussed.Without the nozzle when no pressure drop occurred downstream of the combustor, the far-field noise wasdue to a direct combustion noise mechanism. When the flow was accelerated by the nozzle the indirectcombustion noise mechanism appeared dominant.
Miles et al. (1983)34 measured the cross spectra between temperature and pressure in a constantarea duct downstream of a combustor and showed that the entropy fluctuations (hot spots) moved withthe flow speed. Schemel et al. (2004)35 studied experimentally and numerically entropy noise generated byhot spots (from a combustor) passing through a nozzle. Richter et al. (2005)36 studied the application ofcomputational aeroacoustic methods to indirect combustion noise generated by hot spots passing througha nozzle. Bake et al. (2005)37 studied experimentally and numerically indirect combustion noise generatedby hot spots (from a combustor) passing through a nozzle and verified that the entropy fluctuations (hotspots) moved with the flow speed. Bake et al. (2007)38 studied experimentally indirect combustion noise
NASA/TM—2008-215157 3
generated by hot spots (created by electrical heating) passing through a nozzle and verified that the entropyfluctuations (hot spots) moved with the flow speed.
The net travel time of the indirect combustion noise signal from the combustor to the far field isincreased since the travel velocity of the hot spots to the turbine and in the turbine is the flow velocity. Thisflow velocity is some small fraction of the speed of sound. Miles et al. (1983)34 has shown the pressure andentropy should be in phase in the combustor. Consequently, one might expect that the pressure signal froman indirect combustion noise source would be delayed relative to a pressure signal from a direct combustionnoise source since an indirect combustion noise signal does not travel with the speed of an acoustic waveuntil it interacts with the turbine. Miles shows herein that the cross-spectra is a tool that provides a way tomeasure this time delay. Using this tool direct and indirect coherent combustion noise can be separated.
II. Coherent Output Power Spectrum
In the past, methods have been developed using spectrum analysis techniques to characterize acous-tic signals from different sources mixed with noise. Bendat and Piersol (1966, 1971, 1980)39–41 discuss thesemethods. Among the methods discussed is one using coherent output power spectra for noise source identi-fication. The application of this technique that is of interest is the use of coherent output power spectra toseparate and identify correlated combustion noise in far-field measurements of turbofan engine noise. Karch-mer (1977)2 and Karchmer et al. (1977)42 use the coherence function calculated from internal microphonemeasurements of fluctuating pressures in the combustor and far-field acoustic pressures to determine thecorrelated combustion noise of a YF102 turbofan engine at far-field locations by calculating the coherentoutput power spectrum. A typical results showed the coherence measured between the combustor pressureand the 120o far-field acoustic pressure had a roughly Gaussian-shaped distribution in the range 0 to 200 Hzwith a peak near 125 Hz and a maximum value at 30 percent fan speed of 0.38 and at 43 percent fan speeda maximum value of 0.5 (Ref. 2, Figs. 39 and 48). The corresponding combustion coherence output powerspectrum for the 43 percent fan speed case has a peak near 125 Hertz and a generally domelike shape. Thepeak is about 20 log(0.5) = −6.02 dB below the peak of the far-field spectrum at 120 Hz. The dome edgesare 20 dB down at 40 Hz and 200 Hz.
The basic formulation for the coherent output power spectrum is presented by Bendat and Piersol(1980).41 We assume that the far-field output signal, sF , is the output of a constant parameter linearsystem with weighting function h(τ) and frequency response H(f). The output of the system is given bythe convolution integral of the combustor input signal, sc(t)
sF (t) =
∫
∞
0
h(τ)sc(t − τ)dτ (1)
Then, the far-field combustion noise spectrum, GsF sF(f), and the combustion noise cross spectrum between
the far-field signal and the combustor pressure sensor signal, GsF sc(f) are related to the combustor pressure
sensor signal as follows:
GsF sF(f) = | H(f) |2 Gscsc
(f) (2)
GsF sc(f) = H(f)Gscsc
(f) (3)
Here the cross-power spectrum between the combustor pressure sensor signal, x(t), and the far-field micro-phone signal, y(t), is Gxy(f) and the corresponding combustor pressure sensor power spectra and far-field
spectra are Gxx(f) and Gyy(f).
Gxx(f) = Gscsc(f) + Gn1n1
(f) (4)
Gyy(f) = GsF sF(f) + Gn2n2
(f) (5)
These are obtained by averaging many (approx. 2000) successive directly calculated power spectral densitiesusing a 70 second total observation time, a sampling rate of 216 = 65 536 samples per second; and a 50percent overlap in the spectrum calculations. In practice, only estimates, Gxy(f) of Gxy(f), Gxx(f) of
Gxx(f), and Gyy(f) of Gyy(f) can be obtained due to the finite observation interval and theˆnotation willbe dropped.
NASA/TM—2008-215157 4
The combustion noise reaching a microphone will be estimated using the magnitude squared coher-ence function, γ2
xy(f), where
γ2xy(f) =
| Gxy(f) |2Gxx(f)Gyy(f)
(6)
Then
| Gxy(f) |2=| GsF sc(f) |2=| H(f) |2 G2
scsc(f) = GsF sF
(f)Gscsc(f) (7)
and the coherent output power spectrum, WsF sF(f), is
WsF sF(f) = γ2
xy(f)Gyy(f) (8)
= GsF sF(f)
Gscsc(f)
Gscsc(f) + Gn1n1
(f)
where we assume the extraneous noise terms are uncorrelated with each other and with the signals.
Gscn1(f) = GsF n2
(f) = Gn1n2(f) = 0 (9)
The quantity WsF sF(f) can also be called the coherent combustion noise spectrum. Thus, the estimated
coherent output power spectrum, WsF sF(f) = γ2
xy(f)Gyy(f), will determine GsF sF(f) when the input noise
is zero, Gn1n1(f) = 0, regardless of the output noise Gn2n2
(f). In the frequency range of interest, we mayassume Gn1n1
(f) = 0 or just consider that WsF sF(f) is a measure of the coherent combustion noise.
III. Sensors, Arena Layout, and Signal Processing
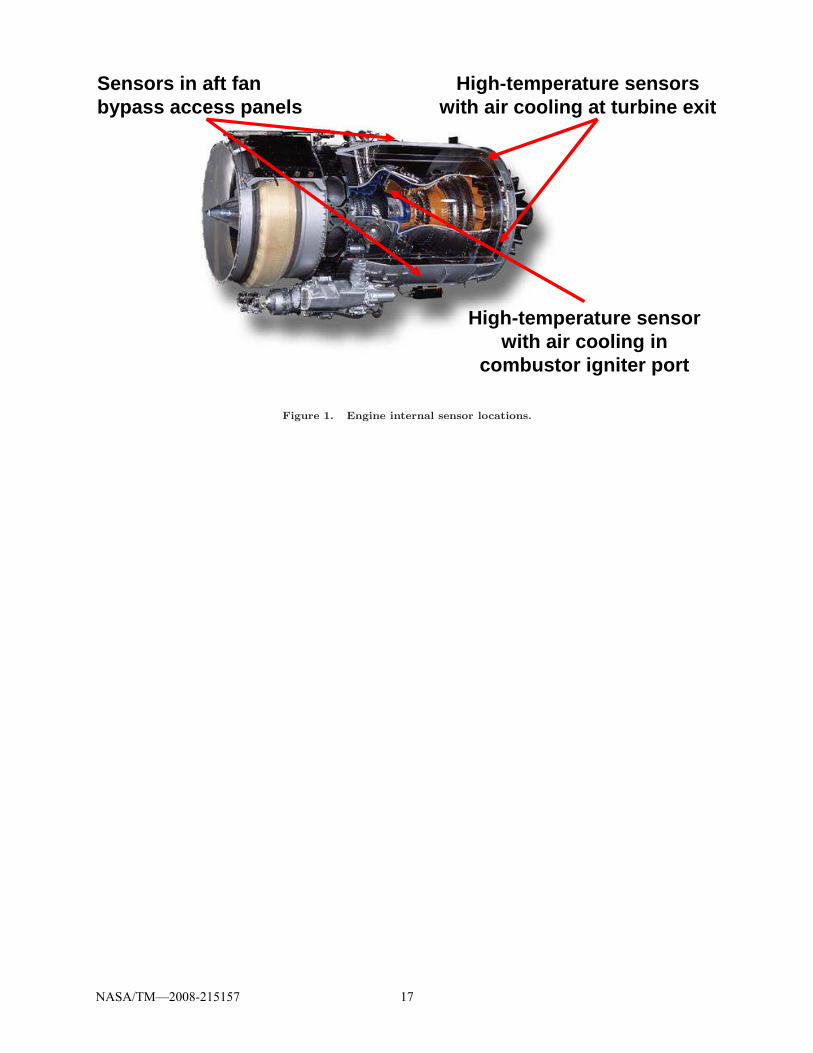
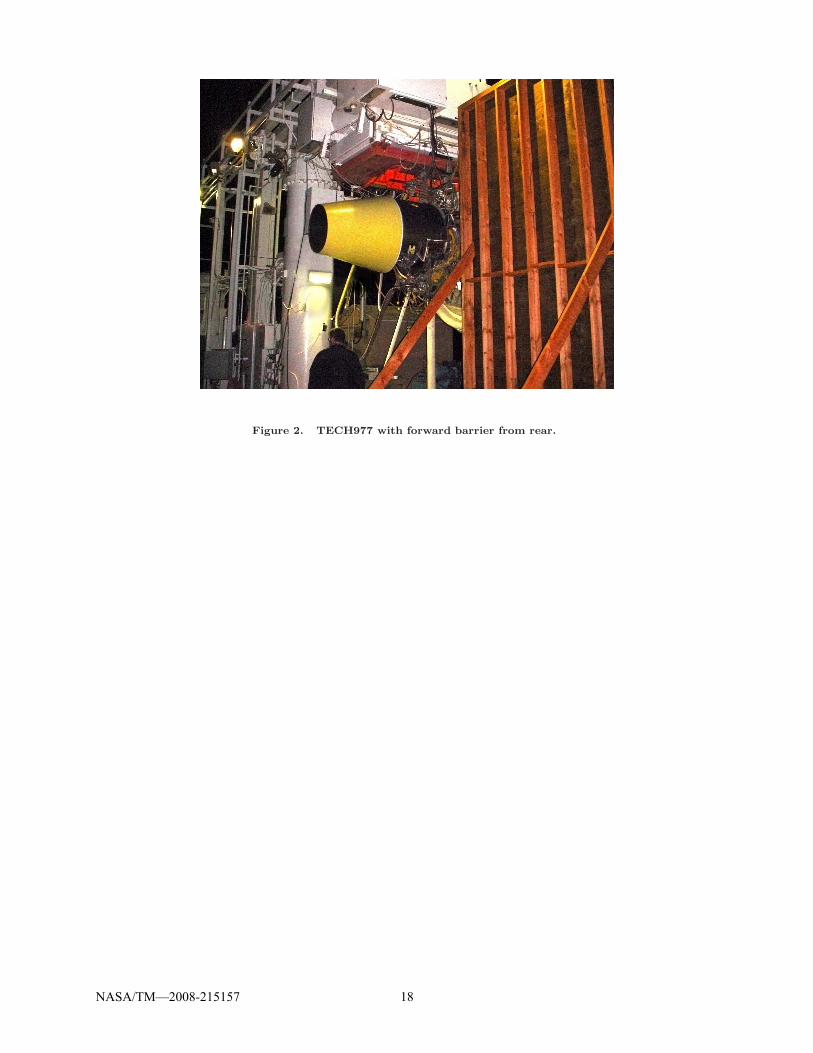
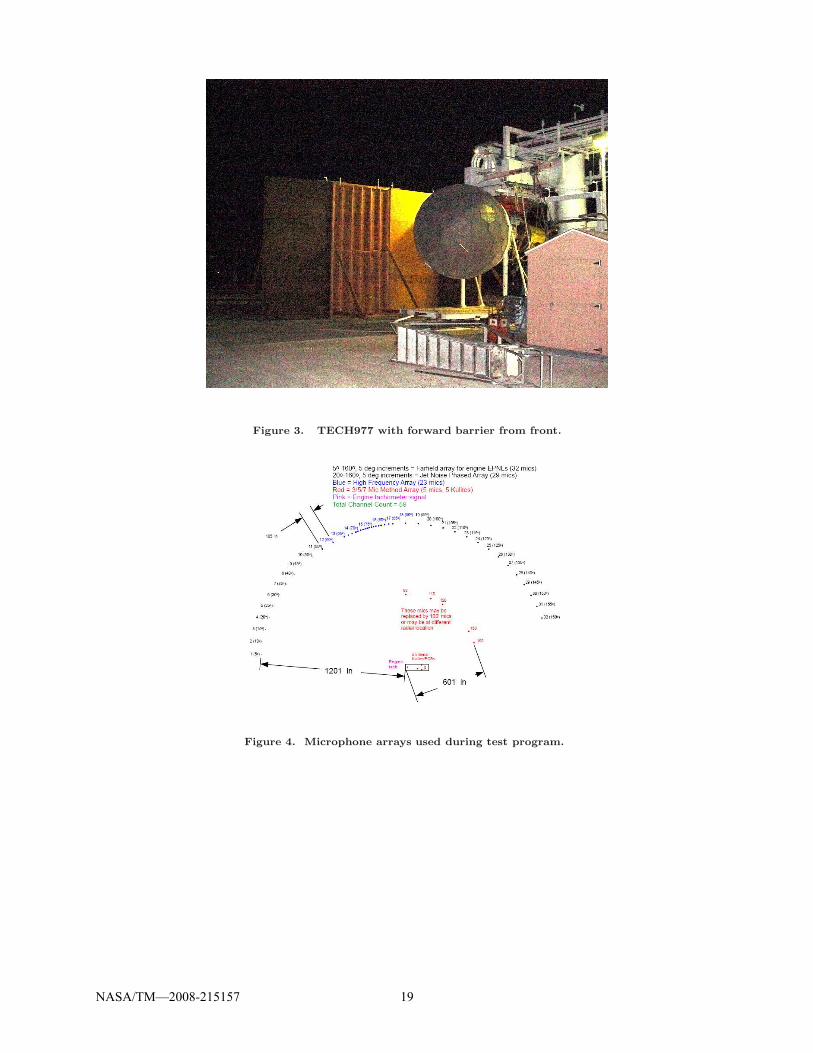
Internal engine sensor locations are shown in Fig. 1. The test was conducted at the San Tan acousticcell 966 on March 23, 2006, with a “L-shaped” barrier minimizing inlet noise radiation to the aft microphones.As shown in Figs. 2 and 3 the short leg of the barrier is perpendicular to the nozzle, with this piece startinga few feet upstream of the nozzle exit. In addition, this piece does not reach the nozzle but stops a few feetaway from the nozzle. The long leg of the barrier sweeps along parallel to the engine ending forward of theInflow Control Device (ICD).
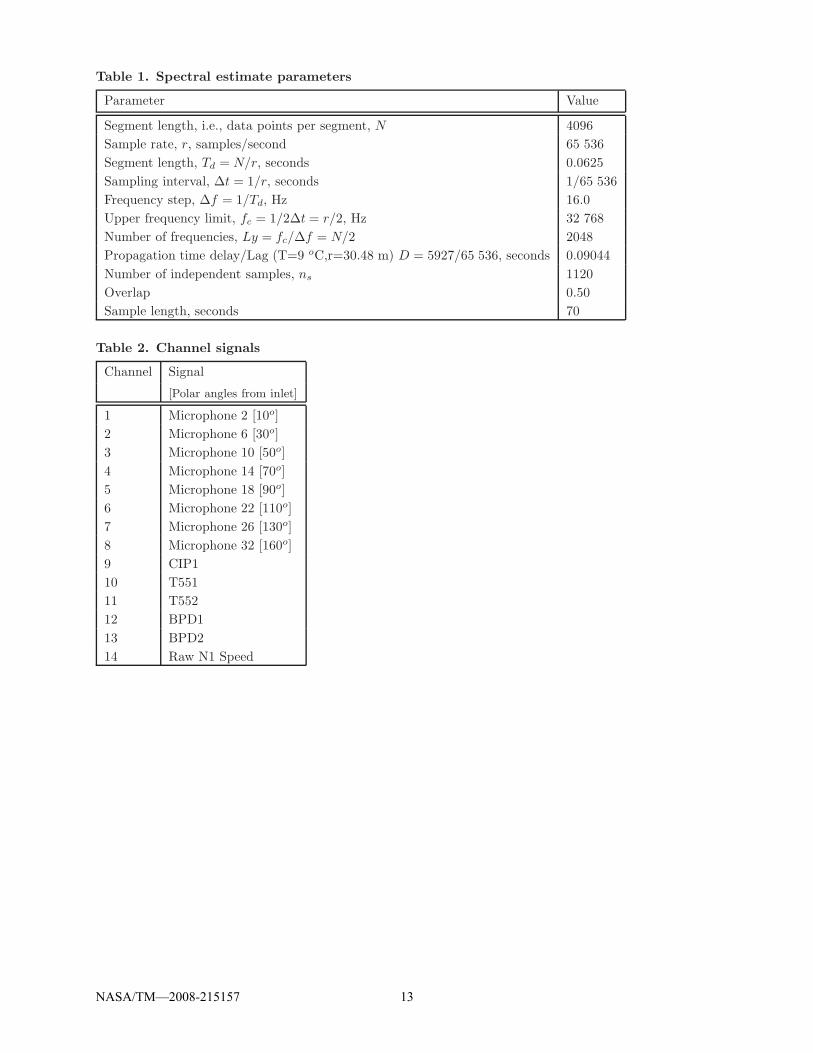
The ICD that prevents turbulent stretched vortex structures from interacting with the fan is shownin Fig. 3. The engine condition power settings discussed are 48, 54, and 60 percent of the Max Power setting.Microphone locations used in the test program are shown in Fig. 4. For this test, external microphones wereat 10o, 30o, 50o, 70o, 90o, 110o, 130o, and 160o measured from the inlet. The signal estimation parametersused are shown in Table 1.
The test was conducted when the air temperature was about 9 oC (48 oF) and the microphone radiuswas 30.48 m. The engine is at a height of 3.048 m. Consequently, with a speed of sound of 337 m/sec, thetravel time for a signal to leave the combustor and reach a microphone is about 90.44 ms (5927 samples).This will be called the measured time delay herein. Using the analysis parameters shown in Table 1, thesegment length, Td = 1/16 is 62.5 ms (4096 samples). Consequently, if one calculates the coherence of thecombustor pressure transducer signal, K(t) and a microphone signal M(t) using the measured time historiesas measured one finds the coherence is that of random noise since the two signals are totally independentexcept at frequencies where tones are present as discussed by Miles (2006).11 This is due to the fact that theorigin of the two signals does not overlap in the signal processing interval specified by the segment length,Td. The noise coherence confidence interval value is approximately given by
γ2nn = γ2
KM (f, D > Td) = 1 − (1 − P )1/(Ns−1) (10)
where this formula determines a P-percent confidence interval. Thus the 95-percent confidence interval noisefloor is γ2
nn = 0.00267 (Ns = 1120).To align the two signals, the far-field microphone signal can be adjusted by moving it backward using
a time delay of D = 0.09044∗ 65 536 = 5927 samples based on the signal propagation time. Using computercode a new aligned array of time history values can be created for each microphone signal. This new arraywill then be more in phase with the combustor pressure transducer signal. In Fortran the computer codestatements that create the new time history is
NASA/TM—2008-215157 5
do j=1,Total_number_of_samples
M_aligned(j)=M_unaligned(j+5927)
enddo
This code slides the points beyond point 5927 backward to align with the K(t) sequence of points therebyremoving the time delay.
This approach does not take into account a multiplicity of reasons why this travel time delay cal-culated from the speed of sound and microphone radius might not be best. For example, the center of the100 foot microphone radius might not correspond to the origin of the sound. In addition, no wind gradientor temperature profiles are used though they might be important in some cases. A discussion on how onecan use spherical decay to account for engine noise component source locations is given by Salikluddin et al.(2006).43
A slightly more sophisticated procedure to obtain the alignment time D was used herein. The correcttime delay makes the cross-spectrum phase angle change with frequency minimal in the range of maximumcoherence. Consequently, cross-spectrum phase angles were calculated using correction time delay D valuesin the range of 1000 to 9000 in 100 count steps. From these cross-spectrum phase angle plots the best valueof D was selected based on the criterion that the variation of the phase angle with frequency will have agradient of zero when the time histories are aligned. Again, this value is also the value of D that maximizesthe coherence in the frequency range of interest. In some cases when using this procedure, an increase incoherence of 15 to 27 percent was noted over the use of a universal D value based on travel time calculatedusing the measured microphone radius and a speed of sound based on the air temperature.
Table 2 shows the signals measured. The combustor pressure transducer signal is on Channel 9(CIP1). Channels 10 and 11 measure pressures downstream of the turbine (T551 and T552). Channels 12and 13 measure bypass duct pressures (BPD1 and BPD2).
IV. Phase Angle Standard Deviation
The coherence function is especially important since the cross-spectrum phase angle, θxy(f), stan-dard deviation can be related to the coherence function. In Bendat (1980)41 and in Piersol (1981)44 therandom error in the phase estimates due to statistical sampling is given in terms of the standard deviationof the estimated phase angle, θxy(f), by
σ[
θxy(f)]
≈ sin−1
{
[
1 − γ2xy(f)
]1/2
|γxy|√
2Ns
}
(11)
where σ[
θxy(f)]
is measured in radians and as used herein Ns is selected to be the number of segments orblocks used in the spectral calculations. For the special case where the term in curly brackets is small Eq.11 becomes
σ[
θ(f)]
≈[
1 − γ2xy(f)
]1/2
|γxy|√
2Ns
(12)
where for the unknown coherence γ2xy(f) the estimated coherence γ2
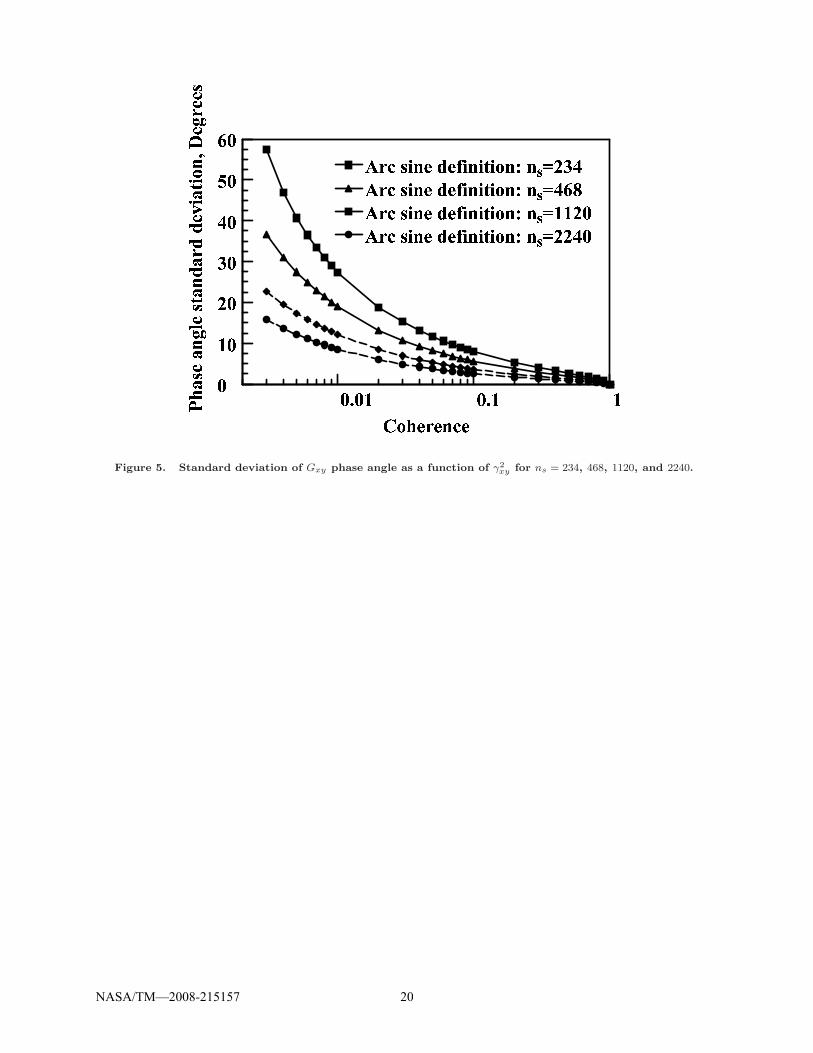
xy(f) is used. A plot of the standarddeviation of the phase angle in degrees versus coherence is shown in Fig. 5 for Ns = 234, 468, 1120, and2240. When the coherence is 0.003, Fig. 5 shows the pressure sensor cross-spectrum phase angle standarddeviation should be between 15o and 25o. Only phase angles with coherence values greater than 0.003 willbe shown in the cross-spectrum phase angle plots.
V. Results
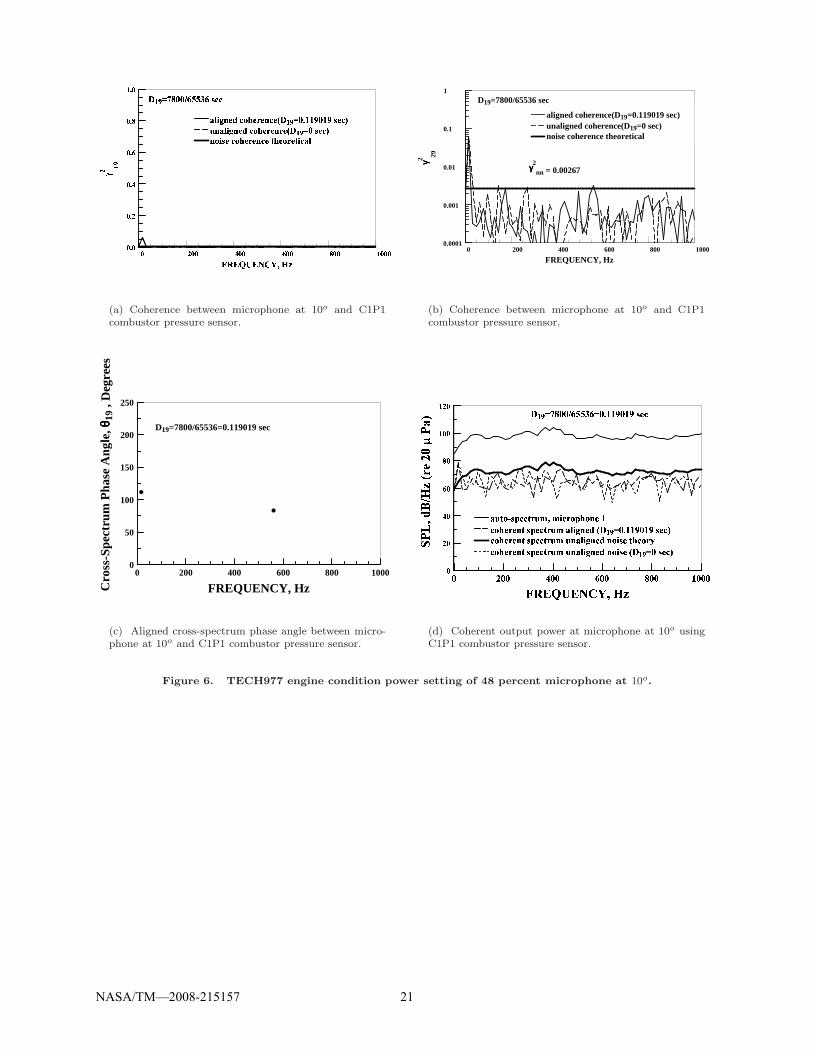
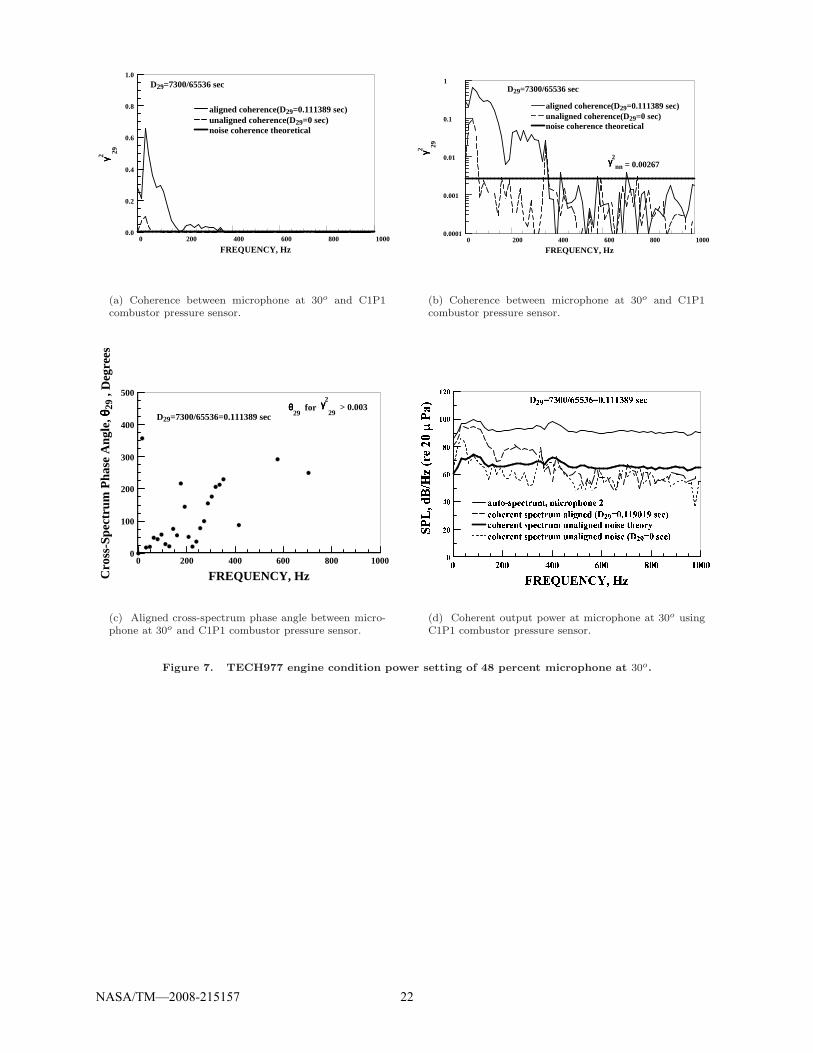
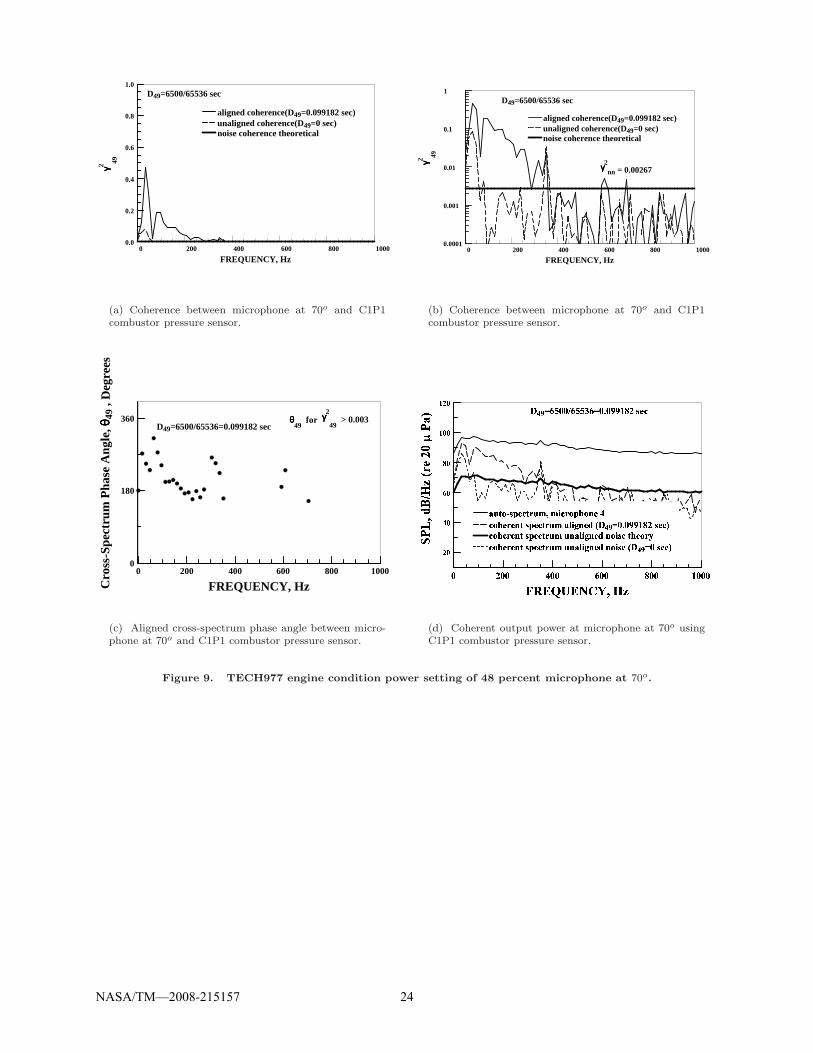
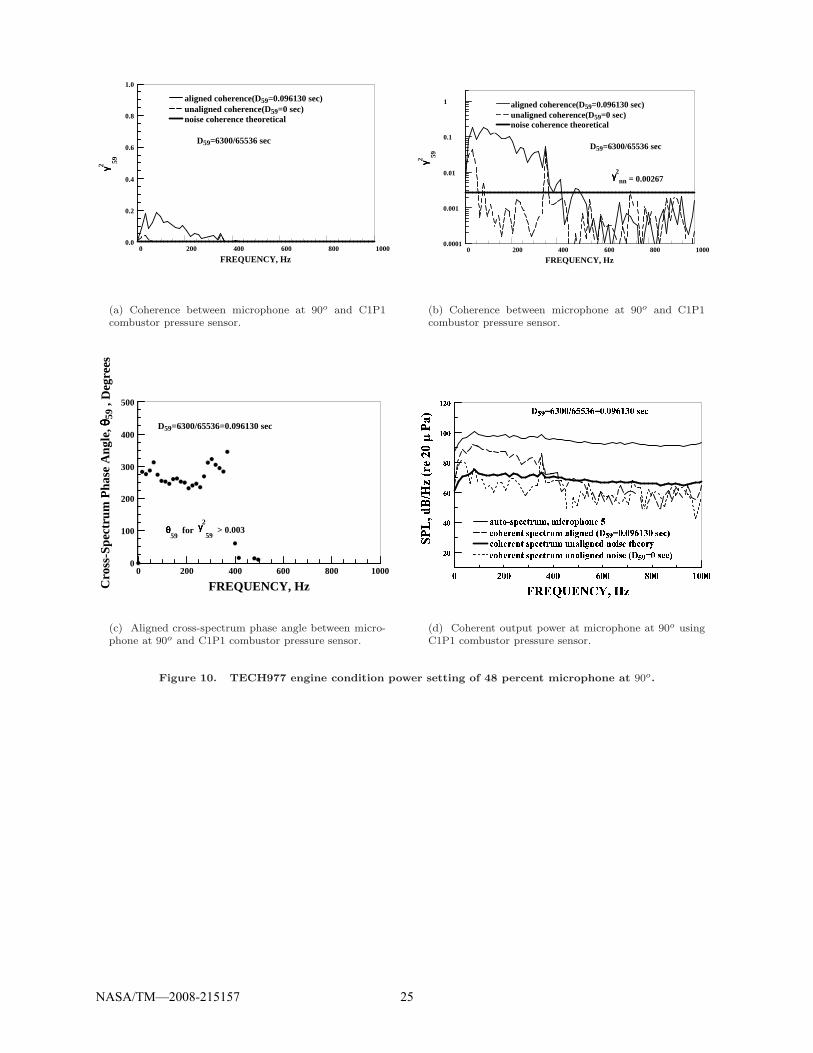
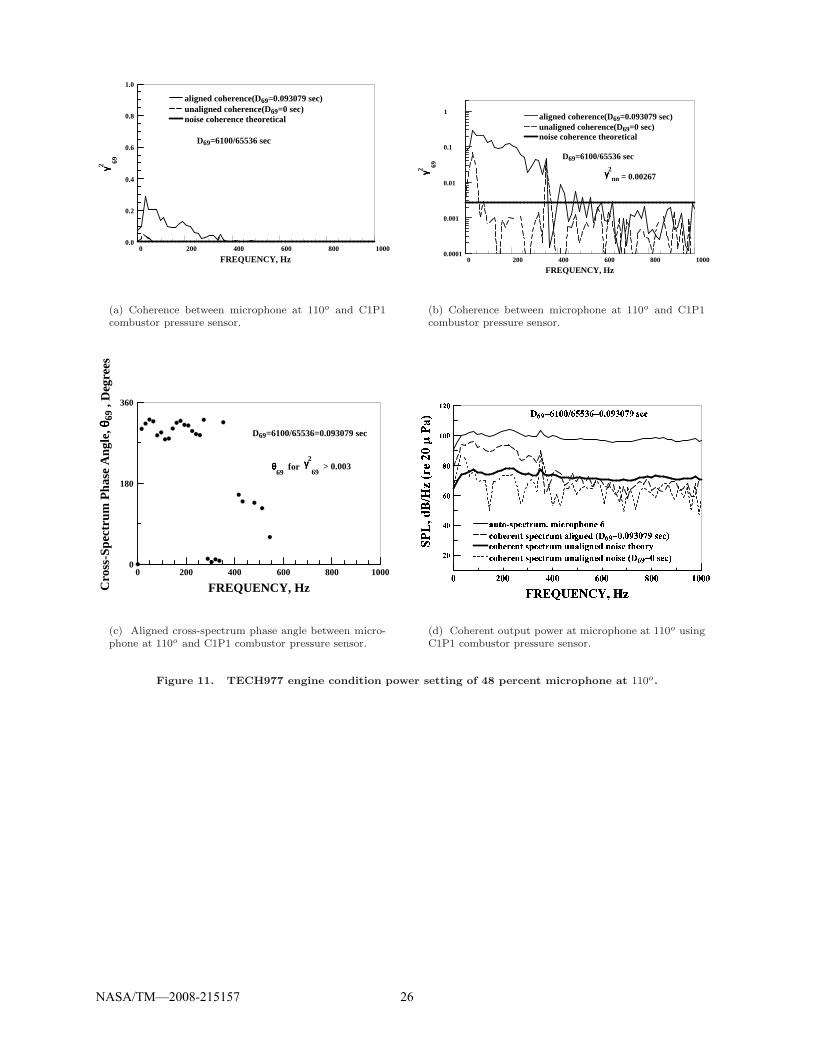
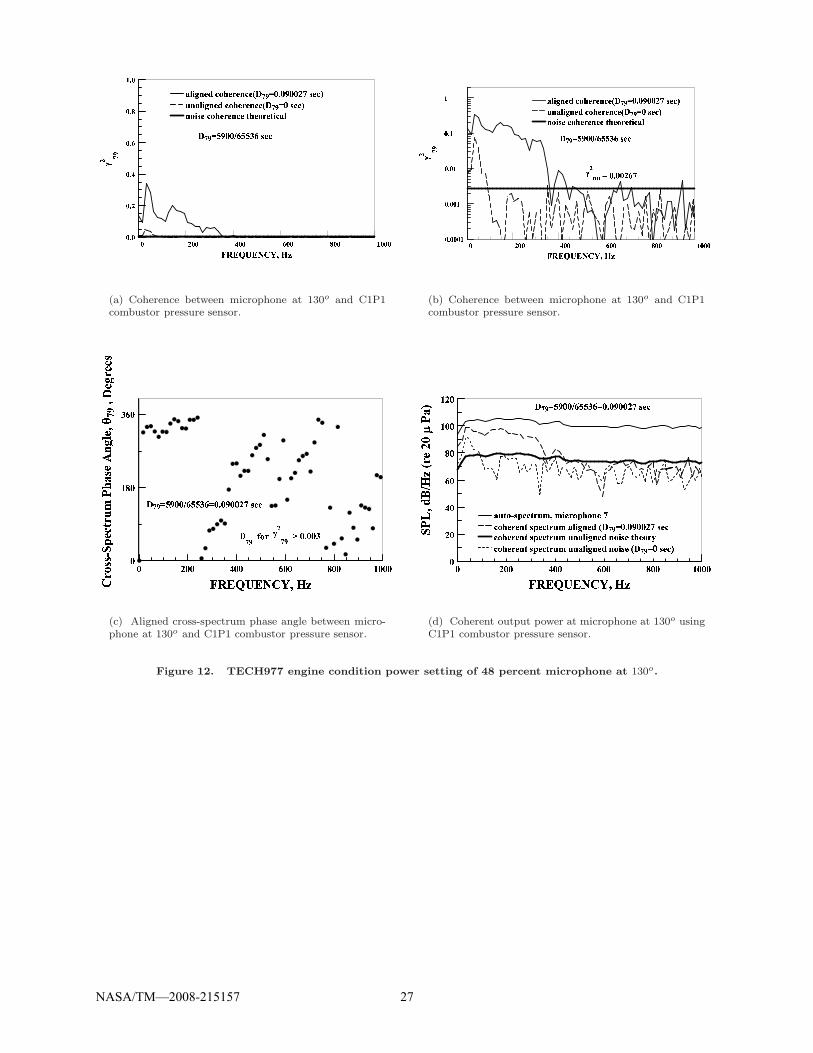
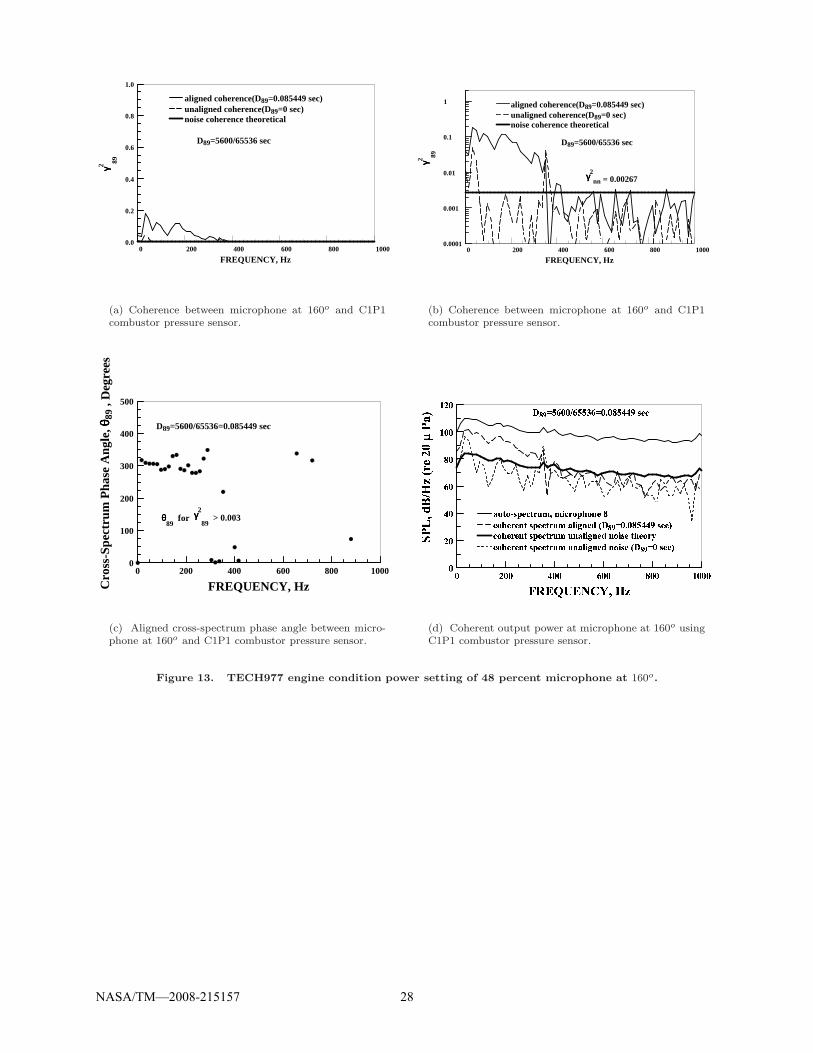
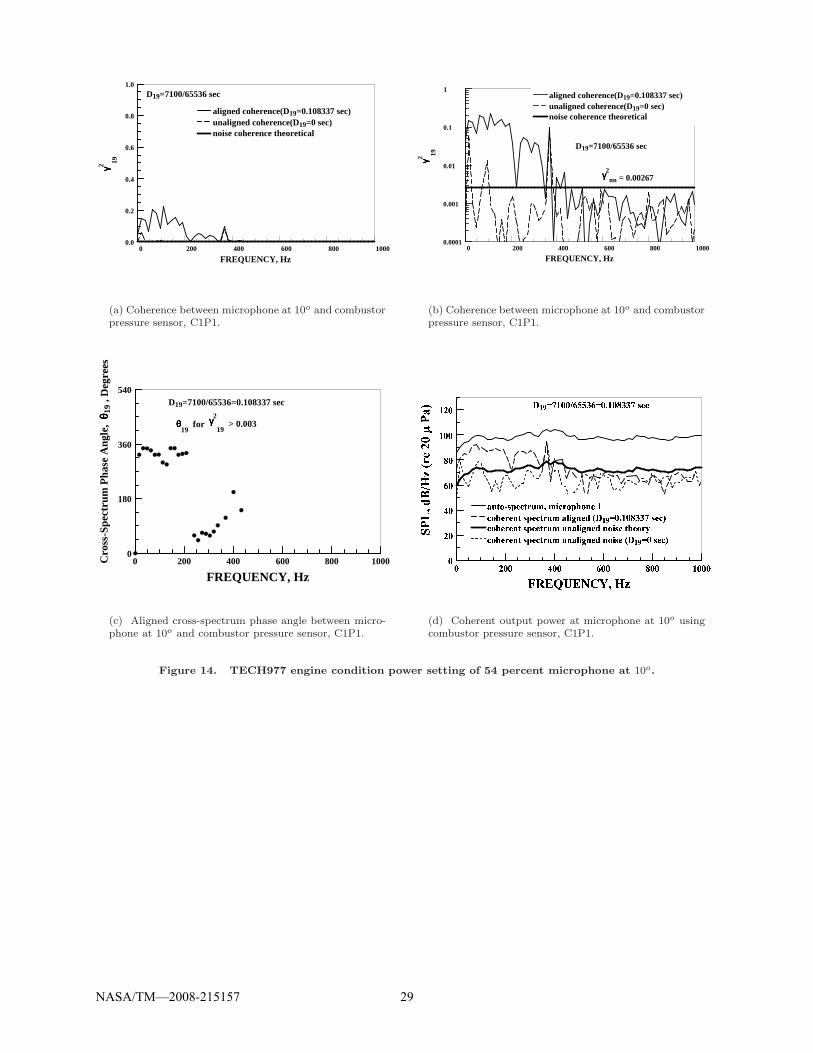
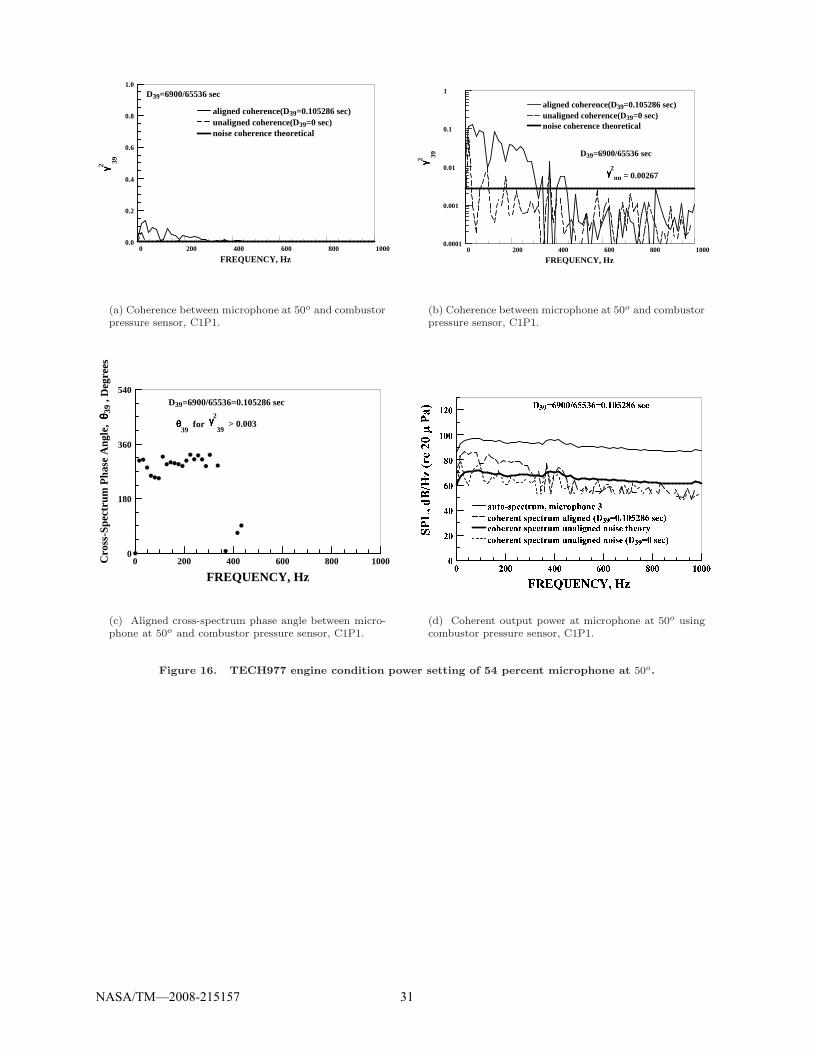
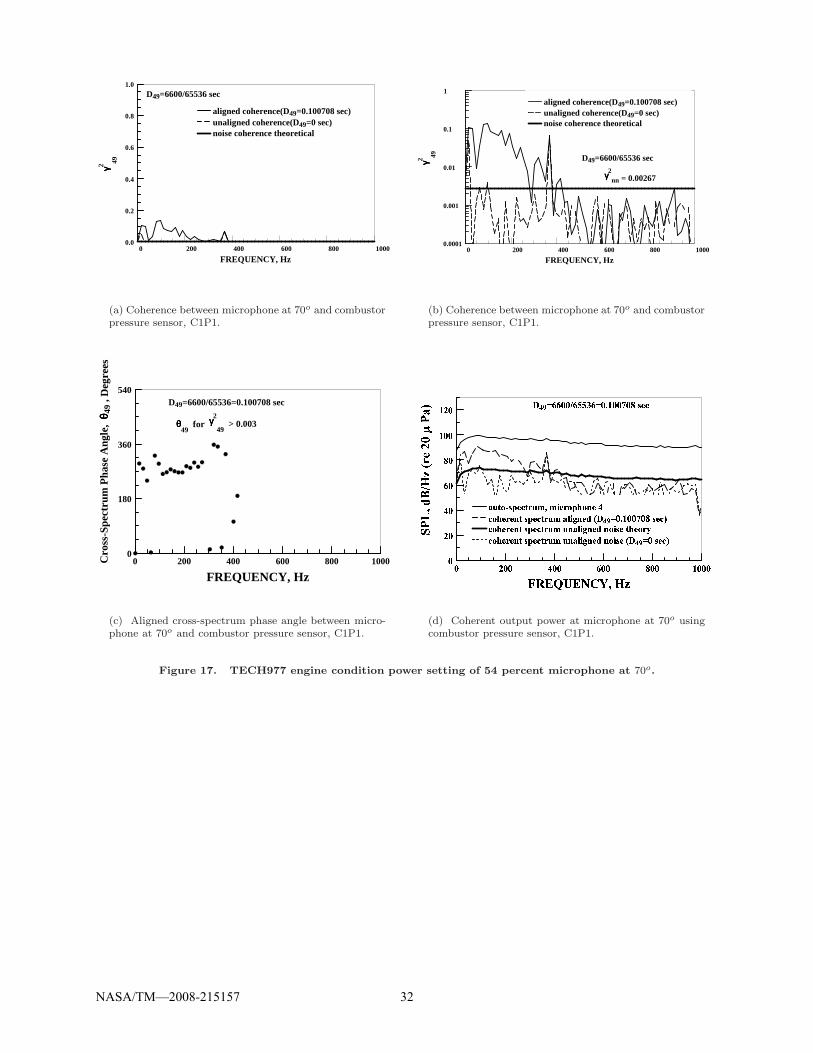
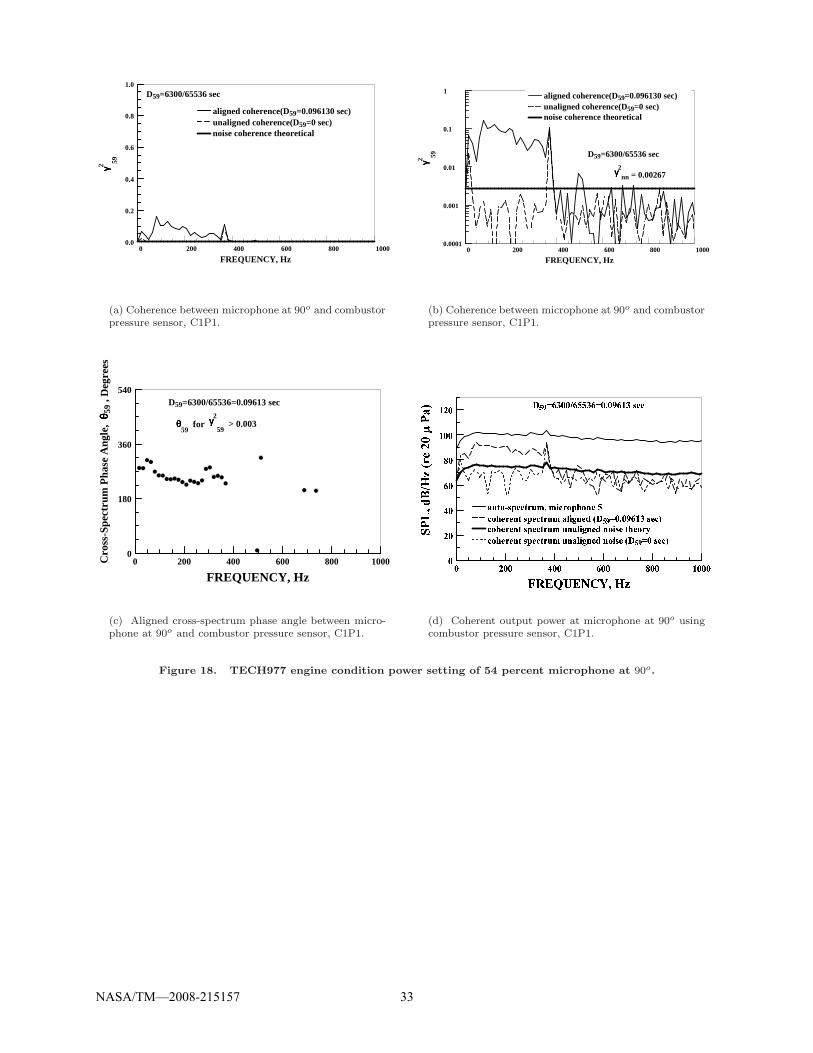
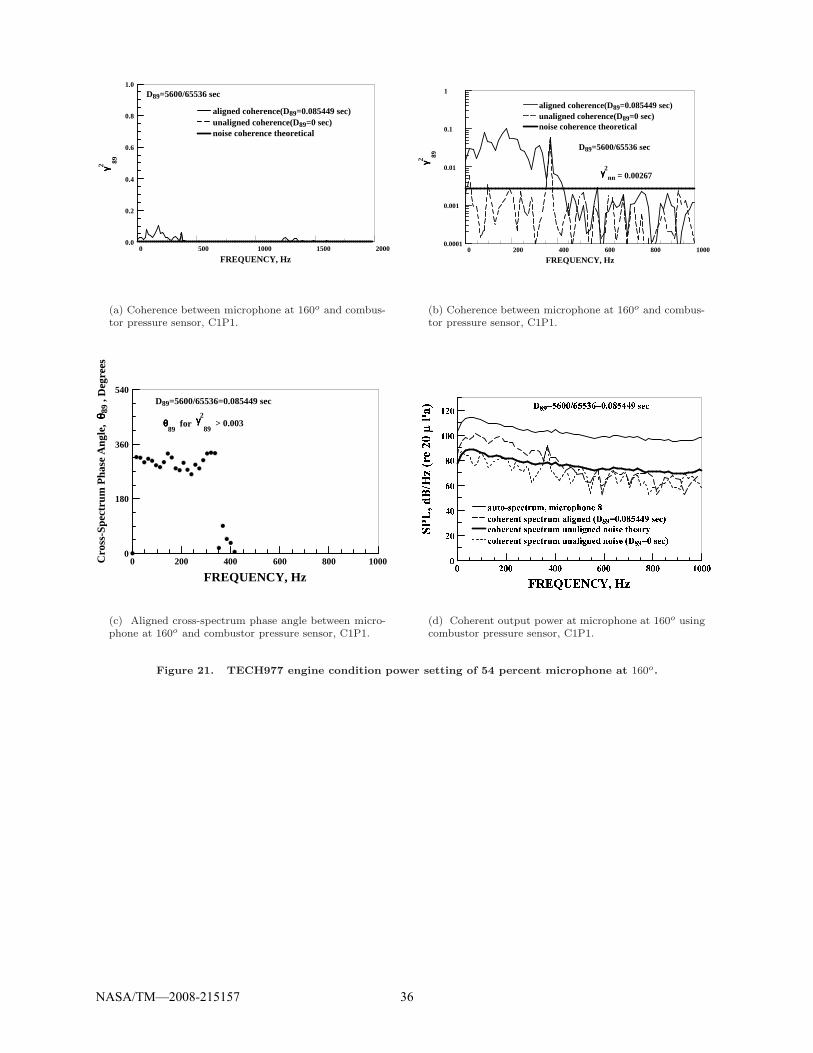
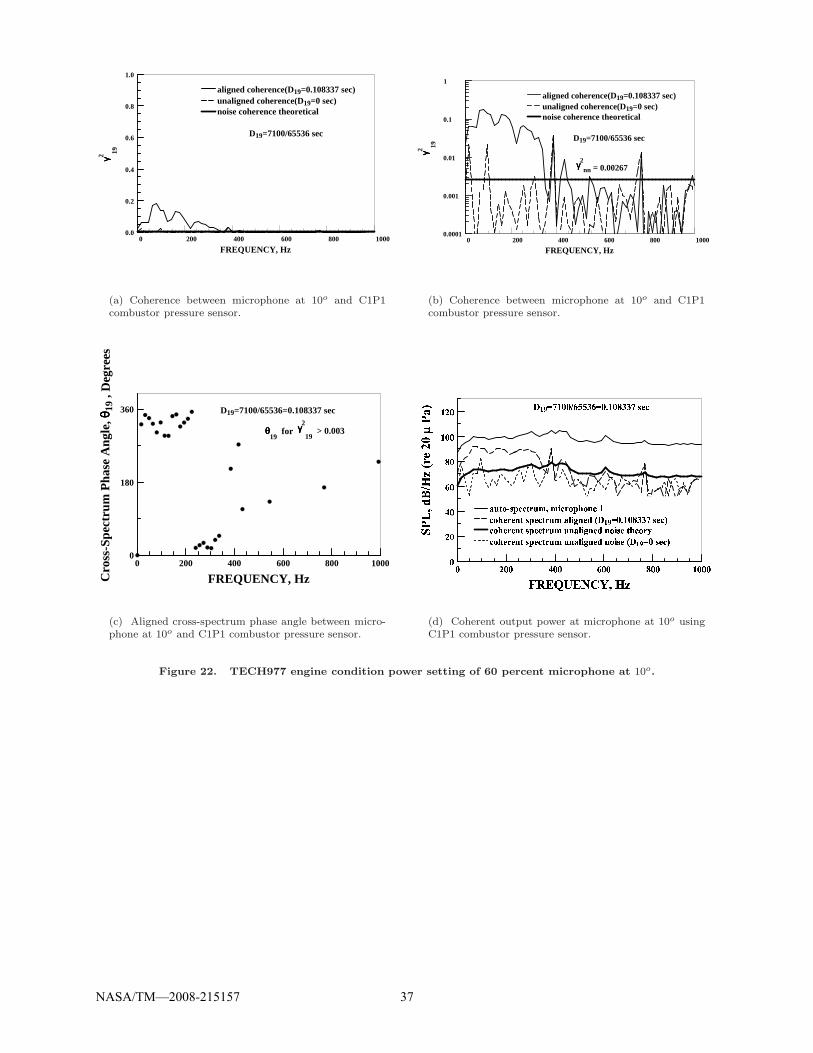
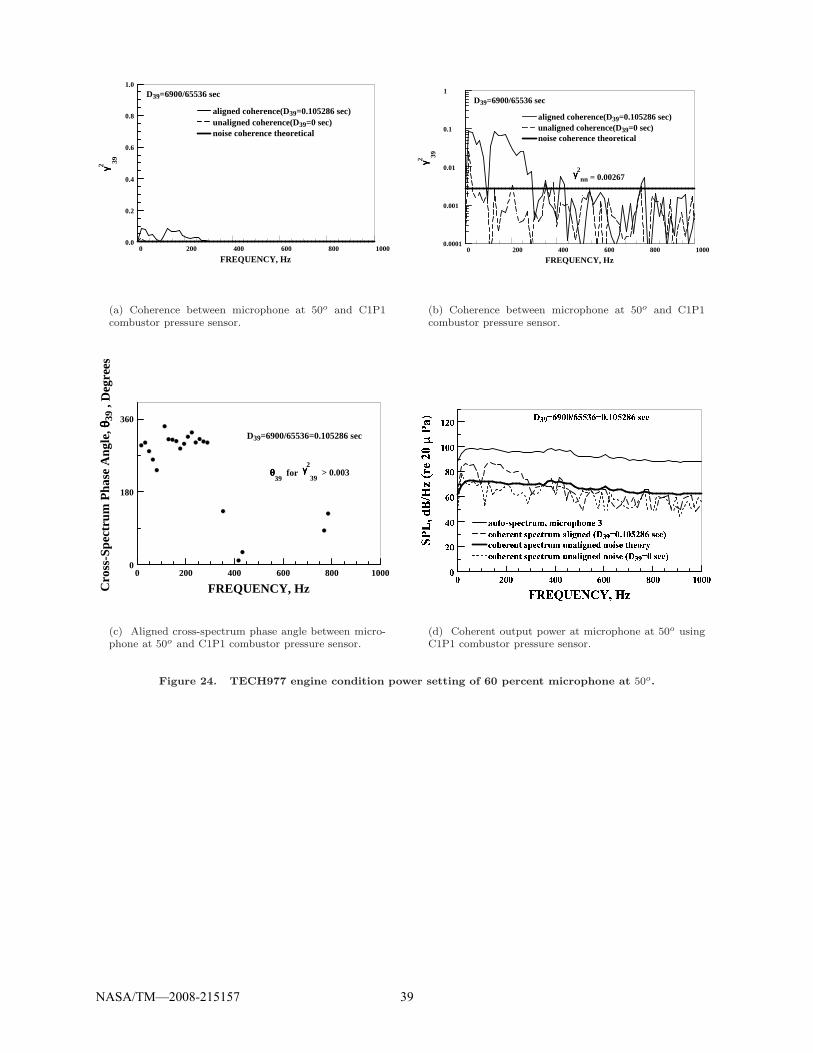
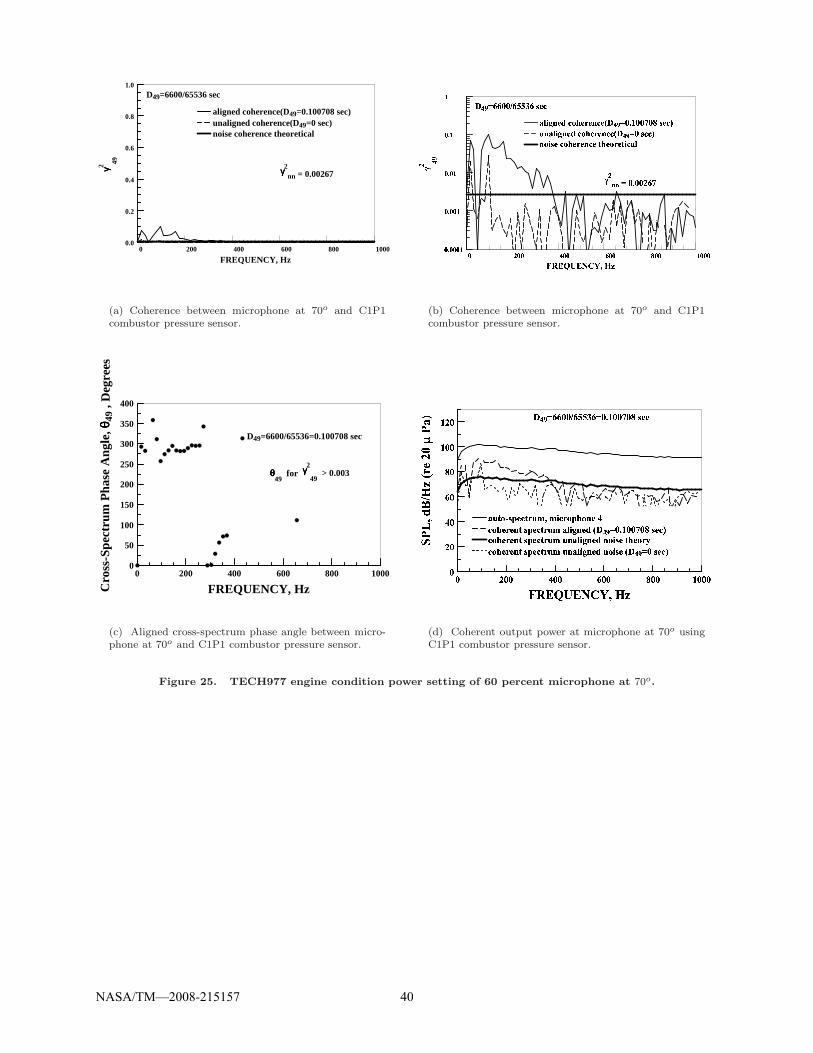
Results are presented in groups arranged by engine speed. Figures 6 through 13 present the 48percent speed case, figures 14 through 21 present the 54 percent speed case, and figures 22 through 29 presentthe 60 percent speed case. Within each engine speed group the results are arranged by angle. Each figureconsists of a set of four plots. Figure (a) shows the aligned coherence on a linear scale so that the results aremore readily compared with previous results. Figure (b) shows the coherence on a logarithmic scale so thatthe aligned and unaligned coherence and the statistical noise floor coherence, γ2
nn = 0.00267 (Ns = 1120),
NASA/TM—2008-215157 6
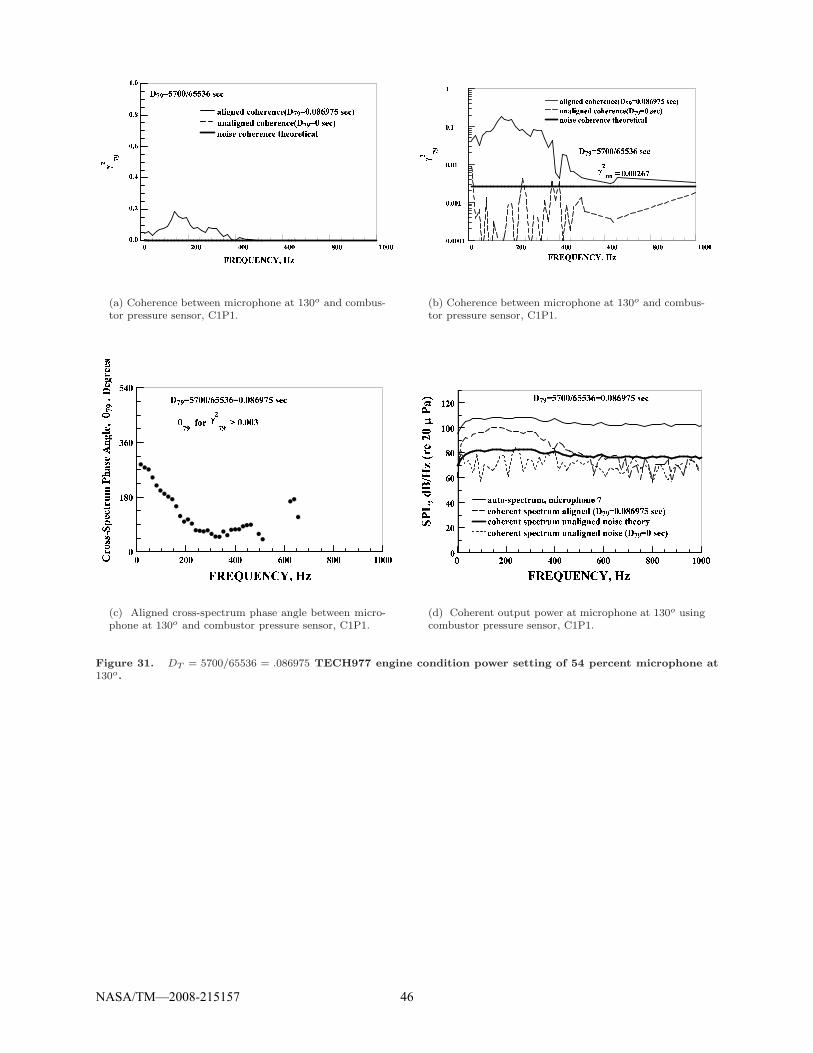
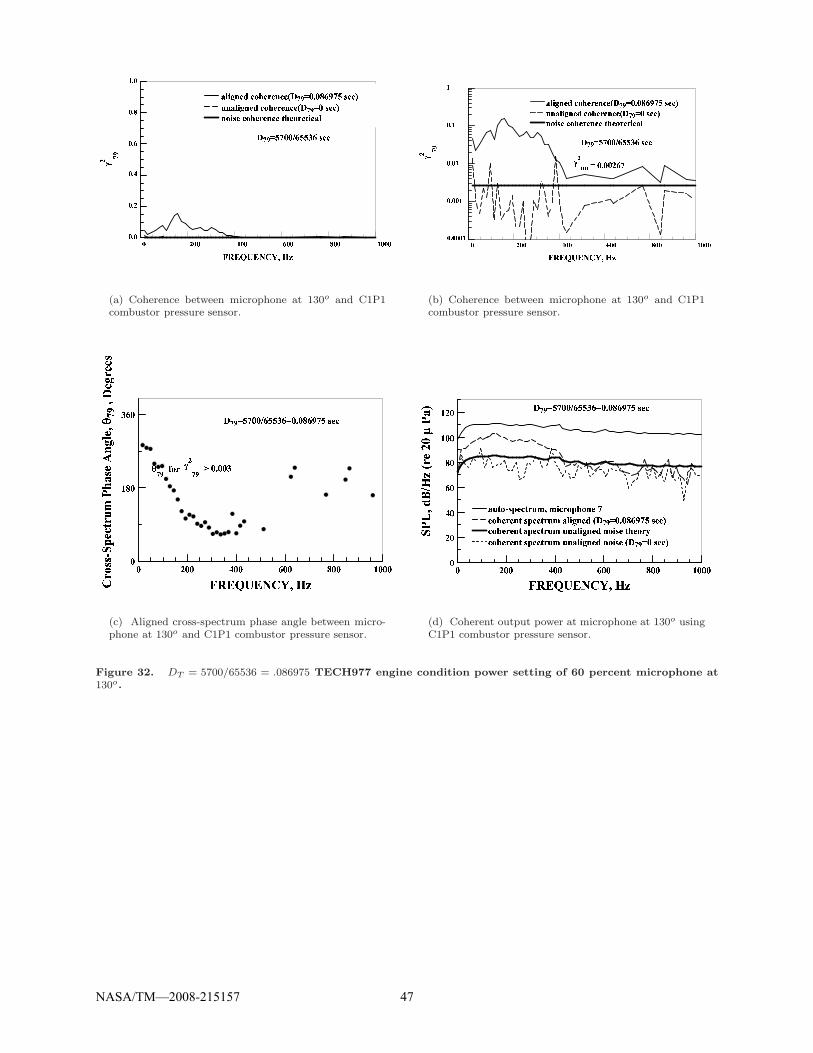
can be clearly revealed. Figure (c) shows the cross-spectrum phase angle. Figure (d) shows the SPL densityand the coherent combustion noise spectral density calculated using the aligned and unaligned coherence,and the statistical coherence of two unaligned signals.
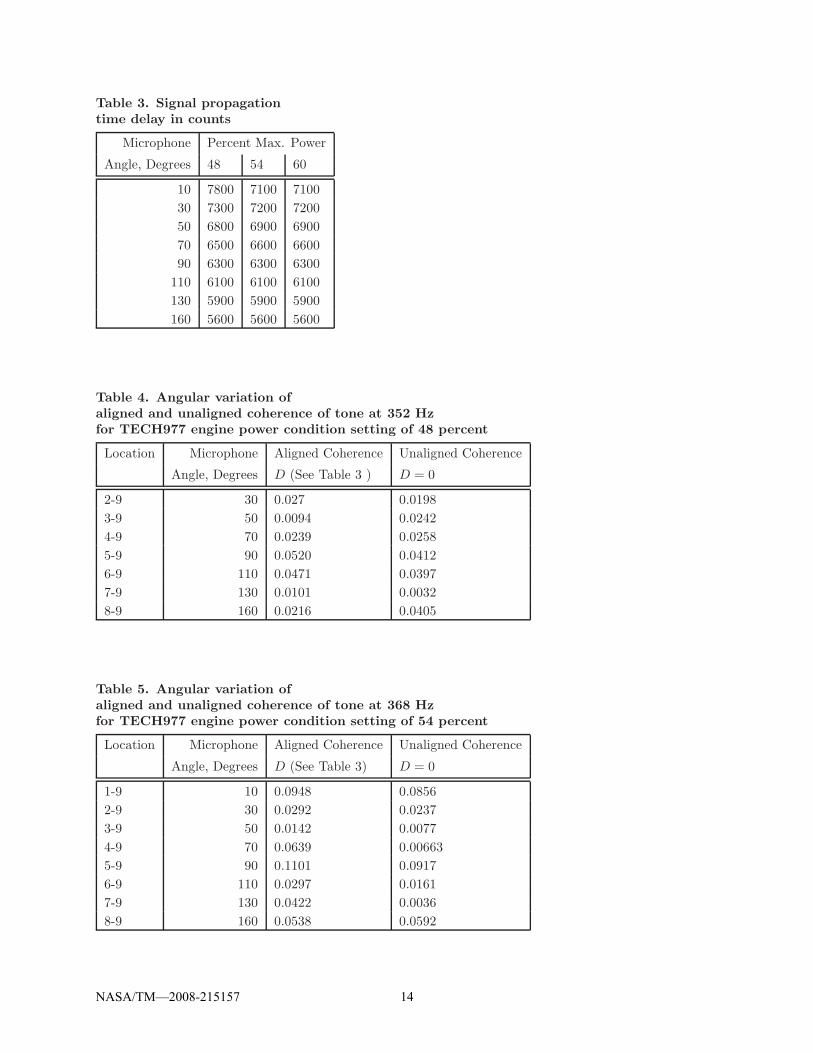
On each figure the signal propagation value of D which was used is shown in counts and seconds.The D values are also shown in Table 3. While the nominal value is 5927 samples, larger D values are usedat the smaller angles and smaller values are used at the larger angles.
A. Coherence
For each engine speed case the aligned and unaligned coherence values are shown. In addition, thenoise floor coherence value of γ2
nn = 0.00267 is shown. The coherence is largest in the 0 to 400 Hz frequencyrange. The aft quadrant coherence function is generally in the vicinity of 0.2 or lower. The improved coherentoutput power spectrum method is needed to determine the coherent combustion noise spectrum due to itslow level.
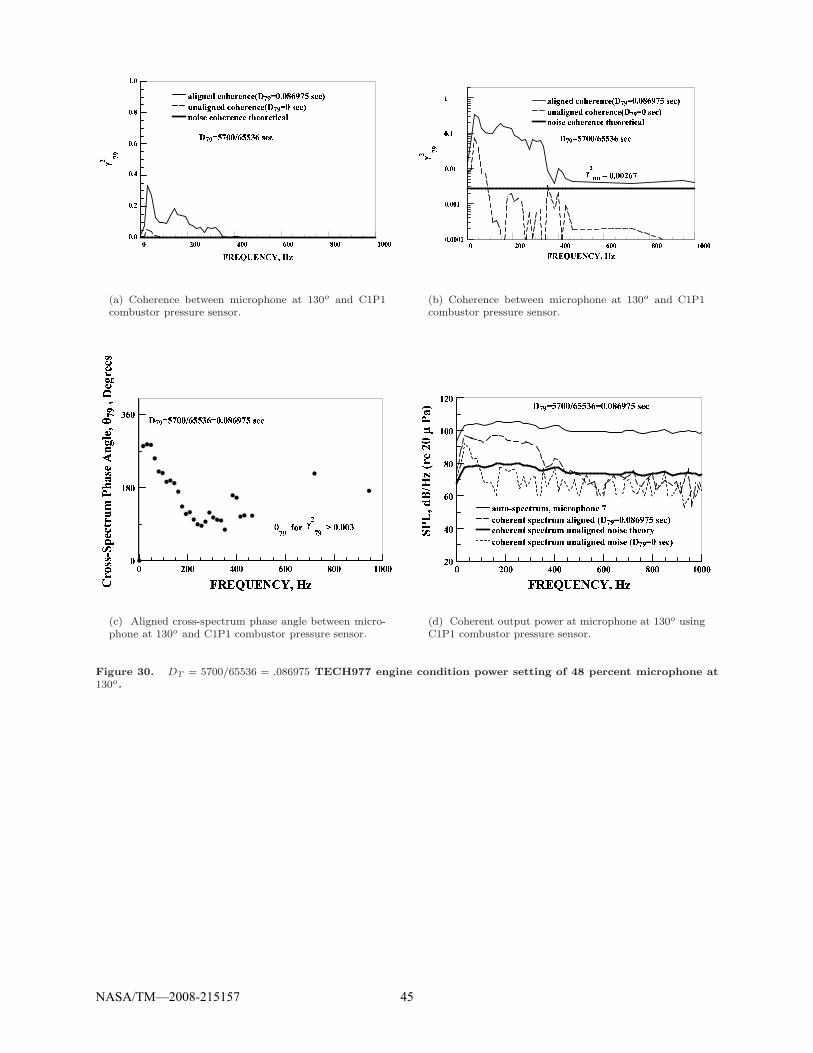
To illustrate the sensitivity of selection of the time delay, D, we note that to remove the gradient ofthe phase angle versus frequency in the frequency range from 0 to 200 Hz shown for the 130o microphonein Figs 12, 20, and 28 for the 48, 54, and 60 percent of the Max Power setting, the time delay used isD = 5900/65 536 = 90.027 ms. However, to remove the gradient of the phase angle versus frequency in thefrequency range from 200 to 400 Hz shown for the 130o microphone in Figs. 30, 31, and 32 at the threepower settings, the time delay used is D = 5700/65 536 = 86.975 ms. This indicates that the noise in the200 to 400 Hz frequency band has traveled faster by a factor of 5900/5700 = 1.035 than the noise in the 0 to200 frequency band. The actual values of the coherence and the two signal coherent output power spectrumdo not change much since the signal alignment using either time delay is fine.
Miles (1983)45 has shown that the acoustic pressure and temperature fluctuations are related andthat the cross-spectrum shows phase angle depends mainly on the slowest propagation speed which is thatof the hot spot in the flow. Consequently, on the basis of the time delay (D = 5900/65 536 = 90.027 ms)used to remove cross-spectrum phase angle changes with frequency, we make the argument that below 200Hz the coherence is due mainly to an indirect combustion noise process due to entropy waves, which spendpart of the time traveling at the flow velocity (in the combustor). Also, again on the basis of the time delay(D = 5700/65 536 = 86.975 ms) used to remove cross-spectrum phase angle changes with frequency in the200 to 400 Hz band, this coherence is due mainly to a direct combustion noise source, which spends all itstime propagating as an acoustic wave with the velocity of an acoustic wave.
Similar behavior was identified at the 110o microphone where the indirect (entropy) noise signaltime was 93.079 ms and the direct (acoustic) noise signal travel time was 90.027 ms. Furthermore, similarbehavior was also identified at the 160o microphone where the indirect (entropy) noise signal time was85.449 ms and the direct (acoustic) noise signal travel time was 82.397 ms.
It is likely that the measured coherence represents in reality, a combination of direct and indirectnoise sources and that some time delay, which is a function of frequency should be used to remove thecross-spectrum phase angle changes. However, that investigation is beyond the scope of this report. Since,the time delays are the result of a combination of sources without a detailed source acoustic and propagationmodel, detailed geometry and detailed performance information it difficult to assign precise velocities andlengths to obtain these time delay values.
Muthukrishnan et al. (1978)33 make a similar argument that at low-frequencies a high coherenceexists between combustion noise and entropy noise. However, they argue that at moderate frequencies thephase becomes rapidly oscillatory which destroys the coherence and makes the entropy noise and combustionnoise independent, uncorrelated sources. Consequently, the combustor pressure at low-frequencies is coherentwith entropy noise. At higher frequencies it is coherent with direct combustion noise.
In any event, the cross spectra between the combustion sensor pressure and the far-field microphonepressure provides some indication that the time delay before the indirect mechanism changes a hot spot intoan acoustic wave can be estimated and direct and indirect coherent combustion noise can be separated.
B. Tones in the coherence
As discussed by Miles (2006)11 tones can be identified using the aligned and unaligned coherencefunction. The unaligned coherence function has a value determined by the number of samples of twoindependent signals and the tones. The aligned signal has a value determined by the coherence of the
NASA/TM—2008-215157 7
.
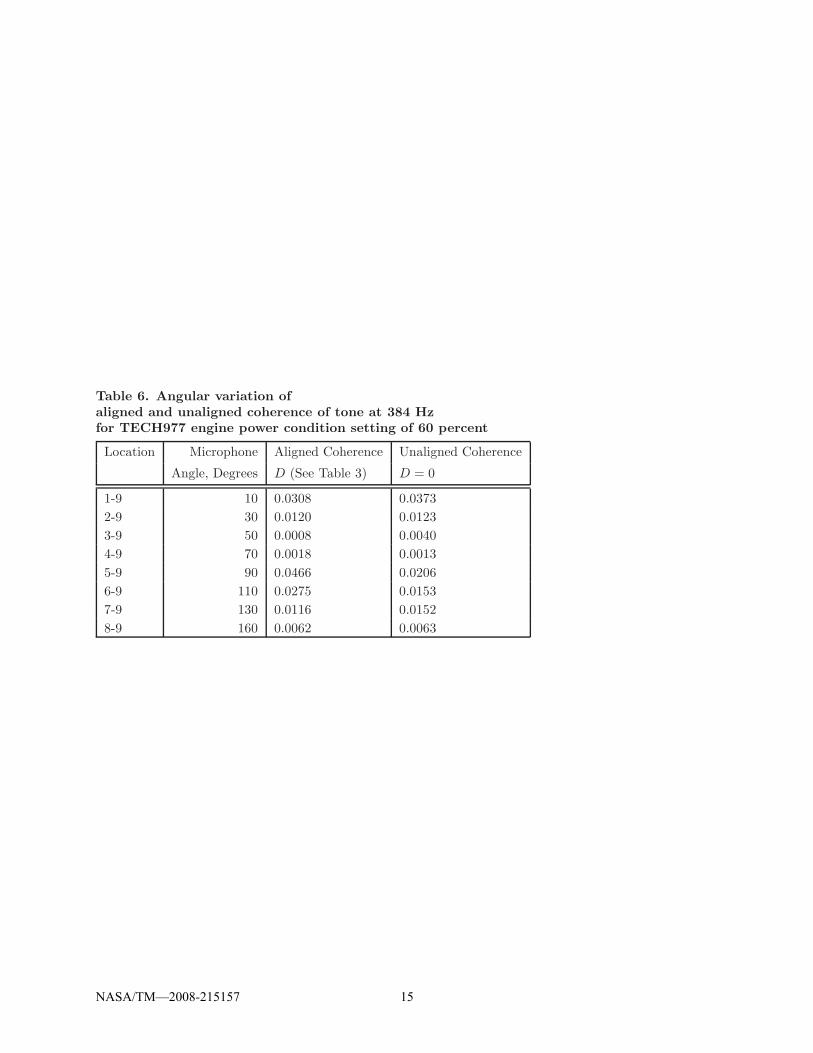
two signals and tones. For the engine condition power setting of 48 percent a strong tone occurs at 352 Hz.Aligned and unaligned coherence values for this case are shown in Table 4. For the engine condition powersetting of 54 percent a strong tone occurs at 368 Hz. Aligned and unaligned coherence values for this caseare shown in Table 5. For the engine condition power setting of 60 percent a strong tone occurs at 384 Hz.Aligned and unaligned coherence values for this case are shown in Table 6. These tones generally can berelated to a shaft frequency. The physical N2 shaft rotation rates are 21 340, 22 310, and 22 930 rpm, whichcorrespond to shaft frequencies of 355.667, 371.83, and 382 Hz. Since the bandwidth being used is 16 Hz theobserved tones correspond to the physical N2 shaft frequency. Consequently, these appear to be compressortones possibly related to a compressor disk tone. For the engine condition power setting of 60 percent forthe 10o microphone a strong tone not only occurs at 384 Hz but also at the second harmonic, 768 Hz.
C. Cross-spectrum phase angle
If the coherence is larger than 0.003 the phase angle standard deviation with Ns > 2000 is between15o and 25o (see Fig. 5). Consequently, the phase angle plots emphasize measured phase angles where thecoherence is greater than 0.003.
The phase angle plots measured at angles greater than 90o for coherence values greater than 0.003show a smooth profile. However, for angles less than 90o the profile of the phase angles is more raggedeven though the coherence is greater than 0.003. This might indicate the barrier is creating an interferencepattern that shows up in the coherent low-frequency sound waves. Consequently, the best values of the phaseangle are in the aft arc at angles greater than 90o.
VI. Discussion
The correlated far-field core noise component from the Honeywell TECH977 covers the frequencyrange from 0 to 400 Hz. Similar results were obtained by Miles (2006)11 in the study of a Pratt & WhitneyPW4098 turbofan engine, by Siller et al.(2001)12 in the study of core noise from a Rolls-Royce BR700 aero-engine, and in the study of an AVCO Lycoming YF–102 by Karchmer and Reshotko (1976),1 and Karchmer(1977).2 Karchmer (1983)46 in the study of AVCO Lycoming YF–102 core noise and Miles (2006)11 in thestudy of core noise from a Pratt & Whitney PW4098 attribute this coherent noise to the lowest radial ordermodes of the combustion noise. The lowest radial order mode is the m = 0 mode, which corresponds to aplane wave. Karchmer (1983)46 used six pressure probes to identify combustor modes. Miles (2007)47 useda restricted acoustic model analysis using signals from two combustor pressure sensors to identify combustormodes.
The turbofan combustor is designed to have a high level of turbulence without being unstable. Asfar back as 1957, Blackshear and Rayle (1957)48 mention that some observers report beneficial effects dueto velocity and pressure excursions evidenced in a noticeable increase in the combustion efficiency withinthe combustor. Poinsot and Veynante (2005)49 (see p. 131) remark that the main effect of turbulenceon combustion is to increase the combustion rate. Hill and Peterson (1992)50 mention that more intenseturbulence promotes more rapid mixing of the vaporized fuel and air and faster propagation of flame throughthe unburned mixture. They present a good discussion of gas turbine combustor fundamental design issues.
The coherence measurements in turbofan engines between the combustor and the far-field micro-phones differ from those made using a combustor burner assembly with a single fuel spray nozzle as usedby Strahle et al. (1977)9 and Muthukrishnan et al. (1978)10 due to the presence of the fan inlet soundsource, the fan exhaust sound source, the jet sound source, and the engine core sound source. The coherencemeasurements in turbofan engines are influenced by the fact that turbofan engine have an annular combustorwith the circumferential modes. In addition, the coherence measurements, should reflect the possibility ofentropy noise from hot spots passing through the turbine as discussed by Pickett (1975),24 Cumpsty andMarble (1977),25 and Gliebe (2000),28 as well as direct combustion noise and compressor tones. However,coherence measurements made using a combustor burner assembly with a single fuel spray nozzle as usedby Strahle et al. (1977)9 and Muthukrishnan et al. (1978)10 do have a jet noise source and the possibilityof entropy noise from hot spots passing through a nozzle as described by Williams and Howe (1970)31 andMarble and Candel (1977).32
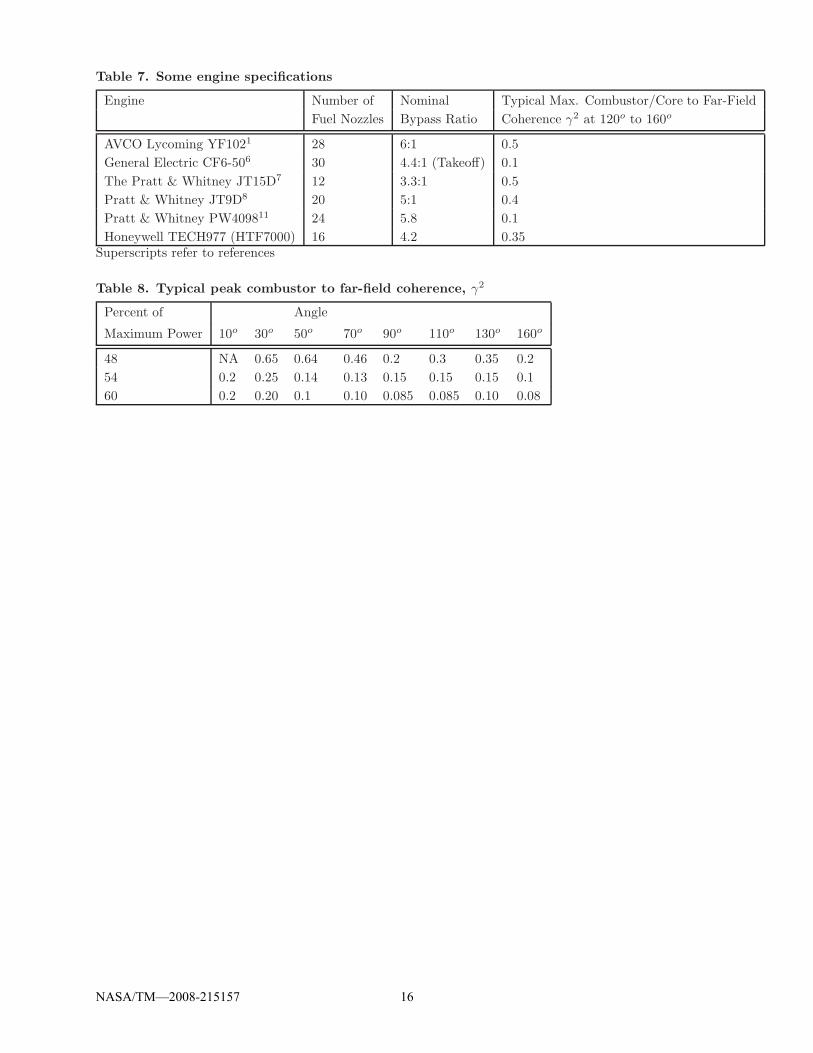
Table 7 shows that for a great number of combustion chamber geometries, range of the numberof nozzles, and engine design bypass ratios significant coherence can be measured from 120o to 160o. The
NASA/TM—2008-215157 8
combustion duct modal analysis of Karchmer (1983)46 and Miles (2007)47 suggest that the coherence is dueto annular combustion duct modes propagating to the far field and at the lowest frequencies the coherenceis from a plane wave combustion duct mode. The interesting aspect is that one sees any coherence at allconsidering each fuel nozzle is an independent source of noise and the level of turbulence used to increasecombustor efficiency and reduce emissions is high.
For many engines the coherence in the far field is less than 0.1 and one may use the method ofaligned and unaligned coherence developed by Miles (2006)11 to determine if the coherence is significant.Note, for example, that for the CF6–50 core noise investigation described by Doyle and Moore (1980)6 thenumber of samples was 100, and the 95 percent confidence interval for coherence of two independent signalsusing 100 samples is zero to γ2
nn = 1 − (1 − 0.95)1/(100−1) = 0.0298. Doyle and Moore (1980)6 plottedcoherence values on a linear scale from 0 to 1.0, and coherence values less than 0.1 were ignored. To someextent the coherence value of 0.1 has traditionally been considered a threshold or “cutoff” level of coherence.The discussion presented herein shows that this is not a realistic value for modern turbofan engines.
At first glance the behavior of the barrier seems to block the low-frequency jet mixing noise therebyincreasing the combustion noise coherence in the forward quadrant. However, the barrier should also beblocking the combustion noise. It appears that the barrier creates some type of reflection channel thatchanges the path of both signals to the forward quadrant microphones. Furthermore, the results presentedherein show that by manipulating the delay time, D, one can enhance the combustion noise signal perhapsby picking up more reflections and reduce the low-frequency jet mixing noise signal. Consequently, theforward quadrant microphone results especially at the 48 percent maximum power test condition are highlymanipulated. At higher power setting, the coherence levels resemble those in the aft arc and are not modifiedby the barrier as much.
The peak coherence values summarized in Table 8 suggest that one of the major noise source reducingthe coherence between the combustor and the far-field microphones as shown in Table 7 is low-frequencynoise from near the end of the potential core of the jet. Phase array measurements of jet noise show that adistributed source of low-frequency noise near the end of the potential core of the jet. The peak locations ofthe source levels gradually move from downstream positions to the nozzle exit as the frequency is increasedas shown by phased array measurements made by Lee and Bridges (2005),51 Lee (2006),52 Papamoschou andDadvar (2006),53 and Suzuki (2006).54 The low-frequency generating mechanism is attributed to large-scalevortical structure collapse at the end of the potential core. At an engine speed of 48 percent of maximumpower, the jet is shorter and weaker than at the higher speeds. The reflecting channel formed by the barrierwall and the selected signal time delay may be reducing the ratio of low-frequency jet noise to combustion-related low-frequency noise so that the coherence is high at angles of 30o, 50o, and 70o at the 48 percentspeed operating condition. As the engine power is increased to 54 and 60 percent the potential core of thejet moves further downstream reducing the effectiveness of the barrier to interact with the low-frequencynoise generated near the end of the potential core and the low-frequency combustion noise becomes weaker.Consequently, the coherence values and angular distribution are both more similar to those in the literature atthe higher engine power settings. The effect of the jet on combustor coherence was noted by Muthukrshnamet al. (1978)10 in a test of a single fuel spray nozzle combustor assembly. A similar effect of the jet on thecoherence function between a microphone array focused on the nozzle and a rumble probe is discussed fortests of a BR700 engine by Siller et al. (2001).12 Since much of the low-frequency noise appears to comefrom jet mixing at the end of the jet potential core, using acoustic liners in the turbofan nozzle exhaustsystem to remove core noise will not remove much low-frequency noise except at low engine speed settingswhere the jet noise is reduced.
The sound radiation spectrum of flames is a topic of current experimental research by Rajaram etal. (2004, 2006)21, 55 and computational fluid dynamic research using the large-eddy simulation technique byIhme et al. (2006).22 In addition, research to study the interaction of sound and flames is being conductedby Lieuwen and Cho (2005)56 and the effect of noise on combustion stability is being studied by Lieuwenand Banaszuk (2005).57 However, there is a gap between these studies of the acoustics of a flame from a fuelspray nozzle and the acoustical interaction of multiple fuel spray combustor nozzles in an annular combustor.The mechanism leading to the formulation of annular acoustic duct modes from the sound generated multipleindependent fuel spray nozzles is unknown. The amount of the total sound energy participating in the annularduct modes is unknown. If only part of the total sound energy is measured by the coherence function from thecombustor to the far field, then the remainder will show up in the far field as radiated sound unattributableto the combustor noise. Perhaps the annular acoustic duct modes represent a steady-state phenomena as
NASA/TM—2008-215157 9
sound energy is added by the multiple spray combustor nozzles and removed as sound leaves the combustor.At the moment the ratio of uncorrelated sound to coherent sound in the combustor duct is an open question.
VII. Concluding Remarks
The source location technique based on adjusting the time delay between the combustor pressuresensor signal and the far-field microphone signal to maximize the coherence and remove as much variationof the phase angle with frequency as possible was successful. A method to help identify combustion noisecoherence using an aligned and unaligned coherence technique, which enables the validation of low levelsof coherence as being due to core noise by identifying the coherence noise floor has been demonstrated. Astatistical procedure was also used to establish this threshold level. The use of both methods provides a highconfidence level for the coherence function values calculated.
Using the procedures discussed led to the discovery that the turbofan engine noise in the 200 to 400Hz frequency band is chiefly related to coherent “direct” combustion noise, which travels from the combustorto the far field as an acoustic signal. Furthermore, it was found that the noise signal in the 0 to 200 Hzfrequency band is chiefly related to coherent “indirect” combustion noise due to “hot spots” traveling throughthe turbine, which travel at the flow velocity in the combustor and turbine until noise is generated.
For the AVCO Lycoming YF–102 the coherence between the combustor and a far-field microphonewas frequently near 0.5. For the Pratt & Whitney PW4098 this coherence was generally less than 0.1. Forthe 48 percent of maximum power test condition the far-field coherence was generally less than 0.4 at anglesfrom 90o to 160o. At angles greater than 90o for operating settings of 54 and 60 percent, the coherencebetween the combustor and a far-field microphone is less than 0.15.
NASA/TM—2008-215157 10
References
1Karchmer, A. M. and Reshotko, M., “Core Noise Source Diagnostics on a Turbofan Engine Using Correlation andCoherence Techniques,” Tech. Rep. NASA TMX-73535, NASA, 1976.
2Karchmer, A. M., “Identification and Measurement of Combustion Noise From a Turbofan Engine Using Correlationand Coherence Techniques,” Tech. Rep. NASA TM-73747, NASA, 1977, Doctor of Philosophy thesis E-9319.
3Reshotko, M., Karchmer, A., Penko, P. F., and McArdle, J. G., “Core Noise Measurements on a YF–102 TurbofanEngine,” J. Aircraft , Vol. 14 No. 7, July 1977, pp. 611–612, NASA TM X-73587, AIAA Paper 77-21.
4Krejsa, E. A., “Combustion Noise From Gas Turbine Aircraft Engines Measurement of Far-Field Levels,” Tech.Rep. NASA-TM-88971, 1987.
5Shivashankara, B. N., “Gas Turbine Core Noise Source Isolation by Internal-to-Far-Field Correlations,” J. Aircraft ,Vol. 15 No. 9, September 1978, pp. 597–600.
6Doyle, V. L. and Moore, M. T., “Core Noise Investigation of the CF6–50 Turbofan Engine,” Tech. Rep. R79AEG395,NASA CR-159598, General Electric Company, Cincinnati, OH, Jan. 1980, Contract-Grant-Task Number: NAS3-21260.
7Reshotko, M. and Karchmer, A., “Core Noise Measurements From a Small, General Aviation Turbofan Engine,”Tech. Rep. TM-81610, NASA, 1980, N81-11769.
8Shivashankara, B. N., “High Bypass Ratio Engine Noise Component Separation by Coherence Technique,” J.Aircraft , Vol. 20 No. 3, March 1983, pp. 236–242, AIAA 81-2054, Aeroacoustics Conference, 7th, Palo Alto, California, Oct.5-7, 1981.
9Strahle, W. C., Muthukrishnan, M., and Neale, D. H., “Coherence Between Internal and External Noise Generatedby a Gas Turbine Combustor,” AIAA Journal , Vol. 15 No. 7, 1977, pp. 1018–1024, AIAA-1977-20; NASA NSG-3015.
10Muthukrishnan, M., Strahle, W. C., and Neale, D. H., “Separation of Hydrodynamic, Entropy, and CombustionNoise in a Gas Turbine Combustor,” AIAA Journal , Vol. 16 No. 4, April 1978, pp. 320–327.
11Miles, J. H., “Aligned and Unaligned Coherence: A New Diagnostic Tool,” Tech. Rep. AIAA-2006-0010, AIAA,2006, Presented at the 44th AIAA Aerospace Science Meeting, 9-12 Jan 2006 Reno Hilton Reno, Nevada, also NASA/TM–2006-214112.
12Siller, H. A., Arnold, F., and Michel, U., “Investigation of Aero-Engine Core-Noise Using a Phased MicrophoneArray,” Tech. Rep. AIAA-2001-2269, AIAA/CEAS Aeroacoustics Conference, 2001.
13Chu, B.-T., “Pressure Waves Generated by Addition of Heat in a Gaseous Medium,” Tech. Rep. NACA TN 3411,NACA, 1955.
14Strahle, W. C., “On Combustion Generated Noise,” Journal of Fluid Mechanics, Vol. 49 , 1971, pp. 399–414.15Lighthill, M. J., “On Sound Generated Aerodynamically : I. General Theory.” Proceedings of the Royal Society
London, Vol. 211 Series A, 1952, pp. 564–587.16Lighthill, M. J., “On Sound Generated Aerodynamically: II. Turbulence as a Source of Sound,” Proceedings of the
Royal Society London, Vol. 222 Series A, Feb. 1954, pp. 1–32.17Strahle, W. C., “Some Results in Combustion Generated Noise,” Journal of Sound and Vibration, Vol. 23 No. 1,
1972, pp. 113–125.18Strahle, W. C. and Shivashankara, B. N., “A Rational Correlation of Combustion Noise Results From Open Tur-
bulent Premixed Flames,” Fifteenth Symposium (International) on Combustion, The Combustion Institute, Pittsburgh, 1975,pp. 1379–1385.
19Strahle, W. C., “The Convergence of Theory and Experiment in Direct Combustion Generated Noise,” AIAA-1975-522, March 1975, NASA grant NSG-3015; AF-AFOSR-72-2385.
20Rajaram, R. and Lieuwen, T., “Parametric Studies of Acoustic Radiation From Premixed Flames,” CombustionScience and Technology , Vol. 175 No. 12, December 2003, pp. 2269–2298.
21Rajaram, R., Gray, J., and Lieuwen, T., “Premixed Combustion Noise Scaling: Total Power and Spectra,” AIAA-2006-2612, May 2006.
22Ihme, M., Bodony, D. J., and Pitsch, H., “Prediction of Combustion-Generated Noise in Non-premixed TurbulentJet Flames Using Large-Eddy Simulation,” Tech. Rep. AIAA 2006-2614, AIAA, May 2006.
23Crighton, D. G., Dowling, A. P., Williams, J. F., Heckel, M., and Leppington, F., Modern Methods in AnalyticalAcoustics: Lecture Notes, Springer-Verlag, 1992.
24Pickett, G. F., “Core Engine Noise Due to Temperature Fluctuating Through Turbine Blade Rows,” Tech. Rep.AIAA-75-528, AIAA, 1975.
25Cumpsty, N. A. and Marble, F. E., “The Interaction of Entropy Fluctuations With Turbine Blade Rows; A Mech-anism of Turbojet Noise.” Proc. R. Soc. Lond. A., Vol. 357, 1977, pp. 323–344.
26Cumpsty, N. A. and Marble, F., “Core Noise from Gas Turbine Exhausts,” Journal of Sound and Vibration, Vol. 54
No. 2, 1977, pp. 297–309.27Cumpsty, N. A., “Jet Engine Combustion Noise: Pressure, Entropy and Vorticity Perturbations Produced by
Unsteady Combustion or Heat Addition,” Journal of Sound and Vibration, Vol. 66 No. 4, 1979, pp. 527–544.28Gliebe, P., Mani, R., Shin, H., Mitchell, B., Ashford, G., Salamah, S., and Connell, S., “Acoustic Prediction Codes,”
Tech. Rep. NASA CR–2000-210244, R99AEB169, General Electric Aircraft Engines, August 2000.29Cuadra, E., “Acoustic Wave Generation by Entropy Discontinuities Flowing Past an Area Change,” J. Acoust. Soc.
Am., Vol. 42 No. 4, 1967, pp. 725–732.30Goldstein, M. E., “Turbulence Generated by the Interaction of Entropy Fluctuations With Non-Uniform Mean
Flows,” J. Fluid Mech., Vol. 93 Part 2, 1979, pp. 209–224.31Williams, J. E. F. and Howe, M. S., “The Generation of Sound by Density Inhomogeneities in Low Mach Number
Nozzle Nlow,” J. Fluid Mech., Vol. 70 Part 3, 1970, pp. 605–622.
NASA/TM—2008-215157 11
32Marble, F. E. and Candel, S. M., “Acoustic Disturbance From Gas Non-Uniformities Convected Through a Nozzle,”Journal of Sound and Vibration, Vol. 55 No. 2, 1977, pp. 225–243.
33Muthukrishnan, M., Strahle, W. C., and Neale, D. H., “Separation of Hydrodynamic, Entropy, and CombustionNoise in a Gas Turbine Combustor,” AIAA Journal , Vol. 16 No. 4, April 1978, pp. 320–327, NASA NSG 3015.
34Miles, J. H., Wasserbauer, C. A., and Krejsa, E. A., “Cross Spectra Between Temperature and Pressure in aConstant Area Duct Downstream of a Combustor,” AIAA-83-0762, NASA TM-83351, 1983.
35Schemel, C., Thiele, F., Bake, F., Lehmann, B., and Michel, U., “Sound Generation in the Outlet Section of GasTurbine Combustion Chambers,” AIAA-2004-2929, 2004.
36Richter, C., Panek, L., and Thiele, F. H., “On the Application of CAA-Methods for the Simulation of IndirectCombustion Noise,” AIAA-2005-2919, May 2005.
37Bake, F., Michel, U., Rohle, I., Richter, C., Thiele, F., Liu, M., and Noll, B., “Indirect Combustion Noise Generationin Gas Turbines,” AIAA-2005-2830, May 2005.
38Bake, F., Michel, U., and Roehle, I., “Investigation of Entropy Noise in Aero-Engine Combustors,” Transactionsof the ASME Journal of Engineering for Gas Turbines and Power , Vol. 129, April 2007, pp. 370–376.
39Bendat, J. S. and Piersol, A. G., Measurement and Analysis of Random Data, John Wiley & Sons, 1966.40Bendat, J. S. and Piersol, A. G., Random Data: Analysis and Measurement Procedures, John Wiley & Sons, 1971.41Bendat, J. S. and Piersol, A. G., Engineering Applications of Correlation and Spectral Analysis, John Wiley &
Sons, 1980.42Karchmer, A., Reshotko, M., and Montegani, F., “Measurement of Far Field Combustion Noise From a Turbofan
Engine Using Coherence Functions,” Tech. Rep. AIAA Paper 77-1277, NASA, Oct. 1977, NASA TM-73748, N77-33163.43Salikuddin, M., Stimpert, D., and Majjigi, R., “A Method to Account for Engine Noise Component Source Loca-
44Piersol, A., “Time Delay Estimation Using Phase Data,” IEEE Transactions on Acoustics, Speech, and SignalProcessing , Vol. ASSP-29 No. 3, June 1981, pp. 471–477.
45Miles, J. H., Wasserbauer, C. A., and Krejsa, E., “Cross Spectra Between Temperature and Pressure in a ConstantArea Duct Downstream of a Combustor,” AIAA-83-0762, NASA TM-83351, 1983.
46Karchmer, A. M., “Acoustic Modal Analysis of a Full Scale Annular Combustor,” Tech. Rep. AIAA Paper 83-0760,NASA, 1983, NASA TM-83334.
47Miles, J. H., “Restricted Modal Analysis Applied to Internal Annular Combustor Auto-Spectra and Cross-SpectraMeasurements,” AIAA Journal , Vol. 45 No. 5, May 2007, pp. 968–999.
48Blackshear, P. L. and Rayle, W. D., “Oscillations in Combustors,” Basic Considerations in the Combustion ofHydrocarbon Fuels With Air , edited by H. C. Barnett and R. R. Hibbard, NACA-TR-1300 VIII, NACA, 1957, pp. 229–241.
49Poinsot, T. and Veynante, D., Theoretical and Numerical Combustion, R. T. Edwards, 2005.50Hill, P. G. and Peterson, C. R., Mechanics and Thermodynamics of Propulsion, Addison Wesley, 1992.51Lee, S. S. and Bridges, J., “Phased-Array Measurements of Single Flow Hot Jets,” Tech. Rep. AIAA 2005-2842,
52Lee, S. S., “Phased-Array Measurements of Modern Regional Aircraft Turbofan Engine Noise,” Tech. Rep. AIAA2006-2653, 12th AIAA/CEAS Aeroacoustics Conference (27th AIAA Aeroacoustics Conference) 8-10 May 2006, Cambridge,Massachusetts, 2006.
53Papamoschou, D. and Dadvar, A., “Localization of Multipel Types of Jet Noise Sources,” Tech. Rep. AIAA 2006-2644, 12th AIAA/CEAS Aeroacoustics Conference (27th AIAA Aeroacoustics Conference) 8-10 May 2006, Cambridge, Mas-sachusetts, 2006.
54Suzuki, T., “Coherent Noise Radiation From a Jet Investigated With a Beam-Forming Technique,” Tech. Rep. AIAA2006-2646, 12th AIAA/CEAS Aeroacoustics Conference (27th AIAA Aeroacoustics Conference) 8-10 May 2006, Cambridge,Massachusetts, 2006.
55Rajaram, R. and Lieuwen, T., “Effect of Approach Flow Turbulence Characteristics on Sound Generation FromPremixed Flames,” Tech. Rep. AIAA 2004-461, 42nd AIAA Aerospace Sciences Meeting and Exhibit 5-8 January 2004, Reno,Nevada, 2004.
56Lieuwen, T. and Cho, J. H., “Coherent Acoustic Wave Amplification/Damping by Wrinkled Wlames,” Journal ofSound and Vibration, Vol. 279 , 2005, pp. 669–686.
57Lieuwen, T. and Banaszuk, A., “Background Noise Effects on Combustor Stability,” Journal of Propulsion andPower , Vol. 21 No. 1, January-February 2005, pp. 25–31.
NASA/TM—2008-215157 12
Table 1. Spectral estimate parameters
Parameter Value
Segment length, i.e., data points per segment, N 4096
Sample rate, r, samples/second 65 536
Segment length, Td = N/r, seconds 0.0625
Sampling interval, ∆t = 1/r, seconds 1/65 536
Frequency step, ∆f = 1/Td, Hz 16.0
Upper frequency limit, fc = 1/2∆t = r/2, Hz 32 768
Number of frequencies, Ly = fc/∆f = N/2 2048
Propagation time delay/Lag (T=9 oC,r=30.48 m) D = 5927/65 536, seconds 0.09044
Number of independent samples, ns 1120
Overlap 0.50
Sample length, seconds 70
Table 2. Channel signals
Channel Signal
[Polar angles from inlet]
1 Microphone 2 [10o]
2 Microphone 6 [30o]
3 Microphone 10 [50o]
4 Microphone 14 [70o]
5 Microphone 18 [90o]
6 Microphone 22 [110o]
7 Microphone 26 [130o]
8 Microphone 32 [160o]
9 CIP1
10 T551
11 T552
12 BPD1
13 BPD2
14 Raw N1 Speed
NASA/TM—2008-215157 13
Table 3. Signal propagation
time delay in counts
Microphone Percent Max. Power
Angle, Degrees 48 54 60
10 7800 7100 7100
30 7300 7200 7200
50 6800 6900 6900
70 6500 6600 6600
90 6300 6300 6300
110 6100 6100 6100
130 5900 5900 5900
160 5600 5600 5600
Table 4. Angular variation of
aligned and unaligned coherence of tone at 352 Hz
for TECH977 engine power condition setting of 48 percent
ghijkdlefimhnonpfmjlqjreCfjqemeridlefimhngsptreuv[Z\]>bCCc>Ccdefwfjqemeridlefimhnhrgsptreurjpdeiqejmxfjqemeridlefimhnhrgsptreurjpdev[Z\]>defw(d) Coherent output power at microphone at 10o usingC1P1 combustor pressure sensor.
Figure 6. TECH977 engine condition power setting of 48 percent microphone at 10o.
4567819236:5;<;=3:79>7?2�37>2:2?619236:5;4@=A?2BC(#)*�/��0��0123D37>2:2?619236:5;5?4@=A?2B?7=126>27:E37>2:2?619236:5;5?4@=A?2B?7=12C(#)*�123D(d) Coherent output power at microphone at 30o usingC1P1 combustor pressure sensor.
Figure 7. TECH977 engine condition power setting of 48 percent microphone at 30o.
ghijkdlefimhnonpfmjlqjreafjqemeridlefimhngsptreuv[\]>bC>acA>defwfjqemeridlefimhnhrgsptreurjpdeiqejmxfjqemeridlefimhnhrgsptreurjpdev[\]>defw(d) Coherent output power at microphone at 50o usingC1P1 combustor pressure sensor.
Figure 8. TECH977 engine condition power setting of 48 percent microphone at 50o.
345670812594:;:<2968=6>1 26=191>50812594:3?<@>1AB($)*�.�//���012C26=191>50812594:4>3?<@>1A>6<015=169D26=191>50812594:4>3?<@>1A>6<01B($)*�012C(d) Coherent output power at microphone at 70o usingC1P1 combustor pressure sensor.
Figure 9. TECH977 engine condition power setting of 48 percent microphone at 70o.
4567819236:5;<;=3:79>7?2.37>2:2?619236:5;4@=A?2BC()*+�/�0��,�123D37>2:2?619236:5;5?4@=A?2B?7=126>27:E37>2:2?619236:5;5?4@=A?2B?7=12C()*+�123D(d) Coherent output power at microphone at 90o usingC1P1 combustor pressure sensor.
Figure 10. TECH977 engine condition power setting of 48 percent microphone at 90o.
4567819236:5;<;=3:79>7?2�37>2:2?619236:5;4@=A?2BC(%)*�.�/-�0/123D37>2:2?619236:5;5?4@=A?2B?7=126>27:E37>2:2?619236:5;5?4@=A?2B?7=12C(%)*�123D(d) Coherent output power at microphone at 110o usingC1P1 combustor pressure sensor.
Figure 11. TECH977 engine condition power setting of 48 percent microphone at 110o.
(a) Coherence between microphone at 130o and C1P1combustor pressure sensor.
34567589:;<=> ?>> @>> A>> B>> C>>>DE FG
>H>>>C>H>>C>H>C>HCC IJKLMNOOPQMMRQSTUV?WWLOXOOYQZ[\]_TUabTcT_UTdIJKLOXONOOYZSTUef_[\]_TUabTcT_UTdIJKLOSTUe_a]STUabTcT_UTgbTacTg]U[\(b) Coherence between microphone at 130o and C1P1combustor pressure sensor.
hijkljmnopqrs tss uss vss wss xsssyz{||}~����z�����|��������������z��|
sxws�vs
������ss�v���v�s�s�sst�������� ¡¢£��¤s�ss�(c) Aligned cross-spectrum phase angle between micro-phone at 130o and C1P1 combustor pressure sensor.
ÔÕÖ×ØÑÙÒÓÖÚÕÛÜÛÝÓÚ×ÙÞ×ßÒÐÓ×ÞÒÚÒßÖÑÙÒÓÖÚÕÛÔàÝáßÒâãÇÈÉÊ°Ï°Ì°°±ÐÑÒÓÓ×ÞÒÚÒßÖÑÙÒÓÖÚÕÛÕßÔàÝáßÒâß×ÝÑÒÖÞÒ×ÚäÓ×ÞÒÚÒßÖÑÙÒÓÖÚÕÛÕßÔàÝáßÒâß×ÝÑÒãÇÈÉÊ°ÑÒÓå(d) Coherent output power at microphone at 130o usingC1P1 combustor pressure sensor.
Figure 12. TECH977 engine condition power setting of 48 percent microphone at 130o.
./012+3,-04/5657-413819,�-18,4,90+3,-04/5.:7;9,<="#$%�)��& *+,->-18,4,90+3,-04/5/9.:7;9,<917+,08,14?-18,4,90+3,-04/5/9.:7;9,<917+,="#$%�+,->(d) Coherent output power at microphone at 160o usingC1P1 combustor pressure sensor.
Figure 13. TECH977 engine condition power setting of 48 percent microphone at 160o.
./012+3,-04/5657-413819,�-18,4,90+3,-04/5.:7;9,<="#$%�*���))&+,->-18,4,90+3,-04/5/9.:7;9,<917+,08,14?-18,4,90+3,-04/5/9.:7;9,<917+,="#$%�+,->(d) Coherent output power at microphone at 10o usingcombustor pressure sensor, C1P1.
Figure 14. TECH977 engine condition power setting of 54 percent microphone at 10o.
/0123,4-.1506768.52492:-�.29-5-:1,4-.1506/;8<:-=>"#$%�*��+��),-.?.29-5-:1,4-.15060:/;8<:-=:28,[email protected]:1,4-.15060:/;8<:-=:28,->"#$%�,-.?(d) Coherent output power at microphone at 30o usingcombustor pressure sensor, C1P1.
Figure 15. TECH977 engine condition power setting of 54 percent microphone at 30o.
./012+3,-04/5657-413819,)-18,4,90+3,-04/5.:7;9,<="#$%�*��(���+,->-18,4,90+3,-04/5/9.:7;9,<917+,08,14?-18,4,90+3,-04/5/9.:7;9,<917+,="#$%�+,->(d) Coherent output power at microphone at 50o usingcombustor pressure sensor, C1P1.
Figure 16. TECH977 engine condition power setting of 54 percent microphone at 50o.
./012+3,-04/5657-413819, -18,4,90+3,-04/5.:7;9,<="#$%�)���*��+,->-18,4,90+3,-04/5/9.:7;9,<917+,08,14?-18,4,90+3,-04/5/9.:7;9,<917+,="#$%�+,->(d) Coherent output power at microphone at 70o usingcombustor pressure sensor, C1P1.
Figure 17. TECH977 engine condition power setting of 54 percent microphone at 70o.
./012+3,-04/5657-413819,(-18,4,90+3,-04/5.:7;9,<="#$%�)�*��&+,->-18,4,90+3,-04/5/9.:7;9,<917+,08,14?-18,4,90+3,-04/5/9.:7;9,<917+,="#$%�+,->(d) Coherent output power at microphone at 90o usingcombustor pressure sensor, C1P1.
Figure 18. TECH977 engine condition power setting of 54 percent microphone at 90o.
01234-5./2617879/635:3;.�/3:.6.;2-5./26170<9=;.>?#$%&�*�+)�,+-./*@/3:.6.;2-5./26171;0<9=;.>;39-.2:.36A/3:.6.;2-5./26171;0<9=;.>;39-.?#$%&�-./@(d) Coherent output power at microphone at 110o usingcombustor pressure sensor, C1P1.
Figure 19. TECH977 engine condition power setting of 54 percent microphone at 110o.
/0123,4-.1506768.52492:-+.29-5-:1,4-.1506/;8<:-=>"#$%�*�'���+,-.?.29-5-:1,4-.15060:/;8<:-=:28,[email protected]:1,4-.15060:/;8<:-=:28,->"#$%�,-.?(d) Coherent output power at microphone at 130o usingcombustor pressure sensor, C1P1.
Figure 20. TECH977 engine condition power setting of 54 percent microphone at 130o.
./012+3,-04/5657-413819,�-18,4,90+3,-04/5.:7;9,<="#$%�)��& *+,->-18,4,90+3,-04/5/9.:7;9,<917+,08,14?-18,4,90+3,-04/5/9.:7;9,<917+,="#$%�+,->(d) Coherent output power at microphone at 160o usingcombustor pressure sensor, C1P1.
Figure 21. TECH977 engine condition power setting of 54 percent microphone at 160o.
./012+3,-04/5657-413819,�-18,4,90+3,-04/5.:7;9,<="#$%�*���))&+,->-18,4,90+3,-04/5/9.:7;9,<917+,08,14?-18,4,90+3,-04/5/9.:7;9,<917+,="#$%�+,->(d) Coherent output power at microphone at 10o usingC1P1 combustor pressure sensor.
Figure 22. TECH977 engine condition power setting of 60 percent microphone at 10o.
/0123,4-.1506768.52492:-�.29-5-:1,4-.1506/;8<:-=>"#$%�*��+��),-.?.29-5-:1,4-.15060:/;8<:-=:28,[email protected]:1,4-.15060:/;8<:-=:28,->"#$%�,-.?(d) Coherent output power at microphone at 30o usingC1P1 combustor pressure sensor.
Figure 23. TECH977 engine condition power setting of 60 percent microphone at 30o.
./012+3,-04/5657-413819,)-18,4,90+3,-04/5.:7;9,<="#$%�*��(���+,->-18,4,90+3,-04/5/9.:7;9,<917+,08,14?-18,4,90+3,-04/5/9.:7;9,<917+,="#$%�+,->(d) Coherent output power at microphone at 50o usingC1P1 combustor pressure sensor.
Figure 24. TECH977 engine condition power setting of 60 percent microphone at 50o.
cdefghabeidjkjlbifhmfnaBbfmaianehabeidjcolpnaqrWXYZ@E@@_@DabsbfmaianehabeidjdncolpnaqnflaemafitbfmaianehabeidjdncolpnaqnflarWXYZ@abs(d) Coherent output power at microphone at 70o usingC1P1 combustor pressure sensor.
Figure 25. TECH977 engine condition power setting of 60 percent microphone at 70o.
./012+3,-04/5657-413819,(-18,4,90+3,-04/5.:7;9,<="#$%�)�*��&�+,->-18,4,90+3,-04/5/9.:7;9,<917+,08,14?-18,4,90+3,-04/5/9.:7;9,<917+,="#$%�+,->(d) Coherent output power at microphone at 90o usingC1P1 combustor pressure sensor.
Figure 26. TECH977 engine condition power setting of 60 percent microphone at 90o.
/0123,4-.1506768.52492:-�.29-5-:1,4-.1506/;8<:-=>"#$%�)�*(�+*,-.?.29-5-:1,4-.15060:/;8<:-=:28,[email protected]:1,4-.15060:/;8<:-=:28,->"#$%�,-.?(d) Coherent output power at microphone at 110o usingC1P1 combustor pressure sensor.
Figure 27. TECH977 engine condition power setting of 60 percent microphone at 110o.
/0123,4-.1506768.52492:-+.29-5-:1,4-.1506/;8<:-=>"#$%�*�'���+,-.?.29-5-:1,4-.15060:/;8<:-=:28,[email protected]:1,4-.15060:/;8<:-=:28,->"#$%�,-.?(d) Coherent output power at microphone at 130o usingC1P1 combustor pressure sensor.
Figure 28. TECH977 engine condition power setting of 60 percent microphone at 130o.
./012+3,-04/5657-413819,�-18,4,90+3,-04/5.:7;9,<="#$%�)��& *+,->-18,4,90+3,-04/5/9.:7;9,<917+,08,14?-18,4,90+3,-04/5/9.:7;9,<917+,="#$%�+,->(d) Coherent output power at microphone at 160o usingC1P1 combustor pressure sensor.
Figure 29. TECH977 engine condition power setting of 60 percent microphone at 160o.
(a) Coherence between microphone at 130o and C1P1combustor pressure sensor.
34567589:;<=> ?>> @>> A>> B>> C>>>DE FG
>H>>>C>H>>C>H>C>HCC IJKLMNOOPQMMRQSTUV?WWLOXOOYQNZ[\]T_UaTbTUTcIJKLOXOdQeNMSTUfgZ[\]T_UaTbTUTcIJKLOSTUf^\STUaTbTUThaTbTh\UZ[(b) Coherence between microphone at 130o and C1P1combustor pressure sensor.
ÕÖ×ØÙÒÚÓÔ×ÛÖÜÝÜÞÔÛØÚßØàÓÍÔØßÓÛÓà×ÒÚÓÔ×ÛÖÜÕáÞâàÓãäÈÉÊ˱бµÑÍÌÒÓÔåÔØßÓÛÓà×ÒÚÓÔ×ÛÖÜÖàÕáÞâàÓãàØÞÒÓ×ßÓØÛæÔØßÓÛÓà×ÒÚÓÔ×ÛÖÜÖàÕáÞâàÓãàØÞÒÓäÈÉÊ˱ÒÓÔå(d) Coherent output power at microphone at 130o usingC1P1 combustor pressure sensor.
Figure 30. DT = 5700/65536 = .086975 TECH977 engine condition power setting of 48 percent microphone at
(a) Coherence between microphone at 130o and combus-tor pressure sensor, C1P1.
34567589:;<=> ?>> @>> A>> B>> C>>>DE FG
>H>>>C>H>>C>H>C>HCC IJKLMNOOPQMMRQSTUV?WWLOXOOYQNZ[\]_abc_d_a_efghijkjlmnopq_arsZ[\]_abc_d_a_efthijq_arb\q_abc_d_a_uc_bd_u\aZ[(b) Coherence between microphone at 130o and combus-tor pressure sensor, C1P1.
âãäåæßçàáäèãéêéëáèåçìåíàÚáåìàèàíäßçàáäèãéâîëïíàðñÕÖ×ؾݾÂÁÞÚÙßàáòáåìàèàíäßçàáäèãéãíâîëïíàðíåëßàäìàåèóáåìàèàíäßçàáäèãéãíâîëïíàðíåëßàñÕÖ×ؾßàáò(d) Coherent output power at microphone at 130o usingcombustor pressure sensor, C1P1.
Figure 31. DT = 5700/65536 = .086975 TECH977 engine condition power setting of 54 percent microphone at
(a) Coherence between microphone at 130o and C1P1combustor pressure sensor.
34567589:;<=> ?>> @>> A>> B>> C>>>DE FG
>H>>>C>H>>C>H>C>HCC IJKLMNOOPQMMRQSTUV?WWLOXOOYQNZ[\]T_UaTbTUTcIJKLOXOdQeNMSTUfgZ[\]T_UaTbTUTcIJKLOSTUf^\STUaTbTUThaTbTh\UZ[(b) Coherence between microphone at 130o and C1P1combustor pressure sensor.
ÕÖ×ØÙÒÚÓÔ×ÛÖÜÝÜÞÔÛØÚßØàÓÍÔØßÓÛÓà×ÒÚÓÔ×ÛÖÜÕáÞâàÓãäÈÉÊ˱бµÑÍÌÒÓÔåÔØßÓÛÓà×ÒÚÓÔ×ÛÖÜÖàÕáÞâàÓãàØÞÒÓ×ßÓØÛæÔØßÓÛÓà×ÒÚÓÔ×ÛÖÜÖàÕáÞâàÓãàØÞÒÓäÈÉÊ˱ÒÓÔå(d) Coherent output power at microphone at 130o usingC1P1 combustor pressure sensor.
Figure 32. DT = 5700/65536 = .086975 TECH977 engine condition power setting of 60 percent microphone at
130o.
NASA/TM—2008-215157 47
REPORT DOCUMENTATION PAGE Form Approved OMB No. 0704-0188
The public reporting burden for this collection of information is estimated to average 1 hour per response, including the time for reviewing instructions, searching existing data sources, gathering and maintaining the data needed, and completing and reviewing the collection of information. Send comments regarding this burden estimate or any other aspect of this collection of information, including suggestions for reducing this burden, to Department of Defense, Washington Headquarters Services, Directorate for Information Operations and Reports (0704-0188), 1215 Jefferson Davis Highway, Suite 1204, Arlington, VA 22202-4302. Respondents should be aware that notwithstanding any other provision of law, no person shall be subject to any penalty for failing to comply with a collection of information if it does not display a currently valid OMB control number. PLEASE DO NOT RETURN YOUR FORM TO THE ABOVE ADDRESS. 1. REPORT DATE (DD-MM-YYYY) 01-05-2008
2. REPORT TYPE Technical Memorandum
3. DATES COVERED (From - To)
4. TITLE AND SUBTITLE Spectral Separation of the Turbofan Engine Coherent Combustion Noise Component
5a. CONTRACT NUMBER
5b. GRANT NUMBER
5c. PROGRAM ELEMENT NUMBER
6. AUTHOR(S) Miles, Jeffrey, Hilton
5d. PROJECT NUMBER
5e. TASK NUMBER
5f. WORK UNIT NUMBER WBS 561581.02.08.03.18.03
7. PERFORMING ORGANIZATION NAME(S) AND ADDRESS(ES) National Aeronautics and Space Administration John H. Glenn Research Center at Lewis Field Cleveland, Ohio 44135-3191
8. PERFORMING ORGANIZATION REPORT NUMBER E-16398
9. SPONSORING/MONITORING AGENCY NAME(S) AND ADDRESS(ES) National Aeronautics and Space Administration Washington, DC 20546-0001
10. SPONSORING/MONITORS ACRONYM(S) NASA
11. SPONSORING/MONITORING REPORT NUMBER NASA/TM-2008-215157; AIAA-2008-50
12. DISTRIBUTION/AVAILABILITY STATEMENT Unclassified-Unlimited Subject Category: 71 Available electronically at http://gltrs.grc.nasa.gov This publication is available from the NASA Center for AeroSpace Information, 301-621-0390
13. SUPPLEMENTARY NOTES
14. ABSTRACT The core noise components of a dual spool turbofan engine (Honeywell TECH977) were separated by the use of a coherence function. A source location technique based on adjusting the time delay between the combustor pressure sensor signal and the far-field microphone signal to maximize the coherence and remove as much variation of the phase angle with frequency as possible was used. While adjusting the time delay to maximize the coherence and minimize the cross spectrum phase angle variation with frequency, the discovery was made that for the 130° microphone a 90.027 ms time shift worked best for the frequency band from 0 to 200 Hz while a 86.975 ms time shift worked best for the frequency band from 200 to 400 Hz. Since the 0 to 200 Hz band signal took more time to travel the same distance, it is slower than the 200 to 400 Hz band signal. This suggests the 0 to 200 Hz coherent cross spectral density band is partly due to indirect combustion noise attributed to hot spots interacting with the turbine. The signal in the 200 to 400 Hz frequency band is attributed mostly to direct combustion noise. 15. SUBJECT TERMS Jet aircraft noise; Acoustic measurement; Combustion noise; Signal detection; Signal analysis core
16. SECURITY CLASSIFICATION OF: 17. LIMITATION OF ABSTRACT UU
18. NUMBER OF PAGES
53
19a. NAME OF RESPONSIBLE PERSON STI Help Desk (email:[email protected])
a. REPORT U
b. ABSTRACT U
c. THIS PAGE U
19b. TELEPHONE NUMBER (include area code) 301-621-0390
Standard Form 298 (Rev. 8-98)Prescribed by ANSI Std. Z39-18