Spectrophotometric determination of pH and its influence in soils Sima Bargrizan Thesis submitted to The University of Adelaide in fulfilment of the requirements for the degree of Doctor of Philosophy Faculty of Sciences School of Agriculture, Food and Wine The University of Adelaide February, 2019
Transcript
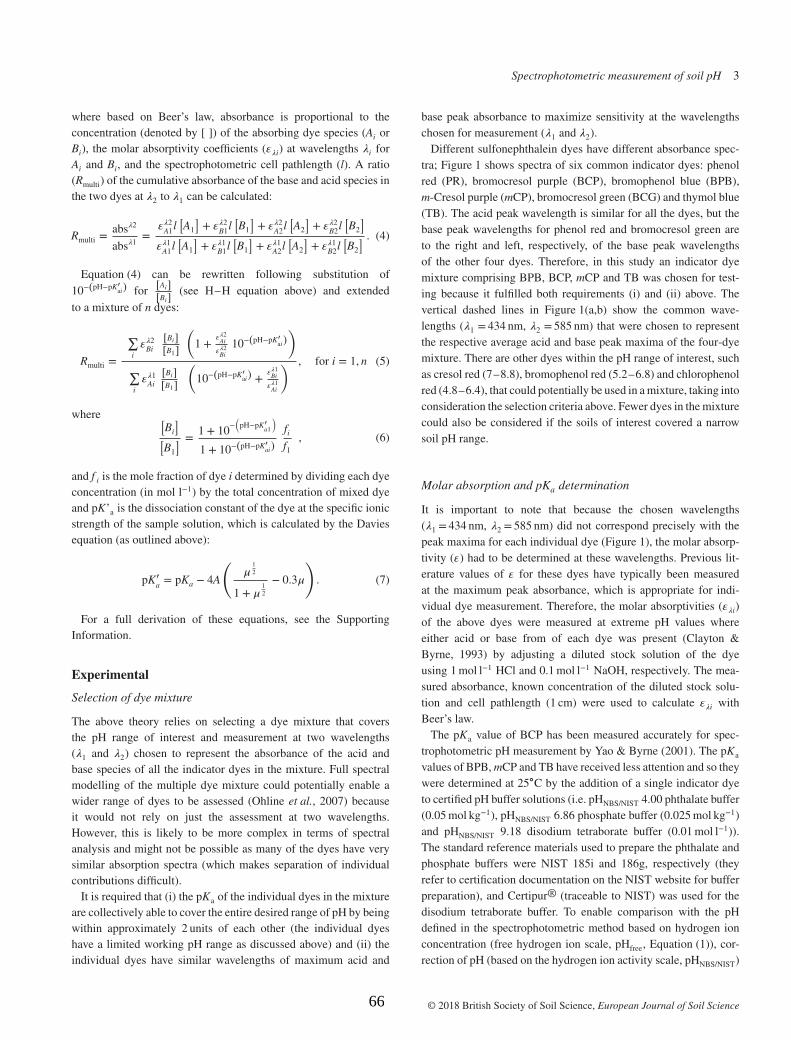
Spectrophotometric determination of pH
and its influence in soils
Sima Bargrizan
Thesis submitted to The University of Adelaide in fulfilment of the requirements for
the degree of Doctor of Philosophy
Faculty of Sciences
School of Agriculture, Food and Wine
The University of Adelaide
February, 2019
Dedicated to my family
I
Table of Contents
Abstract ................................................................................................................... III
Declaration .............................................................................................................. VI
Acknowledgements ............................................................................................... VII
List of publications .................................................................................................. IX
CHAPTER 1
Introduction and Review of Literature ...................................................................... 1
Development of a Spectrophotometric Method for Determining pH of Soil Extracts and Comparison
with Glass Electrode Measurements
Soil Chemistry
Soil pH measurement using conventional glass electrodes has several limi-tations. A spectrophotometric method was developed for determining soil pH involving indicator dye (bromocresol purple or phenol red) addition to soil extracts. Results were compared against values determined using a glass electrode for a range of soils (n = 13) with varying properties using differ-ent extraction conditions (1:1 w/v soil/water, 1:1 soil/0.01 mol L–1 CaCl2, 1:5 soil/water and 1:5 soil/0.01 mol L–1 CaCl2) and high and low ionic strength buffer calibrations of the electrode. For all extraction conditions, there was a strong relationship (r2 > 0.95, slope ≈ 1) between values of the spectrophoto-metric (pHspec) and glass electrode (pHelec) methods. The precision of pHspec was similar to pHelec measurements across the different extraction conditions (±0.02–0.08 average standard deviation of triplicate measurements, n = 39). Large and variable differences were observed between pHelec measured fol-lowing calibration with high (µ = 0.1 mol L–1) and low (µ = 0.005 mol L–1) ionic strength buffers. In contrast, ionic strength effects on the indicator dye and resulting pHspec calculation are implicitly accounted for. A spectropho-tometric reflectance probe in situ method was also successfully trialed. The spectrophotometric pH method circumvents many of the problems associated with the use of glass electrodes in soil solutions.
Soil pH is a very important controller of chemical and biological processes in soils. Accurate measurement of pH is needed for prediction of metal ion binding to oxide minerals, which occurs in relatively narrow pH ranges
(Sauve et al., 2000; Wiesner et al., 2006). Equilibria among inorganic carbon spe-cies are also controlled by pH in soils (Suarez, 1977), and there is currently a need for better quantifying inorganic carbon fluxes to and from soils in the context of global climate change (Bond-Lamberty and Thomson, 2010). Nutrient availabil-ity and microbial activity in the soil are also influenced by pH, and many farm management practices (e.g., liming, fertilizer application) are dependent on, and/or influence, pH measurements (Miller and Kissel, 2010).
Historically, soil pH determination has typically involved extraction of the soil in a simple solution (e.g., water, dilute CaCl2) at a particular soil/solution ratio (e.g., 1:1, 1:2 or 1:5 w/v) followed by measurement using a glass electrode calibrated with buffer solutions (Heintze, 1934; Rayment and Lyons, 2011). However there are several potential issues associated with using glass electrodes to measure pH in soil extracts. First, the two main components of the glass electrode, namely the reference and the membrane glass electrode, are connected by a salt bridge of saturated KCl solution. An inherent but unquantifiable source of measurement error arises from the potential at the liquid junction between the two internal solutions surrounding the two electrodes (Manov et al., 1944; Skoog et al., 2007). This can cause errors of the order of 0.1 pH units, and is generally greatest when the solution used to cali-
Sima Bargrizan Ronald J. Smernik
School of Agriculture, Food and Wine Univ. of Adelaide South Australia, 5005 Australia
Luke M. Mosley*Acid Sulfate Soils Centre School of Biological Sciences Univ. of Adelaide South Australia, 5005 Australia
Core Ideas
•Soil pH is a critical parameter in soils as it influences many biogeochemical processes.
•There are problems in pH measurements in soils using glass electrodes.
•A new spectrophotometric method was developed to measure pH in soils.
•The method compared well to measurements using glass electrodes in a range of soils.
•A reflectance probe technique was also successfully trialed for in situ measurement.
Published online January 4, 2018
28
www.soils.org/publications/sssaj 1351
Soil Chemistry
brate the electrode has a different ionic composition to that of the sample solution, especially for samples with low (<0.003 mol L–1 or approximately <0.24 mS cm–1 electrical conductivity in ex-tract) ionic strength (Millero, 1986). Wiesner et al. (2006) found that to eliminate errors in soil pH measurement, and associated metal adsoprtion prediction errors, electrodes needed to be cali-brated with buffers prepared with the same electrolyte and ionic strength as samples. This is often impractical due to the range of ionic strengths and electrolyte compositions found in different soils and hence is not usually performed. Second, K+ and Cl− mo-bility across the salt bridge may be different between soils with high and low cation exchange capacity (CEC) and this can lead to a lower or higher pH readings, respectively (Essington, 2015). To stabilize electrodes, CaCl2 is commonly used as an extractant solution for soil pH measurements (Rayment and Lyons, 2011). The addition of CaCl2 commonly reduces the soil pH relative to when water is used as an extractant (Miller and Kissel, 2010), which has been proposed to be due to the added Ca2+ displac-ing protons from soil cation exchange sites (Conyers and Davey, 1988). Hence in stabilizing electrodes, an error is introduced rela-tive to the true soil pH and the magnitude of this error is variable between different soil types. Third, the porous fiber of pH elec-trodes can become clogged, limiting the flow of liquid from the salt bridge into the solution, resulting in slow equilibration and ultimately an inaccurate pH measurement (Skoog et al., 2007). Fourthly, electrode pH measurements can suffer problems with drift (e.g., on order of –0.01 to –0.03 pH units per day, Yuan and DeGrandpre, 2008).
Substantial progress has been made in developing spec-trophotometric methods for measuring the pH of seawater (Robert-Baldo et al., 1985; Clayton and Byrne, 1993), estuarine water (Mosley et al., 2004) and freshwater (Yao and Byrne, 2001; French et al., 2002; Lai et al., 2016). In the spectrophotometric method, an acid-base indicator dye is added to the sample, and the absorbance readings of conjugate acidic and basic dye species at different wavelengths are measured and used to calculate pH. Many of the inherent problems associated with glass electrode pH measurement (e.g., liquid junction potential, drift) can be avoid-ed using this method. Also, calibrating buffers are not required in the spectrophotometric method once the dissociation constants and molar absorptivities of the dye are determined in the salinity and temperature range of interest. Spectrophotometric pH mea-surements also have a higher precision than glass electrode mea-surements (e.g., variance in replicate measurements of ±0.0004 and ±0.0005 pH units respectively for seawater (Clayton and Byrne, 1993); ±0.001 to 0.01 respectively for estuarine water and freshwater (Yao and Byrne, 2001; Lai et al., 2016).
Indicator dyes have been used previously to determine the pH of soils using colorimetric methods (Snyder, 1935; Raupach and Tucker, 1959). In the Snyder (1935) approach, an individual indicator dye was added to a centrifuged soil extract and the color compared to prepared color standards representing different pH values. In the Raupach and Tucker (1959) approach, a mixed in-dicator dye solution was combined with the soil, the soil dusted
with white barium sulfate powder (to highlight color), and the color compared visually to a standard color chart (Raupach and Tucker, 1959; Rayment and Lyons, 2011). The indicator pH mea-surements generally compared quite well to glass electrode mea-surements in 1:5 soil/water suspensions (Raupach and Tucker, 1959). However, the standard color charts used in these soil pH colorimetric methods have a much lower accuracy (±0.5 pH units) than glass electrode methods (±0.1 pH units with careful calibration) (Rayment and Lyons, 2011). Another potential issue with the Raupach and Tucker method is that the barium sulfate and concentrated dye solution addition to the soil may introduce a pH perturbation which was not assessed in its development.
The aim of this study was to examine whether the use of indicator dyes in combination with modern spectrophotometric methods can be used for determination of pH in soil extracts. Two sulfonephthalein indicators, bromocresol purple and phe-nol red, were used for spectrophotometric pH measurement in the approximate soil pH range of 5 to 8.5. The performance of spectrophotometric and electrode methods was compared for pH measurement in both water and CaCl2 extracts at different soil/extractant ratios for a range of different soils.
MATERIALS AnD METHODSSoils and preparation of Soil Extracts
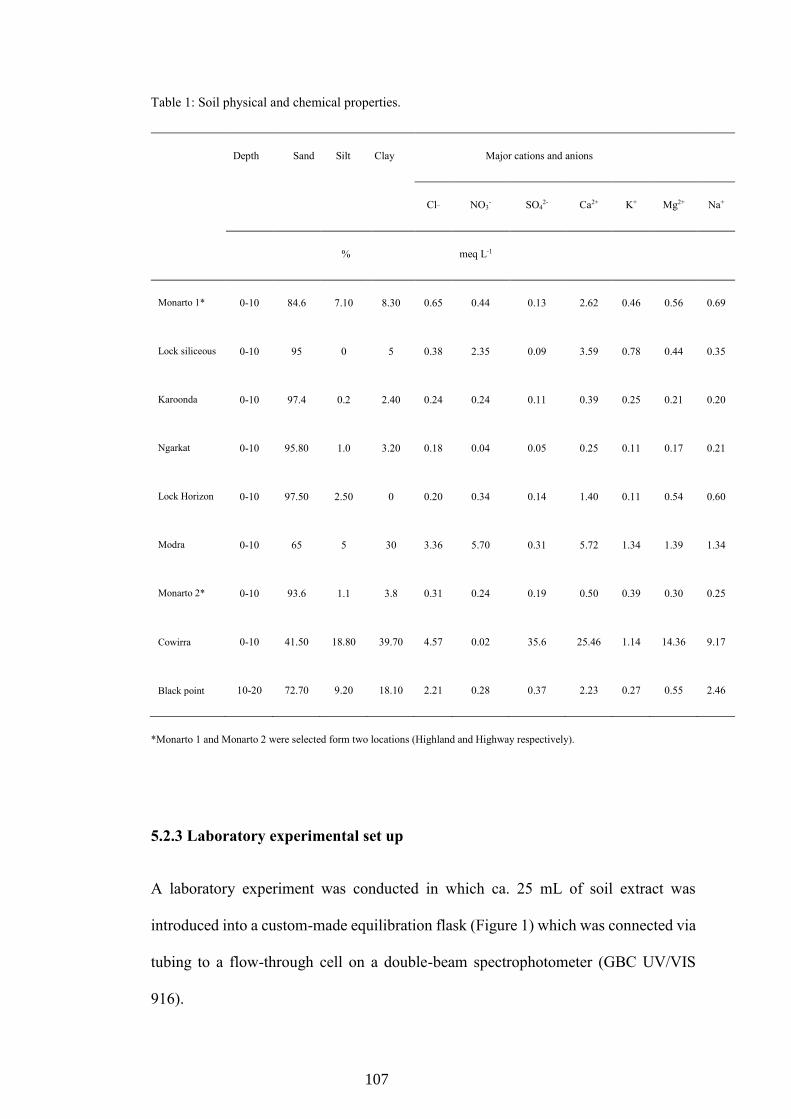
Thirteen soils with a wide range of properties (Table 1) were utilized in the study. These soils were collected from various locations in South Australia, mostly collected from the surface (0–10 cm) layer, although four samples were included from a 0- to 55-cm depth profile at one site (Mobilong). The soils were oven-dried and sieved to obtain a <2 mm size fraction.
Four different soil extracts were prepared from each soil (1:1 w/v 25 g soil/25 mL water, 1:1 w/v 25 g soil/25 mL 0.01 mol L–1 CaCl2, 1:5 w/v 5 g soil/25 mL water, 1:5 w/v 5 g soil/25 mL 0.01 mol L–1 CaCl2). Three replicates of each soil and soil ratio/extract mixture were prepared. The soil solutions were shaken for 1 h on an orbital shaker, and then centrifuged (1915.2 relative centrifugal force) for 30 min as per standard methods (Rayment and Lyons, 2011). After centrifuging, approximately 10 mL of the soil extract supernatant was carefully pipetted into a clean polyethylene tube for immediate analysis.
Spectrophotometric Soil pH MeasurementThe spectrophotometric pH method is based on measure-
ment of the dissociation of a protonated (acid) indicator dye spe-cies (HI−) to its unprotonated (base) form (I2−) (Robert-Baldo et al., 1985; Clayton and Byrne, 1993):
HI−
I2− + H+ [1]The equilibrium constant (K2, second dissociation constant
for the fully protonated dye species H2I) for this equation can be defined as:
K2 = [H+][I2–]/[HI–] [2]
29
1352 Soil Science Society of America Journal
The pH on the free hydrogen ion concentration (mol H+ kg–1) scale is obtained from the following equation (Yao and Byrne, 2001):
( )( )
1/21
2 1/22 3
pH log[ H ] pK log 4 0.31
R eA
e Rem
mm
+ − = − = + − − − +
[3]
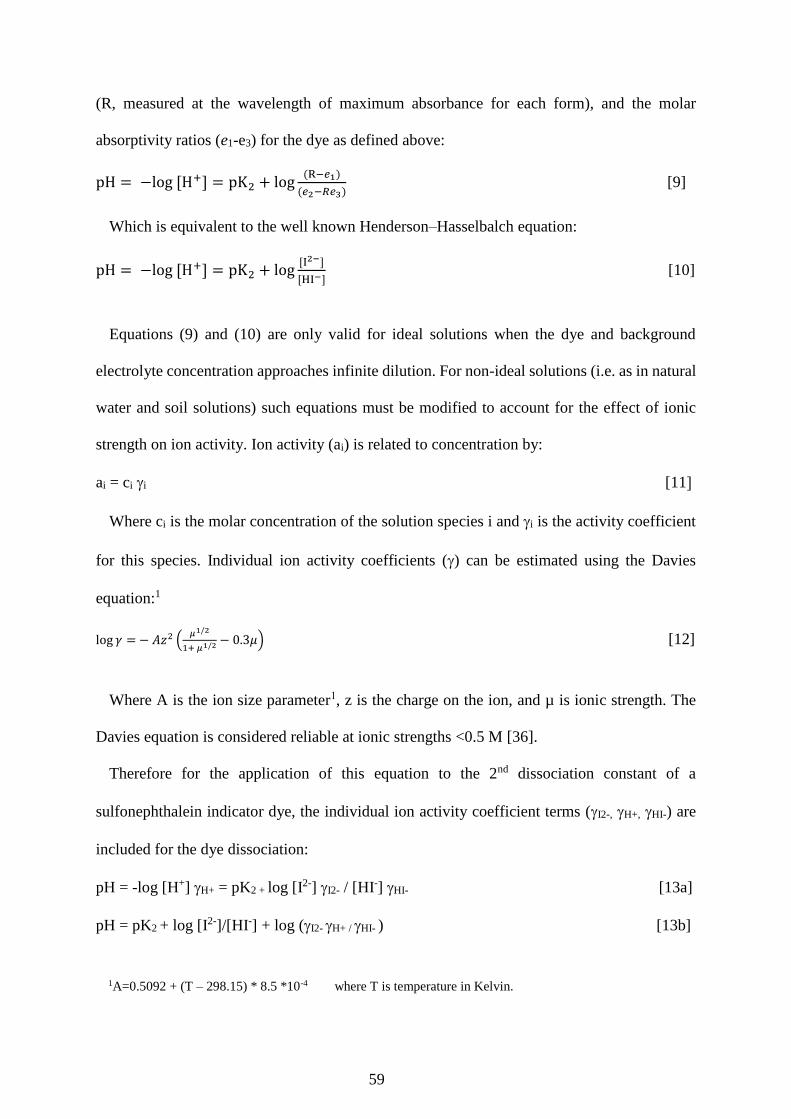
where pK2 = –log K2; R is the ratio of light absorbance (Abs.) at the absorbance maxima of base (I2−, l2) and acid (HI−, l1) dye forms respectively (R = l2Abs./l1Abs.); e1 to e3 denote in-dicator molar absorbance ratios which are constants based on an individual dye’s absorbance characteristics; the last term is the Davies equation for correcting for ionic strength effects on ion activity where m is ionic strength (mol L–1), which is applicable to <0.5 mol L–1 solutions (Stumm and Morgan, 1996); and A = 0.5092 + (T – 298.15) × 8.5 × 10−4 where T is the temperature in kelvin. The Supplemental Material contains a full derivation and explanation of the spectrophotometric method theory.
Bromocresol purple and phenol red dye stock solutions were prepared at a concentration of 3 × 10⁻³ mol L–1 and adjusted to a pH where approximately equal concentrations of acid and base forms were present (pH ≈ 7.5 and 5.9 for phenol red and bromo-cresol purple, respectively) using 0.1 mol L–1 HCl and NaOH. Indicators were not specifically tested for the potential impurities present in this study either but the magnitude of the pH errors these introduce (<0.01 pH units, Mosley et al., 2004) are not ex-pected to be important for the large pH ranges found in soil.
UV-visible spectra were collected using matched glass cu-vettes with a 1-cm path length on a double-beam spectropho-tometer (GBC UV/VIS 916) equipped with Cintral software. The ratio of indicator absorbances (R) at their absorbance maxi-ma were determined from these spectra. For phenol red, the acid and base indicator species were measured at wavelengths of 433 nm (l1) and 558 nm (l2), respectively. For bromocresol purple, the acid and base indicator species were measured at wavelengths of 432 nm (l1) and 589 nm (l2), respectively.
A spectrophotometric cell holder equipped with a water thermostat maintained the cuvette solution temperature at 25°C.
Before measurement, sample tubes were placed in a separate water bath adjusted to 25°C to pre-equilibrate for approximately 30 min. After temperature equilibration, 4 mL of sample and 0.03 mL of dye stock was pipetted into the cuvette, which was capped, invert-ed to mix the dye, and placed in the spectrophotometer. Sample solution without dye was placed in the reference beam of the in-strument. The full absorbance spectra with and without dye was recorded between 350 and 750 nm (example spectra in Fig. 1a).
To account for any minor pH perturbation following dye ad-dition, the ratio R used for pH calculation (Eq. [3]) was that ex-trapolated to zero dye addition via linear regression of the R val-ues calculated for three sequential dye additions versus the volume (0.03, 0.06, 0.09 mL) of dye addition (Clayton and Byrne, 1993) (example shown in Fig. 1b). Addition of these volumes of dye gave a final dye concentration in the range of approximately 2 × 10⁻⁵ to 6 × 10⁻⁵ mol L–1 (refer to Fig. 1a for the corresponding absorbance values). Three replicates were analyzed for each extract. The respec-tive molar absorbance ratios of e1 to e3 and thermodynamic dis-sociation constants (pK2) of the two (phenol red and bromocresol purple) indicator dyes (Eq. [4] and [5]) at 25°C used for the pH cal-culations were those previously reported by Yao and Byrne (2001).
pK2 = 5.798 + 666.7/T (phenol red) [4]
pK2 = 5.226 + 378.1/T (bromocresol purple) [5]
where T is the temperature in kelvin, and the pK2 values are at infinite dilution for impure indicators.
Ionic strength (m) was calculated from measured electrical conductivity (EC, mS cm–1) in each soil solution using a calibrat-ed conductivity electrode (TPS Glass K = 1.0 Cond Sensor) using the equation (Griffin and Jurinak, 1973; Gillman and Bell, 1978):
m = EC x 0.0127 [6]
To assess the accuracy of the spectrophotometric method in the absence of soil, a standard phosphate buffer solution was
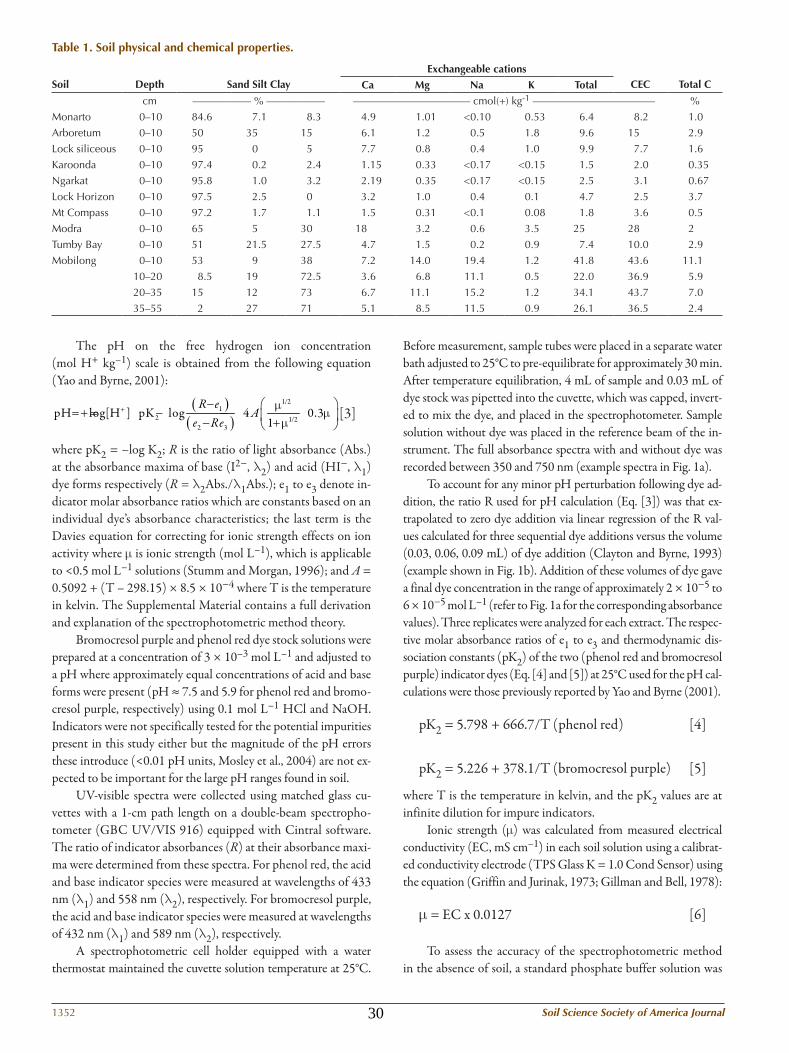
Table 1. Soil physical and chemical properties.
Soil
Depth
Sand Silt Clay
Exchangeable cations CEC
Total CCa Mg na k Total
cm ––––––––––– % ––––––––––– –––––––––––––––––––––– cmol(+) kg-1 ––––––––––––––––––––––– %
prepared (NIST Standard Reference Material 186 g, refer to certification documentation on NIST website for details). The phosphate buffer had a certified pH = 6.77 on the free hydrogen ion concentration pH scale (pH 6.86 on NIST/NBS pH scale based on hydrogen ion activity as provided by the NIST certi-fication and Bates and Acree, 1945; refer to Eq. [7] below for detail on this conversion). A spectrophotometric pH = 6.772 ± 0.002 was measured for this buffer which indicated the method was accurate in the absence of soil.
glass Electrode Soil pH MeasurementThe pH of each of the soil extracts was concurrently moni-
tored with pH electrodes (Orion SureFlow) connected to a TPS model pH meter after calibration with two different ionic strength buffers: one low ionic strength buffer (m = 0.005 mol L–1) using potassium hydrogen phthalate and dihydrogen/hydrogen phosphate NIST buffers at approximately pH 4.0 and pH 6.86, respectively, and commercially manufactured (Australian Chemical Reagents) standard high ionic strength buffers (m ≈ 0.1 mol L–1) at pH 7 and 4 at 25°C. Three replicates of each sample were analyzed at 25°C as per the spectrophoto-metric measurements.
The pH measured using the glass electrode is defined on the NBS/NIST scale as pHNBS/NIST = –log aH+, where aH+ is the hydrogen ion activity. To enable comparison between the pH values obtained by the spectrophotometric method, the NIST/
NBS pH electrode measurements were corrected to the hydrogen ion concentration scale (pHfree) using the equation:
pHfree = –log[H+] = pHNBS/NIST + loggH+ [7]
where the activity coefficient for H+ (gH+) was calculated via the Davies equation (refer to the Supplemental Material Eq. [12]) using the ionic strength of the soil extract measured as outlined above.
Reflectance probe in situ Soil pH Measurement
The spectrophotometric pH measurement method was also tested in reflectance mode following dye application directly to 1:1 soil/water mixtures. A StellarNet Black Comet spectrometer with a R600-8-visible-near infrared fiber optic reflectance probe for VIS-NIR was utilized. During reflectance measurements the seven exterior fibers on the fiber optic probe are illuminated by a high
output power light source and the single interior read fiber collects the reflected light and returns the signal to the spectrometer. To test the method, 1:1 soil/water mixtures of Mobilong and Tumby Bay soil samples were prepared but not centrifuged. A reference spectrum (350–750 nm) was collected of the soil mixture in the absence of dye. The phenol red and bromocresol purple dye stock solution (approximately 0.12 mL) was then mixed directly into the 1:1 soil mixture, the reflectance spectrum recorded and the reference spectrum subtracted. The pHspec was then calculated as described above.
RESuLTSComparison of Spectrophotometric and glass Electrode pH Measurements
The relationship between pH values determined by spec-trophotometric and glass electrode (calibrated with high ionic strength buffer at 25°C) methods across the 13 soils (pH range approximately 5−8.5) for the four different soil extract condi-tions is shown in Fig. 2. There was a strong linear correlation between pHelec and pHspec in 1:1 water (y = 0.9626x + 0.3111, r2 = 0.9916), 1:5 water (y = 0.9599x + 0.258, r2 = 0.989), 1:1 0.01 mol L–1 CaCl2 (y = 0.9966x + 0.1128, r2 = 0.9887), and 1:5 0.01 mol L–1 CaCl2 (y = 0.9717x + 0.2148, r2 = 0.9802) extracts. In general, samples plotted close to the linear (pHspec vs. pHelec) regression line although there is some deviation for some soils. Figure 3 shows the difference between spectrophotomet-
Fig. 1. (a) Absorbance vs. wavelength for base (I2–) and acid (HI–) forms of phenol red (pR) in a 1:1 soil extract before and after addition of 0.03, 0.06 and 0.09 mL of dye; (b) plot of the absorbance ratio (R) in the Modra 1:1 soil/water soil extract following sequential addition of 0.03, 0.06 and 0.09 mL dye solution. A linear equation is fitted with the y-intercept taken to represent the R value at zero dye addition.
31
1354 Soil Science Society of America Journal
ric and electrode pH measurements calibrated with high ionic strength buffers is generally within ± 0.2 pH units.
Calibration of the pH electrode with different (low vs. high) ionic strength buffers gave different pH readings for the same soil extract (Fig. 3). The pH readings from the electrode calibrated with the low ionic strength buffer were generally lower (approximately 0.1–0.8 pH units) than the spectrophotometric pH readings respectively (Fig. 3). This was a much larger differ-ence than the difference between pH values determined by spec-trophotometric pH readings and pH readings with the electrode calibrated with high ionic strength buffers (Fig. 3). This is also reflected in a greater divergence (lower slope) from the linear regression line (Supplemental Fig. S1) compared with the high ionic strength buffer calibration results (Fig. 2).
Effect of Soil Extractant Solutions on pH in Individual Soils
Spectrophotometric and glass electrode mean pH values for all soils and every combination of soil/solution ratio and extract-ant are shown in Table 2. The standard deviation of triplicate pH measurements for individual soils and extractant ratios/solutions was generally small and similar for each measurement technique (approximately ±0.02 to 0.08 pH units, refer to Table 2). Similar
patterns can be seen for most soil samples when comparing val-ues determined for the four different extraction conditions. In general, pH was slightly lower for 1:1 water extracts than for 1:5 water extracts. Large differences (up to 1 pH unit) were observed between water and CaCl2 extracts, with CaCl2 generally de-creasing the pH. The soil/solution ratio (1:1 vs. 1:5) had a much smaller effect on pH for CaCl2 extracts than for water extracts.
For soils with a low EC (e.g., Mt Compass 0.16 mS cm–1, Monarto 0.31 mS cm–1; refer to Supplemental Table S1), the dif-ference in pH between CaCl2 and water extracts was relatively large, on the order of 0.2 to 1 pH units. On the other hand, for the Mobilong soils, which had high EC values of 8.2 to 68.3 (mS cm–1) (Supplemental Table S1), the difference in pH between CaCl2 and water extracts was smaller (0.0003 to 0.1 units) for both 1:1 and 1:5 extracts (Table 2).
Measuring in situ Soil pH with a Spectrophotometric Reflectance probe
Absorbance spectra measured using a reflectance probe for two samples where dye solution was directly applied to the 1:1 soil/water mixture are shown in Fig. 4. The in situ soil pH de-termined using the reflectance probe was 7.71 and 5.85 for the Monarto and Tumby soils, respectively; there were differences
Fig. 2. Comparison of spectrophotometric and glass electrode pH measurements (calibrated with high ionic strength commercial buffer) for different soil extractant solutions: (a) 1:1 water, (b) 1:5 water, (c) 1:1 0.01 mol L–1 CaCl2 and (d) 1:5 0.01 mol L–1 CaCl2.
32
www.soils.org/publications/sssaj 1355
of 0.03 to 0.27 pH units compared to the pH measured on the centrifuged soil extract using the bench spectrophotometer (pH = 7.98 and 5.82 on the 1:1 soil/water extract, respectively). The reflectance spectra appear noisier at wavelengths <450 nm than the corresponding absorbance spectra of the centrifuged extracts (compare Fig. 4c-d with Fig. 4a-b, respectively). This noise is due to a higher and more variable background absorbance from the soil matrix, and, while this is corrected for by subtracting the reference spectrum (i.e., the reflectance spectrum of the corre-sponding 1:1 soil/water mixture without added dye) in the soft-ware, it introduced greater uncertainty in determining R values.
was developed in this study. The new method produced pH values that correlated strongly (r2 > 0.95) with conventional soil pH measurements determined using a glass electrode in 1:1 and 1:5 soil/water and soil/CaCl2 extracts. This indicates the spectrophotometric method is a viable alternative to the widely used electrode method, providing very similar results, and can be readily applied to a wide range of soils using conventional extrac-tion procedures. The indicator dyes used (bromocresol purple and phenol red) provide the ability to measure soil pH in the range of 5 to 8.5, which is within the typical range of many soils. However, the method can be readily adapted for use with dif-ferent indicator dyes to expand this pH range (e.g., bromocresol
green for acidic soils, thymol blue for alkaline soils). Use of a mix-ture of dyes would also be worth testing. Indeed, the Raupach and Tucker (1959) color chart technique already uses a mixed indicator dye solution to provide a wider pH range and it would be useful to couple use of mixed dyes with the greatly improved precision that spectrophotometric measurement provides.
The average standard deviation of triplicate measurements using the spectrophotometric method was comparable to that for the electrode method (approximately ±0.08 pH units). This pre-cision is less than has been achieved for spectrophotometric pH measurement in natural waters (<0.01 units; Clayton and Byrne, 1993; French et al., 2002; Mosley et al., 2004). We also undertook repeated measurements of a single soil extract split into five repli-cates which gave an improved precision of ±0.01 pH units. This indicates the lower precision of the spectrophotometric method in soils is due to additional processing steps required such as weighing out the soil, adding extractant solutions, shaking, cen-trifuging, storing of extracted samples and potential degassing of the CO2 of the samples (Zabowski and Sletten, 1991).
The accuracy of the spectrophotometric method relative to the glass electrode method cannot be readily assessed as there is no independently measured and certified pH standard for soils. It would be useful to determine if the differences in pH between electrode and spectrophotometric methods are significant with respect to thermodynamic (equilibria) calculations (e.g., via si-multaneous measurement of inorganic carbonate equilibria and
Fig. 3. pH difference between the spectrophotometric and glass electrode methods calibrated with buffer ≈ 0.1 mol L–1 (elec H) and with buffer ≈ 0.005 mol L–1 (elec L) versus spectrophotometric pH values for different soil/solutions: (a) 1:1 water, (b) 1:5 water, (c) 1:1 0.01 mol L–1 CaCl2 and (d) 1:5 0.01 mol L–1 CaCl2.
33
1356 Soil Science Society of America Journal
calculating pH). The relatively good comparison which was found in this study between electrode and spectrophotometric measurements may have been due in part to very careful mea-surement protocols (e.g., temperature control, electrodes with free flowing junctions designed for soil). Less care in making electrode measurements may produce higher discrepancies.
The spectrophotometric method has some potential ad-vantages compared to soil electrode measurements. The spectro-photometric method does not require the addition of stabilizing electrolytes (although it has been demonstrated that it can also perform well in 0.01 mol L–1 CaCl2 extracts). Hence spectro-photometric measurements may more closely estimate the true pH of the soil (rather than an arbitrary pH after addition of cat-ions such as Ca2+) across a wide range of soil salinities. The spec-trophotometric pH measurements do not suffer from drift and/or errors associated with the “suspension effect” arising from glass electrodes being in contact with soil mixtures. Markedly different pHelec readings (Fig. 3) were obtained in soils depend-ing on the ionic strength of the buffer solution the electrode was calibrated in, and the low ionic strength buffer calibrated elec-trode measurements showed poorer agreement with the spectro-photometric pH. This variability suggests that liquid junction errors were likely occurring. This is consistent with the findings of other researchers (Bates and Popovych, 1981; Covington et al., 1983; Davison and Woof, 1985). Hence another key ad-vantage of the spectrophotometric method is that it does not require calibration at different ionic strengths as the impact of the sample’s ionic strength on the indicator dye dissociation con-stant can be corrected for by use of the Davies equation (Eq. [3], used at <0.5 mol L–1 ionic strength, EC of <40 mS cm–1), while for the glass electrode method, calibration of the pH meter with the same ionic strength buffer as samples is necessary to achieve accurate measurements (Wiesner et al., 2006). Due to the diffi-culty and time consuming process of making different buffers to match soil solution composition, such calibrations are typically not performed in practice (Miller and Kissel, 2010). Hence the spectrophotometric method can be more readily applied to soils with a wide range of salinities.
The effect of different extraction conditions was also as-sessed for individual soils and the spectrophotometric pH results showed similar trends to the electrode method. The measured pH generally increased when the soil/water ratio was changed from 1:1 to 1:5. This appears to be due to dilution effects in agreement with the findings of Keaton (1938). In samples with low ionic strength, use of CaCl2 as extractant caused a large decrease in soil pH which is also consistent with previous re-search that found a difference in pH values between water and CaCl2 extracts of up to 1 pH unit (Miller and Kissel, 2010; Rayment and Lyons, 2011). However, for soils with high ionic strength (e.g., those from Mobilong), pH values determined on CaCl2 extracts were quite close to those of water extracts. This is in agreement with the results of Kissel et al. (2009) who re-ported a difference of less than 0.2 pH units for soils with high ionic strength. The small differences observed for high ionic
Tabl
e 2.
Mea
n an
d st
anda
rd d
evia
tion
(SD
) of
pH
mea
sure
d w
ith
glas
s el
ectr
ode
(pH
elec
H, L
, at
high
and
low
ioni
c st
reng
th b
uffe
r) a
nd w
ith
spec
trop
hoto
met
ry (
pHsp
ec).
Soil
1:1
wat
er1:
5 w
ater
1:1
CaC
l 21:
5 C
aCl 2
pH e
lec
H ±
SD
pH e
lec
LpH
spec
pH e
lec
H ±
SD
pH e
lec
LpH
spec
pH e
lec
H ±
SD
pH e
lec
LpH
spec
pH e
lec
H ±
SD
pH e
lec
LpH
spec
Arb
oret
um6.
16 ±
0.0
56.
05 ±
0.0
46.
22 ±
0.0
76.
42 ±
0.0
26.
38 ±
0.0
36.
53 ±
0.0
55.
55 ±
0.0
25.
26 ±
0.0
25.
72 ±
0.0
15.
44 ±
0.0
15.
18 ±
0.0
05.
60 ±
0.0
2
Mon
arto
8.03
± 0
.01
8.18
± 0
.01
8.02
± 0
.01
8.37
± 0
.03
8.55
± 0
.08
8.23
± 0
.00
7.48
± 0
.01
7.58
± 0
.01
7.54
± 0
.01
7.43
± 0
.06
7.52
± 0
.07
7.38
± 0
.03
Lock
Sili
ceou
s8.
09 ±
0.0
38.
26 ±
0.0
27.
98 ±
0.0
18.
26 ±
0.0
48.
46 ±
0.1
38.
13 ±
0.0
67.
63 ±
0.0
17.
74 ±
0.0
07.
64 ±
0.0
37.
40 ±
0.2
17.
59 ±
0.0
37.
43 ±
0.0
8
Karo
onda
6.02
± 0
.05
5.88
± 0
.07
6.14
± 0
.08
6.25
± 0
.02
6.18
± 0
.03
6.30
± 0
.02
5.36
± 0
.05
5.06
± 0
.03
5.5
± 0.
075.
40 ±
0.1
25.
13 ±
0.1
45.
59 ±
0.1
5
Nga
rkat
6.64
± 0
.01
6.54
± 0
.01
6.82
± 0
.03
6.52
± 0
.09
6.35
± 0
.16
6.60
± 0
.05
5.75
± 0
.04
5.54
± 0
.06
5.98
± 0
.06
5.66
± 0
.01
5.38
± 0
.01
5.91
± 0
.00
Lock
Hor
izon
B8.
58 ±
0.0
48.
63 ±
0.1
18.
53 ±
0.0
29.
06 ±
0.0
39.
33 ±
0.0
49.
06 ±
0.0
77.
68 ±
0.0
57.
67 ±
0.0
57.
67 ±
0.0
37.
52 ±
0.1
07.
41 ±
0.1
67.
57 ±
0.1
7
Mt C
ompa
ss4.
83 ±
0.0
34.
37 ±
0.0
44.
91 ±
0.0
15.
27 ±
0.0
54.
86 ±
0.0
35.
47 ±
0.1
53.
84 ±
0.0
13.
13 ±
0.0
23.
82 ±
0.1
04.
01 ±
0.0
23.
35 ±
0.0
44.
09 ±
0.0
7
Mod
ra7.
13 ±
0.1
56.
80 ±
0.1
77.
33 ±
0.1
67.
18 ±
0.0
36.
94 ±
0.0
47.
20 ±
0.0
56.
89 ±
0.0
16.
65 ±
0.0
26.
97 ±
0.0
06.
72 ±
0.0
36.
47 ±
0.0
66.
76 ±
0.0
3
Tum
by5.
78 ±
0.0
85.
39 ±
0.1
25.
92 ±
0.1
16.
26 ±
0.0
65.
83 ±
0.0
46.
30 ±
0.0
55.
28 ±
0.0
54.
70 ±
0.0
15.
21 ±
0.1
75.
34 ±
0.0
34.
70 ±
0.0
15.
27 ±
0.1
0
Mob
ilong
(5–1
0 cm
)6.
32 ±
0.2
15.
89 ±
0.2
46.
50 ±
0.2
16.
43 ±
0.1
16.
00 ±
0.1
56.
32 ±
0.0
76.
32 ±
0.0
35.
96 ±
0.0
36.
63 ±
0.1
06.
47 ±
0.0
76.
07 ±
0.1
16.
64 ±
0.0
5
Mob
ilong
(10–
20 c
m)
6.10
± 0
.01
5.58
± 0
.04
6.15
± 0
.04
6.36
± 0
.03
5.95
± 0
.02
6.21
± 0
.02
6.12
± 0
.02
5.67
± 0
.02
6.19
± 0
.10
6.29
± 0
.11
5.54
± 0
.14
6.19
± 0
.08
Mob
ilong
(20–
35 c
m)
5.96
± 0
.13
5.27
± 0
.09
6.00
± 0
.06
6.02
± 0
.08
5.3
± 0.
145.
91 ±
0.0
55.
81 ±
0.0
85.
19 ±
0.1
05.
92 ±
0.0
26.
03 ±
0.0
25.
36 ±
0.0
35.
91 ±
0.0
2
Mob
ilong
(35–
55 c
m)
5.61
± 0
.03
5.06
± 0
.12
5.64
± 0
.05
5.75
± 0
.05
4.91
± 0
.10
5.68
± 0
.02
5.51
± 0
.03
4.73
± 0
.02
5.62
± 0
.01
5.77
± 0
.01
5.07
± 0
.06
5.67
± 0
.01
Aver
age
SD0.
060.
080.
060.
050.
080.
050.
030.
030.
060.
060.
070.
06
34
www.soils.org/publications/sssaj 1357
strength soils reflects the fact that the addition of CaCl2 elec-trolyte has much less of an effect on cation exchange and other reactions in saline soils.
The laboratory-based spectrophotometric soil pH method outlined is not readily applicable to in situ field application as shakers, centrifuges and bench spectrophotometers are required. However, the reflectance probe has shown that there is potential for the spectrophotometric method to be adapted for use in in situ applications. Further research is required to refine this re-flectance approach and apply it to soils in the field.
COnCLuSIOnSA novel method for pH measurement in soils was developed
using precise spectrophotometric measurement of the acid and base forms of indicator dyes added to soil extracts. The pH mea-sured spectrophotometrically on a range of different soils and extraction conditions (1:1 and 1:5 soil/water and soil/0.01 mol L–1 CaCl2) compared well to pH measurements using glass elec-trodes. The indicators dyes (phenol red and bromocresol purple) used in this study enable measurement in the pH range of most soils (pH 5−8.5) but other dyes are available to expand this range to more acidic or alkaline soils. The application of the spectro-photometric pH method to soils appears, however, to provide many potential benefits over electrode methods (e.g., readily ap-plicable to wide range of soil salinities, no need to extract soils in stabilizing electrolytes which alter the pH, no drift or suspension effect). Therefore, this method could help improve prediction of other pH-dependent processes (e.g., metal binding, Sauvé et al., 2000). Further testing of the method and comparison to other soil chemical properties and processes is recommended.
SuppLEMEnTAL MATERIALThe Supplemental Material contains a complete description of the spectrophotometric pH equations, along with one supplementary table and one supplementary figure as detailed below. Table S1: The mean values of electrical conductivity (EC) and absorbance ratio (R). Figure S1: Comparison of spectrophotometric and glass electrode pH measurements (low ionic strength buffer) for different soil extractant solutions.
ACknOWLEDgMEnTSWe would like to acknowledge Colin Rivers who provided some of the soils used in this study and Dr. Cameron Grant who assisted with soil texture measurements. We are also grateful for the very constructive comments of two anonymous reviewers which helped us to improve the draft manuscript.
REFEREnCESBates, R.G., and S. Acree. 1945. pH of aqueous mixtures of potassium dihydrogen
phosphate and disodium hydrogen phosphate at 0 to 60 C. J. Res. Natl. Bur. Stand. 34:373–394. doi:10.6028/jres.034.020
Bates, R.G., and O. Popovych. 1981. The modern meaning of pH. Crit. Rev. Anal. Chem. 10:247–278. doi:10.1080/10408348108085499
Bond-Lamberty, B., and A. Thomson. 2010. Temperature-associated increases in the global soil respiration record. doi:10.1038/nature08930
Clayton, T.D., and R.H. Byrne. 1993. Spectrophotometric seawater pH measurements: Total hydrogen ion concentration scale calibration of m-cresol purple and at-sea results. Deep Sea Res. Part I, Oceanogr. Res. Pap. 40:2115–2129. doi:10.1016/0967-0637(93)90048-8
Conyers, M., and B. Davey. 1988. Observations on some routine methods for soil pH determination. Soil Sci. 145:29–36. doi:10.1097/00010694-198801000-00004
Covington, A.K., P.D. Whalley, and W. Davison. 1983. Procedures for the measurement of pH in low ionic strength solutions including freshwater. Analyst (Lond.) 108:1528–1532. doi:10.1039/an9830801528
Davison, W., and C. Woof. 1985. Performance tests for the measurement of pH with glass electrodes in low ionic strength solutions including natural waters. Anal. Chem. 57:2567–2570. doi:10.1021/ac00290a031
Essington, M.E. 2015. Soil and water chemistry: An integrative approach. 2nd ed. CRC Press, New York.
French, C.R., J.J. Carr, E.M. Dougherty, L.A. Eidson, J.C. Reynolds, and M.D. DeGrandpre. 2002. Spectrophotometric pH measurements of freshwater.
Fig. 4. Absorbance spectra of phenol red (pR) and bromocresol purple (BCp) indicator dyes for Monarto and Tumby Bay samples using the conventional spectrophotometer (a-b) on soil extracts (three dye additions shown) and reflectance probe (c-d) in situ on the soil paste.
35
1358 Soil Science Society of America Journal
Anal. Chim. Acta 453:13–20. doi:10.1016/S0003-2670(01)01509-4Heintze, S.G. 1934. The use of the glass electrode in soil reaction and oxidation-
reduction potential measurements. J. Agric. Sci. 24:28–41. doi:10.1017/S0021859600012429
Gillman, G.P., and L.C. Bell. 1978. Soil Solution Studies on Weathered Soils from tropical North Queensland. Aust. J. Soil Res. 16:67–77. doi:10.1071/SR9780067
Griffin, B., and J.J. Jurinak. 1973. Estimation of activity coefficients from the electrical conductivity of natural aquatic systems and soil extracts. Soil Sci. 116:26–30. doi:10.1097/00010694-197307000-00005
Keaton, C.M.A. 1938. Theory explaining the relation of soil-water ratios to pH values. Soil Sci. 46:259–266. doi:10.1097/00010694-193809000-00006
Kissel, D.E., L. Sonon, P.F. Vendrell, and R.A. Isaac. 2009. Salt concentration and measurement of soil pH. Commun. Soil Sci. Plant Anal. 40:179–187. doi:10.1080/00103620802625377
Lai, C.Z., M.D. DeGrandpre, B.D. Wasser, T.A. Brandon, D.S. Clucas, E.J. Jaqueth, Z.D. Benson, C.M. Beatty, and R.S. Spaulding. 2016. Spectrophotometric measurement of freshwater pH with purified meta‐cresol purple and phenol red. Limnol. Oceanogr. Methods 14:864–873. doi:10.1002/lom3.10137
Manov, G.G., N.J. DeLollis, and S.F. Acree. 1944. Liquid junction potentials, and relative activity coefficients of chloride ions, in concentrated mixed chlorides and nitrates at 25°C. J. Res. Natl. Bur. Stand. 33:273–285. doi:10.6028/jres.033.012
Miller, R.O., and D.E. Kissel. 2010. Comparison of soil pH methods on soils of North America. Soil Sci. Soc. Am. J. 74:310–316. doi:10.2136/sssaj2008.0047
Millero, F.J. 1986. The pH of estuarine waters. Limnol. Oceanogr. 31:839–847. doi:10.4319/lo.1986.31.4.0839
Mosley, L.M., S.L. Husheer, and K.A. Hunter. 2004. Spectrophotometric pH measurement in estuaries using thymol blue and m-cresol purple. Mar. Chem. 91:175–186. doi:10.1016/j.marchem.2004.06.008
Raupach, M., and B. Tucker. 1959. The field determination of soil reaction. J. Aust.
Inst. Agric. Sci. 25:129–133.Rayment, G.E., and D.J. Lyons. 2011. Soil chemical methods. CSIRO publishing,
determination of seawater pH using phenol red. Anal. Chem. 57:2564–2567. doi:10.1021/ac00290a030
Sauvé, S., W. Hendershot, and H.E. Allen. 2000. Solid-solution partitioning of metals in contaminated soils. Environ. Sci. Technol. 34:1125–1131. doi:10.1021/es9907764
Skoog, D.A., F.J. Holler, and S.R. Crouch. 2007. Principles of instrumental analysis. Cengage Learning, Inc., Belmont, CA.
Snyder, E.F. 1935. Methods for determining the hydrogen ion concentration of soils. USDA Circular No. 56. US Department of Agriculture Washington, DC.
Stumm, W., and J. Morgan. 1996. Aquatic chemistry: Chemical equilibria and rates in natural waters. 3rd ed. Wiley Interscience, New York.
Suarez, D.L. 1977. Ion activity products of calcium carbonate in waters below the root zone. Soil Sci. Soc. Am. J. 41:310–315. doi:10.2136/sssaj1977.03615995004100020027x
Wiesner, A.D., L.E. Katz, and C.C. Chen. 2006. The impact of ionic strength and background electrolyte on pH measurements in metal ion adsorption experiments. J. Colloid Interface Sci. 301:329–332. doi:10.1016/j.jcis.2006.05.011
Yao, W., and R.H. Byrne. 2001. Spectrophotometric determination of freshwater pH using bromocresol purple and phenol red. Environ. Sci. Technol. 35:1197–1201. doi:10.1021/es001573e
Yuan, S., and M.D. DeGrandpre. 2008. Evaluation of indicator-based pH measurements for freshwater over a wide range of buffer intensities. Environ. Sci. Technol. 42:6092–6099. doi:10.1021/es800829x
Zabowski, D., and R.S. Sletten. 1991. Carbon dioxide degassing effects on the pH of spodosol soil solutions. Soil Sci. Soc. Am. J. 55:1456–1461. doi:10.2136/sssaj1991.03615995005500050043x
36
Supplemental Material for: Development of a
spectrophotometric pH method for soils and
comparison with glass electrode measurements
Sima Bargrizana, Ronald J. Smernika, and Luke M. Mosleyb
a The School of Agriculture, Food and Wine, The University of Adelaide, South Australia
b Acid Sulfate Soils Centre, School of Biological Sciences, The University of Adelaide, South Australia
Summary of the supplemental material:
1 justification of the spectrophotometric pH equations
1 table
1 figure
37
Theory and derivation of equations that underpin the spectrophotometric pH measurement
method
Sulfonephthalein indicator dyes can exist in three forms H2I, HI-, and I2-, each of which has
distinctive light absorption characteristics. The chemical equilibria among these three forms is
dependent on pH and can be described by the first and second dissociation constants of the fully
protonated (H2I) dye species:
H2I ⇌ HI− + H+ K1 = [HI-] [H+] / [H2I] [1a]
HI− ⇌ I2− + H+ K2 = [I2-] [H+] / [HI-] [1b]
The total indicator concentration (IT = H2I + HI- + I2-) can be expressed in terms of [HI], K1, K2,
and proton concentration by:
IT = [HI-] ([H+]/K1 + 1 + K2 / [H+]) [2]
Using the Beer-Lambert law as the basis, the absorbance of an indicator dye in solution can be expressed
by:
λA = l (λH2I [H2I] + λHI [HI-] + λI [I2-] ) [3]
where A is the absorbance at wavelength , λx is the molar absorptivity of each individual dye
species (x = I2- or HI- or H2I), and l is the optical (spectrophotometer cell) path length. As per
equation (2), equation (3) can be expressed in terms of the species HI by:
Supplemental Figure S1. Comparison of spectrophotometric and glass electrode pH
measurements (low ionic strength phosphate buffer 0.005 M) for different soil extractant
solutions: (a) 1:1 water, (b) 1:5 water, (c) 1:1 0.01 M CaCl2 and (d) 1:5 0.01 M CaCl2.
y = 0.7854x + 1.6812R² = 0.9734
4.0
5.0
6.0
7.0
8.0
9.0
4.0 5.0 6.0 7.0 8.0 9.0
pH
spec
trop
hoto
met
ric
pH electrode
(a) 1: 1 water
y = 0.758x + 1.806R² = 0.9861
4.0
5.0
6.0
7.0
8.0
9.0
4.0 5.0 6.0 7.0 8.0 9.0
pH
spec
trop
hoto
met
ric
pH electrode
(b) 1: 5 water
y = 0.8082x + 1.5298R² = 0.975
3.0
4.0
5.0
6.0
7.0
8.0
9.0
3.0 4.0 5.0 6.0 7.0 8.0 9.0
pH
spec
trop
hoto
met
ric
pH electrode
(c) 1:1 CaCl2
y = 0.7946x + 1.5849R² = 0.9776
3.0
4.0
5.0
6.0
7.0
8.0
9.0
3.0 4.0 5.0 6.0 7.0 8.0 9.0
pH
spec
trop
hoto
met
ric
pH electrode
(d) 1:5 CaCl2
43
CHAPTER 3
The application of a spectrophotometric method to determine pH in
acidic (pH < 5) soils
Sima Bargrizana, Ronald J. Smernika, Rob Fitzpatrickb, and Luke M. Mosleyb
a The School of Agriculture, Food and Wine, The University of Adelaide, South
Australia
b Acid Sulfate Soils Centre, School of Biological Sciences, The University of
Adelaide, South Australia
Bargrizan S, Smernik RJ, Fitzpatrick RW, Mosley LM (2018). The application of a spectrophotometric
method to determine pH in acidic (pH < 5) soils. Talanta 186, 421-426.
44
Statement of AuthorshipTitle of Paper
The application of a spectrophotometric method to determine pH in acidic (pH < 5)
soils.
Publication Status Published Accepted for Publication
Submitted for PublicationUnpublished and Unsubmitted w ork w ritten in
manuscript style
Publication Details 2018, Talanta, 186, 421-426.
Principal Author
Name of Principal Author (Candidate) Sima Bargrizan
Contribution to the Paper
Accomplished experiment, data collection, data analysis and interpretation, wrote
manuscript.
Overall percentage (%) 70%
Certification: This paper reports on original research I conducted during the period of my Higher
Degree by Research candidature and is not subject to any obligations or contractual
agreements with a third party that would constrain its inclusion in this thesis. I am
the primary author of this paper.
Signature Date 21.01.2019
Co-Author Contributions
By signing the Statement of Authorship, each author certifies that:
i. the candidate’s stated contribution to the publication is accurate (as detailed above);
ii. permission is granted for the candidate in include the publication in the thesis; and
iii. the sum of all co-author contributions is equal to 100% less the candidate’s stated contribution.
Name of Co-Author Luke Mosley
Contribution to the Paper Supervised development of work, data interpretation and manuscript evaluation and
correction, and acted as corresponding author.
Signature
Date 21.01.2019
45
Name of Co-Author Ron Smernik
Contribution to the Paper Supervised development of work, data interpretation, manuscript evaluation and
correction.
Signature
Date 21.01.2019
Please cut an
Name of Co-Author Rob Fitzpatrick
Contribution to the Paper Supervised soil material collection, manuscript evaluation and correction.
Signature Date 21.01.2019
d paste additional co-author panels here as required.
46
Contents lists available at ScienceDirect
Talanta
journal homepage: www.elsevier.com/locate/talanta
The application of a spectrophotometric method to determine pH in acidic(pH<5) soils
Sima Bargrizana, Ronald J. Smernika, Rob W. Fitzpatrickb, Luke M. Mosleyb,⁎
a The School of Agriculture, Food and Wine, The University of Adelaide, South Australia, AustraliabAcid Sulfate Soils Centre, School of Biological Sciences, The University of Adelaide, South Australia, Australia
A R T I C L E I N F O
Keywords:Soil pHAcid sulfate soilsIndicator dyeBromocresol green
A B S T R A C T
pH is a “master variable” controlling many biogeochemical processes in soils. Acid sulfate soils undergo rapidand large pH changes from circumneutral pH under anaerobic soil conditions to sulfuric soils with ultra(pH < 3.5) and extremely (pH 3.5–4.4) acidic properties following oxidation. Measuring soil pH using a glasselectrode has several potential drawbacks including liquid junction errors, drift, suspension effects and clogging.Spectrophotometric pH measurement, involving addition of an indicator dye to the sample, is widely used inseawater and has recently been developed for soil extracts at circumneutral pH ranges. The aim of this study wasto extend the spectrophotometric method for application in ultra and extremely acidic soils. The acid dis-sociation constant (pKa =5.02) and molar absorptivities of the indicator dye bromocresol green were de-termined and shown to enable spectrophotometric pH measurement between pH 3− 5.3. To demonstrate theperformance and application of the method, pH and metal availability (Fe, Al, Zn) were measured during theincubation of two acid sulfate soils, which both classified as hypersulfidic soils (pH > 4) and transformed tosulfuric soils (pH < 4) after incubation for 12 weeks. The method compared well (r2> 0.99) to glass electrodemeasurements under acidic conditions with high metal availability. The method has potential to improve un-derstanding of biogeochemical processes in ultra and extremely acidic soils.
1. Introduction
Soil chemical reactions can result in the exchange or generation ofprotons. Therefore, soil pH is regarded as a key chemical variable [1].For example, metal activity typically increases with decreasing pH insoils due to: (1) desorption of metals from surface binding sites due toincreased protonation and (2) dissolution of mineral phases [2–5]. AspH is a log scale, even a +/−0.1 pH unit measurement error couldhave a substantive effect on the accuracy of prediction of metal spe-ciation and partitioning in soils. For example, Sauvé et al. [6] reportedthat the partition coefficient, Kd (i.e. the ratio of sorbed metal con-centration to the dissolved metal concentration) for Zn is best describedby the relationship (log10 Kd
Zn2+ =0.62 pH – 0.97); the logarithmicnature of the relationship results in large changes in Kd around a pH of 6(Kd = 562 at pH 6, 488 at pH 5.9 and 648 at pH 6.1). Soil pH has alsobeen widely used as a key parameter in classifying soils (e.g. Isbell andNational Committee on Soils and Terrain [7] and Soil Survey Staff [8]).
The most common method for measuring soil pH uses a glass elec-trode but such measurements have been recognized to have severalpotential problems such as inherent drift [9], liquid junction potential
errors on the order of 0.1 pH units [10], clogging of the porous fibre ofelectrodes [11], and a suspension effect in which the function of theelectrode is affected by soil cation exchange capacity [1]. Moreover, theneed for calibration buffers makes accurate pH measurement quitedifficult to perform for soils with varying salinity, as for accuratemeasurement the calibration buffer must have the same ionic strengthand composition as the sample solution [12].
Spectrophotometric pH measurement methods using indicator dyesrepresent an alternative to the glass electrode method for pH mea-surement and eliminate the problems mentioned above [13]. The cap-ability and accuracy (> 0.01 pH units) of this method emerges fromswift indicator equilibrium as well as consistently measured absorbanceof indicator species [13–15]. Prior to our recent study [16], which es-tablished the application of spectrophotometric pH measurementmethod for soils in the pH range 5− 8.5, this method had been usedmost widely for estuarine and marine applications at pH 7− 8[13,17–19].
It would be useful to extend the application of spectrophotometricmethods to pH < 5 for assessing acidification of soils that are ultra(< 3.5), extremely (3.5–4.4) and very strongly (4.5–5.0) acidic (Soil
https://doi.org/10.1016/j.talanta.2018.04.074Received 29 January 2018; Received in revised form 23 April 2018; Accepted 23 April 2018
⁎ Correspondence to: Waite Campus, University of Adelaide, PMB 1 Glen Osmond, SA 5064, Australia.E-mail address: [email protected] (L.M. Mosley).
Survey Staff, [8]). Bromocresol green (BCG) is a potentially suitableindicator dye for use with acid soil extracts, and has been used fordetermining seawater alkalinity titration endpoints within the range ofpH 3.4–4.6 [20–22]. However, very limited information is available onthe dissociation constant and molar absorptivities of BCG at lower ionicstrength; these are critical parameters required for spectrophotometricpH measurement in soils. Further, the influence of high metal avail-ability (e.g. Al3+) under acidic conditions on dye properties needs as-sessment.
Acid sulfate soils provide an ideal case for testing and developingpH methods as they undergo large pH changes during oxidation. Acidsulfate soils (ASS) are those soils in which sulfuric acid (H2SO4) may beproduced, is being produced, or has been produced in amounts thathave a lasting effect on the main soil characteristics [23]. The pro-duction of acidity is caused by the oxidation of pyrite (FeS2). Theclassification of acid sulfate soil materials (i.e. sulfuric, hypersulfidic,hyposulfidic or monosulfidic) is based mainly on the initial pH (pH attime zero) and after moist and aerobic incubation [24,25] for at least 16weeks (Isbell and National Committee on Soils and Terrain [7]). Acidsulfate soils are identified as soils which classify as hypersulfidic soils(pH > 4) and transform to sulfuric soils (pH < 4) after incubationwithin 12 weeks (see Supplementary material Appendix 1 for moredetails). Sulfuric soils and rocks (at acid mine sites) may result in so-lubilisation of large amounts of metals (e.g. Al, Fe, Mn, Ni, Zn) andmetalloids (As, Se) [26–31]. The transformation of hypersulfidic soils tosulfuric soils has been documented across the world, as a result ofdrought, anthropogenic and global climate change conditions [32,33].
The aim of this study was to develop and test spectrophotometric pHmeasurement methods for application in acidic (pH < 5) soil condi-tions. To do this, the properties of the indicator dye BCG were de-termined and used in spectrophotometric pH measurement duringoxidation of two acid sulfate soils. The pH results under acidic condi-tions were compared to conventional electrode measurements andmetal availability (Al, Fe, Zn) was also assessed. The method developedis applicable to a wide range of soils and waters under acidic conditions.
2. Materials and methods
2.1. Soil sample collection and incubation
Acid sulfate soil samples were collected from two localities: 1.Wally´s Landing (WL) and 2. Garden Island (GI). Sampling site “Wally´sLanding” (Finniss River; S 35°24′27.3′′ and E 138°49′53.3′′) in theLower Lakes area of South Australia is a permanently flooded, anoxicwetland zone located in the Finniss River. The soil at this site is clas-sified as a Hypersulfidic, Subaqueous Hydrosol (Isbell and NationalCommittee on Soils and Terrain [7]), Typic Sulfiwassent (Soil SurveyStaff [34]) and Hypersulfidic subaqueous soil [35]. A soil sample wastaken at a depth of approximately 1m below the water surface by ausing a Russian D-auger (Dormer Australia) to a soil depth of 1.8m andpartitioned according to soil horizons (see Supplementary Table 1).
Sampling site “Garden Island” (GI; S 34°48′21.2″ and E138°32′29.0″) is in a coastal mangrove near Port Adelaide in SouthAustralia. The Garden Island area is intertidal and the soil at this site isclassified as a Histic-Hypersulfidic, Intertidal Hydrosol, Hypersulfidic(Isbell and National Committee on Soils and Terrain [7]), Typic Sulfi-saprist (Soil Survey Staff [34]) and Hypersulfidic organic soil [35]. TheGI soil was collected using a 90mm standard soil auger from the90–110 cm soil layer (Supplementary Table 1).
In the field, soils were placed in plastic bags, sealed tightly to ex-clude oxygen and placed on ice for transportation to the laboratory. Inthe laboratory, GI soil samples were kept airtight in a fridge. The WLsoil was kept uncovered at room temperature for almost 48 h to allowsurplus water to evaporate prior to starting the incubation. In order toaerobically incubate, 50 g aliquots of homogenized field-moist soil,spread into a 10mm thick layer, were transferred into plastic containers
with lids equipped with holes so as to ensure soil exposure to oxygen.Throughout the incubation, soil water content was adjusted (to remainmoist), if required, weekly for 12 weeks (method derived fromFitzpatrick et al. [24] and Creeper et al. [25]).
2.2. The principles of spectrophotometric pH measurement
The pH on the free hydrogen ion concentration scale can be calcu-lated from spectrophotometric measurement of an indicator dye addedto the sample solution using Eq. (1) [13,16]:
⎜ ⎟= − = + −−
− ⎛⎝ +
− ⎞⎠
+ ee Re
Aμ
μμpH log [H ] pK log (R )
( )4
10.3a
1
2 3
1/2
1/2 (1)
Where pKa represents the negative logarithm of Ka (the second dis-sociation constant of BCG), R is the ratio of maximum absorbance ofbase to acid indicator forms at wavelengths λ2 and λ1 respectively, e1-e3 are indicator molar absorbance ratios, and the last term is the Daviesequation where µ is ionic strength (M) and A=0.5092 at 25 °C ([36];equation is applicable when µ < 0.5M). Further details, includingjustification of the use of Eq. (1) can be found in SupplementaryAppendix 2 and Bargrizan et al. [16].
2.3. Determination of molar absorption ratios (e1-e3) and pKa forbromocresol green
Molar absorption ratios (e1-e3) at wavelengths of peak maxima (λ1
= 444 nm and λ2 = 616 nm) for BCG were calculated as follows(Table 1):
= = =eε
e εε
e εε
616ε444
616444
444444
HI
HI
I
HI
I
HI1 2 3 (2)
Where λεHI and λεI are the molar absorption coefficients (L mol−1
cm−1) of acid and base forms of the indicator measured at wavelengthλ and calculated using Beer's Law from measured absorbance, indicatorconcentrations, and path length (l) [13]. To achieve this, maximumabsorbance of acid and base forms of BCG (λ1,2AHI and λ1,2AI) at (λ1
= 444 nm and λ2 = 616 nm) were determined at extreme pH valueswhere only the acid (approx. pH 1−2) or base (approx. pH 8−9) formof BCG, respectively, was present [17]. This was achieved by additionof diluted HCl and NaOH, respectively, into 1mL of diluted stock BCGsolution (2×10⁻³ mol L−1) in a 100mL volumetric flask. The max-imum absorbance of base and acid forms of the indicator dye wasmeasured via placing the solutions in a 1 cm cuvette in a double-beamspectrophotometer (GBC UV/VIS 916) thermostatted at 25 °C andsupplied with Cintral™ software. Examples of the acid and base spectraunder these extreme conditions are shown in Fig. 1.
In order to determine pKa of BCG at µ= 0 and 25 °C, BCG stocksolution (2×10⁻³ mol L−1) was added in 30 µL increments to 4mLcertified (NIST Standard Reference Material 185i) phthalate buffer(0.05 mol kg−1) with pHNBS/NIST = 4.00 (based on hydrogen ion ac-tivity; refer to certification documentation on NIST website for the
Table 1BCG molar absorbance ratios (e1-e3) and pKa values at zero ionic strength and25 °C.
protocol of preparation) in a 1 cm glass cuvette and R (ratio of max-imum absorbance of base to acid forms of BCG) was measured. pKa wasthen calculated using Eq. (1), where the buffer's ionic strength valuewas obtained using ( = ∑μ c Zi i
12
2 where ci is the concentration of ions(mol L−1) and Z is the charge number of ions), the molar absorptivitiesof BCG (e1-e3) are as described and measured above, and the pH of theNIST buffer is on the free hydrogen scale. The pH of the NIST buffer onthis scale (pHfree 3.91) was calculated based on converting the bufferpHNBS/NIST value based on hydrogen ion activity to hydrogen ion con-centration using Eq. (3) [16]:
= − = +++pH log H pH logγ[ ]free NBS NIST H/ (3)
Where +γH is the activity coefficient for the hydrogen ion calculatedusing the Davies equation.
2.4. Preparation of soil extracts and spectrophotometric pH measurement
Soil extracts (three replicates) were prepared by shaking 25 g soil(wet weight) with 25mL water on an orbital shaker for 1 h [37] andthen centrifuging at 1915.2 RCF (Relative Centrifugal Force) for30min. The supernatant was transferred to a clean polyethylene tubeand brought to 25 °C using a water bath [16]. Aliquots (5–10mL) of soilextracts were then set aside and acidified by adding concentrated HNO3
to achieve a concentration of 2% v/v, and then analysed for metalcontent using ICP-OES. The pH was also measured using a calibratedglass electrode (Orion Sure Flow™) for soil extracts that were acidic (inthe pH range of BCG dye, 3−5.3) to enable comparison with spectro-photometric pH values.
Other indicators, specifically phenol red (PR) and bromocresolpurple (BCP), were used to obtain spectrophotometric pH values at thestart and early stage of the soil incubation [16]. The pKa and molarabsorptivity values used for PR and BCG were those provided by Yaoand Byrne [13] and are also provided in the Supplementary materialTable 2.
Three indicator stock solutions (PR, BCP and BCG at the con-centration of 2× 10⁻³ mol L−1 were made and adjusted to pH≈ 7.5and 5.9 and 4.5, respectively) using 0.1mol L−1 HCl or NaOH.Indicator concentration in analysed soil extracts ranged from 2×10⁻⁵
mol L−1 to 6× 10⁻⁵ mol L−1 based upon sequential addition of three0.03mL aliquots of indicator stock solution (i.e. total addition of 0.03,0.06, 0.09mL) into 4mL soil extract in a 1 cm glass cuvette (Bargrizanet al., 2017). The soil solutions before adding the dye had some colourand absorbance, especially towards the UV range. We measured thereference spectra of each soil extract and this was subtracted from themeasurement spectra with the dye added.
During the pH measurement, the temperature of soil solutions waskept constant at 25 °C using a water thermostat installed on the spec-trophotometer. The ratio of maximum absorbance of base to acid forms
of the indicator (R) was measured as described above. The pH pertur-bation caused by indicator addition was corrected for each sample byplotting R vs dye volume, and obtaining R at zero dye volume by linearregression [16,17]. The ionic strength of the soil solution (µ) requiredto correct activity coefficients as per Eq. (1) was estimated by mea-suring electrical conductivity (EC) in a 1:1 soil:water extract (givingvalues of 17.5 and 6.5 mS cm−1 for GI and WL soils, respectively) andcalculating using Eq. (4) [38,39]:
= ×−µ EC(mS cm ) 0.01271 (4)
Ionic strength of the soil solution could also be calculated followingmeasurement of the major ion composition of the soil solution andusing = ∑μ c Z wherei i
12
2 c is the concentration of ion i in mol L−1
and z is the charge of ion i. However, the pHspec difference is no higherthan 0.001 pH units when there is a 10% error between ionic strengthscalculated using Eq. (4) and = ∑μ c Zi i
12
2.
3. Results and discussion
3.1. Dye properties
The BCG molar absorptivity ratios (e1-e3) and dissociation constant(pKa) at 25 °C are presented in Table 1. The average results for e1, e2and e3 ( ± standard deviation, n= 7) were 0.009, 2.359 and 0.177,respectively. In comparison, results reported for BCG molar absorptivityratios in seawater were e1 = 0.0013, e2 = 2.314 and e3 = 0.129 [21].An average pKa of 5.02 ± 0.007 (standard deviation, n=7) for BCG(µ=0, 25 °C) was obtained based on measurement in the NISTphthalate buffer and correction to the free hydrogen ion concentrationscale (Table 1). This was 0.12 higher than the pKa for BCG reported byBishop ([40], pKa = 4.90). This difference could be due to dye im-purities which can influence the measured ei and consequently pKa
[19]. The BCG dye source and method of pKa determination is not re-ported by Bishop [40].
The pKa of BCG in seawater (µ≈ 0.7) is approximately 4.42, asreported by Byrne et al. [20], King and Kester [22] and Breland andByrne [21]. The difference of approximately 0.6 pKa units between ourpKa for BCG at zero ionic strength and pKa for BCG in seawater, iscomparable to the difference reported for other indicator dyes, m-cresolpurple and thymol blue [18,41]. The measurement of molar absorp-tivity ratios and pKa for BCG in our study provides the ability to mea-sure pH spectrophotometrically in acidic soils and solutions at lowerionic strengths (µ < 0.5) via Eq. (1).
3.2. Soil acidification and spectrophotomteric pH measurement method
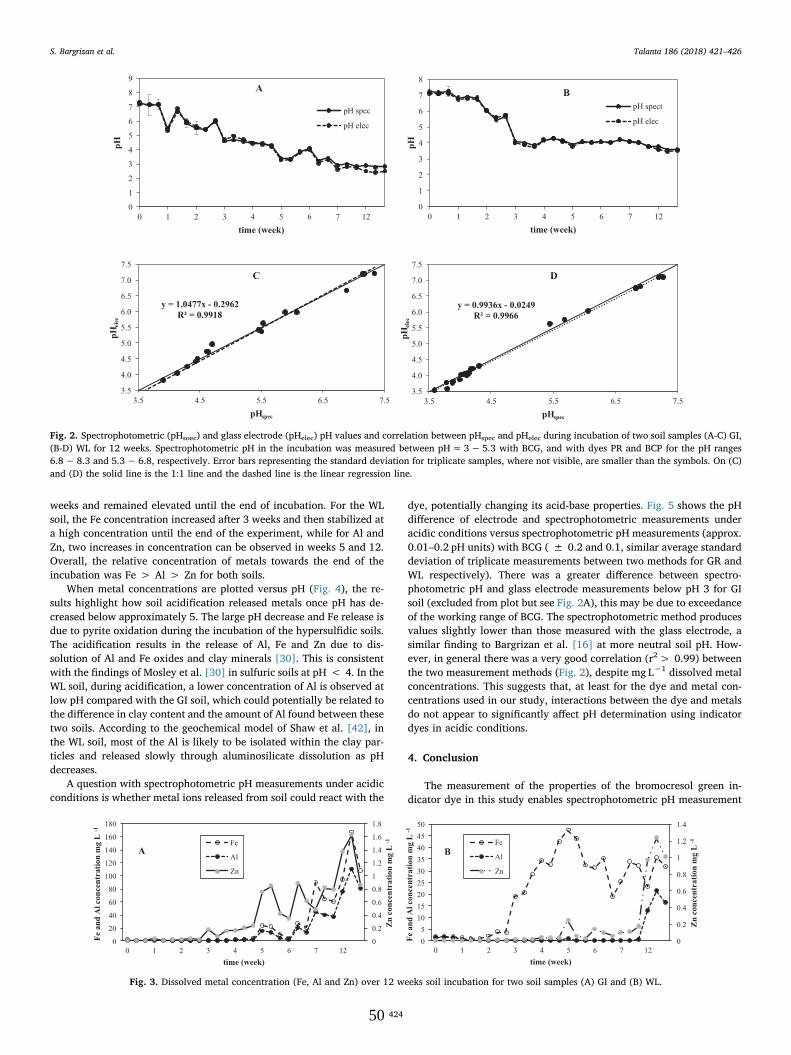
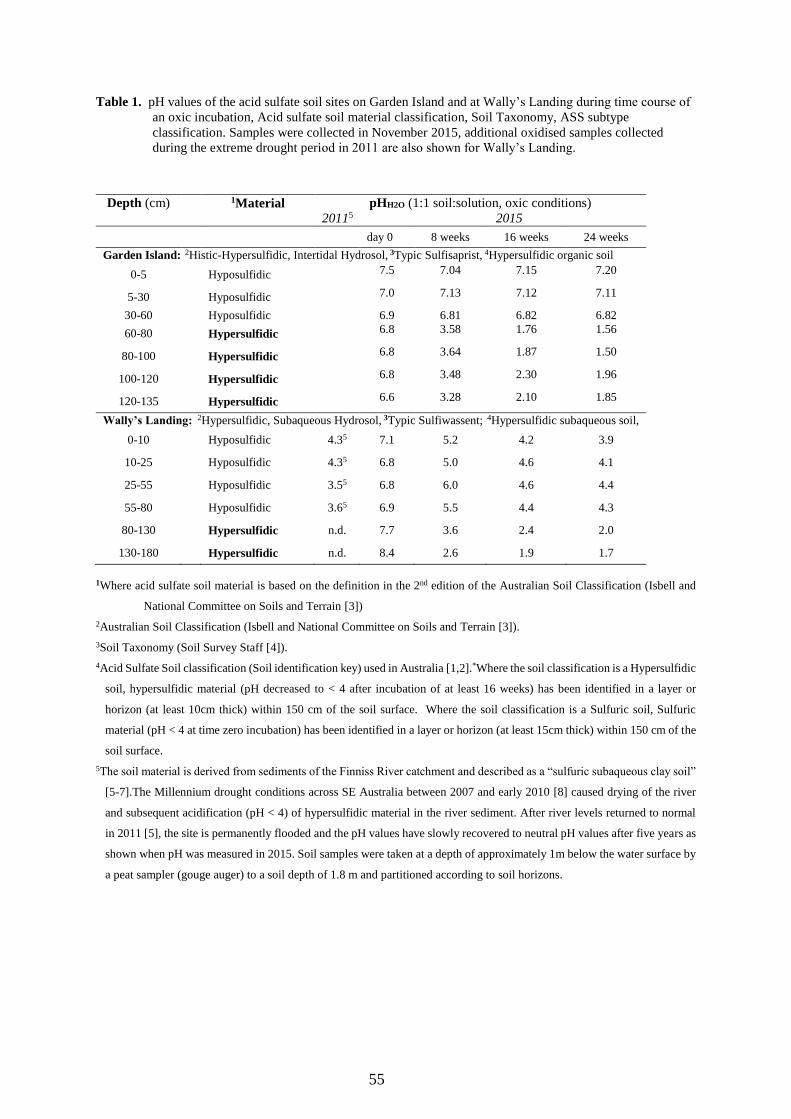
To demonstrate the application of the spectrophotometric methodusing BCG under acidic conditions, the spectrophotometric pH valuesduring a 12-week oxic incubation of two hypersulfidic soils (GI and WL)are shown in Fig. 2A and B, respectively. After 5 and 3 weeks of in-cubation, respectively, the pH for GI and WL reached ≤ 4 (i.e. soilqualified for classification as a sulfuric soil in accordance with theAustralian Acid Sulfate Soil Identification key [35].
The pH of GI and WL hypersulfidic soils continued to decrease by≤ 0.6 and ≤ 0.2 pH units, respectively, until a stable acidic pH wasreached, suggesting oxidation of pyrite had ended.
There was a strong correlation (r2> 0.99) between the spectro-photometric and glass electrode methods for both soils (see Fig. 2C andD).
3.3. Relationship between spectrophotometric pH and metal availability insoil
Metal (Al, Fe and Zn) concentrations in the soil pore water over timefor the two sites are shown in Fig. 3. The concentration of all metals (Fe,Al and Zn) in the GI soil began to increase substantially after about 5
0
0.2
0.4
0.6
0.8
1
400 450 500 550 600 650 700 750
Abs
orba
nce
Wavelength
Basic form
Acid form
Fig. 1. Absorbance Vs wavelength for the base (I2-) and acid (HI-) forms ofbromocresol Green (BCG).
S. Bargrizan et al. Talanta 186 (2018) 421–426
42349
weeks and remained elevated until the end of incubation. For the WLsoil, the Fe concentration increased after 3 weeks and then stabilized ata high concentration until the end of the experiment, while for Al andZn, two increases in concentration can be observed in weeks 5 and 12.Overall, the relative concentration of metals towards the end of theincubation was Fe > Al > Zn for both soils.
When metal concentrations are plotted versus pH (Fig. 4), the re-sults highlight how soil acidification released metals once pH has de-creased below approximately 5. The large pH decrease and Fe release isdue to pyrite oxidation during the incubation of the hypersulfidic soils.The acidification results in the release of Al, Fe and Zn due to dis-solution of Al and Fe oxides and clay minerals [30]. This is consistentwith the findings of Mosley et al. [30] in sulfuric soils at pH < 4. In theWL soil, during acidification, a lower concentration of Al is observed atlow pH compared with the GI soil, which could potentially be related tothe difference in clay content and the amount of Al found between thesetwo soils. According to the geochemical model of Shaw et al. [42], inthe WL soil, most of the Al is likely to be isolated within the clay par-ticles and released slowly through aluminosilicate dissolution as pHdecreases.
A question with spectrophotometric pH measurements under acidicconditions is whether metal ions released from soil could react with the
dye, potentially changing its acid-base properties. Fig. 5 shows the pHdifference of electrode and spectrophotometric measurements underacidic conditions versus spectrophotometric pH measurements (approx.0.01–0.2 pH units) with BCG ( ± 0.2 and 0.1, similar average standarddeviation of triplicate measurements between two methods for GR andWL respectively). There was a greater difference between spectro-photometric pH and glass electrode measurements below pH 3 for GIsoil (excluded from plot but see Fig. 2A), this may be due to exceedanceof the working range of BCG. The spectrophotometric method producesvalues slightly lower than those measured with the glass electrode, asimilar finding to Bargrizan et al. [16] at more neutral soil pH. How-ever, in general there was a very good correlation (r2> 0.99) betweenthe two measurement methods (Fig. 2), despite mg L−1 dissolved metalconcentrations. This suggests that, at least for the dye and metal con-centrations used in our study, interactions between the dye and metalsdo not appear to significantly affect pH determination using indicatordyes in acidic conditions.
4. Conclusion
The measurement of the properties of the bromocresol green in-dicator dye in this study enables spectrophotometric pH measurement
0
1
2
3
4
5
6
7
8
9
0 1 2 3 4 5 6 7 12
pH
time (week)
pH spec
pH elec
0
1
2
3
4
5
6
7
8
0 1 2 3 4 5 6 7 12
pH
time (week)
pH spect
pH elec
B
y = 1.0477x - 0.2962R² = 0.9918
3.5
4.0
4.5
5.0
5.5
6.0
6.5
7.0
7.5
3.5 4.5 5.5 6.5 7.5
pHel
ec
pHspec
C
y = 0.9936x - 0.0249R² = 0.9966
3.5
4.0
4.5
5.0
5.5
6.0
6.5
7.0
7.5
3.5 4.5 5.5 6.5 7.5pH
elec
pHspec
D
A
Fig. 2. Spectrophotometric (pHsoec) and glass electrode (pHelec) pH values and correlation between pHspec and pHelec during incubation of two soil samples (A-C) GI,(B-D) WL for 12 weeks. Spectrophotometric pH in the incubation was measured between pH≈ 3− 5.3 with BCG, and with dyes PR and BCP for the pH ranges6.8− 8.3 and 5.3− 6.8, respectively. Error bars representing the standard deviation for triplicate samples, where not visible, are smaller than the symbols. On (C)and (D) the solid line is the 1:1 line and the dashed line is the linear regression line.
0
0.2
0.4
0.6
0.8
1
1.2
1.4
1.6
1.8
0
20
40
60
80
100
120
140
160
180
0 1 2 3 4 5 6 7 12
Zn c
once
ntra
tion
mg
L-1
Fe a
nd A
l con
cent
ratio
n m
g L
-1
time (week)
Fe
Al
Zn
A
0
0.2
0.4
0.6
0.8
1
1.2
1.4
0
5
10
15
20
25
30
35
40
45
50
0 1 2 3 4 5 6 7 12
Zn c
once
ntra
tion
mg
L-1
Fe a
nd A
l con
cent
ratio
n m
g L
-1
time (week)
Fe
Al
Zn
B
Fig. 3. Dissolved metal concentration (Fe, Al and Zn) over 12 weeks soil incubation for two soil samples (A) GI and (B) WL.
S. Bargrizan et al. Talanta 186 (2018) 421–426
42450
between pH 3− 5.3 at ionic strengths< 0.5 (soil EC1:1< approx.20 mS cm−1). This extends the capability of the spectrophotometric soilpH method to measure lower pH conditions, such as that found inacidified agricultural land and acid sulfate soils. The application of thespectrophotometric method for measuring soil pH in the acidic rangewas demonstrated during a 12-week incubation of two hypersulfidicsoils (pH > 4), which transformed to sulfuric soils (pH < 4). As theindicator dye spectra are, unlike glass electrodes, directly related to theacid-base equilibria in solution, spectrophotometric measurementscould potentially reduce pH measurement errors in soils. This includesthe elimination of liquid junction errors which, given they can be on theorder of +/−0.1 pH units, could affect metal speciation calculations.
Further research using the spectrophotometric pH measurementmethod in a wider range of soils to assess whether it can be used tobetter understand geochemical processes (e.g. predict metal avail-ability) in soils is recommended. The accuracy of the spectro-photometric method could be further assessed by concurrent mea-surement of two other carbonate system parameters (e.g. pCO2 anddissolved inorganic carbon) and calculating pH for comparison tomeasured spectrophotometric and electrode pH. The advantage of thespectrophotometric method using indicator dyes is that it can poten-tially be used to study pH in two dimensions [43], which is criticallyimportant for better assessment of geochemical and plant-metal inter-actions in acidic soil.
Acknowledgments
We would like to thank Ms Bogumila Tomczak for assisting with themeasurement of metals. This work was supported by the assistance ofthe Australian Commonwealth Government through an AustralianResearch Council Discovery Project Grant DP170104541 for RF andLM, and a University of Adelaide postgraduate scholarship for SB. Wethank the Editor and two anonymous reviewers for their commentswhich enabled us to improve the manuscript.
Appendix A. Supporting information
Supplementary data associated with this article can be found in theonline version at http://dx.doi.org/10.1016/j.talanta.2018.04.074.
0
20
40
60
80
100
120
140
160
180
2 3 4 5 6 7 8
Fe m
g L
-1
pH
A
0
0.2
0.4
0.6
0.8
1
1.2
1.4
1.6
1.8
2 3 4 5 6 7 8
Zn m
g L
-1
pH
A
0
20
40
60
80
100
120
2 3 4 5 6 7 8
Al m
g L
-1
pH
A
0
5
10
15
20
25
30
35
40
45
50
2 3 4 5 6 7 8
Fe m
g L
-1
pH
B
0
5
10
15
20
25
2 3 4 5 6 7 8
Al m
g L
-1
pH
B
0
0.2
0.4
0.6
0.8
1
1.2
1.4
2 3 4 5 6 7 8
Zn m
g L
-1
pH
B
Fig. 4. Dissolved metal concentrations (Al, Fe, Zn), versus spectrophotometric pH (1.1 soil/water) for two samples: (A) GI, (B) WL.
-0.2
-0.1
0.0
0.1
0.2
3 3.5 4 4.5 5
pH d
iff (e
lec-
spec
)
pH spec
GI
WL
Fig. 5. pH difference between the glass electrode (elec) and spectrophotometric(spec) methods versus spectrophotometric pH values in the extremely acidicrange (pH 3−4.5) for GI and WL soil samples during 12 weeks incubation. pHvalues< 3 were excluded due to their exceedance of the working range of BCG.
[1] M.E. Essington, Soil and Water Chemistry: An Integrative Approach, second ed, CRCPress, New York, 2015.
[2] W.L. Lindsay, Chemical Equilibria in Soils, John Wiley & Sons Ltd, UK, 1979.[3] L. Gandois, A. Probst, C. Dumat, Modelling trace metal extractability and solubility
in French forest soils by using soil properties, Eur. J. Soil. Sci. 61 (2010) 271–286.[4] S.L. Simpson, R.W. Fitzpatrick, P. Shand, B.M. Angel, D.A. Spadaro, L. Mosley,
Climate-driven mobilisation of acid and metals from acid sulfate soils, Mar. Freshw.Res. 61 (2010) 129–138.
[5] S.L. Simpson, C.R. Vardanega, C. Jarolimek, D.F. Jolley, B.M. Angel, L.M. Mosley,Metal speciation and potential bioavailability changes during discharge and neu-tralisation of acidic drainage water, Chemosphere 103 (2014) 172–180.
[6] S. Sauvé, W. Hendershot, H.E. Allen, Solid-solution partitioning of metals in con-taminated soils: dependence on pH, total metal burden, and organic matter,Environ. Sci. Technol. 34 (2000) 1125–1131.
[7] R.F. IsbellNational Committee on Soils and Terrain, The Australian SoilClassification, second ed, CSIRO Publishing, Clayton, Victoria, Australia, 2016.
[8] Soil Science Division Staff, Soil Survey Manual: Handbook of Department ofAgriculture. No. 18. USDA-NRCS, U.S. Gov. Print. Office, Washington, D.C. USA,2017.
[9] S. Yuan, M.D. DeGrandpre, Evaluation of indicator-based pH measurements forfreshwater over a wide range of buffer intensities, Environ. Sci. Technol. 42 (2008)6092–6099.
[10] F.J. Millero, The pH of estuarine waters, Limnol. Oceanogr. 31 (1986) 839–847.[11] D.A. Skoog, F.J. Holler, S.R. Crouch, Principles of Instrumental Analysis, Cengage
Learning, Inc, Belmont, (CA), 2007.[12] A.D. Wiesner, L.E. Katz, C.C. Chen, The impact of ionic strength and background
electrolyte on pH measurements in metal ion adsorption experiments, J. ColloidInterface Sci. 301 (2006) 329–332.
[13] W. Yao, R.H. Byrne, Spectrophotometric determination of freshwater pH usingbromocresol purple and phenol red, Environ. Sci. Technol. 35 (2001) 1197–1201.
[14] R.G. Bates, A.K. Vijh, Determination of pH: theory and practice, J. Electrochem.Soc. 120 (1973) (263C-263C).
[15] R.H. Byrne, J.A. Breland, High precision multiwavelength pH determinations inseawater using cresol red, Deep-Sea Res. 36 (5) (1989) 803–810.
[16] S. Bargrizan, R.J. Smernik, L.M. Mosley, Development of a spectrophotometricmethod for determining pH of soil extracts and comparison with glass electrodemeasurements, Soil Sci. Soc. Am. J. 81 (2017) 1350–1358.
[17] T.D. Clayton, R.H. Byrne, Spectrophotometric seawater pH measurements: totalhydrogen ion concentration scale calibration of m-cresol purple and at-sea results,Deep-Sea Res. Part I: Oceanogr. Res. Pap. 40 (1993) 2115–2129.
[18] L.M. Mosley, S.L. Husheer, K.A. Hunter, Spectrophotometric pH measurement inestuaries using thymol blue and m-cresol purple, Mar. Chem. 91 (2004) 175–186.
[20] R. Byrne, G. Robert-Baldo, S. Thompson, C. Chen, Seawater pH measurements: anat-sea comparison of spectrophotometric and potentiometric methods, Deep-SeaRes. Part A: Oceanogr. Res. Pap. 35 (1988) (1405-141).
[21] J.A. Breland, R.H. Byrne, Spectrophotometric procedures for determination of seawater alkalinity using bromocresol green, Deep-Sea Res. Part I: Oceanogr. Res. Pap.40 (1993) 629–641.
[22] D.W. King, D.R. Kester, Determination of seawater pH from 1.5 to 8.5 using col-orimetric indicators, Mar. Chem. 26 (1989) 5–20.
[23] L.J. Pons, Outline of the genesis, characteristics, classification and improvement ofacid sulphate soils, in: H. Dost (Eds.), Proceedings of the 1972, International AcidSulphate Soils Symposium, Volume 1, 18. International Land Reclamation Institute
Publication, Wageningen, Netherlands, 1973, pp. 3–27.[24] R.W. Fitzpatrick, G. Grealish, P. Shand, R. Merry, N. Creeper, M. Thomas, A. Baker,
B. Thomas, W. Hicks, and N. Jayalath, Chip-tray incubation, A new field and la-boratory method to support Acid Sulfate Soil Hazard Assessment, Classification andCommunication, In: R.J. Gilkes, and N. Prakongkep (Eds.), Proceedings of the 19thWorld Congress of Soil Science; Soil Solutions for a Changing World, ISBN 987-0-646-53783-2; published on DVD. ⟨http://www.iuss.org; Symposium WG 3.1Processes in acid sulfate soil materials⟩ Brisbane, Australia, IUSS, (Accessed 1–6August 2010), pp. 28-31.
[25] N. Creeper, R. Fitzpatrick, P. Shand, A simplified incubation method using chip‐-trays as incubation vessels to identify sulphidic materials in acid sulphate soils, SoilUse Manag. 28 (2012) 401–408.
[26] M. Astrom, N. Corin, Abundance, sources and speciation of trace elements inhumus-rich streams affected by acid sulphate soils, Aquat. Geochem. 6 (2000)367–383.
[27] R. Sundstrom, M. Astrom, P. Osterholm, Comparison of the metal content in acidsulfate soil runoff and industrial effluents in Finland, Environ. Sci. Technol. 36(2002) 4269–4272.
[28] B.C.T. Macdonald, I. White, M.E. Astrom, A.F. Keene, M.D. Melville, J.K. Reynolds,Discharge of weathering products from acid sulfate soils after a rainfall event,Tweed River. Eastern Australia, Appl. Geochem. 22 (2007) 2695–2705.
[29] J. Toivonen, P. Osterholm, Characterization of acid sulfate soils and assessing theirimpact on a humic boreal lake, J. Geochem. Explor. 110 (2011) 107–117.
[30] L.M. Mosley, R.W. Fitzpatrick, D. Palmer, E. Leyden, P. Shand, Changes in acidityand metal geochemistry in soils, groundwater, drain and river water in the lowerMurray River after a severe drought, Sci. Total Environ. 485 (2014) 281–291.
[31] J. Chamier, M. Wicht, L. Cyster, N.P. Ndindi, Aluminium (Al) fractionation andspeciation; getting closer to describing the factors influencing Al(3+) in water im-pacted by acid mine drainage, Chemosphere 130 (2015) 17–23.
[32] D. Fanning, M. Rabenhorst, R. Fitzpatrick, Historical developments in the under-standing of acid sulfate soils, Geoderma 308 (2017) 191–206.
[33] C. Yuan, P. Marschner, R.W. Fitzpatrick, L.M. Mosley, Global risks of severe acid-ification of acid sulfate soils due to increasing drought and the importance of or-ganic matter for mitigation, in: Soil Science Society of China (Ed.), Soil Science andEcological Civilization, 1 Northwest A&FUniversity Press, Xi'an, China, 2016, pp.176–186.
[34] Soil Survey Staff, Keys to Soil Taxonomy, twelfth ed., Department of AgricultureNatural Resources Conservation Service, Washington, D.C. USA, 2014.
[35] R.W. Fitzpatrick, Demands on soil classification and soil survey strategies: special-purpose soil classification systems for local practical use, in: S.A. Shahid, F.K. Taha,M.A. Abdelfattah (Eds.), Developments in soil Classification, Land Use Planning andPolicy Implications, Springer, Netherlands, 2013, pp. 51–83.
[36] W. Stumm, J. Morgan, Aquatic Chemistry: Chemical Equilibria and Rates in NaturalWaters, 3rd ed, Wiley Interscience, New York, 1996, p. 1022.
[38] B. Griffin, J.J. Jurinak, Estimation of activity coefficients from the electrical con-ductivity of natural aquatic systems and soil extracts, Soil Sci. 116 (1973) 26–30.
[39] G.P. Gillman, L.C. Bell, Soil Solution Studies on Weathered Soils from tropical NorthQueensland, Aust. J. Soil Res. 16 (1978) 67–77.
[40] E. Bishop, Indicators, Pergamon Press, Oxford, 1972.[41] N. Douglas, R. Byrne, Spectrophotometric pH measurements from river to sea: ca-
libration of mCP for 0≤S≤40 and 278.15≤T≤308.15 K, Mar. Chem. 197 (2017)64–69.
[42] S.A. Shaw, M.J. Hendry, Geochemical and mineralogical impacts of H 2SO4 on claysbetween pH 5.0 and −3.0, Appl. Geochem. 24 (2009) 333–345.
[43] S. Blossfeld, D. Gansert, A novel non-invasive optical method for quantitative vi-sualization of pH dynamics in the rhizosphere of plants, Plant Cell Environ. 30 (2)(2007) 176–186.
Spectrophotometric measurement of the pH of soil extracts using a multiple
indicator dye mixture.
Publication Status Published Accepted for Publication
Submitted for PublicationUnpublished and Unsubmitted w ork w ritten in
manuscript style
Publication Details 2018, European Journal of Soil Science, doi: 10.1111/ejss.12745.
Principal Author
Name of Principal Author (Candidate) Sima Bargrizan
Contribution to the Paper
Accomplished experiment, data collection, data analysis and interpretation, wrote
manuscript.
Overall percentage (%) 70%
Certification: This paper reports on original research I conducted during the period of my Higher
Degree by Research candidature and is not subject to any obligations or contractual
agreements with a third party that would constrain its inclusion in this thesis. I am
the primary author of this paper.
Signature Date 21.01.2019
Co-Author Contributions
By signing the Statement of Authorship, each author certifies that:
i. the candidate’s stated contribution to the publication is accurate (as detailed above);
ii. permission is granted for the candidate in include the publication in the thesis; and
iii. the sum of all co-author contributions is equal to 100% less the candidate’s stated contribution.
Name of Co-Author Luke Mosley
Contribution to the Paper Supervised development of work, data interpretation and manuscript evaluation and
correction, and acted as corresponding author.
Signature
Date 21.01.2019
62
Name of Co-Author Ron Smernik
Contribution to the Paper Supervised development of work, data interpretation, manuscript evaluation and
correction.
Signature
Date 21.01.2019
63
European Journal of Soil Science, 2018 doi: 10.1111/ejss.12745
Spectrophotometric measurement of the pH of soil extractsusing a multiple indicator dye mixture
S . B a r g r i z a n a, R . J . S m e r n i k a & L . M . M o s l e y b
aThe School of Agriculture, Food and Wine, The University of Adelaide, Adelaide, South Australia, PMB 1, Glen Osmond, SA 5064, andbAcid Sulfate Soils Centre, School of Biological Sciences, The University of Adelaide, Adelaide, South Australia, PMB 1, Glen Osmond,SA 5064
Summary
This paper describes the development of a spectrophotometric method with an expanded pH range of 3–9 thatuses a mixed indicator solution (equimolar bromophenol blue, bromocresol purple, m-cresol purple and thymolblue). The method uses measurements of absorbance of the dye mixture at two wavelengths (434 and 585 nm),chosen to represent the average acid and base peak maxima of the individual dyes within the mixture. Theratio of absorbance at these two wavelengths was used to calculate pH based on measured dye properties (pKa,molar absorptivity) and fundamental equations derived from Beer’s law. The mixed dye spectrophotometric pHmeasurement was tested using certified pH buffers (pH (NBS/NIST) 4.00, 6.86, 9.18) and was found to be accurate towithin ± 0–0.06 pH units. Measurements made with the mixed dye showed good correlation against conventionalsoil pH measurement using a glass electrode (r = 0.99), and also an alkalinity titration (r = 0.99) through the pHrange 3–9. The average standard deviation was 0.07 for spectrophotometric soil pH measurement (n= 30) usingthe dye mixture. The mixed dye technique expands the working range of spectrophotometric pH measurementmethods in soils and other applications.
Highlights
• We developed a novel spectrophotometric method for measuring soil pH using a mixed indicator dye.• The method greatly extends the working soil pH range of previous single indicator dye approaches.• The results were well correlated with glass electrode measurements between pH 3 and 9.• The method provides new opportunities to study soil chemical processes affected by pH.
Introduction
Soil pH is a master variable for chemical and biological processessuch as equilibria among inorganic carbon species (Suarez, 1977),metal solubility, nutrient availability and microorganism activity(Miller & Kissel, 2010; Essington, 2015). A relatively minor changein pH (± 0.1 units) can induce significant changes in the availabilityof chemical species (e.g. metals, nutrients and carbonates) in soil(Lindsay, 1979).
Conventional soil pH measurement with a glass electrode(Heintze, 1934; Rayment & Lyons, 2011) suffers from severalinherent deficiencies. Unpredictability in liquid junction poten-tial (Millero, 1986) has been shown to cause an error of 0.03pH units across a 10-unit alteration in salinity (Easley & Byrne,2012). Other problems include considerable drift, especially inlow ionic strength solutions (Yuan & DeGrandpre, 2008), and the
Correspondence: L. Mosley. E-mail: [email protected] 29 October 2017; revised version accepted 12 September 2018
requirement that electrode calibration procedures match the ionicstrength of samples (Wiesner et al., 2006; Miller & Kissel, 2010).
Spectrophotometric pH measurement involving addition of a sin-gle indicator dye is used widely in marine chemistry because ofits reliability and high precision (Clayton & Byrne, 1993; Yao &Byrne, 2001; Mosley et al., 2004; Lai et al., 2016). Spectrophoto-metric methods avoid the problems associated with potentiometricpH measurement using a glass electrode (Yao & Byrne, 2001).
Spectrophotometric measurement has recently been adapted todetermine soil pH, where it achieved a similar precision (0.02–0.08pH unit) to conventional potentiometric techniques (Bargrizanet al., 2017). However, the phenol red (pKa= 8.03) and bromocre-sol purple (pKa= 6.49) dyes used in that study, like other sulfoneph-thalein dyes, are useful only in a narrow pH range of approximately± 1 pH unit from the pKa of the individual dye (King & Kester,1990; Yao & Byrne, 2001). A narrow working range has not beena major issue for spectrophotometric pH measurement in seawater(which has a relatively small pH range), but it causes problems for
spectrophotometric pH measurement in soils, which have a muchwider variation in pH (Miller & Kissel, 2010), even within a singlesoil profile (pH range of 3–7) (Mosley et al., 2017). Thus, con-ventional spectrophotometric measurement of soil pH with a singleindicator dye would require prior knowledge of the likely pH orpretesting with different dyes.
There has been some previous research using multiple dyemixtures for pH measurement. King & Kester (1989) carried outspectrophotometric measurement of seawater pH and alkalinitytitration using a mixture of two indicators, namely phenol redand bromocresol green (pKa= 7.492 and 4.410, respectively, inseawater). Their approach was limited by the fact that only low andhigh pH (end points) could be measured precisely within the rangeof 3–8.2 because the pKa values of these two dyes are separatedby more than 2 pH units. Lin & Liu (2000) and Raghuramanet al. (2006) tested multiple (three to four) dye mixtures where theindividual pKa values of the dyes were approximately 2 pH unitsapart (i.e. chosen so that when the working range of one dye ends,the working range of another begins).
Raghuraman et al. (2006) formulated a theoretical basis for pHdetermination based on the ratio of absorbances of the mixed dye’sacid and base peaks, measured at common wavelengths. However,the individual dyes chosen in their study had acid and base peakabsorbance maxima at quite different wavelengths, which makesit difficult to find a suitable common wavelength. Moreover, theirmethod did not appear to be validated against certified pH buffersolutions, tested against glass electrode pH measurement methodsor optimized for soil solutions.
A multiple dye technique had also been developed for colorimet-ric pH measurement in soils (Raupach & Tucker, 1959). Althoughthis method is still used for non-research applications (e.g. gardensoil test kits), its accuracy is quite poor (± 0.5 pH units) becausepH has to be estimated visually by comparing the colour of soiltreated with dye against a standard colour chart that has a resolu-tion of only 0.5 pH units (Rayment & Lyons, 2011). In general, it isdifficult to formulate a combination of sulfonephthalein dyes forcolorimetric measurement because colour intensity changes withpH can be quite difficult to detect (Netto et al., 1995). The advan-tage of the spectrophotometric method is that subtle changes in lightabsorbance spectra can be readily resolved and accurately relatedto the solution pH. A potential advantage of the spectrophotomet-ric pH method using indicator dyes in soil is that it could be usedto study pH in several dimensions, which is critically importantfor better assessment of geochemical reactions and plant–solute(e.g. nutrients, metals) interactions in soil. For example, Bloss-field & Gansert (2007) demonstrated the use of high-resolutionoptical scanning methods to quantify in situ pH around the rhi-zosphere, which showed considerable complexity and providedmore information than typical bulk soil measurements. Hyperspec-tral cameras and scanners potentially allow the full spectra to bemeasured, and therefore spectrophotometric pH in many spatialdimensions.
The aim of this study was to develop a spectrophotometricmethod, involving the addition of a multiple indicator dye solution,
to enable measurement across the typical range of soil pH values(between 3 and 9). The accuracy of the method was tested againststandard buffer solutions and the results were compared withconventional glass electrode measurements of soil extracts and analkalinity titration.
Materials and methods
Theory
The pH can be calculated by spectrophotometric measurementusing a single sulfonephthalein indicator dye as follows (Yao &Byrne, 2001; Bargrizan et al., 2017):
pH = − log[H+] = pKa + log
(R − e1
)(e2 − Re3
)− 4A
(𝜇
12
1 + 𝜇12
− 0.3𝜇
), (1)
where pKa is the second acid dissociation constant of the dye(at zero ionic strength), the second term in the equation isobtained by substitution for the ratio of the unprotonated base form(I2−) to the protonated acid (HI−) forms of the indicator in theHenderson–Hasselbalch (H–H) equation:
(pH = pKa + log
(I2−
HI−
)),
and R is defined as the ratio of the absorbance of the base toacid forms of indicator measured at the wavelengths of maximumabsorption (𝜆2 and 𝜆1, respectively), e1 –e3 are molar absorbanceratios (obtained by measuring molar absorption coefficients (𝜀)when only base and acid forms of dye are present at pH values muchgreater and less than the dye pKa, respectively), and the last term inEquation (1) is the Davies equation expression to calculate the meanactivity coefficient for the dye where A is the ion size parameter(0.5092 at 25∘C) and 𝜇 is ionic strength (note this equation is onlyappropriate for 𝜇 < 0.5 m activity corrections (Stumm & Morgan,1996)).
Similarly, for a mixture of two or more sulfonephthalein dyes,pH can be calculated using knowledge of the properties of theindividual dyes in the mixture and measurement of their absorptionspectra (Raghuraman et al., 2006). Starting with a mixture of twodyes, each containing separate acid (A1 and A2) and base (B1 andB2) species, respectively, an expression for cumulative absorbanceof the dye mixture at common wavelengths (𝜆1 and 𝜆2, respectively)can be formulated:
where based on Beer’s law, absorbance is proportional to theconcentration (denoted by [ ]) of the absorbing dye species (Ai orBi), the molar absorptivity coefficients (𝜀𝜆i) at wavelengths 𝜆i forAi and Bi, and the spectrophotometric cell pathlength (l). A ratio(Rmulti) of the cumulative absorbance of the base and acid species inthe two dyes at 𝜆2 to 𝜆1 can be calculated:
Rmulti =abs𝜆2
abs𝜆1=
𝜀𝜆2A1l
[A1
]+ 𝜀𝜆2
B1l[B1
]+ 𝜀𝜆2
A2l[A2
]+ 𝜀𝜆2
B2l[B2
]𝜀𝜆1
A1l[A1
]+ 𝜀𝜆1
B1l[B1
]+ 𝜀𝜆1
A2l[A2
]+ 𝜀𝜆1
B2l[B2
] . (4)
Equation (4) can be rewritten following substitution of10−(pH−pK′
ai) for [Ai][Bi] (see H–H equation above) and extended
to a mixture of n dyes:
Rmulti =
∑i𝜀𝜆2
Bi[Bi][B1]
(1 + 𝜀𝜆2
Ai
𝜀𝜆2Bi
10−(pH−pK′ai))
∑i𝜀𝜆1
Ai[Bi][B1]
(10−(pH−pK′
ai) + 𝜀𝜆1Bi
𝜀𝜆1Ai
) , for i = 1, n (5)
where [Bi
][B1
] = 1 + 10−(
pH−pK′a1
)
1 + 10−(pH−pK′ai)
fi
f1
, (6)
and f i is the mole fraction of dye i determined by dividing each dyeconcentration (in mol l−1) by the total concentration of mixed dyeand pK’a is the dissociation constant of the dye at the specific ionicstrength of the sample solution, which is calculated by the Daviesequation (as outlined above):
pK′a = pKa − 4A
(𝜇
12
1 + 𝜇12
− 0.3𝜇
). (7)
For a full derivation of these equations, see the SupportingInformation.
Experimental
Selection of dye mixture
The above theory relies on selecting a dye mixture that coversthe pH range of interest and measurement at two wavelengths(𝜆1 and 𝜆2) chosen to represent the absorbance of the acid andbase species of all the indicator dyes in the mixture. Full spectralmodelling of the multiple dye mixture could potentially enable awider range of dyes to be assessed (Ohline et al., 2007) becauseit would not rely on just the assessment at two wavelengths.However, this is likely to be more complex in terms of spectralanalysis and might not be possible as many of the dyes have verysimilar absorption spectra (which makes separation of individualcontributions difficult).
It is required that (i) the pKa of the individual dyes in the mixtureare collectively able to cover the entire desired range of pH by beingwithin approximately 2 units of each other (the individual dyeshave a limited working pH range as discussed above) and (ii) theindividual dyes have similar wavelengths of maximum acid and
base peak absorbance to maximize sensitivity at the wavelengthschosen for measurement (𝜆1 and 𝜆2).
Different sulfonephthalein dyes have different absorbance spec-tra; Figure 1 shows spectra of six common indicator dyes: phenolred (PR), bromocresol purple (BCP), bromophenol blue (BPB),m-Cresol purple (mCP), bromocresol green (BCG) and thymol blue(TB). The acid peak wavelength is similar for all the dyes, but thebase peak wavelengths for phenol red and bromocresol green areto the right and left, respectively, of the base peak wavelengthsof the other four dyes. Therefore, in this study an indicator dyemixture comprising BPB, BCP, mCP and TB was chosen for test-ing because it fulfilled both requirements (i) and (ii) above. Thevertical dashed lines in Figure 1(a,b) show the common wave-lengths (𝜆1 = 434 nm, 𝜆2 = 585 nm) that were chosen to representthe respective average acid and base peak maxima of the four-dyemixture. There are other dyes within the pH range of interest, suchas cresol red (7–8.8), bromophenol red (5.2–6.8) and chlorophenolred (4.8–6.4), that could potentially be used in a mixture, taking intoconsideration the selection criteria above. Fewer dyes in the mixturecould also be considered if the soils of interest covered a narrowsoil pH range.
Molar absorption and pKa determination
It is important to note that because the chosen wavelengths(𝜆1 = 434 nm, 𝜆2 = 585 nm) did not correspond precisely with thepeak maxima for each individual dye (Figure 1), the molar absorp-tivity (𝜀) had to be determined at these wavelengths. Previous lit-erature values of 𝜀 for these dyes have typically been measuredat the maximum peak absorbance, which is appropriate for indi-vidual dye measurement. Therefore, the molar absorptivities (𝜀𝜆i)of the above dyes were measured at extreme pH values whereeither acid or base from of each dye was present (Clayton &Byrne, 1993) by adjusting a diluted stock solution of the dyeusing 1 mol l−1 HCl and 0.1 mol l−1 NaOH, respectively. The mea-sured absorbance, known concentration of the diluted stock solu-tion and cell pathlength (1 cm) were used to calculate 𝜀𝜆i withBeer’s law.
The pKa value of BCP has been measured accurately for spec-trophotometric pH measurement by Yao & Byrne (2001). The pKa
values of BPB, mCP and TB have received less attention and so theywere determined at 25∘C by the addition of a single indicator dyeto certified pH buffer solutions (i.e. pHNBS/NIST 4.00 phthalate buffer(0.05 mol kg−1), pHNBS/NIST 6.86 phosphate buffer (0.025 mol kg−1)and pHNBS/NIST 9.18 disodium tetraborate buffer (0.01 mol l−1)).The standard reference materials used to prepare the phthalate andphosphate buffers were NIST 185i and 186g, respectively (theyrefer to certification documentation on the NIST website for bufferpreparation), and Certipur® (traceable to NIST) was used for thedisodium tetraborate buffer. To enable comparison with the pHdefined in the spectrophotometric method based on hydrogen ionconcentration (free hydrogen ion scale, pHfree, Equation (1)), cor-rection of pH (based on the hydrogen ion activity scale, pHNBS/NIST)
Figure 1 Comparison of (a) acid and(b) base spectra of different dyes(BPB, bromophenol blue; BCG, bromocresolgreen; BCP, bromocresol purple; PR, phenolred; mCP, m-cresol purple; TB, thymol blue).The vertical dashed lines are the chosenwavelengths where the multiple dye mixtureacid (𝜆1) and base peak (𝜆2) absorbances weremeasured.
(a)
(b)
of these buffers was carried out using Equation (8) (Bargrizanet al., 2017):
pHfree = − log[H+] = pHNBS∕NIST + log 𝛾H+, (8)
where 𝛾 is the activity coefficient calculated with the Daviesequation. This gave pH values of 3.91, 6.77 and 9.11 for the threebuffers. With R at the peak maxima for three dye additions (0.01,0.02, 0.03 ml) and corrected by linear interpolation to zero ionicstrength to remove the small perturbations in dye pH (see Bargrizanet al., 2017), Equation (1) and the Davies equation ionic strengthcorrection for the dye (Yao & Byrne, 2001), the pKa of eachindicator was then calculated. All glass electrode pH measurements
(pHelec) expressed later were also corrected to the free hydrogen ionscale. The certified pH buffers with known pH (4.00, 6.86, 9.18)were also used to test the accuracy of the mixed dye solution.
Spectrophotometric and glass electrode pH measurements
For multiple dye mixture measurements using the spectrophoto-metric method, a stock solution containing bromocresol purple(BCP), bromophenol blue (BPB), m-cresol purple (mCP) andthymol blue (TB) was prepared at a total dye concentration of8× 10−3 mol l−1 using equal mole fractions (f = 0.25) and adjustedto pH≈ 7 using 0.1 mol l−1 NaOH. During sample measurement,the mixed dye stock solution concentration was 2× 10⁻⁵ mol l−1
Figure 2 Theoretical curve to estimate pHspec from the measured ratio(Rmulti) of the mixed indicator dye base and acid species absorbances at thechosen wavelengths (𝜆1 = 434 nm, 𝜆2 = 585 nm) at 𝜇= 0.1 m for standardphosphate buffer.
to 6× 10⁻⁵ mol l−1 depending on the volume (0.01, 0.02, 0.03 mlsequential additions) of dye added into 4 ml of sample in a 1-cmglass cuvette. The reason for sequential addition of the dye is toaccount for the effect of any indicator-induced pH perturbation(Clayton & Byrne, 1993). Full details of the spectrophotometricprocedure for soil pH measurement can be found in Bargrizan et al.(2017).
The maximum acid and base absorbances were at 434 and 585 nmon a dual-beam spectrophotometer (GBC UV/VIS 916, Melbourne,Australia) connected to Cintral™ software. With Equation (5), atheoretical relation for the dye mixture Rmulti (measured at 434 and585 nm) against pH was calculated from pH 3 to 9 (at 0.01 pH inter-vals) and this relation is plotted in Figure 2. Because of the com-plexity and difficulty of solving Equation (5) analytically, a look-uptable was created in Microsoft Excel™ to convert a measured Rmulti
value to its corresponding pH value to the nearest 0.01 pH unit(Table S3, Supporting Information). The Rmulti value is unique bothto the dye mixture and the individual dye mole fractions compris-ing the mixture. Further, the ionic strength of the sample solutionaffects the relation between Rmulti and pH. This effect is correctedimplicitly by the Davies equation, which corrects pKa (at 𝜇= 0) topKa
′ at variable ionic strength. The potential effect of any weighingerrors on mole fractions of individual dyes used to calculate Rmulti
was assessed by changing mole fractions by a factor of 0.0025(error of 1% on mole fraction of 0.25) and recalculating (Figure S3,Supporting Information). There was a difference in the Rmulti cal-culated for the equal mole fraction of the order ± 0.001 to 0.1 units(Figure S4, Supporting Information). This difference increased asR and pH increased, and also varied depending on which dye pairthe mole fraction was varied. This suggests care should be takenin preparing mole fractions of dyes to minimize any weighing andother errors in the preparation of the mixed dye solution.
The pH was measured simultaneously with a glass electrode(Orion SureFlow model™, Waltham, MA, U.S.A.) connected toa TPS™ model pH meter after calibrating with commercially
available buffers (𝜇≈ 0.1 mol l−1) at 25∘C. The pH electrode(pHNBS/NIST) measurements were corrected to the pHfree scale usingEquation (8) above.
Alkalinity titration
To compare pH determined by the mixed dye method, pHspec, topHelec throughout the pH range of interest, an alkalinity titrationwas performed. Mixed dye solution (250 μl) was added to 100 mlof a Na2CO3 solution (400 mg l−1 as CaCO3) and titrated using1.600 N sulphuric acid. The volume of acid added by the digitaltitrator (HACH™) was recorded throughout the titration. The pHwas measured using a glass electrode after every 20-μl incrementaladdition of sulphuric acid. Simultaneously, 4 ml of this solution waspipetted to the cuvette for spectrophotometric pH measurement andthen tipped back into the titration flask. The titration was continueduntil pH< 3 was achieved.
Soil-solution preparation
To test the mixed dye method for use in soils, soil samples (n= 10)within the range of pH 3–9 were analysed (Table S4, SupportingInformation). Three replicates of each soil extract (1:1 25 g soil to25 ml water) were used for spectrophotometric and glass electrodemeasurements of pH at 25∘C. Refer to Bargrizan et al. (2017) formore details on soil extract preparation and measurement.
Results and discussion
Indicator properties and comparison of results with previousstudies
Table 1 and Table S1 (Supporting Information) summarize thecharacteristics of the individual indicators that made up the mixeddye. The pKa value obtained for mCP (8.64) was very similar to thevalue of 8.63 reported by Mosley et al. (2004) and 8.66 by Lai et al.(2016). The measured pKa values for TB and BPB determined inour study were 9.22 and 4.34, respectively. Our value for TB wasslightly larger than those determined by Mosley et al. (2004, pKa
= 9.12) and Bishop (1972, pKa = 9.20). The pKa of BPB reportedby Shokrollahi & Zare (2016) was exactly the same as the value we
Figure 3 Difference between spectrophoto-metric pH measurement using mixed dye(pHspec) and certified pH values (pHfree) of cer-tified standard buffer solutions.
2 4 6 8 10
pHmix
-0.06
-0.04
-0.02
0
0.02
0.04
0.06
pHm
ix -
pH
free
Phosphate buffer
Phthalate buffer
Disodium tetraborate buffer
obtained. The pKa value obtained for BPB was about 0.24 pH unitshigher than that provided by Bishop (1972). The reason for thelarger discrepancies observed between our pKa values and those ofShokrollahi & Zare (2016) and Bishop (1972) for BPB is unclear;however, it might relate in part to dye impurities (Liu et al., 2011).
Table 2 shows the molar absorptivity results for individual indi-cators. These 𝜀 values, and the pKa values shown in Table 1, wereused in Equations (5) and (6) to calculate the value of Rmulti as afunction of pH.
Measurement on standard pH buffers
The accuracy of the pH values determined using the mixed indica-tor dye approach was tested against certified reference phosphate(pHfree = 6.77), phthalate (pHfree = 3.91) and disodium tetraborate(pHfree = 9.11) buffer solutions. Figure 3 shows the deviation (resid-ual) of pH measured spectrophotometrically using the mixed dye(pHspec) from the certified pH values. The accuracy was ± 0–0.06pH units using the mixed dye and there appears to be a slight (∼0.02pH unit) positive bias to the residuals. Accuracy was less for thepH 9.11 buffer than for the other buffers. The curve of Rmulti againstpH (Figure 2) suggests that the method is likely to be more sensitiveand accurate at pH> 5 (lower slope, so any error in determinationof Rmulti would lead to less error in pH). The pH range through
which the protonation of TB varies possibly also has less sensitivitybecause the base peak is slightly more offset from the common mea-surement wavelength than for the other dyes (Figure 1). Examina-tion of the mixed dye spectra in the three buffers (Figure 4) indicateslow absorbance for the acid peak of the mixed dye in the disodiumtetraborate buffer. This is consistent with the range of the chosendye mixture being limited to pH< 9, as is explored further below inthe acid–base titration.
Acid–base titration with mixed indicator
Figure 5(a) shows the pH values for an alkalinity titration deter-mined by spectrophotometric and glass electrode methods. Astrong correlation (r > 0.99, root mean square error (RMSE)= 0.13)between pHelec and pHspec was observed throughout the pH range3–9 (Figure 5b). The pHspec readings are on average lower by0.08 pH units than pHelec throughout this range. For all pH val-ues between 3 and 9, peaks from both acid and base species ofat least one component of the mixed dye were present (Figure 6).There is weaker correlation outside this pH range (≤ 3 and≥ 9)because all the individual dyes in the mixture were predominantlyeither in their acid (pH< 3) or base form (pH> 9). This is consis-tent with the findings of Raghuraman et al. (2006), who found that
Figure 4 Absorbance plotted against wave-length for the basic (I2−) and acidic (HI−) formsof mixed dye in the certified reference buffersolutions. The vertical dashed red line indicatesthe selected wavelengths for measurement of434 and 585 nm, respectively.
accuracy was less at extreme pH values. The colour of the dye atvarious points during the titration is shown in Table S2, SupportingInformation.
The accuracy of spectrophotometric soil pH measurements couldbe assessed by comparing measured pH with pH calculated bymeasuring or constraining two other carbonate system parameters(e.g. alkalinity, pCO2, by equilibrating samples with fixed pCO2)(Patsavas et al., 2015). This may give a clearer indication of mea-surement accuracy and comparison of accuracy between pHspec andpHelec.
Comparison of pH for soil extracts determined usingspectrophotometric and glass electrode methods
The pH of ten soils across a pH range of 3–9 was analysedspectrophotometrically with the multiple indicator dye mixtureand compared with glass electrode measurements (Figure 7). Ingeneral, the results obtained from both methods were stronglycomparable (r > 0.99, RMSE= 0.17) across this wide range of soilpH. However, there was a difference between the two methods;pHspec was + 0.12 units higher than pHelec on average (Figure S1,Supporting Information).
These differences in average pH might relate to liquid junctionerrors and calibration difficulties with electrodes across variableionic strengths (Miller & Kissel, 2010). The apparent differencesalso increase near the pKa limits of the dye mixture (Figure S1,Supporting Information), which might result from larger errors inspectrophotometric measurements near the limits of the method.This difference does not appear to relate to ionic strength because aplot of residuals against 𝜇 showed no systematic pattern (Figure S2,Supporting Information). Errors from the use of non-purified dyeshave been estimated to be typically of the order of 0.01–0.02 pHunits, which could account for some of the differences (Yao et al.,
2007; Liu et al., 2011). Large concentrations of dissolved organicmatter in the soil solution might also introduce errors of the orderof around 0.01–0.1 pH units (Muller et al., 2018).
The average standard deviations (precision) for the measurementof pH of three replicates of each soil sample were 0.07 and 0.06 pHunits for the mixed dye spectrophotometric method and electrodemethod, respectively. The precision was less than that of singledye measurements in water, which might relate to (i) the greatercomplexity and influence of the multiple dye mixture preparationand (ii) the fact that the determination of soil pH requires morepreparation steps than determination of the pH of water (Bargrizanet al., 2017). Soil samples are also more heterogeneous than watersamples and also potentially more influenced by CO2 produced bymicrobial respiration of the samples (Zabowski & Sletten, 1991).
Overall, precision of the spectrophotometric method using themixed dye method is better than the precision of 0.1 pH unitssuggested as satisfactory for soil pH measurement by Miller &Kissel (2010) and Kalra (1995). The less stringent acceptable limitsfor precision in the measurement of pH for soil than for waterreflects the fact that soil is more heterogeneous, can have a widepH range and can undergo large fluctuations in pH from processessuch as oxidation–reduction and respiration.
The multiple dye method has been designed to cover a widerange of pH that can occur in soil; if narrow pH ranges are thetarget of investigation use of a single dye approach is recommended(Bargrizan et al., 2017).
A potential major advantage of spectrophotometric methods isthat the dye could be readily applied to study spatial and tem-poral dynamics of pH at high resolution in soil. For example,plant-induced alteration of pH in the root–rhizosphere–soilinterface occurs at <mm scales and is of great importance forunderstanding the (i) physicochemical conditions of plant nutrientacquisition and uptake, (ii) rhizosphere microbial network and
Figure 5 (a) Alkalinity titration of a sodiumbicarbonate solution (400 mg l−1 as CaCO3) with1.6 N sulphuric acid. The pH was measured bya spectrophotometric method using the multipledye mixture and a conventional potentiometricmethod with a glass electrode. (b) Comparisonof spectrophotometric and glass electrode pHmeasurements over pH range 3–9 in the alkalinitytitration (r = 0.99).
0 50 100 150 200 250 300 350 400 450 500 550
μl of 1.6 N>H2SO
4
2
3
4
5
6
7
8
9
10
11
pH
(a)
2 4 6 8 10
pHelec
2
4
6
8
10
pHsp
ec
pH range between 3 and 9(b)
(1:1)
Line
pHelec
pHspec
(iii) biogeochemical production of methane and dinitrous oxide inwetland soils (Blossfeld & Gansert, 2007).
Conclusion
A multiple indicator dye mixture, comprising equimolar con-centrations of bromophenol blue, bromocresol purple, m-cresol
purple and thymol blue, was used to extend the useful pH rangeof spectrophotometric methods using a single dye compound.The requirement of the individual dyes comprising the mixture tocover the desired pH range was satisfied using this dye mixture.In practical terms, this required that there was a difference ofno more than 2 pH units between consecutive dye pKa values,and that all dyes had approximately similar acid and base peak
Figure 6 Spectra of the multiple dye mixture at differ-ent pH (9.33, 8.41, 7.48, 6.66, 5.89, 3.69, 3) during thealkalinity titration.
400 450 500 550 600 650 700Wavelength / nm
0
0.1
0.2
0.3
0.4
0.5
0.6
0.7
0.8
0.9
1
Abs
orba
nce
9.33
8.41
7.48
6.66
5.89
3.69
3
Figure 7 Correlation between spectrophotometric(pHspec) and electrode methods (pHelec) in different soilwater extracts (n= 30, 10 soil samples × 3 replicates,r = 0.99).
2 3 4 5 6 7 8 9
pHelec
2
3
4
5
6
7
8
9
pHsp
ec
(1:1) Line
wavelength maxima. Spectrophotometric pH measurements usingthe mixed dye showed an accuracy of approximately ± 0–0.06pH units based on measurement of certified pH standard buffersolutions. The multi-dye performance was further demonstratedin an alkalinity titration, which gave comparable results to theglass electrode method throughout a pH range of 3–9. The resultsindicate that the proposed mixed dye in this study may be appliedto spectrophotometric soil pH measurement with high precision(± 0.07), but it would be beneficial to test a wider range of soilswith this method. In addition to the potential advantages notedabove with spectrophotometric pH methods compared to electrodemethods (i.e. lack of drift, liquid junctions or suspension effects),dyes could also be applied to study pH accurately in multipledimensions (e.g. down a soil profile, around minerals or organicmatter, or around the root zone). This opens up new opportunitiesfor research to understand the role of pH better in influencingbiogeochemical processes in soils and other systems.
Supporting Information
The following supporting information is available in the onlineversion of this article:Appendix S1. Derivation of spectrophotometric pH equations usinga dye mixture.Table S1. The mean molar absorption ratios and standard deviations(in brackets) at 25∘C for mCP, BCP, BPB and TB (used forsingle indicator dye measurements at wavelengths of maximumabsorption of acid and base forms of the dye).Table S2. The mixed indicator colour change at selected points (pHvalues) in the alkalinity titration.Table S3. The look-up table for Rmulti as a function of pH.Table S4. Soil physical and chemical properties.Figure S1. The difference in pH between the spectrophoto-metric and glass electrode methods plotted against electrodepH values.
Figure S2. The difference in pH between the spectrophotometricand glass electrode methods plotted against ionic strength (μ).Figure S3. Effect of changing mole fractions of a four-dye mixture(mCP- BCP-BPB-TB) on Rmulti as a function of pH.Figure S4. The residual plot for Rmulti calculated for the equal anddifferent mole fractions against Requl-mole.
Acknowledgements
We acknowledge the assistance of Zhoubin Maneshi (HeidelbergUniversity) for assistance with justification of the theoreticalequations for a mixed dye solution. Sima Bargrizan acknowledgesthe assistance of a University of Adelaide postgraduate scholarship,and LM acknowledges the assistance of the Australian Common-wealth Government through an Australian Research CouncilDiscovery Project Grant DP170104541. We thank an AssociateEditor and anonymous reviewers whose comments enabled usto improve the manuscript.
References
Bargrizan, S., Smernik, R.J. & Mosley, L.M. 2017. Development of aspectrophotometric method for determining pH of soil extracts andcomparison with glass electrode measurements. Soil Science Society ofAmerica Journal, 81, 1350–1358.
Bishop, E. 1972. Indicators. Pergamon Press, Oxford.Blossfeld, S. & Gansert, D. 2007. A novel non-invasive optical method for
quantitative visualization of pH dynamics in the rhizosphere of plants.Plant, Cell & Environment, 30, 176–186.
Clayton, T.D. & Byrne, R.H. 1993. Spectrophotometric seawater pH mea-surements: total hydrogen ion concentration scale calibration of m-cresolpurple and at-sea results. Deep Sea Research Part I: OceanographicResearch Papers, 40, 2115–2129.
Easley, R.A. & Byrne, R.H. 2012. Spectrophotometric calibration of pHelectrodes in seawater using purified m-cresol purple. EnvironmentalScience & Technology, 46, 5018–5024.
Essington, M.E. 2015. Soil and Water Chemistry: an Integrative Approach,2nd edn. CRC Press, New York.
Heintze, S.G. 1934. The use of the glass electrode in soil reaction andoxidation-reduction potential measurements. Journal of AgriculturalScience., 24, 28–41.
Kalra, Y.P. 1995. Determination of pH of soils by different methods:collaborative study. Journal of AOAC International, 78, 310–324.
King, D.W. & Kester, D.R. 1989. Determination of seawater pH from 1.5 to8.5 using colorimetric indicators. Marine Chemistry, 26, 5–20.
King, D.W. & Kester, D.R. 1990. Spectral modeling of sulfonephthaleinindicators: application to pH measurements using multiple indicators.Applied Spectroscopy, 44, 722–727.
Lai, C.Z., DeGrandpre, M.D., Wasser, B.D., Brandon, T.A., Clucas, D.S.,Jaqueth, E.J. et al. 2016. Spectrophotometric measurement of freshwaterpH with purified meta-cresol purple and phenol red. Limnology andOceanography Methods, 14, 864–873.
Lin, J. & Liu, D. 2000. An optical pH sensor with a linear response over abroad range. Analytica Chimica Acta, 408, 49–55.
Lindsay, W.L. 1979. Chemical Equilibria in Soils. John Wiley & Sons Ltd,Chichester.
Liu, X., Patsavas, M.C. & Byrne, R.H. 2011. Purification and characteriza-tion of meta-cresol purple for spectrophotometric seawater pH measure-ments. Environmental Science & Technology, 45, 4862–4868.
Miller, R.O. & Kissel, D.E. 2010. Comparison of soil pH methods onsoils of North America. Soil Science Society of America Journal, 74,310–316.
Millero, F.J. 1986. The pH of estuarine waters. Limnology and Oceanogra-phy, 31, 839–847.
Mosley, L.M., Husheer, S.L. & Hunter, K.A. 2004. Spectrophotometric pHmeasurement in estuaries using thymol blue and m-cresol purple. MarineChemistry, 91, 175–186.
Mosley, L.M., Biswas, T.K., Cook, F.J., Marschner, P., Palmer, D., Shand,P. et al. 2017. Prolonged recovery of acid sulfate soils with sulfuricmaterials following severe drought: causes and implications. Geoderma,308, 312–320.
Muller, J.D., Schneider, B., Abmann, S. & Rehder, G. 2018. Spectropho-tometric pH measurements in the presence of dissolved organic mat-ter and hydrogen sulfide. Limonology and Oceanography: Methods, 16,68–82.
Netto, E.J., Peterson, J.I., Mcshane, M. & Hampshire, V. 1995. A fiber-opticbroad-range pH sensor system for gastric measurements. Sensors andActuators B: Chemical, 29, 157–163.
Ohline, S.M., Reid, M.R., Husheer, S.L., Currie, K.I. & Hunter, K.A. 2007.Spectrophotometric determination of pH in seawater off Taiaroa Head,Otago, New Zealand: full-spectrum modelling and prediction of pCO2
2015. Internal consistency of marine carbonate system measurements andassessments of aragonite saturation state: insights from two U.S. coastalcruises. Marine Chemistry, 176, 9–20.
Raghuraman, B., Gustavson, G., Van Hal, R.E.G., Dressaire, E. & Zhdaneev,O. 2006. Extended-range spectroscopic pH measurement using optimizedmixtures of dyes. Applied Spectroscopy, 60, 1461–1468.
Raupach, M. & Tucker, B. 1959. The field determination of soil reaction.Journal of the Australian Institute of Agricultural Science, 25, 129–133.
Shokrollahi, A. & Zare, E. 2016. Determination of acidity constants ofbromophenol blue and phenol red indicators by solution scanometricmethod and comparison with spectrophotometric results. Journal ofMolecular Liquids, 219, 1165–1171.
Stumm, W. & Morgan, J. 1996. Aquatic Chemistry: Chemical Equilibriaand Rates in Natural Waters, 3rd edn. Wiley Interscience, New York.
Suarez, D.L. 1977. Ion activity products of calcium carbonate in watersbelow the root zone. Soil Science Society of America Journal, 41,310–315.
Wiesner, A.D., Katz, L.E. & Chen, C.C. 2006. The impact of ionic strengthand background electrolyte on pH measurements in metal ion adsorptionexperiments. Journal of Colloid and Interface Science, 301, 329–332.
Yao, W. & Byrne, R.H. 2001. Spectrophotometric determination of freshwa-ter pH using bromocresol purple and phenol red. Environmental Science& Technology, 35, 1197–1201.
Yuan, S. & DeGrandpre, M.D. 2008. Evaluation of indicator-based pHmeasurements for freshwater over a wide range of buffer intensities.Environmental Science & Technology, 42, 6092–6099.
Zabowski, D. & Sletten, R.S. 1991. Carbon dioxide degassing effects on thepH of spodosol soil solutions. Soil Science Society of America Journal,55, 1456–1461.