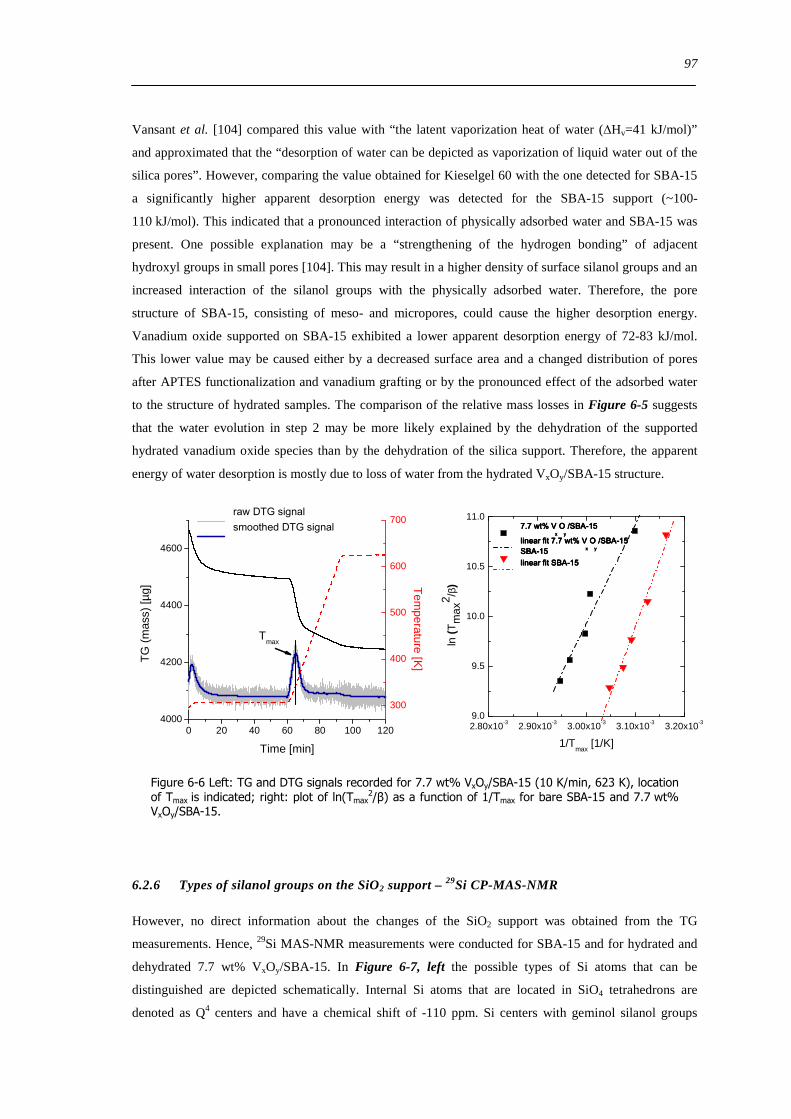
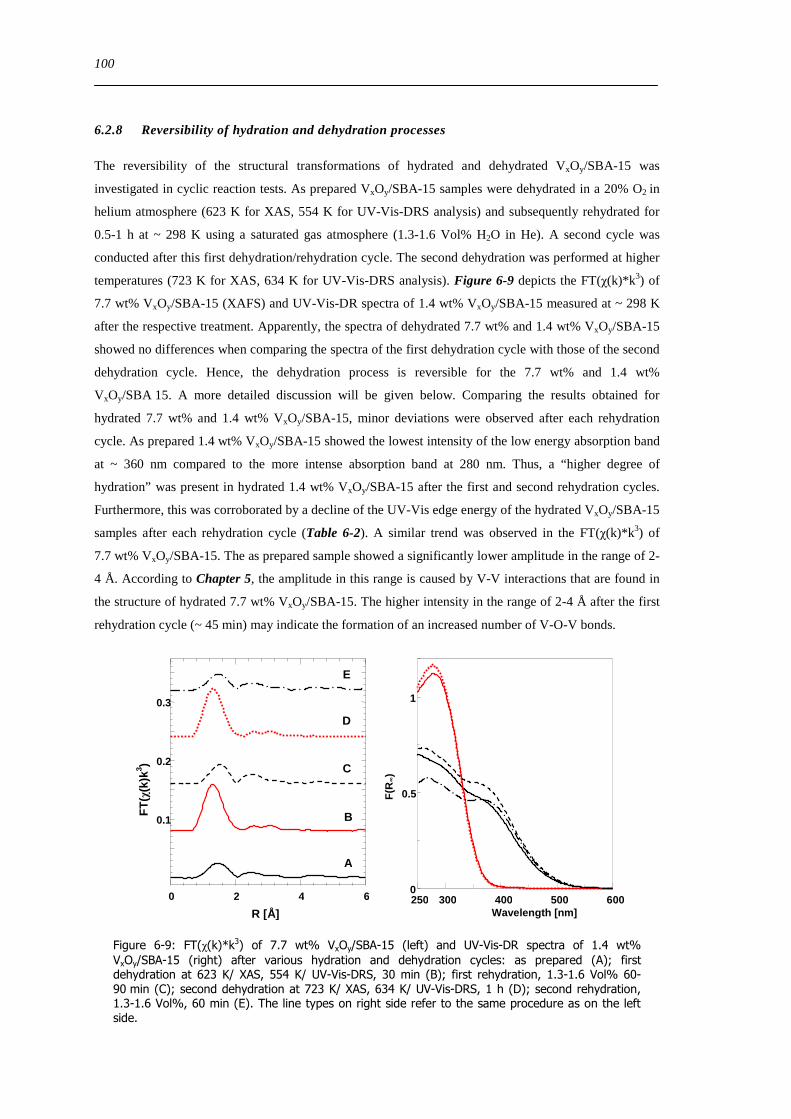
Figure 6-9 FT(χ(k)k 3) of 77 wt VxOySBA-15 (left) and UV-Vis-DR spectra of 14 wt VxOySBA-15 (right) after various
hydration and dehydration cycles as prepared (A) first dehydration at 623 K XAS 554 K UV-Vis-DRS 30 min (B) first
rehydration 13-16 Vol 60-90 min (C) second dehydration at 723 K XAS 634 K UV-Vis-DRS 1 h (D) second rehydration
13-16 Vol 60 min (E) The line types on right side refer to the same procedure as on the left side 100
Figure 6-10 Left FT(χ(k)k 3) of differently hydrated 77 wt VxOySBA-15 and V2O5 Right result of the least-squares fit
( ) using the V K edge XANES spectra of dehydrated and rehydrated 77 wt VxOySBA-15 ( ) recorded after the
first de-rehydration cycle (Figure 6-9 left) to the experimental XANES spectrum ( )of two week old as-prepared 77 wt
Figure 6-11 UV-Vis-DR spectra of 77 wt VxOySBA-15 (left) and 14 wt VxOySBA-15 (right) as-prepared (14 wt)
hydrated after calcination (77 wt) ( ) dehydrated as-prepared sample ( ) hydrated one year old sample
( ) dehydrated one year old sample ( ) dehydration parameters 20 O2 in He 554 K 30 min all spectra recorded at
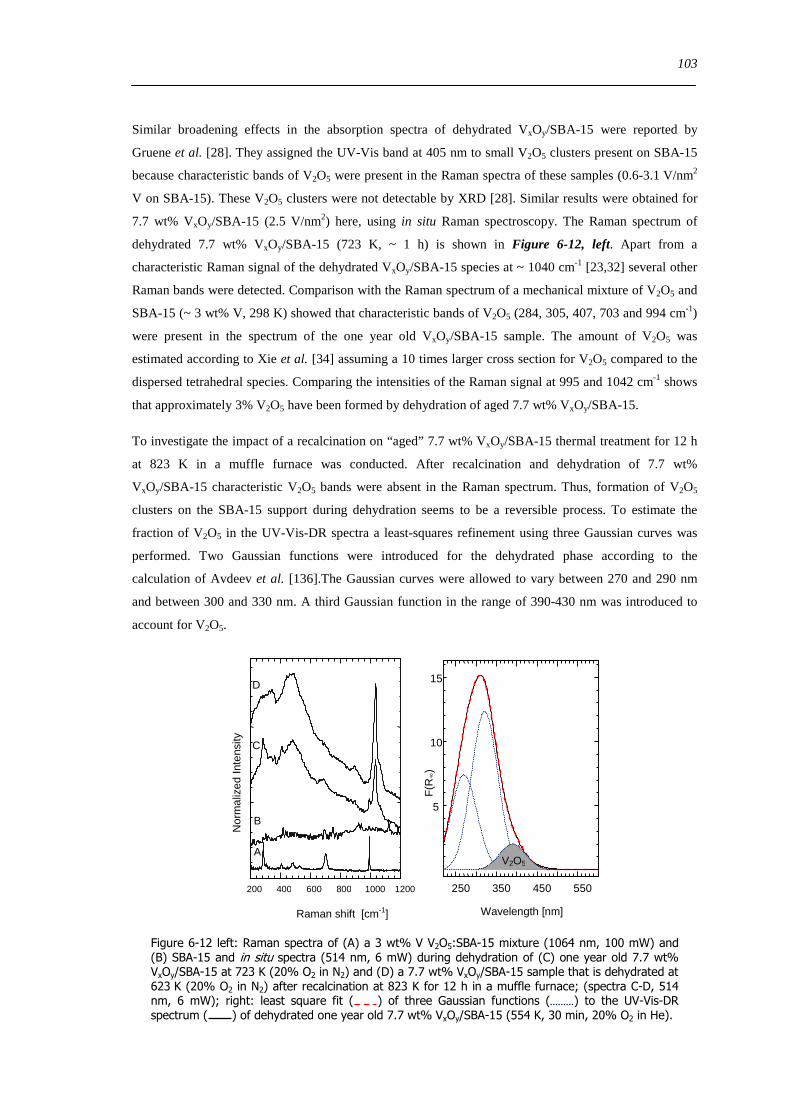
Figure 6-12 left Raman spectra of (A) a 3 wt V V2O5SBA-15 mixture (1064 nm 100 mW) and (B) SBA-15 and in situ spectra
(514 nm 6 mW) during dehydration of (C) one year old 77 wt VxOySBA-15 at 723 K (20 O2 in N2) and (D) a 77 wt
VxOySBA-15 sample that is dehydrated at 623 K (20 O2 in N2) after recalcination at 823 K for 12 h in a muffle furnace (spectra
C-D 514 nm 6 mW) right least square fit ( ) of three Gaussian functions ( ) to the UV-Vis-DR spectrum ( ) of
Figure 6-13 Left V K edge FT(χ(k)k 3) of 77 wt VxOySBA-15 after different dehydration procedures 623 K 10 O216 Vol
H2OHe (A) 623 K 10 O2He (B) 298 K 10 O2He (C) and 1st dehydration cycle (623 K 20 O2He) 298 K (D) Right in situ
UV-Vis-DR spectra of the 14 wt VxOySBA-15 sample during dehydration together with water ion current me 18 (554 K
4 Kmin13 Vol H2O 20 O2 in He) The inset shows the 2D spectra recorded at 86 min and 113 min 105
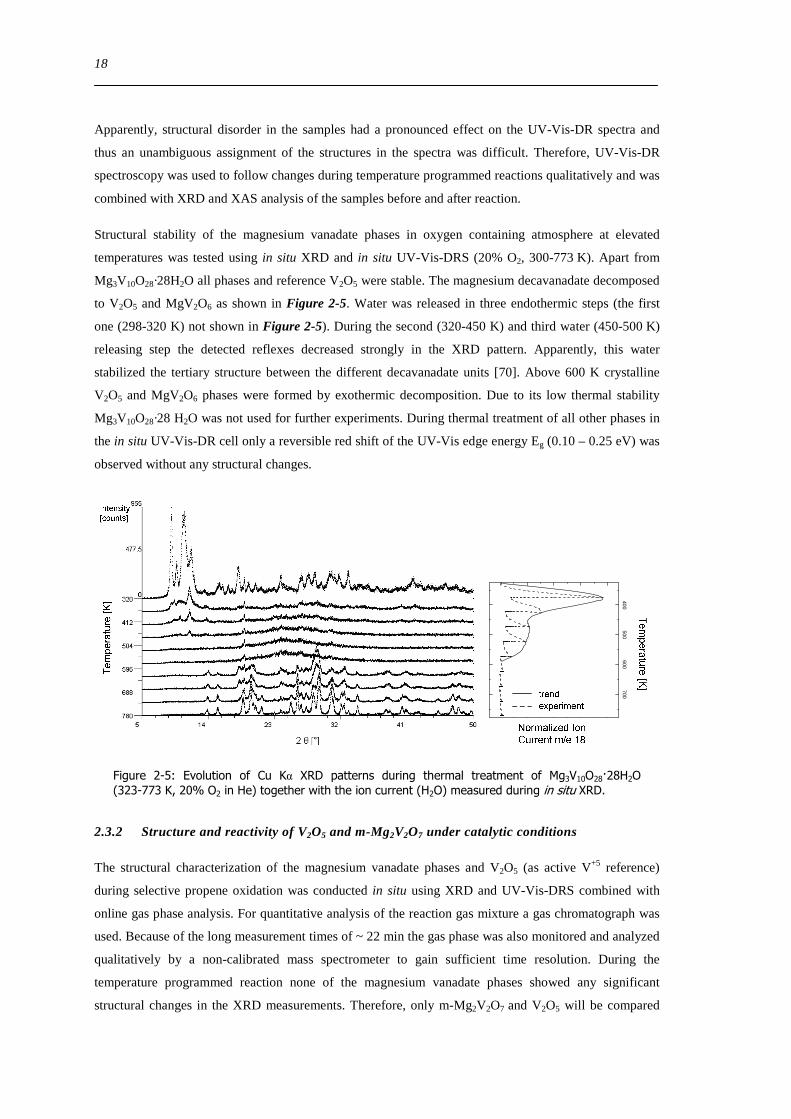
Figure 6-14 UV-Vis-DR spectra recorded at 298 K after different dehydration cycles 1st dehydration at 554 K for 30 min ( )
2nd dehydration at 634 K for 1 h ( ) 3nd dehydration at 554 K for 30 min (13 Vol H2O) and 15 min (ldquodryrdquo) ( ) The
samples were diluted with SBA-15 (13 (SBA-15 77 wt VxOySBA-15) and 11 (SBA-15 14 or 41 wt VxOySBA-15)) 107
Figure 6-15 Schematic drawing of assumed dynamic structural transformations of supported vanadium oxide phase on SBA-15
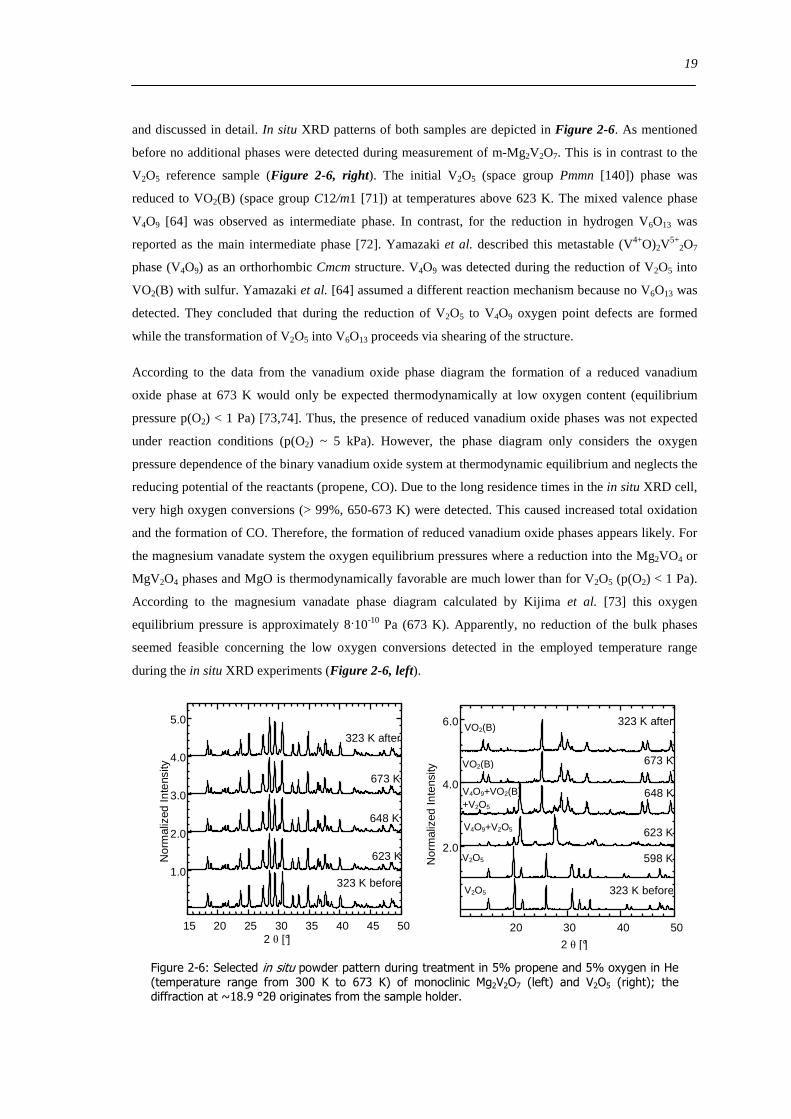
Figure 7-1 V K edge XANES (left) FT(χ(k)k 3) (middle) and UV-Vis-DR spectra (right) recorded at 298 K after dehydration
(solid line 623 K 1 h 20 O2 in He) and after propene oxidation (dashed line 673 K (UV-Vis) and 723 K (XAS) 1 h 5 O2 and
Figure 7-2 Top and middle in situ UV-Vis-DR spectra of dehydrated VxOySBA-15 (623 K 1 h 20 O2 in He) and the evolution of
the ion current me 56 (acrolein) during the temperature programmed reaction (A) 77 wt VxOySBA-15 (675 K 5 O2 and 5
propene in He 1st run) (B) 14 wt VxOySBA-15 (634 K 5 O2 and 5 propene in He 1st run) (C) 77 wt VxOySBA-15 (675
K 1 h 5 O2 and 5 propene in He 2nd run) (D) 77 wt VxOySBA-15 (675 K 5 O2 in He) Bottom Evolution of the ion
current me 56 for the 1st and 2nd measurement run All measurements were performed with 4 Kmin 119
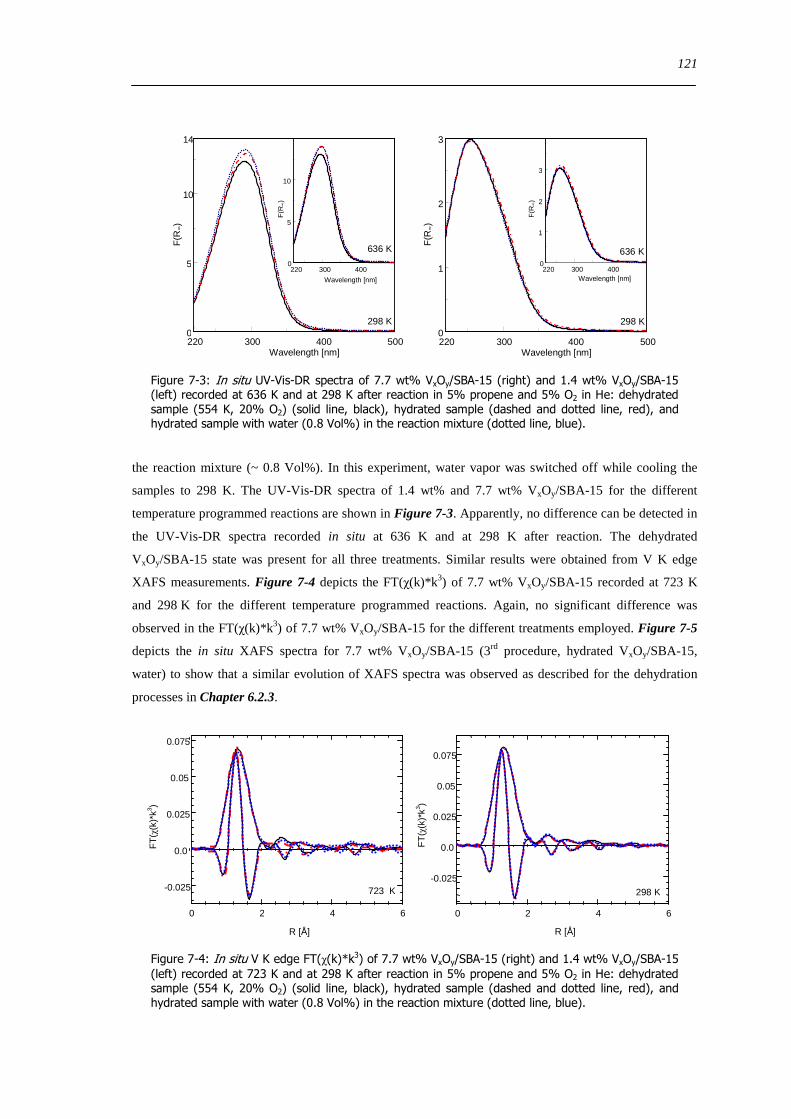
Figure 7-3 In situ UV-Vis-DR spectra of 77 wt VxOySBA-15 (right) and 14 wt VxOySBA-15 (left) recorded at 636 K and at
298 K after reaction in 5 propene and 5 O2 in He dehydrated sample (554 K 20 O2) (solid line black) hydrated sample
(dashed and dotted line red) and hydrated sample with water (08 Vol) in the reaction mixture (dotted line blue) 121
Figure 7-4 In situ V K edge FT(χ(k)k 3) of 77 wt VxOySBA-15 (right) and 14 wt VxOySBA-15 (left) recorded at 723 K and
at 298 K after reaction in 5 propene and 5 O2 in He dehydrated sample (554 K 20 O2) (solid line black) hydrated sample
(dashed and dotted line red) and hydrated sample with water (08 Vol) in the reaction mixture (dotted line blue) 121
209
Figure 7-5 Evolution of the recorded MS ion currents (left top) and the V K edge pre-edge peak height () and energy position
() (left bottom relative to 5465 keV) and the phase fraction for the hydrated () and dehydrated () vanadium oxide structure
obtained from a PCA (left bottom) of the V K edge XANES spectra (right top) that were recorded during the temperature
programmed reaction (5 O2 and 5 propene in He 298-723 K 5 Kmin) of 77 wt hydrated VxOySBA-15 FT(χ(k)k 3)
(QEXAFS scans) of a comparable measurement are shown on the right side (bottom) 122
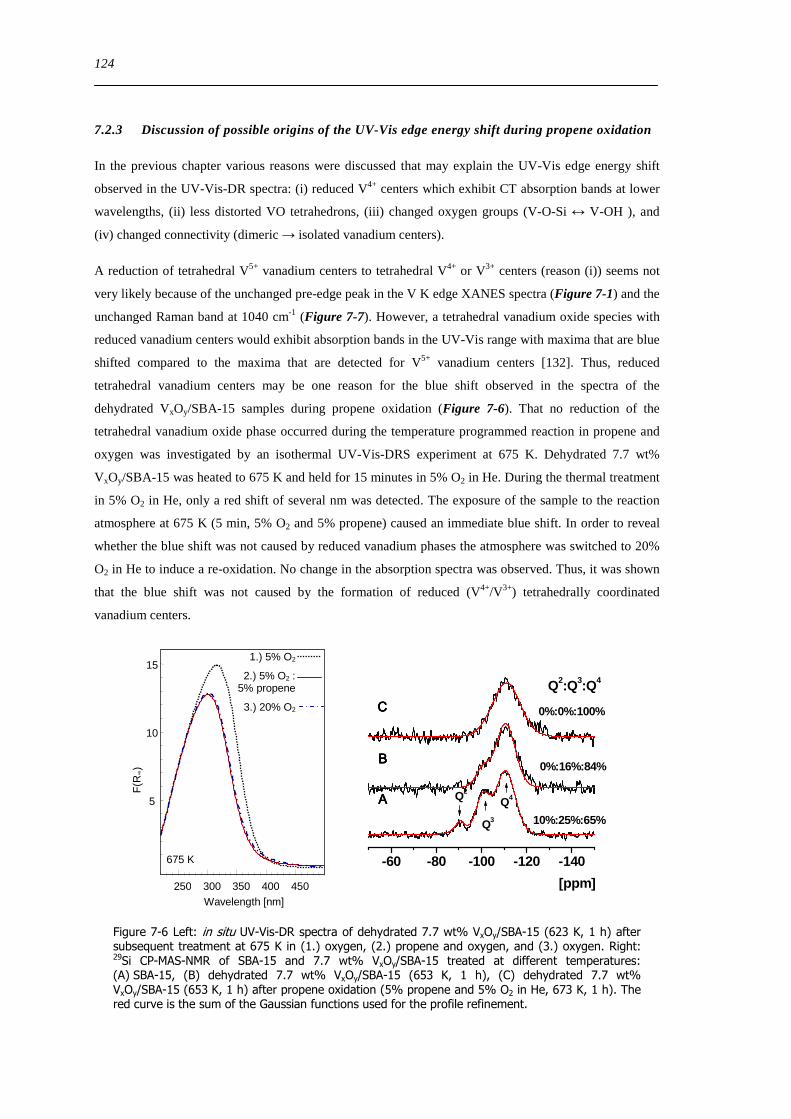
Figure 7-6 Left in situ UV-Vis-DR spectra of dehydrated 77 wt VxOySBA-15 (623 K 1 h) after subsequent treatment at 675 K
in (1) oxygen (2) propene and oxygen and (3) oxygen Right 29Si CP-MAS-NMR of SBA-15 and 77 wt VxOySBA-15 treated
at different temperatures (A) SBA-15 (B) dehydrated 77 wt VxOySBA-15 (653 K 1 h) (C) dehydrated 77 wt VxOySBA-15
(653 K 1 h) after propene oxidation (5 propene and 5 O2 in He 673 K 1 h) The red curve is the sum of the Gaussian functions
used for the profile refinement 124
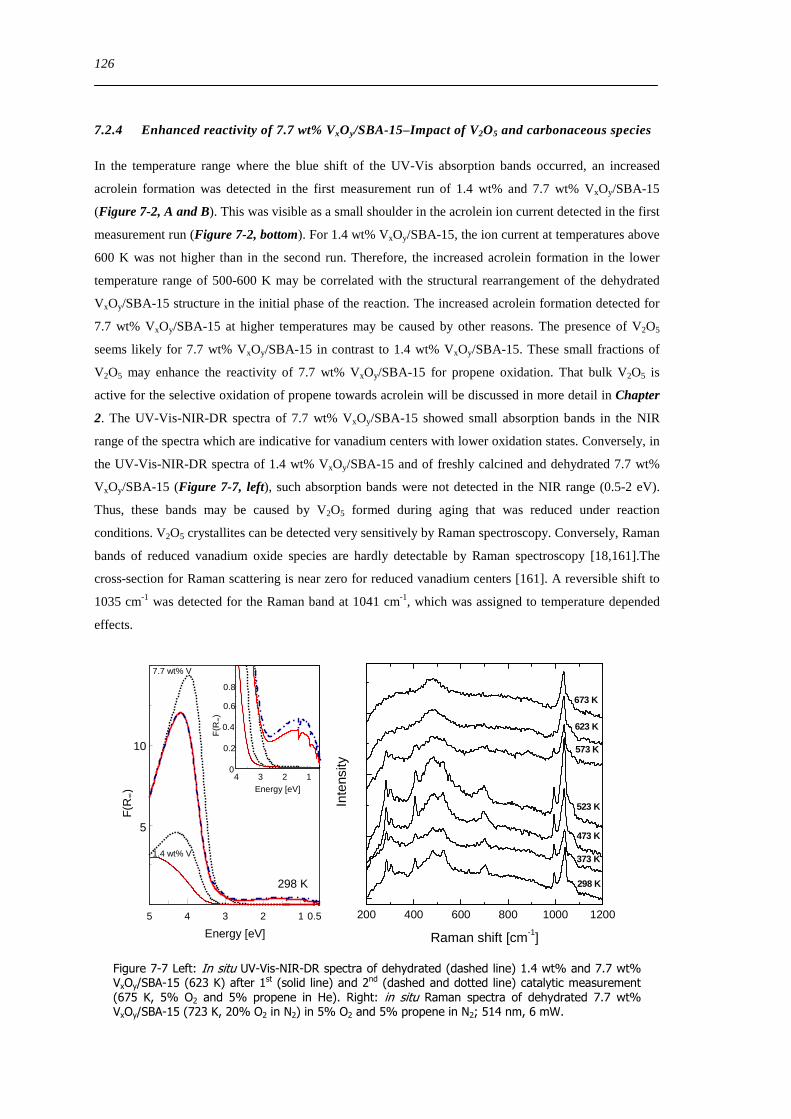
Figure 7-7 Left In situ UV-Vis-NIR-DR spectra of dehydrated (dashed line) 14 wt and 77 wt VxOySBA-15 (623 K) after 1st
(solid line) and 2nd (dashed and dotted line) catalytic measurement (675 K 5 O2 and 5 propene in He) Right in situ Raman
spectra of dehydrated 77 wt VxOySBA-15 (723 K 20 O2 in N2) in 5 O2 and 5 propene in N2 514 nm 6 mW 126
Figure 7-8 Left in situ Raman spectra of hydrated 77 wt VxOySBA-15 during propene oxidation 5 O2 and 5 propene in N2
514 nm 6 mW Right Comparison of the in situ Raman spectra of hydrated and dehydrated 77 wt VxOySBA-15 during propene
oxidation at 473 K and 523 K 127
Figure 7-9 Propene conversion and oxygenate selectivity (left) Propene conversion rate referred to the sample mass and product
selectivities determined in the different measurement cells during the temperature programmed propene oxidation using dehydrated
77 wt VxOySBA-15 (right) 128
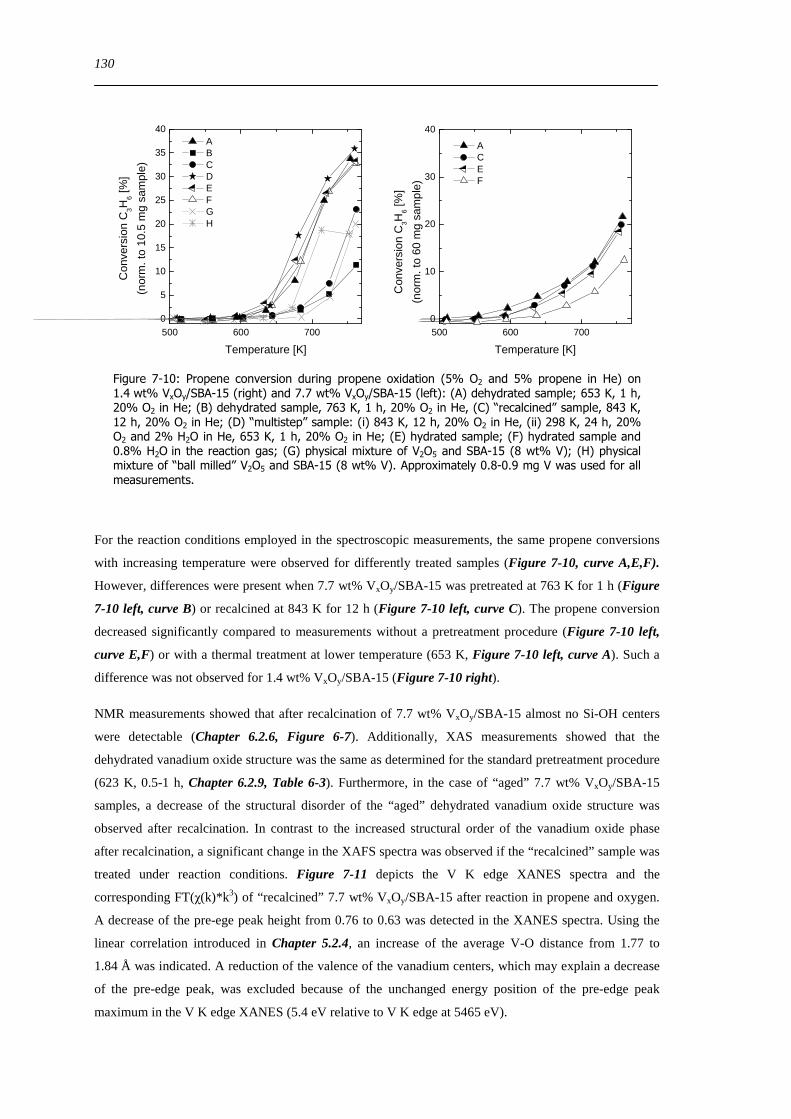
Figure 7-10 Propene conversion during propene oxidation (5 O2 and 5 propene in He) on 14 wt VxOySBA-15 (right) and 77
wt VxOySBA-15 (left) (A) dehydrated sample 653 K 1 h 20 O2 in He (B) dehydrated sample 763 K 1 h 20 O2 in He (C)
ldquorecalcinedrdquo sample 843 K 12 h 20 O2 in He (D) ldquomultisteprdquo sample (i) 843 K 12 h 20 O2 in He (ii) 298 K 24 h 20 O2
and 2 H2O in He 653 K 1 h 20 O2 in He (E) hydrated sample (F) hydrated sample and 08 H2O in the reaction gas (G)
physical mixture of V2O5 and SBA-15 (8 wt V) (H) physical mixture of ldquoball milledrdquo V 2O5 and SBA-15 (8 wt V)
Approximately 08-09 mg V was used for all measurements 130
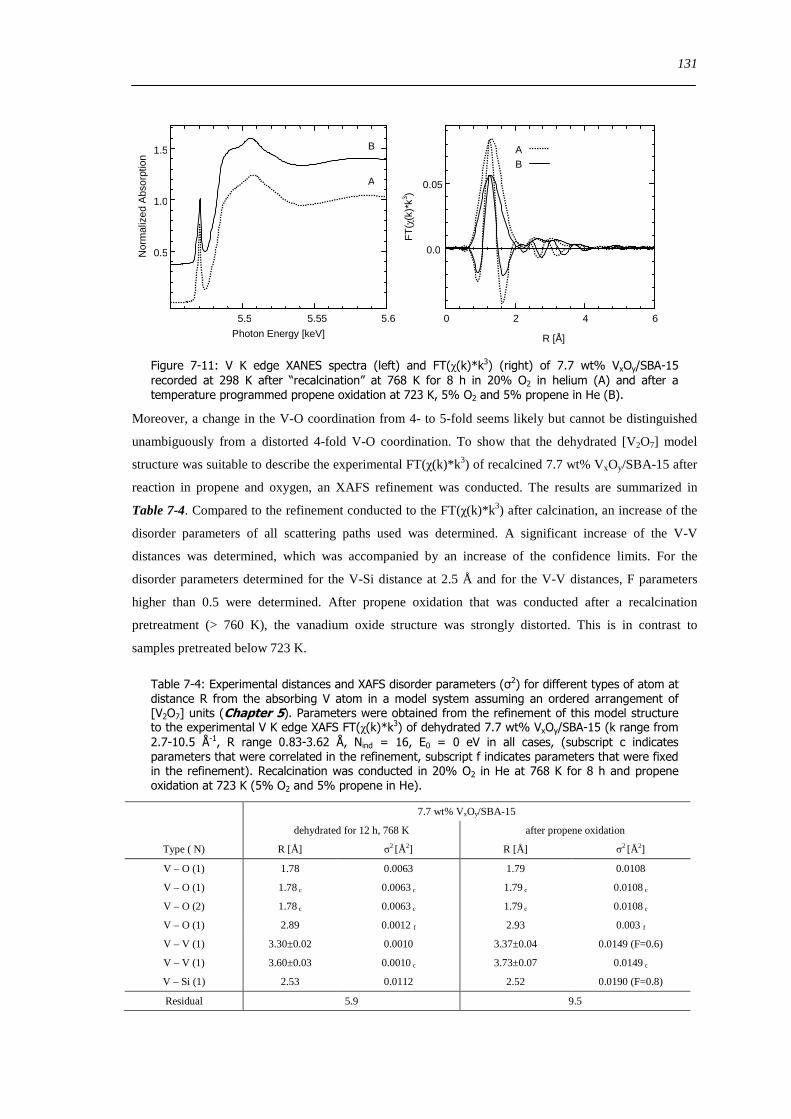
Figure 7-11 V K edge XANES spectra (left) and FT(χ(k)k 3) (right) of 77 wt VxOySBA-15 recorded at 298 K after
ldquorecalcinationrdquo at 768 K for 8 h in 20 O2 in helium (A) and after a temperature programmed propene oxidation at 723 K 5 O2
and 5 propene in He (B) 131
Figure 7-12 Propene conversion and oxygenate selectivity during propene oxidation (5 O2 and 5 propene in He) of 77 wt
VxOySBA-15 for different treatments During subsequent temperature programmed reactions (left) and under isothermal conditions
at 673 K (right) 133
Figure 7-13 Oxygenate selectivity versus propene conversion determined after 8-12 h at 673 K (left) for 77 wt VxOySBA-15 and
comparision of the product selectivities for similar propene conversion (right) (A) dehydrated sample 653 K 1 h 20 O2 in He
(B) hydrated sample (C) hydrated sample and 08 H2O in the reaction gas (D) ldquorecalcinedrdquo sample 843 K 12 h 20 O2 in He
(Details Table 7-5) 133
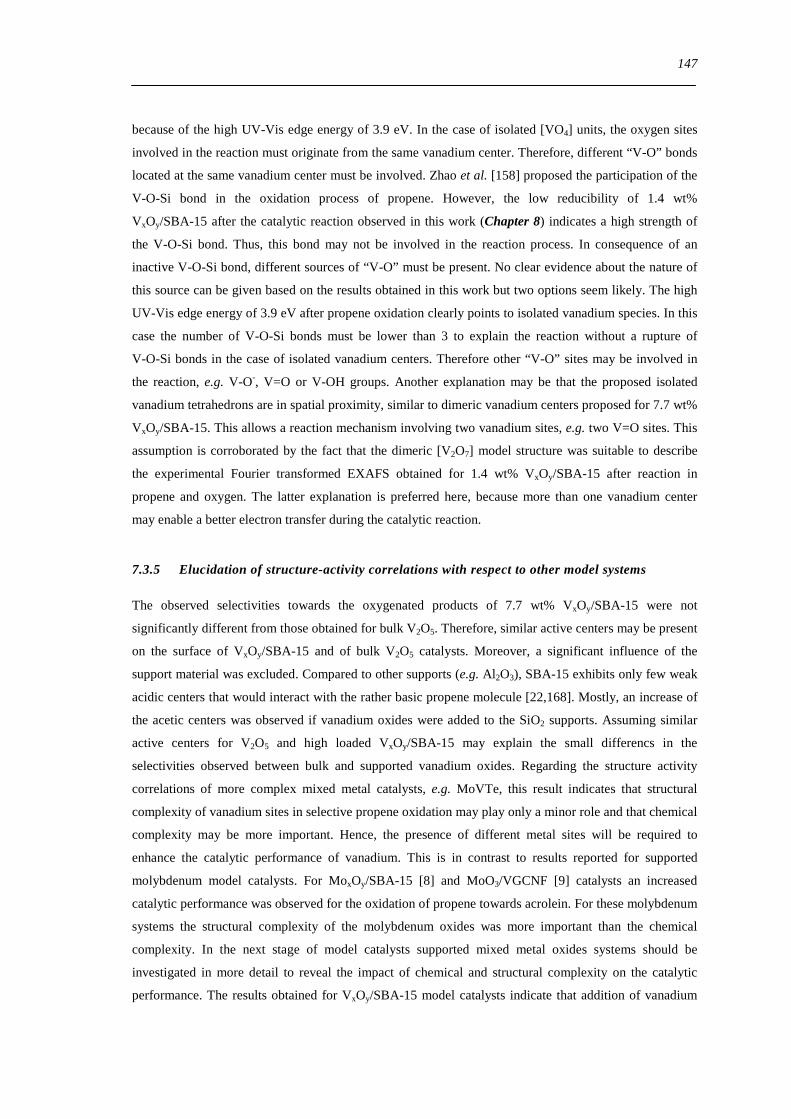
Figure 7-14 UV-Vis-DR spectra of dehydrated (623 K 20 O2 in He) 14 wt (right) and 77 wt (left) VxOySBA-15 recorded at
298 K after dehydration (solid line) and propene oxidation (dotted line) at 675 K for 4 h 135
Figure 7-15 Left top Propene conversion and oxygenate selectivity during propene oxidation (5 O2 and 5 propene in He) of
dehydrated 14-77 wt VxOySBA-15 under isothermal conditions at 673 K (right) Left bottom and right Propene conversion and
product selectivity of dehydrated 14-77 wt VxOySBA-15 during the temperature programmed reaction in propene and oxygen
(5 O2 and 5 propene in He) (symbols on right side circle=CO square=CO2 closed triangle up=acrolein open triangle
up=acetaldehyde open triangle down=propionaldehyde half filled triangle= acetone closed star=acetic acid) 136
210
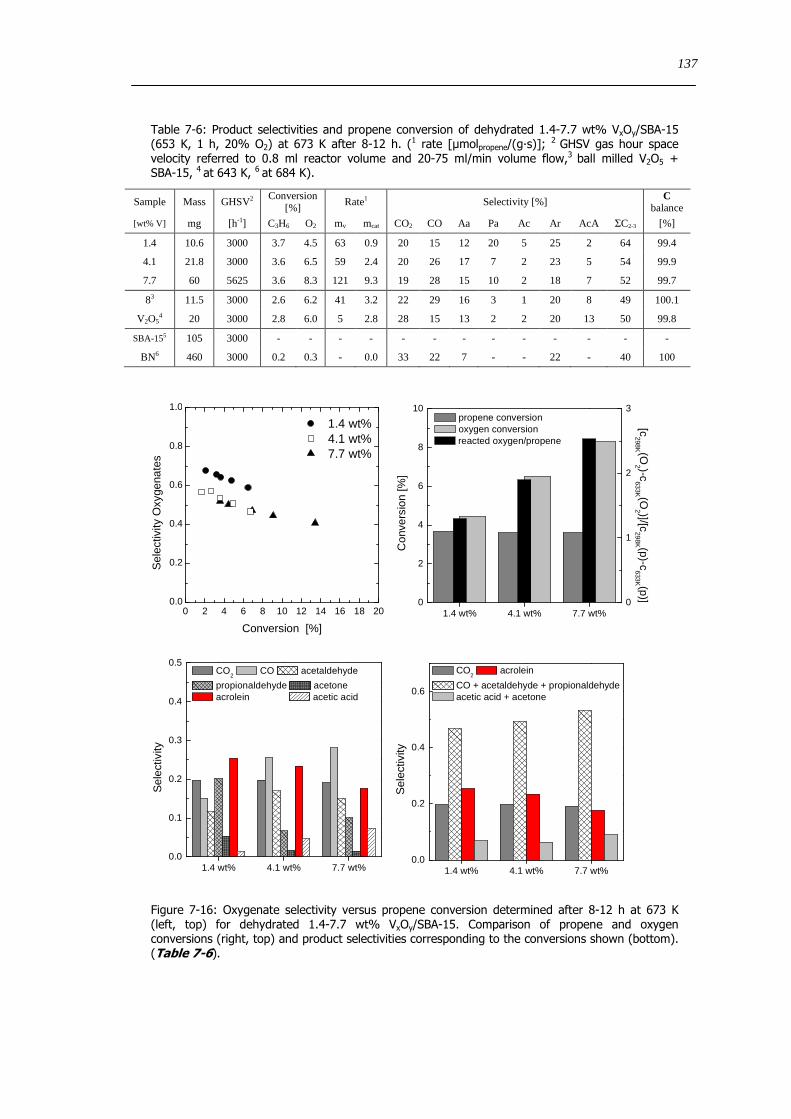
Figure 7-16 Oxygenate selectivity versus propene conversion determined after 8-12 h at 673 K (left top) for dehydrated 14-77
wt VxOySBA-15 Comparison of propene and oxygen conversions (right top) and product selectivities corresponding to the
conversions shown (bottom) (Table 7-6) 137
Figure 7-17 Main oxygenate products of the partial oxidation of propane and propene [35] 138
Figure 7-18 Propene and oxygen conversion reacted ratio of oxygenpropene and product selectivities for (hydrated) 14 wt and
77 wt VxOySBA-15 as a function of the initial oxygen to propene ratio in the reaction gas at 633 K (Vol O2 Vol propene ~
25 55 755 105 575 525 and 51) 141
Figure 7-19 UV-Vis-DR spectra of dehydrated 14 wt (right) and 77 wt VxOySBA-15 (left) recorded at 298 K after
temperature programmed reaction in various oxygenpropene mixtures in He at 636 K after dehydration 554 K 20 O2 (dotted
grey) 55 (dotted red) 15 (dashed black) 51 (dashed and dotted blue) and 05 (solid black) 143
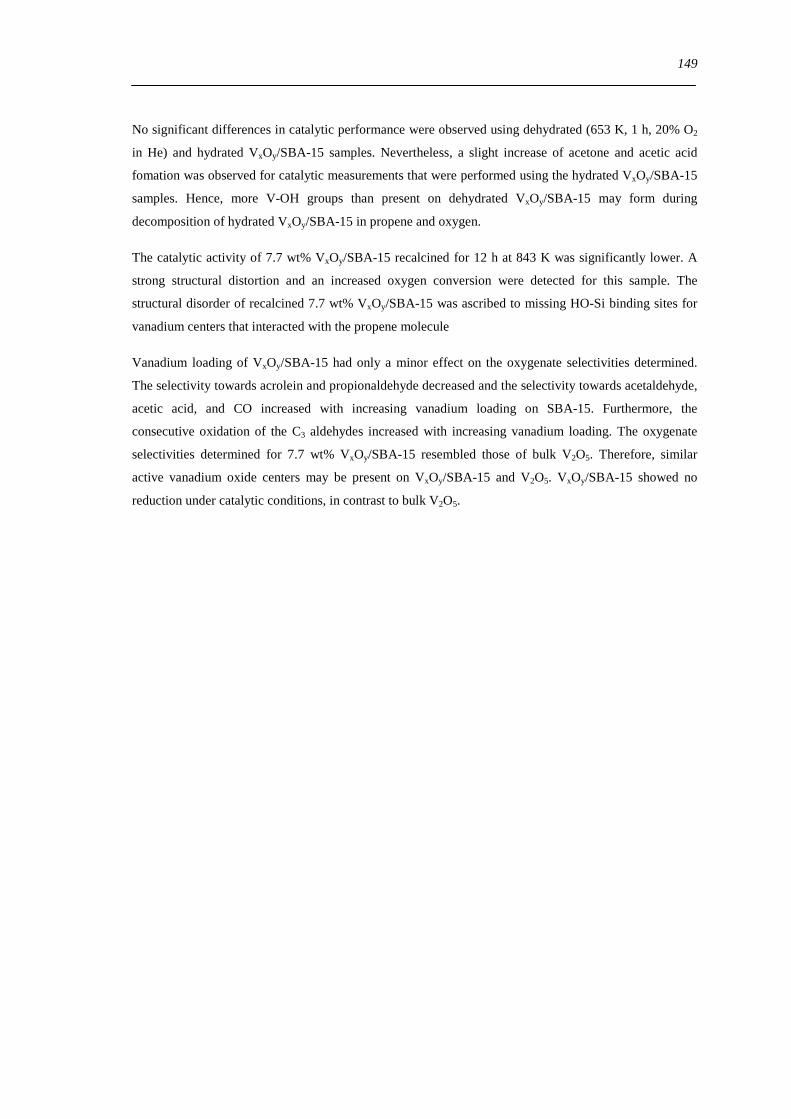
Figure 8-1 V K edge XANES spectra (left) χ(k)k 3 (middle) and FT(χ(k)k 3) (right) recorded at 298 K (A) dehydrated 77 wt
VxOySBA-15 (623 K 20 O2) (B) dehydrated 77 wt VxOySBA-15 (623 K 20 O2) after reaction in 5 propene in He at 723
K (C) dehydrated 77 wt VxOySBA-15 (623 K 20 O2) after reaction in 5 propene in He at 673 K (D) V3O7 (E) VO2(B) (F)
V2O3 153
Figure 8-2 Normalized pre-edge peak areas (referred to the area of V2O5 that was normalized to 080) versus centroid energy of
vanadium reference compounds and 77 wt VxOySBA-15 after various treatments Additionally the values reported by Chaurand
et al [94] are shown Dashed rings refer to the coordination of absorbing vanadium centers (Oh = octrahedral Py = pyramidal Td =
tetrahedral) Detailed parameters are listed in Table 10-4 in the appendix 154
Figure 8-3 V K edge XANES spectra (left) and pre-edge peak height and water ion current me 18 (right) during the temperature
programmed reaction of dehydrated (623 K 20 O2 in He) 77 wt VxOySBA-15 in 5 propene in He (298-723 K 5 Kmin) 155
Figure 8-4 In situ UV-Vis-DR spectra (left) and absorption at 700 nm (relative to the maximum intensity determined in the
absorption spectra at 298 K after dehydration) together with the water ion current me 18 (right) during the temperature programmed
reaction of dehydrated (623 K 20 O2 in He) 77 wt VxOySBA-15 in 5 propene in He (298-673 K 4 Kmin) The arrows on
the left side indicate the evolution of the spectra during temperature treatment 156
Figure 8-5 Left UV-Vis-DR spectra of dehydrated (623 K 20 O2 in He) 77 wt VxOySBA-15 recorded at 673 K after several
reducing (5 propene) and oxidizing (5 propene and 5 oxygen) reaction cycles Right Evolution of the absorption at 700 nm
(relative to the maximum intensity determined in the absorption spectra at 298 K after dehydration) during the reducing (5
propene) and oxidizing (5 propene and 5 oxygen) reaction cycles at 673 K The gas phase was changed after 39 min in each
reaction cycle 157
Figure 8-6 Propene and oxygen conversion and concentration of major reaction products after several oxidizing (5 propene and
5 oxygen) reaction cycles (Figure 8-5) Refer to text for experimental details 158
Figure 8-7 UV-Vis-DR spectra of dehydrated 77 wt VxOySBA-15 (623 K 20 O2 in He) recorded during the first (left) and the
second (right) re-oxidation (5 propene 5 O2) cycle at 673 K Top Evolution of the absorption at 700 nm (relative to the
maximum intensity determined in the absorption spectra at 298 K after dehydration) Middle Evolution of MS ion currents
Bottom in situ UV-Vis-DR spectra The gas phase was changed after 39 min in each reaction cycle 160
Figure 8-8 UV-Vis-DR spectra recorded at 298 K after reduction of dehydrated VxOySBA-15 in 5 propene in He at 623 K (left)
and UV-Vis-DR spectra recorded at 673 K after reduction in 5 propene at 623 K of VxOySBA-15 that was treated for 35 min in
5 propene and 5 O2 in He at 673 K prior to reduction (Right) 162
Figure 8-9 V K edge XANES (left) LC XANES fit (middle) and FT(χ(k)k 3) of 77 wt VxOySBA-15 after dehydration (623 K
20 O2 in He) reduction (723 K 5 propene in He) and after the switching experiment at 673 K under reducing catalytic
211
reducing catalytic and finally reducing conditions (673 K reducing conditions 5 propene in He catalytic conditions 5 propene
and 5 O2 in He) 162
Figure 8-10 In situ UV-Vis DR spectra of dehydrated 77 wt VxOySBA-15 (20 O2 in He 623 K) at 673 K after changing the
gas phase composition starting with 20 O2 in He (left) or 5 propene and 5 O2 in He (right) as the initial gas mixture 164
Figure 8-11 Evolution of the relative absorption at 700 nm (relative to the maximum intensity determined in the absorption spectra
at 298 K after dehydration) derived from the in situ UV-Vis DR spectra of dehydrated 77 wt VxOySBA-15 (20 O2 in He 623
K) at 673 K after changing the gas phase composition starting with 20 O2 in He (left) or 5 propene and 5 O2 in He (right) as
initial gas mixture 165
Figure 8-12 UV-Vis-DR spectra of dehydrated 77 wt VxOySBA-15 (623 K 20 O2 in He) recorded during the first reducing
(5 propene) cycle at 673 K starting with 20 O2 in He (left side) or 5 propene and 5 O2 in He (right side) as the initial gas
mixture Top Evolution of absorption at the 700 nm (relative to the maximum intensity determined in the absorption spectra at 298
K after dehydration) Middle Evolution of the MS ion currents Bottom in situ UV-Vis-DR spectra The gas phase was changed
after 39 min in each reaction cycle 166
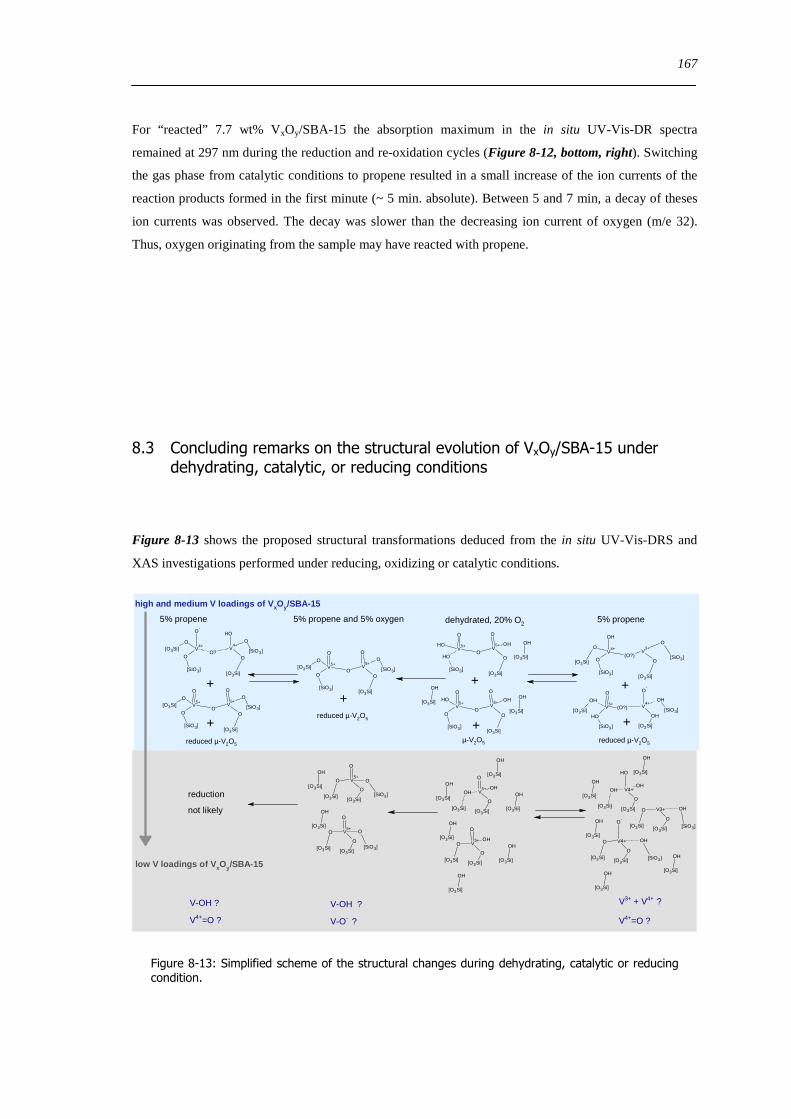
Figure 8-13 Simplified scheme of the structural changes during dehydrating catalytic or reducing condition 167
Figure 10-1 Baseline measured in the UV-Vis-DR spectrometer using the standard integration sphere 181
Figure 10-2 Baselines measured in the UV-Vis-DR spectrometer using the Praying MantisTM cell 181
Figure 10-3 In situ Raman spectra during dehydration in a ldquodryrdquo (left) and a water saturated atmosphere (right) 20 O2 and 80
N2 (and ~ 45 H2O) 25 mlmin ndash 50 mlmin 182
Figure 10-4 Usable spectral range of EXAFS and QEXAFS scans used for measurements of 77 wt VxOySBA-15 under catalytic
conditions (5 propene and 5 O2 in He 40 mlmin) 182
Figure 10-5 Product selectivities determined in the different measurement cells during the temperature programmed propene
oxidation using a dehydrated 77 wt VxOySBA-15 183
Figure 10-6 Product concentration during propene oxidation (5 O2 and 5 propene in He) of 77 wt VxOySBA-15 for
subsequent temperature programmed reactions 183
Figure 10-7 Determination of the reaction order for propene (left) and oxygen (right) for the acrolein formation on 77 wt
VxOySBA-15 184
Figure 10-8 Determination of the reaction order for propene (left) and oxygen (right) for the acrolein formation on 14 wt
VxOySBA-15 184
Figure 10-9 Experimental Cu Kα XRD powder pattern of V4O9 determined in 5 propene in He (56 mlmin) (dotted black) at 598
K together with the XRD structure refinement of the corresponding phases (solid red) and the differential plot (solid grey) 188