Spectroscopy of high-energy BLLacertae objects with X-shooter on the VLT S. Pita, P. Goldoni, C. Boisson, J.-P. Lenain, M. Punch, L. G´ erard, F. Hammer, L. Kaper, H. Sol To cite this version: S. Pita, P. Goldoni, C. Boisson, J.-P. Lenain, M. Punch, et al.. Spectroscopy of high-energy BLLacertae objects with X-shooter on the VLT. Astronomy and Astrophysics - A&A, EDP Sciences, 2014, 565, pp.A12. <10.1051/0004-6361/201323071>. <cea-01270925> HAL Id: cea-01270925 https://hal-cea.archives-ouvertes.fr/cea-01270925 Submitted on 8 Feb 2016 HAL is a multi-disciplinary open access archive for the deposit and dissemination of sci- entific research documents, whether they are pub- lished or not. The documents may come from teaching and research institutions in France or abroad, or from public or private research centers. L’archive ouverte pluridisciplinaire HAL, est destin´ ee au d´ epˆ ot et ` a la diffusion de documents scientifiques de niveau recherche, publi´ es ou non, ´ emanant des ´ etablissements d’enseignement et de recherche fran¸cais ou ´ etrangers, des laboratoires publics ou priv´ es.
Transcript
Spectroscopy of high-energy BLLacertae objects with
X-shooter on the VLT
S. Pita, P. Goldoni, C. Boisson, J.-P. Lenain, M. Punch, L. Gerard, F.
Hammer, L. Kaper, H. Sol
To cite this version:
S. Pita, P. Goldoni, C. Boisson, J.-P. Lenain, M. Punch, et al.. Spectroscopy of high-energyBLLacertae objects with X-shooter on the VLT. Astronomy and Astrophysics - A&A, EDPSciences, 2014, 565, pp.A12. <10.1051/0004-6361/201323071>. <cea-01270925>
HAL Id: cea-01270925
https://hal-cea.archives-ouvertes.fr/cea-01270925
Submitted on 8 Feb 2016
HAL is a multi-disciplinary open accessarchive for the deposit and dissemination of sci-entific research documents, whether they are pub-lished or not. The documents may come fromteaching and research institutions in France orabroad, or from public or private research centers.
L’archive ouverte pluridisciplinaire HAL, estdestinee au depot et a la diffusion de documentsscientifiques de niveau recherche, publies ou non,emanant des etablissements d’enseignement et derecherche francais ou etrangers, des laboratoirespublics ou prives.
Spectroscopy of high-energy BL Lacertae objectswith X-shooter on the VLT?,??
S. Pita1, P. Goldoni1, C. Boisson2, J.-P. Lenain3, M. Punch1, L. Gérard1,4, F. Hammer5, L. Kaper6, and H. Sol2
1 APC, AstroParticule et Cosmologie, Université Paris Diderot, CNRS/IN2P3, CEA/Irfu, Observatoire de Paris, Sorbonne Paris Cité,10 rue Alice Domon et Léonie Duquet, 75205 Paris Cedex 13, Francee-mail: [email protected]
2 LUTH, Observatoire de Paris, CNRS, Université Paris Diderot, 5 place Jules Janssen, 92190 Meudon, France3 LPNHE, Université Pierre et Marie Curie Paris 6, Université Denis Diderot Paris 7, CNRS/IN2P3, 4 place Jussieu,
75252 Paris Cedex 5, France4 DESY, Platanenallee 6, 15738 Zeuthen, Germany5 GEPI, Observatoire de Paris, CNRS, Université Paris Diderot, 5 place Jules Janssen, 92190 Meudon, France6 Astronomical Institute Anton Pannekoek, University of Amsterdam, Science Park 904, 1098 XH Amsterdam, The Netherlands
Received 18 November 2013 / Accepted 9 January 2014
ABSTRACT
Context. BL Lac objects detected in γ-rays and, particularly, those detected at very high energies (E > 100 GeV) by Cherenkovtelescopes are extreme sources with most having redshifts lower than 0.2. Their study gives insights on the acceleration mechanismsin play in such systems and is also a valuable tool for putting constraints on the density of extragalactic background light, especially ifseveral objects are detected at different redshifts. As their spectra are dominated by the non-thermal emission of the jet and the spectralfeatures are weak and narrow in the optical domain, measuring their redshift is challenging. However, such a measure is fundamentalas it allows a firm determination of the distance and luminosity of the source, and, therefore, a consistent model of its emission.Aims. Measurement of the redshift of BL Lac objects detected in γ-rays and determination of global properties of their host galaxiesis the aim of this study.Methods. We observed a sample of eight BL Lac objects with the X-shooter spectrograph installed at the ESO Very Large Telescope(VLT) to take advantage of its unprecedented wavelength coverage and its resolution, which is about five times higher than generallyused in such studies. We extracted UVB to NIR spectra that we then corrected for telluric absorption and calibrated in flux. Wesystematically searched for spectral features. When possible, we determined the contribution of the host galaxy to the overall emission.Results. Of the eight BL Lac sources, we measured the redshift of five of them and determined lower limits for two through thedetection of intervening systems. All seven of these objects have redshifts greater than 0.2. For the remaining one, we estimated,using an indirect method, that its redshift is greater than 0.175. In two cases, we refuted redshift values reported in other publications.Through careful modelling, we determined the magnitude of the host galaxies. In two cases, the detection of emission lines allowedto provide hints on the overall properties of the gas in the host galaxies. Even though we warn that we are dealing with a very smallsample, we remark that the redshift determination efficiency of our campaign is higher than for previous campaigns. We argue that itis mainly the result of the comparatively higher resolution of X-shooter.
Key words. galaxies: active – BL Lacertae objects: general – galaxies: distances and redshifts – gamma rays: galaxies
1. Introduction
BL Lac objects are active galactic nuclei (AGN), whose opticalspectrum is dominated by continuum radiation emitted by the jetlaunched by the supermassive black hole residing in the nucleusof the galaxy. Along with flat spectrum radio quasars (FSRQs),they are the most numerous γ-ray emitters in the 0.1–300 GeVrange explored by the Fermi satellite with about 475 associationsin the last Fermi AGN catalogue (2LAC, Ackermann et al. 2011;Shaw et al. 2013b). Their γ-ray emission is caused by particleacceleration in the jet, which has Lorentz factors Γ up to ∼40(see e.g. Tavecchio et al. 2010). BL Lac objects are characterisedby rapid variability in all energy ranges.
Broadband (from radio to γ-rays continuum) spectral energydistributions (SED) of BL Lac objects consist of two distinct,
? Based on observations collected at the European Organisation forAstronomical Research in the Southern Hemisphere, Chile, under pro-grams P086.B-0.135(A) and P088.B-0485(A).?? The raw FITS data files are available in the ESO archive.
broad components. The low-energy component, peaking in theIR to X-rays band, is generally understood as the synchrotron ra-diation of a population of accelerated electrons. The high-energyone, peaking in the MeV to TeV band, in leptonic models is as-sociated with the inverse-Compton scattering of the same elec-trons on the synchrotron photons (synchrotron-self-Compton ap-proaches, SSC, e.g. Ginzburg & Syrovatskii 1965; Ghisellini &Maraschi 1989) or on ambient photons (external Compton ap-proaches, EC, e.g. Sikora & Zbyszewska 1985). Even if the levelof contribution of hadronic processes needs to be clarified, theleptonic models seem to be favoured by the correlation often ob-served between the flux variations in X-rays and at very highenergy (VHE, E > 100 GeV), and by the rapid variability ob-served during some flares (see Abramowski et al. 2012b). Whilethe one-zone SSC approach is often used quite successfully todescribe the SED of most of the VHE BL Lac objects, recentMWL studies have highlighted the limitations of this approach insome cases (Fortin et al. 2010; Abramowski et al. 2011; Wouterset al. 2012; Abramowski et al. 2013a, 2012a; Aliu et al. 2012).
Article published by EDP Sciences A12, page 1 of 20
The understanding of these sources, both individually and as acoherent population, requires MWL observations, allowing thedescription over large parts of the electromagnetic spectrum ofboth the shape of their SEDs and their temporal variability.
One particular characteristic of BL Lac objects is the dif-ficulty of measuring their redshift even though they are quitebright in the optical domain. Indeed, according to the usualdefinition of BL Lac objects (Urry & Padovani 1995, see alsoGhisellini et al. 2011 for a recent discussion), only weak emis-sion/absorption lines with an equivalent width (EW) that issmaller than 5 Å are detected in their optical spectrum. The de-tection of these lines is therefore challenging and it becomesmore so as the redshift increases, but it is fundamental as it al-lows a firm determination of the distance and luminosity of thesource which in turn allows a consistent model of its emission.Moreover, the properties of the optical features give insights onthe properties of the host galaxy and of its central black hole. Ifno intrinsic spectral feature is detected, a lower limit on the red-shift may be set by the detection of an absorption system in theline of sight towards the source. In addition, the BL Lac object’sredshift can be roughly estimated under the assumption that thehost galaxy is a standard candle (Sbarufatti et al. 2005). The non-detection of the galaxy’s absorption features then allows a roughlower limit to be set on the redshift of the source.
Recently, Shaw et al. (2013b) published a very extensivestudy of a sample of 297 BL Lac objects from the Fermi 2LACcatalogue with unknown redshifts. They performed low resolu-tion (R = λ/∆λ ∼ 500–1000) moderately deep (1800 seconds)spectroscopic observations using mainly three to five meterclass telescopes. They measured 102 new spectroscopic redshifts(34% efficiency of redshift determination) and 75 lower limitsfrom foreground absorbers (25% of the sample) for a total of59% sources with spectroscopic redshift or lower limits. The me-dian of the spectroscopic redshifts is 0.33 and the median of theabsorption limits is 0.70. They also estimated the redshifts fromthe standard candle assumption for the whole sample; however,80% of the time these are less constraining than the limits fromline of sight absorbers.
Since the 1990’s, a small fraction of BL Lac objects hasbeen detected by atmospheric Cherenkov telescopes in the VHErange. The origin and properties of the VHE emission of theseobjects are being actively investigated as they are proof of par-ticle acceleration at energies rarely seen in other classes of ob-jects, demonstrating extreme acceleration properties. Beyond thestudy of VHE BL Lac objects, their detection at different red-shifts is also a valuable tool to put constraints on the density ofthe extragalactic background light (EBL, see Hauser & Dwek2001) because absorption is due to pair production in the in-teractions between VHE and EBL photons. This EBL radiationincludes the UV-optical emission of all the stars and galaxiessince the end of the cosmic dark ages and its reprocessing bydust in the near infrared (NIR). It therefore carries valuable in-formation about the evolution of matter in the Universe, and alsoplays a role as an absorber for γ-rays. From the above consider-ations we can easily understand that the precise measurement ofthe redshifts of BL Lac objects and thus of their luminosities is acrucial input for the modelling of the interactions between VHEand EBL photons.
In the last decade, these studies have received a decisiveboost with the advent of the third generation of atmosphericCherenkov telescopes (H.E.S.S., MAGIC and VERITAS) whichhas increased the population of AGN detected in VHE γ-rays upto 55 sources, of which 49 are BL Lac objects. This populationis likely to be biased towards low redshifts due to the strategy
of observations, which favours nearby sources to optimise rapiddetection because the flux naturally decreases with distance andthe γ-ray absorption by the EBL increases with increasing dis-tance. Thus, the VHE BL Lac objects detected at redshifts higherthan 0.2 are quite rare; only eight are known. Of these, three havemeasured redshifts, while five have lower limits from interven-ing systems (Halpern et al. 1991; Rines et al. 2003; Pita et al.2012; Furniss et al. 2013, and references therein). Only two ofthese objects, KUV 00311-1938 and PKS 1424+240 have red-shifts greater than 0.5. For population studies, dedicated mea-surement of the EBL spectrum, and tests of alternative modelsfor VHE γ-ray production, the number of VHE BL Lac objectswith known redshift at z ≥ 0.2 should increase. This will de-pend on the development of new, more powerful facilities, suchas H.E.S.S.-2 (Vincent 2005) and especially CTA (Acharya et al.2013) but also on campaigns dedicated to the determination ofredshifts for BL Lac objects which are likely to emit in VHE.
To contribute to this goal, we took advantage of theX-shooter spectrograph (Vernet et al. 2011), which was recentlyinstalled at the VLT, which has a higher spectral resolution and awider wavelength range than the spectrographs previously usedin such searches; its sensitivity is comparable to the best of them.We selected a sample of eight sources. Three of them, namelyPKS 0447–439, KUV 00311–1938, and PKS 0301–243, are ofspecial interest as they have recently been discovered as VHEγ-ray emitters with H.E.S.S., while their redshift is still unknownor needs to be confirmed. The five other BL Lac sources have un-known redshifts and were selected based on the following crite-ria: X-ray fluxes indicating the presence of high energy electronsin the jet (Costamante & Ghisellini 2002); spectral properties athigh energy (HE, 0.1 < E < 100 GeV) on the Fermi/LAT 2LACcatalogue (Ackermann et al. 2011), which suggest that they mayalso be detectable in the VHE range; and a good visibility dur-ing our observations. The sources selected that take these cri-teria into account are listed in Table 1. Their X-ray fluxes andFermi/LAT photon indices are shown in Fig. 1. The sub-set of 3already selected VHE BL Lac objects is included both in Table 1and Fig. 1 for comparison. We note that five1 of these eightsources have been observed by Shaw et al. (2013b).
The plan of the paper is as follows. In Sect. 2, we discuss theobservations and the general methods of the data reduction. Themethods to estimate the blazar emission are presented in Sect. 3.The observational history and our detailed results for each sourceare presented in Sect. 4. We then discuss the results of our ob-servations in the context of high redshift blazars in Sect. 5 andconclude in Sect. 6. For all calculations, we used a cosmologywith ΩM = 0.27, ΩΛ = 0.73 and H0 = 71 km s−1 Mpc−1. Allwavelengths in the paper are in vacuum.
2. Observations and data reduction
The X-shooter spectrograph (Vernet et al. 2011) is a single-object medium resolution (R = λ/∆λ = 5000–10 000) échellespectrograph that started operations in 2009 October on the VLT.It is the first second-generation VLT instrument and was de-veloped by a consortium comprising institutes from Denmark,France, The Netherlands, Italy and ESO. The main characteris-tic of X-shooter is its unprecedented simultaneous wavelengthcoverage from 3000 Å to 24 000 Å. This is obtained by splittingthe light using dichroics in three arms: UVB (λ = 3000–5600 Å),VIS (λ = 5500–10 200 Å), and NIR (λ = 10 000–24 000 Å). Its
1 Namely KUV 00311–1938, BZB J0238–3116, BZB J0543–5532,BZB J0505+0415 and BZB J0816–1311, see Sect. 4 for details.
A12, page 2 of 20
S. Pita et al.: Spectroscopy of high-energy BL Lac objects with X-shooter on the VLT
Fig. 1. Distribution of the X-ray fluxes be-tween 0.1 and 2.4 keV and the Fermi/LAT pho-ton indices above 100 MeV for the BL Lacobjects population observed by Fermi/LAT(Ackermann et al. 2011). Among the eightsources selected in this paper, those already de-tected in VHE are in red, the five others are inblue.
Table 1. Observed sources and selection criteria.
Source FX FFermi ΓFermi VHE status z status[erg cm−2 s−1] [10−10 γ cm−2 s−1]
Notes. The columns contain from left to right: (1) source name; (2) X-ray flux between 0.1 and 2.4 keV; (3) high-energy flux between 1 and100 GeV; (4) Fermi/LAT photon index; (5) status of a VHE detection; and (6) redshift status. All values come from http://www.asdc.asi.it/fermi2lac (errors not available for X-ray fluxes). The sources labelled as “Candidate” in Col. 5 are those considered to be likely to be detectedin VHE in a reasonable amount of time (see text for details) Explanations about the status of the sources redshifts are given in Sect. 4.
resolution R is between 3000 and 17 000 depending on arm andslit width. For these observations, we choose slit widths of 1.3′′,1.2′′ and 1.2′′ for the UVB, VIS, and NIR arms, which results inR ∼ 4000, 6700, and 3900 respectively. X-shooter is very wellsuited to the determination of redshift in bright blazars: on theone hand, the wavelength range allows one to search for multi-ple features in a very broad spectral domain; on the other handthe resolution is sufficient to detect narrow absorption lines fromintervening clouds and broad absorption or emission lines fromthe host galaxy itself. Its high sensitivity allows us to push thesearch for lines to very constraining upper limits. The observingtime was obtained under the framework of the French X-shooterGTO program.
The observations took place on 2011 November 30 for all thesources, except for one of them, which was observed on 2010November 12 (see details in Table 2). The exposures were takenusing the nodding along the slit technique with an offset of 5′′between exposures of 600 s each, usually in a standard ABBAsequence. Each observation was preceded or followed by an ob-servation of an A0V telluric standard star at similar airmass.
We processed the spectra using version 1.3 of the X-shooterdata reduction pipeline (Goldoni et al. 2006; Modigliani et al.2010). The raw frames were first subtracted and cosmic-ray hitswere detected and corrected using the method developed by
van Dokkum (2001). The frames were divided by a master flatfield obtained by using day-time flat field exposures with halo-gen lamps. The orders were extracted and rectified in wavelengthspace using a wavelength solution previously obtained from cal-ibration frames.
The resulting rectified orders frames were then shifted andadded to superpose them, thus obtaining the final 2D spectrum.The orders were then merged, and, in the overlapping regions,the merging was weighted by the errors, which were propagatedduring the process.
From the resulting 2D merged spectrum of all sources, weextracted a one dimensional spectrum with a corresponding errorfile and a bad pixel map at the source’s position. We checked ev-ery one of these spectra for obvious spectral features that couldallow the measurements of the redshift. For those spectra thatshowed no features, we also extracted three sub-spectra fromthree sub-apertures with one centred on the source position andthe others on the opposite sides. The width of these sub-apertureswere adjusted for each source depending on its size in the slit di-rection. These lateral spectra allowed us to explore the emissionin regions less affected by the glare of the blazar.
At the end of our first reduction, we noticed that the fluxlevels of overlapping orders were not always compatible in theUVB and VIS spectra. As a consequence, the merged spectrum
Notes. The columns contain from left to right: (1) source name; (2) right ascension (J2000); (3) declination (J2000); (4) start time of the observa-tions; (5) exposure time; (6) average airmass; (7) average seeing at Zenith in the R band, and (8, 9, 10) S/N ranges measured in selected regionsof the continuum in the UVB, VIS, and NIR arms, where no obvious features were present. The slit widths are the same for all observations: 1.3′′,1.2′′ and 1.2′′ for the UVB, VIS, and NIR arm, respectively.
showed jumps of a few percent, which are well visible at ourhigh signal-to-noise ratio (S/N) levels. This is a well-known ef-fect in échelle spectroscopy for high signal-to-noise spectra thathas been possibly attributed to smooth, time dependent changesin the light path (Hensberge 2007). As this effect was limitedonly to the final (initial) part of the orders, we did not extractthe final part of the non-compatible orders. We thus producedmerged spectra with smooth transitions between orders whilelowering signal-to-noise only by a few percent.
2.1. Flux calibration and telluric correction
Absolute flux calibration and telluric correction of échelle spec-tra are not straightforward processes, and the exceptional wave-length coverage of X-shooter complicates the matter further.However, these two tasks are very important for our goals. Onthe one hand we want to reconstruct the general physical shapeof the spectrum which allows us to estimate the contribution ofthe jet and of the galaxy to the overall emission. On the otherhand, telluric corrections are mandatory, as spectral features maybe hidden by the atmospheric absorption.
We tried different approaches to achieve our goals. First, weproduced flux-calibrated spectra using the pipeline by producinga response function with wide slit observations of the flux stan-dard Feige 110 obtained on the same night. The reduction of theflux standard was performed as above, but we subtracted the skyemission lines using the method of Kelson (2003) in this case.The extracted spectrum was divided by the flux table of the starfrom the calibration table available within the pipeline (Vernetet al. 2010) to produce the response function, which was thenapplied to the spectrum of the science target during its reduction.
These pipeline-calibrated spectra allowed the general spec-tral shape to be reproduced; however, small instrumental fea-tures, due to the coarse rebinning of the response function, werestill present therefore precluding the search of spectral featuresat some wavelengths. We then produced a response function di-viding bin by bin the spectrum of the star by the HST2 flux tableof Feige 110 from the CALSPEC database (Bohlin 2007), whichwe interpolated on the wavelength grid of our spectrum. We thenapplied a median filter to avoid the strongest instrumental fea-tures and used this new response function to calibrate in fluxthe spectra of the science targets. Finally, we corrected the resultfrom slit losses, which were estimated with public X-shooter ob-servations of Feige 110 in narrow and wide slit mode obtained
2 The Hubble Space Telescope.
a few nights later. This estimation was computed by taking intoaccount the different airmasses of the standard star observations.In the following, we call these spectra flux-calibrated spectra.
We used the A0V telluric standard stars to correct for the tel-luric absorption in the VIS and NIR spectra of the BL Lac objets.The telluric standard spectra were extracted with the same proce-dure used for the flux standard, and we used these spectra to ap-ply telluric corrections and flux calibrations simultaneously withthe package SpeXtool (Vacca et al. 2003). The flux scale was setusing the B and V magnitudes of the telluric stars as availablein Simbad3. In this case we note that no slit loss correction isneeded as the slit width is the same for the science target and thetelluric standard. We refer to these spectra as telluric-calibratedspectra.
The flux levels of the flux-calibrated and telluric-calibratedspectra are broadly consistent, but their spectral slopes areslightly different. The average difference between the spectra isabout 20% at the blue end of the VIS spectra and tends to zero atredder end of the NIR spectra. This is consistent with the pres-ence of residual slit losses in the flux-calibrated spectra.
We then decided to use the VIS and NIR telluric-calibratedspectra and the UVB flux-calibrated spectra for our further anal-ysis. In case of discrepancies in the absolute flux, which were atmost of the order of a few percent, we adjusted the flux of theVIS and NIR spectra to the flux of the UVB spectrum.
Finally, we corrected the spectra for Galactic extinction us-ing the maps of Schlegel et al. (1998) and the wavelength depen-dent extinction curves of Fitzpatrick (1999).
2.2. Synthetic photometry
We estimated the magnitudes of the sources by performing syn-thetic photometry on our spectra. We convolved our spectra withstandard imaging filters, namely the Johnson-Cousins UBVRIfilters and the 2MASS JHKs filters. The filters parameters weretaken from the ADPS web site4.
To test the precision of our procedure, we flux calibratedthe telluric standard stars and computed their spectrophotometricmagnitudes as we did for the science targets. We then comparedthis result to their Simbad magnitudes. The difference betweenarchival and measured magnitudes had a dispersion of 0.1 mag(1σ) in all filters, we therefore used this value as an estimate
3 http://simbad.u-strasbg.fr/simbad/4 Asiago Database on Photometric Systems, http://ulisse.pd.astro.it/Astro/ADPS/Systems/index.html
Notes. The spectrophotometric magnitudes are corrected for Galactic extinction of the observed sources in the UVBRI Johnson-Cousins and2MASS JHKs filters. The error is ±0.15 mags for all filters (see text for details). For comparison, the 2MASS J, H, and K magnitudes (Skrutskieet al. 2006) are given in the three last columns.
of the error in our procedure. Moreover, we found an offset of−0.3 ± 0.1 mag between the archival and the measured magni-tudes in the U and B filters. This offset tends to zero towardslonger wavelengths. As we used the UVB arm to set the fluxscale, we subtracted this offset to our measured values. The finalerror on the magnitude was ∼±0.15 mag; this is the quadraticsum of the two estimates discussed above. The results are inTable 3, along with the 2MASS survey magnitudes. During ourobservations, PKS 0447–439 was about 1.5 mag brighter thanin the 2MASS survey, while PKS 0301–243 was about 1 magbrighter. All the other sources magnitudes can be found withinhalf a magnitude from the 2MASS values.
3. Estimation of the blazar emission
In the optical-ultraviolet range, the observed SED of a blazar isa combination of jet emission, AGN activity (thermal and non-thermal), and thermal emission of the host galaxy, which usu-ally is an elliptical (Urry et al. 1999). Depending on the relativestrength of each component, the spectrum might be featureless,or it may display signatures coming from the host galaxy. Thisis clearly shown in the simulations performed by Landt et al.(2002) and Piranomonte et al. (2007). We modelled the emissionusing a combination of a power law (featureless continuum) withthe local elliptical template of Mannucci et al. (2001) by addingGaussian emission features when needed. The fit was performedvia a χ2 minimisation using the MINUIT package5.
The free parameters of the model are the power law wave-length index, its normalisation at 10 000 Å and the flux level at10 000 Å of the host galaxy emission. If the redshift was previ-ously determined by the detection of a feature, the fit was per-formed at that redshift, thereby allowing us to estimate the fluxof the host galaxy. The statistical errors provided by the fittingmethod are in general unphysically small (typically 103 timeslower than the fitted value). Therefore, by following the ap-proach of Shaw et al. (2013b), we independently fitted separatedsections of the spectra and estimated the error from the differ-ences between the resulting parameters.
When no feature (or only an intervening absorption system)was detected, we fitted the spectrum with a simple power lawwith a normalisation at 10 000 Å as above and we estimated thefitting errors in the same way. We also estimated a lower limit onthe redshift with the imaging method of Sbarufatti et al. (2005)using a host galaxy magnitude MR = −22.5 (Shaw et al. 2013b).Moreover, to estimate an upper limit to the galaxy contribution,we constructed a grid of blazar emission models at the redshift
5 http://root.cern.ch/root/html/TMinuit.html
of the farthest absorbing system (if present) or at the redshiftdetermined with the imaging method. These models were builtas the sum of the measured power law and of a template withgrowing flux to which we added Poissonian noise to achieve thesignal-to-noise of our observations. For each model in the grid,we measured the EW of the Ca II H&K feature, which is thefirst to be clearly visible at these redshifts. The upper limit wasfixed when the feature was detected at the 2σ level. In one case,namely for PKS 0301–243, we used published photometry of thehost galaxy to estimate the flux of the template; the upper limit tothe template flux was determined as discussed above. To accountfor the emission lines detected in two cases, we added narrowlines with a full width at half maximum (FWHM) of 500 km s−1
to the template, which are compatible with central gas dispersionin local galaxies (Verdoes Kleijn et al. 2006). This allowed arough estimation of the line ratios in these objects.
Results are given in Table 8 for sources for which we deter-mined a firm redshift and in Table 9 for the others.
4. Sources and results
In the following, we discuss the results of our observations foreach source. The spectra are modelled as described in Sect. 3.For the determination of the redshift, we searched for emissionor absorption lines of the host galaxies and for intervening ab-sorbers following the list in Table 4.
4.1. PKS 0447–439
The object PKS 0447–439 is one of the brightest high energy ex-tragalactic sources detected by Fermi/LAT (Abdo et al. 2009b;Ackermann et al. 2011) and was recently discovered as a VHEemitter by the H.E.S.S. Cherenkov telescopes array (Raue et al.2009; Zech et al. 2011; Abramowski et al. 2013c). Initially de-tected as a radio source with the Molonglo telescope (Largeet al. 1981), it has been since observed at different wavelengths(see Abramowski et al. 2013c for a short review). After beingmisidentified as a Seyfert 1 galaxy by Craig & Fruscione (1997)(see Prandini et al. 2012 for comments on this misidentification),the source was identified as a bright BL Lac object by Perlman(1998) and classified as an HBL by Landt & Bignall (2008),based on the ratio of the radio core luminosity at 1.4 GHz overthe X-ray luminosity at 1 keV.
The redshift of this source is not yet clearly established, al-though several values or constraints have been proposed:
– z = 0.107, a value based on the misidentification of thesource with a Seyfert 1 galaxy (Craig & Fruscione 1997);
Table 4. List of the strongest emission or absorption lines.
Feature names Wavelength (Å) TypeLyα 1215 Absorption/EmissionFe II 2600 InterveningMg II 2796 Intervening/Emission
2803 Intervening/Emission[OII] 3727 Emission
3729 EmissionCa K 3933.7 AbsorptionCa H 3968.5 AbsorptionHδ 4101.7 AbsorptionCa I G 4304.4 AbsorptionHβ 4861.3 Absorption/Emission[OIII] 4959 Emission
5007 EmissionMgb 5174 AbsorptionCaI+FeI 5269 AbsorptionNa I D 5892.5 Absorption[NII] 6548.1 EmissionHα 6562.8 Absorption/Emission[NII] 6583.6 EmissionCa triplet 8498 Absorption
8542 Absorption8662 Absorption
Notes. The columns give the names of the strongest expected absorp-tion and emission lines, their wavelength in the rest frame in Å, andtheir nature, which indicate if they appears as absorption or emissionlines from the host galaxy, or if they come from an intervening system.For Fe II and Mg II, which are multiplets, only the strongest lines arereported.
– z = 0.205, a value based on a very weak spectral featureidentified as the Ca II H&K doublet in an otherwise fea-tureless spectrum obtained with the CTIO 4 m telescope(Perlman 1998);
– z > 0.176 (Landt & Bignall 2008), a lower limit based on aphotometric method (Piranomonte et al. 2007) that is appliedon a featureless spectrum obtained with the CTIO and NTTtelescopes;
– z ≤ 0.51 (Zech et al. 2011), a reasonably model independentupper limit, which can be pushed down to z < 0.3 when theassumption of a simple one-zone synchrotron self-Comptonscenario accounts for the observed SED, derived from theγ-ray spectra determined with Fermi/LAT and H.E.S.S.;
– z = 0.20 ± 0.05 (Prandini et al. 2012), an estimation basedon a rough calibration of the redshift of a BL Lac from themeasurement of the spectra with Fermi/LAT and H.E.S.S.for a small set of BL Lacs with known redshifts;
– z > 1.246, based on weak absorption lines at 6280 Å whichare misidentified as the redshifted Mg II 2800 Å doublet in arecent analysis (Landt 2012) of CTIO and NTT observationsfrom 2007, giving an extremely high lower limit.
While the redshift proposed by Perlman (1998) at z = 0.205needs to be confirmed because of the weakness of the spectralfeature used for its determination, it appears to be consistent withthe different non-spectroscopic estimations by Landt & Bignall(2008); Zech et al. (2011); Prandini et al. (2012). The surprisinglower limit of z > 1.246 proposed by Landt (2012), if confirmed,would imply that our understanding of the VHE γ-ray propaga-tion is incorrect, or that the EBL density is far below the valueobtained from galaxy counts, which seems to be in contradic-tion with the recent results from Ackermann et al. (2012) andAbramowski et al. (2013b). Our results, shown below, clearlyinvalidate this lower limit.
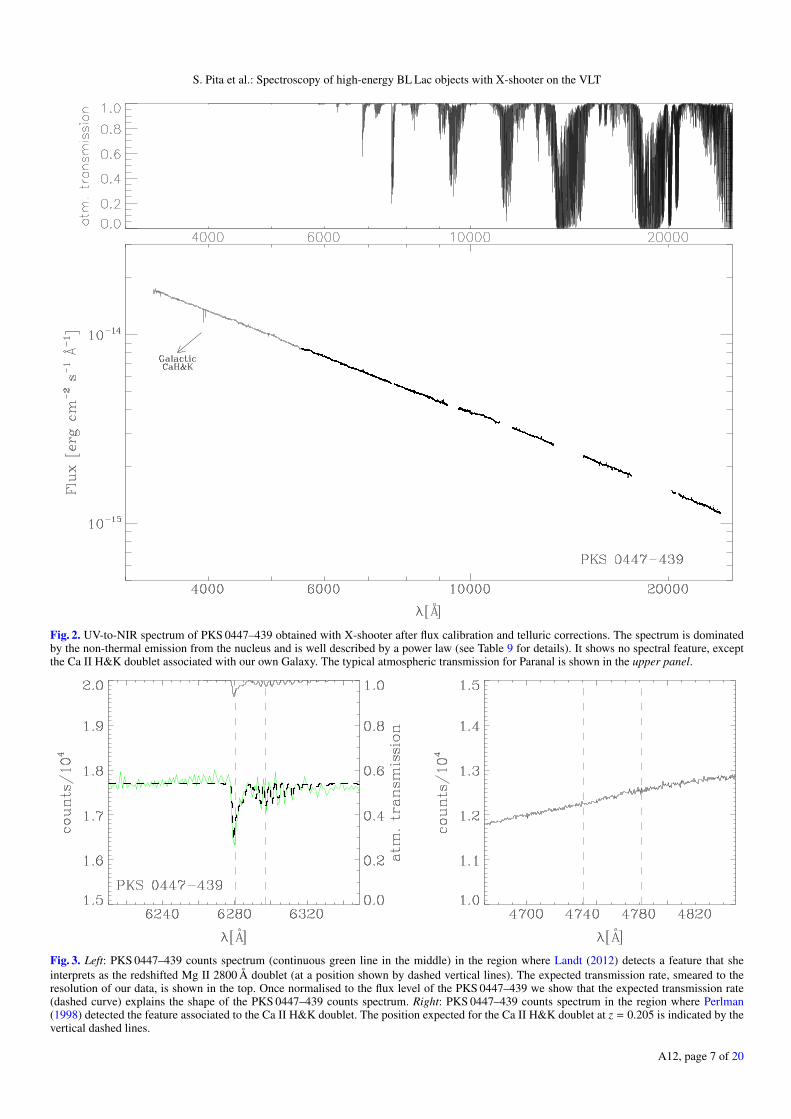
The observation of PKS 0447–439 with X-shooter took placein November 2011 with an exposure time of one hour that resultsin a spectrum with a S/N between 45 and 400, which dependson the arm (see Table 2). The NIR to UV spectrum is stronglydominated by the emission of the nucleus, as shown in Fig. 2(the typical atmospheric transmission for Paranal6 is shown inthe upper panel). The spectral shape is close to a power law withan index α = −1.32 ± 0.09 and an absolute flux at 10 000 Å of(3.87 ± 0.16)× 10−15 erg cm−2 s−1 Å−1. The source is clearly in ahigh state, as shown by the comparison of the corresponding NIRmagnitudes (see Table 3) with the 2MASS ones (Skrutskie et al.2006). This high flux hampers the detection of features from thehost galaxy and thus makes the spectroscopic determination ofthe redshift difficult.
The search for absorption or emission lines in the wholewavelength range has been done within the 2 cycles of datarecording and splitting of the data along the slit as indicated inSect. 2. After correction of the telluric spectrum (Sect. 2.2), thespectrum is featureless, except the Ca II H&K doublet associ-ated with our own Galaxy. So, despite favourable resolution andsignal-to-noise levels, there is no evidence of an extragalacticspectral feature, which could have allowed a direct spectral de-termination of the redshift of the source.
As already shown in Pita et al. (2012), we carefully exam-ined the region around 6280 Å where Landt (2012) detects afeature that she interprets as the redshifted Mg II 2800 Å dou-blet. We clearly detect a band of molecular absorption from at-mospheric O2 at these wavelengths, which is visible in all ourobservations. A zoom on this region is shown in the left panelof Fig. 3, where our spectrum corresponds to the (green) con-tinuous line in the middle and the expected transmission rate,smeared to the resolution of our data, is shown in the top. Wesee that the observed feature and the expected absorption by O2,which is normalised to the flux level of the source (dashed line),match very well in both shape and wavelength position. This isstrong evidence that the association of the 6280 Å feature withthe Mg II doublet by Landt (2012) is not correct7. We suggestthat her misidentification may have been caused by the lowerresolution of their spectrum (R ∼ 1000), which smears the mul-tiple molecular absorption of the O2 band into one or maybetwo large absorption features (see their Fig. 2 with respect to ourFig. 3). We note that this feature, being due to the Earth’s at-mosphere, is present in all the optical spectra of bright sources,BL Lac objects and standard stars, obtained in this work.
We also examined the regions where absorption and emis-sion lines are expected by considering the redshift of z = 0.205proposed by Perlman (1998), but no evidence of spectral featureswas found, in particular in the region where the feature associ-ated to the Ca II H&K doublet in Perlman (1998) was detected,as shown in Fig. 3. It should be noted, however, that this regionis dominated by the non-thermal emission of the nucleus, whichstrongly dilutes the spectral features from the AGN environment.
In addition, we estimated a lower limit on the redshift withthe imaging method proposed by Sbarufatti et al. (2005) usinga host galaxy magnitude MR = −22.5 (Shaw et al. 2013b) andMR = −22.9 (Sbarufatti et al. 2005); we obtained correspondingvalues of z > 0.175 and z > 0.19, similar to the z > 0.176 alreadyproposed by Landt & Bignall (2008).
6 See http://www.eso.org/sci/facilities/eelt/science/drm/tech_data/background7 This result has been confirmed with an independent measurement byFumagalli et al. (2012).
S. Pita et al.: Spectroscopy of high-energy BL Lac objects with X-shooter on the VLT
Fig. 2. UV-to-NIR spectrum of PKS 0447–439 obtained with X-shooter after flux calibration and telluric corrections. The spectrum is dominatedby the non-thermal emission from the nucleus and is well described by a power law (see Table 9 for details). It shows no spectral feature, exceptthe Ca II H&K doublet associated with our own Galaxy. The typical atmospheric transmission for Paranal is shown in the upper panel.
Fig. 3. Left: PKS 0447–439 counts spectrum (continuous green line in the middle) in the region where Landt (2012) detects a feature that sheinterprets as the redshifted Mg II 2800 Å doublet (at a position shown by dashed vertical lines). The expected transmission rate, smeared to theresolution of our data, is shown in the top. Once normalised to the flux level of the PKS 0447–439 we show that the expected transmission rate(dashed curve) explains the shape of the PKS 0447–439 counts spectrum. Right: PKS 0447–439 counts spectrum in the region where Perlman(1998) detected the feature associated to the Ca II H&K doublet. The position expected for the Ca II H&K doublet at z = 0.205 is indicated by thevertical dashed lines.
Finally, it is possible to estimate an upper limit to the red-shift from the absence of Lyman α absorption in the spectrum.In a first approximation, our wavelength coverage sets a roughredshift upper limit at z ≤ 1.5. A more precise upper limit maybe set using the density of the Lyman α forest for z ≤ 1.5 anddN/dz ∝ −1.85 for weak absorbers (EW ≥ 0.24 Å, see Bechtold1994). From these values, we estimated the redshift range giv-ing a 1σ probability of not detecting an absorber of that EW as∆z ∼ 0.03. Moreover, we fixed the effective start of the spectrum,λmin, as the wavelength where the S/N becomes high enough todetect these absorbers. The limit was then computed with thefollowing equation: zmax = (λmin − 1215)/1215 + ∆z, obtainingzmax = 1.51.
In conclusion, while we invalidate the lower limit z > 1.246proposed by Landt (2012) because the feature used in the esti-mation is not of extragalactic origin, we nonetheless constrainthe redshift of the source with an estimated lower limit fromphotometry z > 0.176 and a solid spectroscopic upper-limitz < 1.51.
4.2. KUV 00311–1938
The object KUV 00311–1938 was initially detected as anultraviolet-excess during a survey performed with the KisoSchmidt telescope of the Tokyo Astronomical Observatory(Kondo et al. 1984). It was later detected as a bright X-ray sourceand identified as a BL Lac by ROSAT (Bauer 2000; Schwopeet al. 2000). Subsequently, Piranomonte et al. (2007) confirmedthis identification and proposed a tentative redshift of z = 0.61,based on the interpretation of very weak features found in aspectrum obtained with the ESO 3.6 m telescope. This resultis not confirmed in the final redshift release of the 6dF GalaxySurvey (Jones et al. 2009), which reports a tentative redshift (flagQ = 2, “unlikely redshift”) at 0.7635. The source has recentlybeen detected in γ-rays, first by Fermi/LAT (Abdo et al. 2009b;Ackermann et al. 2011), and later by H.E.S.S. (Becherini et al.2012). It is considered as one of the farthest detected BL Lacknown as VHE γ-ray emitter.
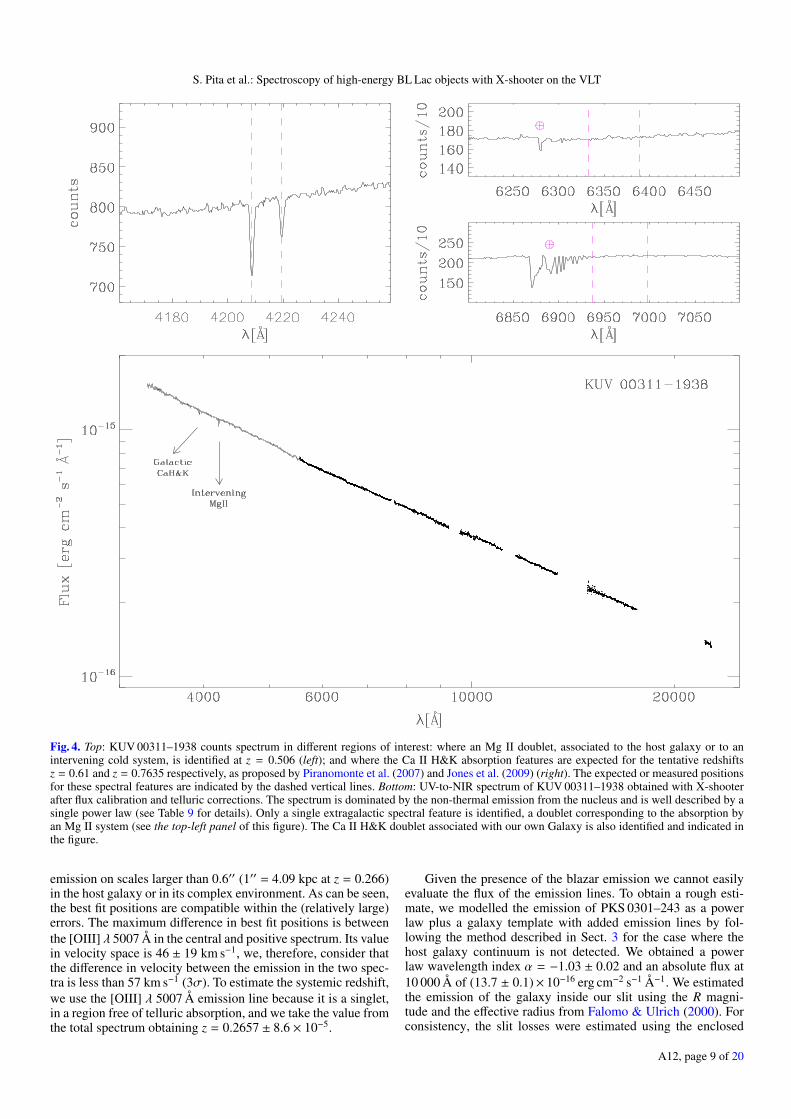
The observation of KUV 00311–1938 with X-shooter tookplace in November 2011 with an exposure time of two hours, re-sulting in a spectrum with a S/N between 25 and 250 dependingon the arm (see Table 2). The NIR to UV spectrum, shown in thelower panel of Fig. 4, is reasonably well described by a powerlaw with an index (in wavelength) α = −1.14 ± 0.14 and an ab-solute flux at 10 000 Å of (4.0 ± 0.2) × 10−16 erg cm−2 s−1 Å−1,which indicates that non-thermal emission strongly dominatesthe host galaxy emission. The corresponding NIR magnitudes,shown in Table 3, are close to those from 2MASS (Skrutskieet al. 2006).
The search for absorption or emission lines in the wholewavelength range has been done within the 3 cycles of datarecording and splitting of the data along the slit as indicatedin Sect. 2. The only extragalactic signature found is a doubletof narrow absorption lines (see the upper-left panel of Fig. 4),which are clearly identified in the UVB arm at λ = 4208.7 Å andλ = 4219.5 Å. As shown in Pita et al. (2012), we identified thisas an Mg II doublet at z = 0.50507 (±5 × 10⁻⁵), a result whichwas later confirmed by Shaw et al. (2013a). We measured theEWs of the two lines by taking into account the errors in con-tinuum placement as in Sembach & Savage (1992). We obtained0.164 ± 0.019 Å and 0.094 ± 0.011 Å, respectively. The ratio ofthe EWs is thus 1.74 ± 0.28 indicating an optically thin cloud.As there is no indication whether this absorption is produced in
the host galaxy or in an intervening cold system, this redshift canonly be considered as a lower limit of the redshift of the source.We did not detect any absorption feature of Fe II at the sameredshift. In addition, none of the absorption or emission linesat the tentative redshift proposed by Piranomonte et al. (2007)(z = 0.61) or by Jones et al. (2009) (z = 0.7635) were found.This is illustrated in the upper-right panel of Fig. 4, where theregions in which the Ca II H&K doublet would be located areshown. As for PKS 0447–439, we estimated a lower limit on theredshift with the imaging method proposed by Sbarufatti et al.(2005), using a host galaxy magnitude MR = −22.5 (Shaw et al.2013b) and MR = −22.9 (Sbarufatti et al. 2005), thus obtaining,respectively, z > 0.47 and z > 0.5. In addition, from the absenceof Lyman α absorption and the S/N near the beginning of thespectrum, we derived an upper limit on the redshift zmax = 1.54.
4.3. PKS 0301–243
This radio source was discovered during a 1415 MHz contin-uum survey with the OSU radio telescope (Ehman et al. 1970)and identified as a BL Lac by Impey & Tapia (1988) due toits high optical polarimetric fraction. Subsequently, the sourcehas been observed over the entire waveband range from radioto γ-rays. It has been discovered as a high energy γ-ray emit-ter by Fermi/LAT (Abdo et al. 2009a,b) and recently at VHE byH.E.S.S. (Wouters et al. 2012; Abramowski et al. 2013a).
A first estimation of the redshift of the source was proposedby Pesce et al. (1995) based on the spectroscopic measurementof the redshift of two close companions (located at 6′′and 20′′from PKS 0301–243), which are at z ∼ 0.263. This suggests thatPKS 0301–243 could be part of a cluster of galaxies of Abellrichness class 0. This result was supported by further observa-tions of PKS 0301–243 by Falomo & Ulrich (2000), with theplausible identification of a single weak emission line detectedat 6303 Å with the redshifted [O III] 5007 Å at z = 0.26.
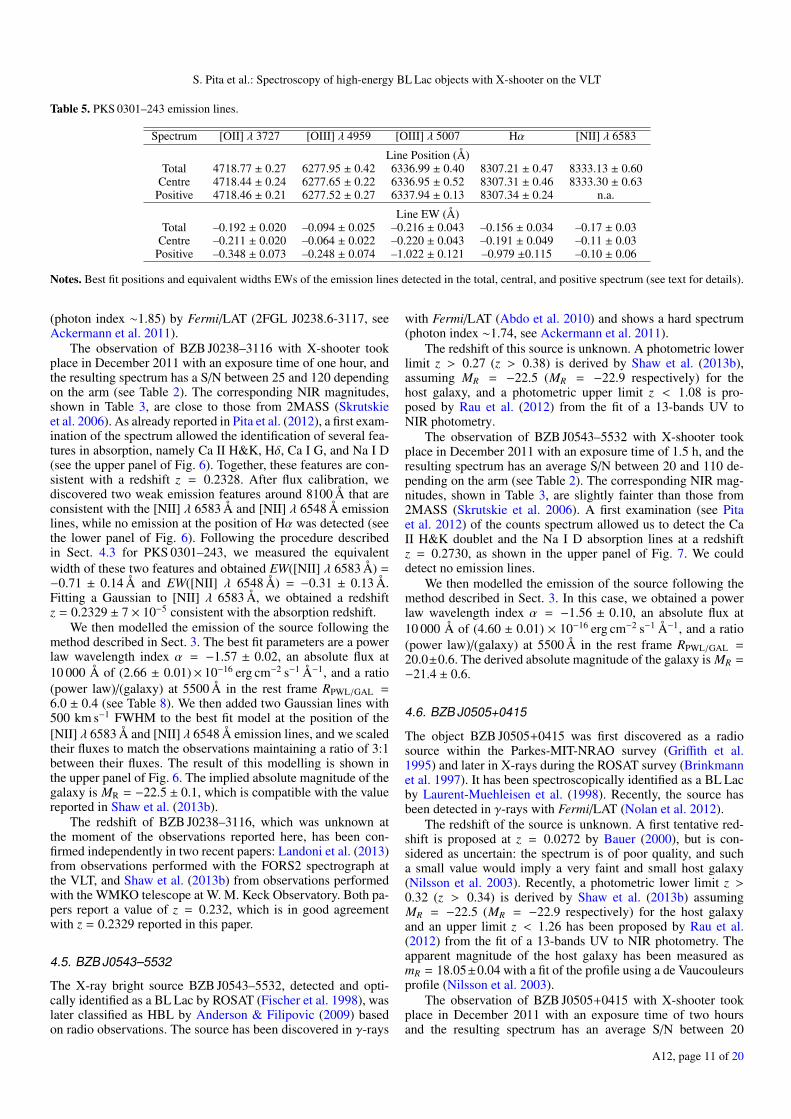
The observation of PKS 0301–243 with X-shooter took placein December 2011 with an exposure time of 4800 s resulting ina spectrum with a S/N between 35 and 210 depending on thearm (see Table 2). The corresponding NIR magnitudes, shownin Table 3, are significantly brighter than those from 2MASS(Skrutskie et al. 2006). A first examination of the UVB andVIS spectra allowed the identification of the [OII] λ 3727 Å and[OIII] λ 5007 Å emission lines (see the upper panel of Fig. 5 andalso Pita et al. 2012) and to estimate a redshift of 0.266, which ismore precise than that by Falomo & Ulrich (2000). After telluriccorrections, we were also able to detect features correspondingto [OIII] λ 4959 Å, Hα, and [NII] λ 6583 Å (see the lower panelof Fig. 5). Following Falomo & Ulrich (2000), we investigatedthe possibility of an extended origin of these emission lines. Todo so, we fitted the median slit profile of the UVB and VIS spec-tra with a Gaussian. Using the results of this fit, we extractedone spectrum (Central) from the region within 1σ (0.6′′ in UVBand 0.4′′ in VIS) from the peak and two spectra from the twosides at coordinates smaller and bigger than the centre (negativeand positive). The positive direction is towards ENE. Four of thepreviously listed emission lines were clearly visible in the cen-tral spectrum and in the positive spectrum but not in the negativespectrum. This indicates anisotropic extension of the emittingmaterial. The fifth emission line, [NII] λ 6548 Å, is only visiblein the central and in the total spectra. The EW and best fit posi-tion of each emission line were computed fitting the continuumwith a cubic spline and are shown in Table 5. The emission linesare clearly brighter in the Positive spectrum, indicating extended
A12, page 8 of 20
S. Pita et al.: Spectroscopy of high-energy BL Lac objects with X-shooter on the VLT
Fig. 4. Top: KUV 00311–1938 counts spectrum in different regions of interest: where an Mg II doublet, associated to the host galaxy or to anintervening cold system, is identified at z = 0.506 (left); and where the Ca II H&K absorption features are expected for the tentative redshiftsz = 0.61 and z = 0.7635 respectively, as proposed by Piranomonte et al. (2007) and Jones et al. (2009) (right). The expected or measured positionsfor these spectral features are indicated by the dashed vertical lines. Bottom: UV-to-NIR spectrum of KUV 00311–1938 obtained with X-shooterafter flux calibration and telluric corrections. The spectrum is dominated by the non-thermal emission from the nucleus and is well described by asingle power law (see Table 9 for details). Only a single extragalactic spectral feature is identified, a doublet corresponding to the absorption byan Mg II system (see the top-left panel of this figure). The Ca II H&K doublet associated with our own Galaxy is also identified and indicated inthe figure.
emission on scales larger than 0.6′′ (1′′ = 4.09 kpc at z = 0.266)in the host galaxy or in its complex environment. As can be seen,the best fit positions are compatible within the (relatively large)errors. The maximum difference in best fit positions is betweenthe [OIII] λ 5007 Å in the central and positive spectrum. Its valuein velocity space is 46 ± 19 km s−1, we, therefore, consider thatthe difference in velocity between the emission in the two spec-tra is less than 57 km s−1 (3σ). To estimate the systemic redshift,we use the [OIII] λ 5007 Å emission line because it is a singlet,in a region free of telluric absorption, and we take the value fromthe total spectrum obtaining z = 0.2657 ± 8.6 × 10⁻⁵.
Given the presence of the blazar emission we cannot easilyevaluate the flux of the emission lines. To obtain a rough esti-mate, we modelled the emission of PKS 0301–243 as a powerlaw plus a galaxy template with added emission lines by fol-lowing the method described in Sect. 3 for the case where thehost galaxy continuum is not detected. We obtained a powerlaw wavelength index α = −1.03 ± 0.02 and an absolute flux at10 000 Å of (13.7 ± 0.1)× 10−16 erg cm−2 s−1 Å−1. We estimatedthe emission of the galaxy inside our slit using the R magni-tude and the effective radius from Falomo & Ulrich (2000). Forconsistency, the slit losses were estimated using the enclosed
Fig. 5. Top: parts of the PKS 0301–243 counts spectrum showing emission lines in the UVB (left) and VIS (right) arms. For the VIS only thePositive spectrum (see text) is shown, because the line has a better signal-to-noise and because the Central and Negative spectra are affected by badpixels above 6350 Å. As shown by the vertical dashed lines, they correspond to [OII] λ 3727 Å and [OIII] λ 5007 Å emission lines when redshiftedto z = 0.2657. The [OIII] λ 4959 Å emission line, expected at 6278 Å is not visible before correction of the telluric absorption. Bottom: UV-to-NIRspectrum of PKS 0301–243 obtained with X-shooter after flux calibration and telluric corrections (in black) along with the results of our modelling(in red). In the insets, zooms of the emission lines in the X-shooter spectrum along with a local fit (in red). In green the galaxy model, composedby the template of Mannucci et al. (2001) with added emission lines of fixed width. The template is scaled according to the measured R magnitude(Falomo & Ulrich 2000) and to the flux enclosed in the slit, while the emission lines are scaled to the X-shooter flux level (see text for details).Results are given in Tables 5 and 8.
magnitude profile of a de Vaucouleurs profile (e.g. Graham& Driver 2005). We then added Gaussian emission lines withFWHM of 500 km s−1 to the model to simulate the detected lines,scaling the flux to obtain a reasonable match with the observa-tions. With this rough model, the jet/galaxy ratio (Piranomonteet al. 2007) at 5500 Å in the rest frame is ∼34 in agreementwith the almost featureless spectrum we observe. Concerningthe emission lines, the ratio ([OII] λ 3727 Å)/([OIII] λ 5007 Å)is ∼1.5 while the ratio ([NII] λ 6583 Å)/Hα must be slightly
smaller than one. Both ratios agree with the hypothesis that theemission lines are generated in a LINER (Ho et al. 1993).
4.4. BZB J0238–3116
The X-ray source BZB J0238–3116, present in the ROSATbright source catalogue (Schwope et al. 2000) and identi-fied as a BL Lac in the RBSC-NVSS sample (Bauer 2000),has been detected as a γ-ray emitter with a hard spectrum
Notes. Best fit positions and equivalent widths EWs of the emission lines detected in the total, central, and positive spectrum (see text for details).
(photon index ∼1.85) by Fermi/LAT (2FGL J0238.6-3117, seeAckermann et al. 2011).
The observation of BZB J0238–3116 with X-shooter tookplace in December 2011 with an exposure time of one hour, andthe resulting spectrum has a S/N between 25 and 120 dependingon the arm (see Table 2). The corresponding NIR magnitudes,shown in Table 3, are close to those from 2MASS (Skrutskieet al. 2006). As already reported in Pita et al. (2012), a first exam-ination of the spectrum allowed the identification of several fea-tures in absorption, namely Ca II H&K, Hδ, Ca I G, and Na I D(see the upper panel of Fig. 6). Together, these features are con-sistent with a redshift z = 0.2328. After flux calibration, wediscovered two weak emission features around 8100 Å that areconsistent with the [NII] λ 6583 Å and [NII] λ 6548 Å emissionlines, while no emission at the position of Hα was detected (seethe lower panel of Fig. 6). Following the procedure describedin Sect. 4.3 for PKS 0301–243, we measured the equivalentwidth of these two features and obtained EW([NII] λ 6583 Å) =−0.71 ± 0.14 Å and EW([NII] λ 6548 Å) = −0.31 ± 0.13 Å.Fitting a Gaussian to [NII] λ 6583 Å, we obtained a redshiftz = 0.2329 ± 7 × 10⁻⁵ consistent with the absorption redshift.
We then modelled the emission of the source following themethod described in Sect. 3. The best fit parameters are a powerlaw wavelength index α = −1.57 ± 0.02, an absolute flux at10 000 Å of (2.66 ± 0.01)× 10−16 erg cm−2 s−1 Å−1, and a ratio(power law)/(galaxy) at 5500 Å in the rest frame RPWL/GAL =6.0 ± 0.4 (see Table 8). We then added two Gaussian lines with500 km s−1 FWHM to the best fit model at the position of the[NII] λ 6583 Å and [NII] λ 6548 Å emission lines, and we scaledtheir fluxes to match the observations maintaining a ratio of 3:1between their fluxes. The result of this modelling is shown inthe upper panel of Fig. 6. The implied absolute magnitude of thegalaxy is MR = −22.5 ± 0.1, which is compatible with the valuereported in Shaw et al. (2013b).
The redshift of BZB J0238–3116, which was unknown atthe moment of the observations reported here, has been con-firmed independently in two recent papers: Landoni et al. (2013)from observations performed with the FORS2 spectrograph atthe VLT, and Shaw et al. (2013b) from observations performedwith the WMKO telescope at W. M. Keck Observatory. Both pa-pers report a value of z = 0.232, which is in good agreementwith z = 0.2329 reported in this paper.
4.5. BZB J0543–5532
The X-ray bright source BZB J0543–5532, detected and opti-cally identified as a BL Lac by ROSAT (Fischer et al. 1998), waslater classified as HBL by Anderson & Filipovic (2009) basedon radio observations. The source has been discovered in γ-rays
with Fermi/LAT (Abdo et al. 2010) and shows a hard spectrum(photon index ∼1.74, see Ackermann et al. 2011).
The redshift of this source is unknown. A photometric lowerlimit z > 0.27 (z > 0.38) is derived by Shaw et al. (2013b),assuming MR = −22.5 (MR = −22.9 respectively) for thehost galaxy, and a photometric upper limit z < 1.08 is pro-posed by Rau et al. (2012) from the fit of a 13-bands UV toNIR photometry.
The observation of BZB J0543–5532 with X-shooter tookplace in December 2011 with an exposure time of 1.5 h, and theresulting spectrum has an average S/N between 20 and 110 de-pending on the arm (see Table 2). The corresponding NIR mag-nitudes, shown in Table 3, are slightly fainter than those from2MASS (Skrutskie et al. 2006). A first examination (see Pitaet al. 2012) of the counts spectrum allowed us to detect the CaII H&K doublet and the Na I D absorption lines at a redshiftz = 0.2730, as shown in the upper panel of Fig. 7. We coulddetect no emission lines.
We then modelled the emission of the source following themethod described in Sect. 3. In this case, we obtained a powerlaw wavelength index α = −1.56 ± 0.10, an absolute flux at10 000 Å of (4.60 ± 0.01) × 10−16 erg cm−2 s−1 Å−1, and a ratio(power law)/(galaxy) at 5500 Å in the rest frame RPWL/GAL =20.0±0.6. The derived absolute magnitude of the galaxy is MR =−21.4 ± 0.6.
4.6. BZB J0505+0415
The object BZB J0505+0415 was first discovered as a radiosource within the Parkes-MIT-NRAO survey (Griffith et al.1995) and later in X-rays during the ROSAT survey (Brinkmannet al. 1997). It has been spectroscopically identified as a BL Lacby Laurent-Muehleisen et al. (1998). Recently, the source hasbeen detected in γ-rays with Fermi/LAT (Nolan et al. 2012).
The redshift of the source is unknown. A first tentative red-shift is proposed at z = 0.0272 by Bauer (2000), but is con-sidered as uncertain: the spectrum is of poor quality, and sucha small value would imply a very faint and small host galaxy(Nilsson et al. 2003). Recently, a photometric lower limit z >0.32 (z > 0.34) is derived by Shaw et al. (2013b) assumingMR = −22.5 (MR = −22.9 respectively) for the host galaxyand an upper limit z < 1.26 has been proposed by Rau et al.(2012) from the fit of a 13-bands UV to NIR photometry. Theapparent magnitude of the host galaxy has been measured asmR = 18.05±0.04 with a fit of the profile using a de Vaucouleursprofile (Nilsson et al. 2003).
The observation of BZB J0505+0415 with X-shooter tookplace in December 2011 with an exposure time of two hoursand the resulting spectrum has an average S/N between 20
A12, page 11 of 20
A&A 565, A12 (2014)
Fig. 6. Top: part of the X-shooter counts spectrum of BZB J0238–3116 in the UVB arm after a median filtering with a 5-pixel window. Theabsorption features are identified as corresponding to the Ca II H&K, Hδ, and Ca I G absorption lines for z = 0.2328. The expected positionsare indicated by the dashed vertical lines. Bottom: UV-to-NIR spectrum of BZB J0238–3116 obtained with X-shooter after flux calibration andtelluric corrections (in black) along with the results of our modelling (in red). In the insets, zooms are on the absorption and emission lines(Na I D, [NII] λ 6583 Å and Hα) identified after flux calibration and telluric correction along with a local fit (in red). In green, the galaxy model,as composed by the template of Mannucci et al. (2001) with added emission lines of fixed width. The galaxy model normalisation and the slopeof the model (in red) are the result of a fit, as explained in Sect. 3. Results are given in Table 8.
and 90 depending on the arm (see Table 2). The correspondingNIR magnitudes, as shown in Table 3, are close to those from2MASS (Skrutskie et al. 2006). As already reported in Pita et al.(2012), a first examination of the spectrum allowed the identifi-cation of several features in absorption, namely Mgb, CaI+FeI,and Na I D at redshift z = 0.424 (see the upper panel of Fig. 8).After flux calibration and merging of the spectra, we were alsoable to identify the Ca II H&K doublet, which falls at the junc-tion between the UVB and VIS arm. We could not detect anyemission line. However, we remark that the complex with theHα emission line and the [NII] doublet falls in a region of hightelluric absorption.
The spectrum of the source (see the lower panel of Fig. 8)is then modelled following the method described in Sect. 3.In this case, we obtained a power law wavelength indexα = −1.42 ± 0.10, an absolute flux at 10 000 Å of (2.06 ±0.02) × 10−16 erg cm−2 s−1 Å−1, and a ratio (power law)/(galaxy)at 5500 Å in the rest frame RPWL/GAL = 4.5 ± 0.8. We ap-plied slit-loss corrections using the effective radius of Nilssonet al. (2003) obtaining an apparent magnitude for the host galaxymR = 18.6 ± 0.2, which is compatible with the photometricvalue given above. The final absolute magnitude of the galaxyis MR = −24.2 ± 0.2, indicating a very luminous galaxy.
S. Pita et al.: Spectroscopy of high-energy BL Lac objects with X-shooter on the VLT
Fig. 7. Top: parts of the X-shooter counts spectrum of BZB J0543–5532 both in the UVB and VIS arms, after a median filtering with a 3-pixelwindow. The absorption features are identified as corresponding to the Ca II H&K (left) and Na I D (right) for z = 0.2730. The expected positionsare indicated by the dashed vertical lines. Bottom: UV-to-NIR spectrum of BZB J0543–5532 (in black) along with the result of our modelling (inred), as based on a fit of a galaxy template (in green) and a power law (see Sect. 3 for details and Table 8 for results). In the inset, a zoom of theabsorption lines corresponding to Ca II H&K doublet (already identified in the counts spectrum and shown in the upper panel) and a local fit (inred) are shown.
4.7. BZB J0816–1311
Discovered by ROSAT in X-rays, BZB J0816–1311 has beenidentified as a BL Lac object by Motch et al. (1998). It hasbeen discovered in γ-rays with Fermi/LAT (Abdo et al. 2010)and shows a hard spectrum in the HE band with a photon index∼1.80 (Ackermann et al. 2011). In the final redshift release ofthe 6dF galaxy survey (Jones et al. 2009), a redshift at z = 0.046is proposed for this source, with a quality status Q = 3, which isdescribed as “probable”. Recently Shaw et al. (2013b) derived aphotometric lower limit on the redshift z > 0.28 (z > 0.34) byassuming MR = −22.5 (MR = −22.9 respectively) for the host
galaxy and an upper limit z < 1.66 from the absence of Lymanα absorption in their spectra.
The observation of BZB J0816–1311 with X-shooter tookplace in November 2011 with an exposure time of 6000 s, whichresults in a spectrum with a S/N between 20 and 110 depend-ing on the arm (see Table 2). As shown in Table 3, the corre-sponding NIR magnitudes are slightly fainter than those from2MASS (Skrutskie et al. 2006). The NIR to UV spectrum, asshown in Fig. 9, is reasonably well described by a power lawwith an index of −1.24 ± 0.15 and an absolute flux at 10 000 Åof (2.0 ± 0.1) × 10−16 erg cm−2 s−1 Å−1, which indicates thatnon-thermal emission dominates the host galaxy emission. The
Fig. 8. Top: parts of the X-shooter counts spectrum of BZB J0505+0415 in the VIS arm after a median filtering with a 3-pixel window. Theabsorption features are identified as corresponding to the Mg and CaI+FeI (left) and Na I D (right) lines for z = 0.424. The expected positionsare indicated by the dashed vertical lines. Bottom: UV-to-NIR spectrum of BZB J0505+0415 (in black) along with the result of our modelling (inred), based on a fit of a galaxy template (in green) and a power law (see Sect. 3 for details, and Table 8 for results). In the inset, a zoom of theabsorption lines corresponding to Ca II H&K doublet at z = 0.424, identified after flux calibration and telluric correction, is shown along with alocal fit (in red).
search for absorption or emission lines in the whole wavelengthrange has been done within the three cycles of data recordingand splitting of the data along the slit as indicated in Sect. 2. Asa result and as shown in the upper panel of Fig. 9, only threedoublets of narrow absorption lines have been identified in theUVB arm. The three doublets are identified as the absorption byMg II; as for each doublet the ratio between the two lines posi-tions is 1.0025. The corresponding redshifts are: 0.1902, 0.2336and 0.2882. The first two systems are clearly detected and areoptically thin, the third one is fainter and appears to be satu-rated. The characteristics of the three Mg II doublets are givenin Table 6. No other absorption features were detected at theseredshifts, in particular corresponding to Fe II.
As there is no indication if the absorption at z = 0.2882 isproduced in the host galaxy or in an intervening cold system, thisredshift can only be considered as a lower limit of the redshift ofthe source (z ≥ 0.2882). From the absence of Lyman α absorp-tion and considering the S/N near the beginning of the spectrum,we derive an upper limit to the redshift z < 1.56.
4.8. RBS 334
The X-ray source RBS 334, present in the ROSAT Bright SourceCatalogue (Schwope et al. 2000), was identified as a BL Lac ob-ject in the RBSC-NVSS sample (Bauer 2000). It has been dis-covered in γ-rays with Fermi/LAT (Abdo et al. 2010) and shows
S. Pita et al.: Spectroscopy of high-energy BL Lac objects with X-shooter on the VLT
Fig. 9. Top: part of the X-shooter counts spectrum of BZB J0816–1311 in the UVB arm before flux calibration and telluric corrections. Theabsorption features are identified as corresponding to the Mg II doublet in three intervening systems, respectively at z = 0.1902, z = 0.2336, andz = 0.2882. The corresponding positions are indicated by the dashed vertical lines. Bottom: UV-to-NIR spectrum of BZB J0816–1311 obtainedwith X-shooter after flux calibration and telluric corrections. The spectrum is dominated by the non-thermal emission from the nucleus and is welldescribed by a power law (see Table 9 for details). No other extragalactic spectral features are identified.
Table 6. Mg II absorbing systems in the line of sight of BZB J0816–1311.
Notes. Redshift, equivalent widths (EW1 and EW2) of both componentsof the Mg II absorbing systems, their ratio, and the summed signal-to-noise (S) of their detection.
a very hard spectrum in the HE band with a photon index ∼1.56(see Ackermann et al. 2011). The redshift of the source is un-known.
This source is the only one in our sample which was ob-served in November 2010. The exposure time was 4800 s foran average S/N between 20 and 120 depending on the arm(see Table 2). The corresponding NIR magnitudes, as shown inTable 3, are close to those from 2MASS (Skrutskie et al. 2006).
In Pita et al. (2012) we reported a possible redshift, z = 0.411, onthe basis of the detection of the Ca II H&K feature split betweenthe UVB and VIS arms. As shown in Fig. 10 after flux calibrationand merging of the arms, we are able to confirm this detectionand, therefore, the proposed redshift. Moreover, after correctionof the telluric absorption, we detected features corresponding tothe presence of Ca I G, Mg, CaI+FeI, and Na I D in the VISspectrum, and the two stronger absorption lines of the Calciumtriplet in the NIR spectrum. No emission lines could be detected.We then modelled the emission of the source as described inSect. 3, obtaining the best fit with a power law wavelength in-dex α = −1.66 ± 0.15, an absolute flux at 10 000 Å of (2.26 ±0.02)× 10−16 erg cm−2 s−1 Å−1, and a ratio (power law)/(galaxy)at 5500 Å in the rest frame, RPWL/GAL = 5.0 ± 1.6. The derivedabsolute magnitude of the galaxy is MR = −24.0 ± 0.3.
5. Discussion
We have observed a sample of eight BL Lac objects with un-known or uncertain redshift, which were previously believed to
Fig. 10. Top: part of the X-shooter counts spectrum of RBS 334 in the VIS arm after a median filtering with a 3-pixel window. The absorptionfeatures are identified as corresponding to the Ca I G (left) and CaI+FeI (right) lines for z = 0.411. The expected positions are indicated by thedashed vertical lines. Bottom: UV-to-NIR spectrum of RBS 334 (in black) along with the result of our modelling (in red) based on a fit of a galaxytemplate (in green) and a power law (see Sect. 3 for details and Table 8 for results). In the insets, zooms in regions where different absorptionfeatures were identified at z = 0.411 after flux calibration and telluric correction, which corresponds to Ca II H&K, Mg, CaI+FeI, Na I D, and thetwo stronger absorption lines of the calcium triplet.
lie at z ≥ 0.2, with the new X-shooter spectrograph to deter-mine or better constrain the redshift by detecting absorption oremission features of the host galaxy or absorbing systems inthe line of sight (see Table 7 for the list of the features we de-tected for each source). With this new instrument, we hoped tobe substantially more efficient than previous observations thanksto the higher resolution in a wide waveband with respect toprevious observations. In this work, the importance of a higherresolution has been clearly demonstrated by the invalidation ofthe proposed redshifts for PKS 0447–439 and BZB J0816–1311.The benefit of a wide waveband is illustrated by the detectionin this work of several features in the UVB and VIS arms, soallowing the unambiguous determination of several redshifts.This is, for example, the case of PKS 0301–243, for which wecould detect five emission features compared to one detected by
Falomo & Ulrich (2000). The very good S/N allowed us to mea-sure the 5500 Å rest frame jet/galaxy ratio for four sources, upto a value as high as 25. However, this value should not be con-sidered as a general limit, as it depends on several parameters,such as the S/N, the redshift, and the slope of the power law.For comparison, Piranomonte et al. (2007) on the basis of sim-ulations, proposed that the BL Lac spectra become featurelesswhen this ratio exceeds 10.
5.1. Value of the NIR arm
The contribution of the NIR arm to the detection of spectral fea-tures has been quite low with only the detection of the Calciumtriplet in the case of RBS 334. There are several reasons for this.
S. Pita et al.: Spectroscopy of high-energy BL Lac objects with X-shooter on the VLT
Table 7. List of main features detected for each source.
Source Redshift Absorption lines Emission lines
BZB J0238–3116 0.2329 Ca II H&K, Hδ, Ca I G, Na I D [NII] λ 6548 Å, [NII] λ 6583 ÅBZB J0543–5532 0.273 Ca II H&K, Na I DBZB J0505+0415 0.424 Ca II H&K, Mgb, CaI+FeI, Na I DRBS 334 0.411 Ca II H&K, Ca I G, CaI+FeI, Na I D, Ca tripletPKS 0301–243 0.2657 [OII] λ 3727 Å, [OIII] λ 4959 Å, [OIII] λ 5007 Å
[NII] λ 6548 Å, Hα, [NII] λ 6583 Å
KUV 00311–1938 0.506 ≤ z ≤ 1.54 Mg II λ 2796 Å, 2803 ÅBZB J0816–1311 0.288 ≤ z ≤ 1.56 Three Mg II λ 2796 Å, 2803 Å at different redshifts
Notes. The columns contain: (1) the name of the source; (2) the redshift; (3 and 4) the name of the absorption and emission features detected. SeeSect. 4 for details.
Table 8. Main results of our analysis for sources with measured redshift.
Source Redshift Detected Flux (erg cm−2 s−1 Å−1) Power law index Flux ratio mR(galaxy) MR (galaxy)line type 10 000 Å 5500 Å
Notes. The columns contain from left to right: (1) source name; (2) redshift; (3) detected line type, absorption (Abs) or emission (Em); (4) fluxat 10 000 Å; (5) UVB–NIR power law slope; (6) jet/galaxy ratio at 5500 Å in the rest frame; (7) apparent magnitude of the host galaxy beforeslit loss correction (for PKS 0301-243, we quote the magnitude measured by Falomo & Ulrich 2000 and the upper limit derived following thediscussion in Sect. 3); and (8) absolute magnitude of the host galaxy corrected by slit losses considering an effective radius of 10 kpc for allsources, except BZB J0505+0415, for which we used the effective radius from Nilsson et al. (2003), and PKS 0301-243, for which we quote themagnitude measured by Falomo & Ulrich (2000).
Table 9. Main results of our analysis for sources without measured redshift.
Source Redshift Detected Redshift Flux (erg cm−2 s−1 Å−1) Power law index Flux ratio mR(galaxy)spectroscopic line type imaging 10 000 Å 5500 Å
KUV 00311–1938 0.506 ≤ z ≤ 1.54 Int ≥0.47 4.0(±0.2) × 10−16 −1.14 ± 0.14 ≥18 ≤19.7BZB J0816–1311 0.288 ≤ z ≤ 1.56 Int ≥0.33 2.0(±0.1) × 10−16 −1.24 ± 0.15 ≥10 ≤ 19.5
Notes. The columns contain from left to right: (1) source name; (2) spectroscopic limits on redshifts (lower limits based on intervening systems andupper-limits on the non detection of Lyα); (3) detected line type, “Int” for intervening system; (4) limits on redshifts based on the imaging methodproposed by Sbarufatti et al. (2005) (for MR = −22.5); (5) the flux at 10 000 Å; (6) UVB–NIR power law slope; (7) limits on the jet/galaxy ratio at5500 Å in the determined rest frame that assumes a redshift at 0.506, 0.288, and 0.175, respectively, for KUV 00311–1938, BZB J0816–1311, andPKS 0447–439; and (8) upper limit to the apparent magnitude of the host galaxy.
On the one hand, the NIR band is affected by the presence ofseveral strong atmospheric absorption bands and emission lines.Moreover, the technological level of NIR detectors is not as goodas the one of CCDs used in the UVB and VIS arms, as demon-strated by the presence of many more cosmetic defects (such ashot and cold pixels). On the other hand, concerning the charac-teristics of the source, the lower intrinsic flux implies a lowersignal-to-noise ratio in this part of the spectrum. More impor-tantly, as the redshifts of BL Lac objects detected by Fermi/LATare mostly smaller than 1 (Ackermann et al. 2011), the absorp-tion features which can be found in the NIR band are muchweaker than those present in the UVB and VIS bands.
Concerning emission lines, the NIR arm may allow the de-tection of the Hα for redshifts greater than 0.5. Indeed, if weconsider our model of PKS 0301-243, which includes the fit ofHα, and we displace the source at redshifts greater than 0.5,we find that, accounting for the evolution of the S/N with the
wavelength, this emission line remains detectable in the NIR armup to redshifts z ∼ 0.6. However, the frequency of γ-ray BL Lacswith redshifts measured with emission lines is quite low (∼10%,see Shaw et al. 2013b), which implies that we do not expect tobe often in this case.
Therefore, for these objects, we expect that the UVB and VISarms will, in general, be more effective for the detection of spec-tral features. The NIR arm in this work mainly allowed a muchmore complete modelling of the respective contributions of thejet and host galaxy.
5.2. Comparison with previous results
Of the eight blazars we observed, we have measured the red-shift for five objects, while for two sources we have de-tected absorption systems which strongly constrain the red-shift. We have therefore measured (constrained) the redshift
A12, page 17 of 20
A&A 565, A12 (2014)
for 5/8 (7/8) of our sample compared to 34% (59%) in Shawet al. (2013b) for the whole sample. Though the comparisoncould be difficult because of the smallness of our sample, wenote that Shaw et al. (2013b) observed five of the objects westudied (KUV 0033–1921, BZB J0238–316, BZB J0505+0415,BZB J0543–5532, and BZB J0816–311), but they could deter-mine a redshift for only one of them and detected no absorptionsystem, whereas we measured three redshifts and detected fourabsorption systems.
Shaw et al. (2013b) observed the different sources in theirsample for about 30 minutes with a resolution between 500and 1000. Given the telescopes and instruments they used, theirsensitivity in flux should be slightly lower than ours. The differ-ence between our results and theirs is mainly due to the spec-tral resolution of X-shooter, which is a factor of 5–15 times bet-ter. Indeed, a test on BZB J0543–5322 and KUV 00311–1938,which consists in degrading the X-shooter spectra to the resolu-tion corresponding to the Shaw et al. (2013b) observations (re-spectively with EFOSC2, resolution R ∼ 350, and with LRISat Palomar, resolution R ∼ 600–1000) shows that the featuresdetected by X-shooter (Ca II H&K for BZB J0543–5322 and theMg II absorbing system for KUV 00311–1938) are barely vis-ible in the degraded spectra, thus justifying the non-detectionwith low resolution spectrographs mounted on four-meter classtelescopes.
5.3. Properties of the host galaxies
We estimated the absolute magnitudes of the detected host galax-ies and upper limits for the non-detected ones. In the case ofPKS 0301–243 and BZB J0505+0415, we directly used the ef-fective radius measured by Falomo & Ulrich (2000) and Nilssonet al. (2003). Under these hypotheses, our measured magnitudeof the two host galaxies are compatible within the errors with thephotometric ones. Therefore, we estimate that the errors on theabsolute magnitude are the same as the errors on the host galaxyapparent magnitude given in Table 8.
For the detected galaxies with no previous photometric pro-file, we estimated the slit losses assuming that the host galaxyhas an effective radius re = 10 kpc with a de Vaucouleurs profilewith Sersic index 1/4 (Shaw et al. 2013b). Under these hypothe-ses the slit loss corrections are between 0.64 and 0.78 mag, whilethe corrections are ∼0.2 mag larger using re = 20 kpc.
The K-corrections were computed using the template spec-trum, and for simplicity, no evolution correction was applied.The resulting absolute magnitudes can be found in Table 8; thedetected galaxies are all very luminous with an average magni-tude of MR = −23.0, marginally brighter than the average valueof γ-ray blazars observed in Shaw et al. (2013b) and compatiblewith the average magnitudes of Sbarufatti et al. (2005).
For PKS 0447–439, KUV 00311–1938, and BZB J0816–1311, we estimated a lower limit to the redshift assuming theaverage absolute magnitude of Shaw et al. (2013b; see Table 9).The redshift limit for PKS 0447–439 is in good agreement withthe values proposed by Perlman (1998), Landt & Bignall (2008)and Prandini et al. (2012). The limits for KUV 00311–1938 andBZB J0816–1311 are, respectively, less and more constrainingthan the spectroscopic ones.
Emission lines were detected in PKS 0301–243 andBZB J0238–3118. To investigate the environment in whichthey formed, we compute ([NII] λ 6583 Å)/Hα and [OIII]/Hβ(Baldwin et al. 1981; Kewley et al. 2006) line ratios under theassumption of narrow lines. The line EW measurements are used
as we cannot properly evaluate the uncertainties of our mod-elling. This choice is justified because the lines are not very dis-tant in wavelength and the continuum of the host galaxies doesnot vary much between them (∼20%). Moreover, we checkedthat the computed ratios using the model are very similar to theones computed with the equivalent widths.
We assume that the Balmer decrement is 3.1, as in case Brecombination at temperature T = 104 K and electron densityne ∼ 102–104 cm−3 (Osterbrock & Ferland 2006). This assump-tion is consistent with our non-detection of Hβ. Under these as-sumptions, ([NII] λ 6583 Å)/Hα ∼ 0.12 ± 0.1 for the total spec-trum and ∼−0.43 ± 0.1 for the positive spectrum of PKS 0301–243, while [OIII]/Hβ is ∼0.53± 0.15 for the total spectrum and∼0.5± 0.08 for the positive spectrum. Notably, the first value isindicative of an AGN environment, while the second is more typ-ical of a transition/star forming region. This is coherent with theexpectation that the central region is more likely to be dominatedby the AGN, while the external region is dominated by star for-mation, perhaps triggered by interaction with the nearby smallgalaxies visible in the images of Falomo & Ulrich (2000). Onthe other hand, ([NII] λ 6583 Å)/Hα ≥ 0.5 for BZB J0238-3118,indicating an extreme AGN environment. As [OIII] λ 5007 Åwas not detected, we cannot go further in this case.
5.4. Absorption systems
We detected four Mg II absorbing systems in our sample withtheir rest equivalent widths (REW) being 0.17 Å, 0.86 Å, 0.49 Å,and 0.12 Å. We computed the redshift path ∆z (the redshiftlength where we can detect Mg II systems) only for the UVBand VIS arms, as we do not expect that our sources have red-shifts ≥2.75 (such that Mg II absorbers would lie in the infraredband). The covered redshift path ∆z cannot be computed exactly,because we have three objects without redshift. From the red-shifts and upper limits determined, ∆z ≥ 1.39 is the minimumvalue, while we obtain ∆z = 3.47 as a maximum possible valueassuming z = 1 for the three undetermined redshifts.
The incidence of absorbing systems along the line of sight,(N/∆z), is therefore between 2.89 ± 1.1 and 1.15 ± 0.4 at 〈z〉 ∼0.31 and 0.57, respectively. We cannot directly compare this tomost complete surveys of Mg II systems (e.g. Zhu & Ménard2013), which are based on SDSS, because they are limited, onthe one hand, to redshift ≥0.35, while, on the other hand, theydo not have enough sensitivity to be compared to our data.
Recently, Evans et al. (2013) have computed the incidenceof Mg II absorbing systems in the redshift range 0.1 to 2.6 witha sensitivity down to 0.05 Å. They divide the sample into weak(0.01 Å< REW < 0.3 Å), intermediate (0.3Å< REW < 1 Å),and strong (REW > 1 Å) systems. The expected incidence atz ≤ 1 are about 0.74, 0.7, and 0.5, respectively (see their Fig. 3).Our incidences are between 1.45 ± 0.5 and 0.57 ± 0.2 for weakand intermediate systems, respectively, and 0 for strong systems.Given the smallness of our sample, we conclude that our resultsare compatible with theirs. We note that X-shooter archival ob-servation of bright blazars may be relevant to the study of weakabsorbers at low redshift.
6. Conclusion
We observed eight BL Lac objects detected in the HE-VHE range with the Fermi satellite and/or by ground-basedCherenkov telescopes with the X-shooter spectrograph at VLT.The goal of the campaign was to measure or constrain the
A12, page 18 of 20
S. Pita et al.: Spectroscopy of high-energy BL Lac objects with X-shooter on the VLT
redshift of our targets and to investigate the properties of the hostgalaxies. With our observations, we have obtained the followingmain results:
– Measurement of five redshifts and two strict lower limitsfrom absorption systems. All redshifts values are greaterthan 0.2. In particular, a firm lower-limit is given for thefirst time at z > 0.506 for KUV 00311–1938 which is con-sidered as one of the farthest sources detected at VHE, butno evidence is seen for the Ca II H&K feature found byPiranomonte et al. (2007) at z = 0.61. Moreover, we re-futed the redshift z = 0.046 of BZB J0816–1311 proposed byJones et al. (2009) and found a firm lower limit at z ≥ 0.288.
– Refutation of the redshift lower limit z ≥ 1.246 proposed byLandt (2012) for PKS 0447–439, the only source for whichno extragalactic spectral feature were found in our observa-tions. We constrain the redshift range to 0.175 < z < 1.51.
– Measurement of the magnitudes of the host galaxies, whichare marginally brighter than the average values for the hostgalaxies of blazars.
– Demonstration of the possibility to determine a spectro-scopic redshift for a 5500 Å rest frame jet/galaxy ratio ashigh as 25.
– Rough estimation of the overall properties of the gas in thetwo host galaxies displaying detectable emission lines.
In this work, we selected a sample of eight HE-VHE emittingBL Lac objects with unknown redshift, and we were highly suc-cessful in measuring their redshift or setting a lower limit to itusing the X-shooter spectrograph. Comparing our results to theones of Shaw et al. (2013b), we remark that our efficiency inconstraining the blazar redshifts is comparatively high, and wetentatively ascribe this effect mainly to our higher spectral res-olution. All the seven BL Lacs with constrained redshift have aredshift greater than 0.2. The VHE emitting BL Lacs at thoseredshifts are particularly rare because the γ-ray emission, on theone hand, is absorbed by the EBL, and on the other hand, thehost galaxy emission becomes more difficult to detect at greaterdistances. They are, however, of great interest because they putstrong constraints on the EBL density (Ackermann et al. 2012;Abramowski et al. 2013b).
In the near future, it is expected that the number of VHEBL Lac objects, with the operations of H.E.S.S. 2 and CTA, willgrow substantially. We argue that X-shooter observations of theiroptical counterparts will be very effective in constraining theirredshifts. This will, in turn, help in tuning their emission modelsand putting stronger constraints on the EBL.
Acknowledgements. We wish to thank the ATOM team for providing usefulinformation on the monitoring of some of the sources in our sample and Dr.Yvonne Becherini for her contributions in the selection of the targets observedin this work. S. Pita wishes to thank the ESO staff and in particular ChristopheMartayan for their help in performing the observations.
ReferencesAbdo, A. A., Ackermann, M., Ajello, M., et al. 2009a, ApJS, 183, 46Abdo, A. A., Ackermann, M., Ajello, M., et al. 2009b, ApJ, 700, 597Abdo, A. A., Ackermann, M., Ajello, M., et al. 2010, ApJS, 188, 405Abramowski, A., Acero, F., et al. (H.E.S.S. Collaboration) 2011, A&A, 533,
A110Abramowski, A., Acero, F., et al. (H.E.S.S. Collaboration) 2012a, A&A, 538,
A103Abramowski, A., Acero, F., et al. (H.E.S.S. Collaboration) 2012b, A&A, 539,
A149Abramowski, A., Acero, F., et al. (H.E.S.S. Collaboration) 2013a, A&A, 559,
A136
Abramowski, A., Acero, F., et al. (H.E.S.S. Collaboration) 2013b, A&A, 550,A4
Abramowski, A., Acero, F., et al. (H.E.S.S. Collaboration) 2013c, A&A, 552,A118
Acharya, B. S., Actis, M., et al. (CTA Consortium) 2013, Astropart. Phys., 43, 3Ackermann, M., Ajello, M., Allafort, A., et al. 2011, ApJ, 743, 171Ackermann, M., Ajello, M., Allafort, A., et al. 2012, Science, 338, 1190Aliu, E., Archambault, S., Arlen, T., et al. 2012, ApJ, 750, 94Anderson, M. W. B., & Filipovic, M. D. 2009, Serb. Astron. J., 179, 7Baldwin, J. A., Phillips, M. M., & Terlevich, R. 1981, PASP, 93, 5Bauer, F. E., Condon, J. J., Thuan, T. X., & Broderick, J. J. 2000, ApJS, 129,
547Becherini, Y., Boisson, C., Cerruti, M., & H. E. S. S. Collaboration. 2012, in AIP
Conf. Ser. 1505, eds. F. A. Aharonian, W. Hofmann, & F. M. Rieger, 490Bechtold, J. 1994, ApJS, 91, 1Bohlin, R. C. 2007, in The Future of Photometric, Spectrophotometric and
Polarimetric Standardization, ed. C. Sterken, ASP Conf. Ser., 364, 315Brinkmann, W., Siebert, J., Feigelson, E. D., et al. 1997, A&A, 323, 739Costamante, L., & Ghisellini, G. 2002, A&A, 384, 56Craig, N., & Fruscione, A. 1997, AJ, 114, 1356Ehman, J. R., Dixon, R. S., & Kraus, J. D. 1970, AJ, 75, 351Evans, J. L., Churchill, C. W., Murphy, M. T., Nielsen, N. M., & Klimek, E. S.
2013, ApJ, 768, 3Falomo, R., & Ulrich, M.-H. 2000, A&A, 357, 91Fischer, J.-U., Hasinger, G., Schwope, A. D., et al. 1998, Astron. Nachr., 319,
347Fitzpatrick, E. L. 1999, PASP, 111, 63Fortin, P., Fegan, S., Horan, D., et al. 2010, in 25th Texas Symp. Relativistic
Astrophysics, Hela in Germany, eds. M. R. Frank, V. E. Christopher, & H.Werner
Fumagalli, M., Furniss, A., O’Meara, J. M., et al. 2012, A&A, 545, A68Furniss, A., Williams, D. A., Danforth, C., et al. 2013, ApJ, 768, L31Ghisellini, G., & Maraschi, L. 1989, ApJ, 340, 181Ghisellini, G., Tavecchio, F., Foschini, L., & Ghirlanda, G. 2011, MNRAS, 414,
2674Ginzburg, V. L., & Syrovatskii, S. I. 1965, ARA&A, 3, 297Goldoni, P., Royer, F., François, P., et al. 2006, in SPIE Conf. Ser., 6269, 80Graham, A. W., & Driver, S. P. 2005, PASA, 22, 118Griffith, M. R., Wright, A. E., Burke, B. F., & Ekers, R. D. 1995, ApJS, 97,
347Halpern, J. P., Chen, V. S., Madejski, G. M., & Chanan, G. A. 1991, AJ, 101,
818Hauser, M. G., & Dwek, E. 2001, ARA&A, 39, 249Hensberge, H. 2007, in The Future of Photometric, Spectrophotometric and
Polarimetric Standardization, ed. C. Sterken, ASP Conf. Ser., 364, 275Ho, L. C., Filippenko, A. V., & Sargent, W. L. W. 1993, ApJ, 417, 63Impey, C. D., & Tapia, S. 1988, ApJ, 333, 666Jones, D. H., Read, M. A., Saunders, W., et al. 2009, MNRAS, 399, 683Kelson, D. D. 2003, PASP, 115, 688Kewley, L. J., Groves, B., Kauffmann, G., & Heckman, T. 2006, MNRAS, 372,
961Kondo, M., Noguchi, T., & Maehara, H. 1984, Annals of the Tokyo Astronomical
Observatory, 20, 130Landoni, M., Falomo, R., Treves, A., et al. 2013, AJ, 145, 114Landt, H. 2012, MNRAS, 423, L84Landt, H., & Bignall, H. E. 2008, MNRAS, 391, 967Landt, H., Padovani, P., & Giommi, P. 2002, MNRAS, 336, 945Large, M. I., Mills, B. Y., Little, A. G., Crawford, D. F., & Sutton, J. M. 1981,
MNRAS, 194, 693Laurent-Muehleisen, S. A., Kollgaard, R. I., Ciardullo, R., et al. 1998, ApJS,
118, 127Mannucci, F., Basile, F., Poggianti, B. M., et al. 2001, MNRAS, 326, 745Modigliani, A., Goldoni, P., Royer, F., et al. 2010, in SPIE Conf. Ser., 7737,
56Motch, C., Guillout, P., Haberl, F., et al. 1998, A&AS, 132, 341Nilsson, K., Pursimo, T., Heidt, J., et al. 2003, A&A, 400, 95Nolan, P. L., Abdo, A. A., Ackermann, M., et al. 2012, ApJS, 199, 31Osterbrock, D. E., & Ferland, G. J. 2006, Astrophysics of gaseous nebulae and
active galactic nuclei (Sausalito: University Science Books)Perlman, et al., E. S. 1998, AJ, 115, 1253Pesce, J. E., Falomo, R., & Treves, A. 1995, AJ, 110, 1554Piranomonte, S., Perri, M., Giommi, P., Landt, H., & Padovani, P. 2007, A&A,
470, 787Pita, S., Goldoni, P., Boisson, C., et al. 2012, in AIP Conf. Ser. 1505, eds. F. A.
Aharonian, W. Hofmann, & F. M. Rieger, 566Prandini, E., Bonnoli, G., & Tavecchio, F. 2012, A&A, 543, A111Rau, A., Schady, P., Greiner, J., et al. 2012, A&A, 538, A26Raue, M., Behera, B., Charbonnier, A., et al. 2009, ATel, 2350, 1
A12, page 19 of 20
A&A 565, A12 (2014)
Rines, K., Geller, M. J., Kurtz, M. J., & Diaferio, A. 2003, AJ, 126, 2152Sbarufatti, B., Treves, A., & Falomo, R. 2005, ApJ, 635, 173Schlegel, D. J., Finkbeiner, D. P., & Davis, M. 1998, ApJ, 500, 525Schwope, A., Hasinger, G., Lehmann, I., et al. 2000, Astron. Nachr., 321, 1Sembach, K. R., & Savage, B. D. 1992, ApJS, 83, 147Shaw, M. S., Filippenko, A. V., Romani, R. W., Cenko, S. B., & Li, W. 2013a,
AJ, 146, 127Shaw, M. S., Romani, R. W., Cotter, G., et al. 2013b, ApJ, 764, 135Sikora, M., & Zbyszewska, M. 1985, MNRAS, 212, 553Skrutskie, M. F., Cutri, R. M., Stiening, R., et al. 2006, AJ, 131, 1163Tavecchio, F., Ghisellini, G., Ghirlanda, G., Foschini, L., & Maraschi, L. 2010,
MNRAS, 401, 1570Urry, C. M., & Padovani, P. 1995, PASP, 107, 803
Urry, C. M., Falomo, R., Scarpa, R., et al. 1999, ApJ, 512, 88Vacca, W. D., Cushing, M. C., & Rayner, J. T. 2003, PASP, 115, 389van Dokkum, P. G. 2001, PASP, 113, 1420Verdoes Kleijn, G. A., van der Marel, R. P., & Noel-Storr, J. 2006, AJ, 131, 1961Vernet, J., Kerber, F., Mainieri, V., et al. 2010, Highlights of Astronomy, 15,
535Vernet, J., Dekker, H., D’Odorico, S., et al. 2011, A&A, 536, A105Vincent, P. 2005, in International Cosmic Ray Conf., 5, 163Wouters, D., Lenain, J.-P., Becherini, Y., et al. 2012, in AIP Conf. Ser. 1505, eds.
F. A. Aharonian, W. Hofmann, & F. M. Rieger, 498Zech, A., Behera, B., Becherini, Y., et al. 2011, Proc. from the 25th Texas Symp.
on Relativistic Astrophysics, PoS (Texas 2010) 200 [arXiv:1105.0840]Zhu, G., & Ménard, B. 2013, ApJ, 770, 130