Spectrum Analyzer RSA600A Series Laboratory Spectrum Analyzer Datasheet The RSA600A Series USB spectrum analyzers offer high bandwidth laboratory spectrum analysis in a small, very transportable package. Features and benefits 9 kHz to 3.0/7.5 GHz frequency range covers a broad range of analysis needs 40 MHz acquisition bandwidth enables real time analysis for transient capture and vector analysis Amplitude accuracy of 0.2 dB to 3 GHz (95% confidence) Standard GPS/GLONASS/Beidou receiver Optional tracking generator for gain/loss, antenna and cable measurements Streaming capture can be used to record and play back long term events SignalVu-PC software offers real time signal processing with DPX Spectrum/Spectrogram to minimize time spent finding transient problems 100 μsec minimum signal duration with 100% probability of intercept ensure you see problems first time, every time Application programming interface included for development of custom programs Accessories including tablet PC, calibration kits, adapters and phase- stable cables offer a complete solution for design, characterization, and manufacturing Applications Characterization of RF devices, subsystems, and systems Manufacturing test Mobile field operations The RSA600 Series gives you the bandwidth and analysis tools you need to succeed The RSA600 series brings real-time spectrum analysis and wide analysis bandwidth to solving the problems of engineers who need to characterize, validate and manufacture their designs. The heart of the system is the USB-based RF spectrum analyzer that captures 40 MHz bandwidths with great fidelity. With 70 dB dynamic range and frequency coverage to 7.5 GHz, you can fully characterize wideband signals up to 40 MHz bandwidths. The USB form factor moves the processing power to the PC of your choice, so you decide when you need more processing power or memory. The optional tracking generator enables gain/loss measurements for quick tests of filters, amplifiers, duplexers and other components, and you can add cable and antenna measurements of VSWR, return loss, distance to fault, and cable loss as needed. SignalVu-PC software offers rich analysis capability for your lab The RSA600 series operates with SignalVu-PC, a powerful program used as the basis of Tek's traditional spectrum analyzers, offering a deep analysis capability previously unavailable in low-cost laboratory solutions. Real-time processing of the DPX spectrum/spectrogram is enabled in your PC, further reducing the cost of hardware. Customers who need programmatic access to the instrument can choose either the SignalVu-PC programmatic interface or use the included application programming interface (API) that provides a rich set of commands and measurements directly. Basic functionality of the free SignalVu-PC program is far from basic. Base version measurements are shown below. www.tek.com 1
Transcript
Spectrum AnalyzerRSA600A Series Laboratory Spectrum Analyzer Datasheet
The RSA600A Series USB spectrum analyzers offer high bandwidthlaboratory spectrum analysis in a small, very transportable package.
Features and benefits
9 kHz to 3.0/7.5 GHz frequency range covers a broad range of analysisneeds
40 MHz acquisition bandwidth enables real time analysis for transientcapture and vector analysis
Amplitude accuracy of 0.2 dB to 3 GHz (95% confidence)
Standard GPS/GLONASS/Beidou receiver
Optional tracking generator for gain/loss, antenna and cablemeasurements
Streaming capture can be used to record and play back long termevents
SignalVu-PC software offers real time signal processing with DPXSpectrum/Spectrogram to minimize time spent finding transientproblems
100 μsec minimum signal duration with 100% probability of interceptensure you see problems first time, every time
Application programming interface included for development of customprograms
Accessories including tablet PC, calibration kits, adapters and phase-stable cables offer a complete solution for design, characterization, andmanufacturing
Applications
Characterization of RF devices, subsystems, and systems
Manufacturing test
Mobile field operations
The RSA600 Series gives you the bandwidthand analysis tools you need to succeedThe RSA600 series brings real-time spectrum analysis and wide analysisbandwidth to solving the problems of engineers who need to characterize,validate and manufacture their designs. The heart of the system is theUSB-based RF spectrum analyzer that captures 40 MHz bandwidths withgreat fidelity. With 70 dB dynamic range and frequency coverage to7.5 GHz, you can fully characterize wideband signals up to 40 MHzbandwidths. The USB form factor moves the processing power to the PC ofyour choice, so you decide when you need more processing power ormemory.
The optional tracking generator enables gain/loss measurements for quicktests of filters, amplifiers, duplexers and other components, and you canadd cable and antenna measurements of VSWR, return loss, distance tofault, and cable loss as needed.
SignalVu-PC software offers rich analysiscapability for your labThe RSA600 series operates with SignalVu-PC, a powerful program usedas the basis of Tek's traditional spectrum analyzers, offering a deepanalysis capability previously unavailable in low-cost laboratory solutions.Real-time processing of the DPX spectrum/spectrogram is enabled in yourPC, further reducing the cost of hardware. Customers who needprogrammatic access to the instrument can choose either the SignalVu-PCprogrammatic interface or use the included application programminginterface (API) that provides a rich set of commands and measurementsdirectly. Basic functionality of the free SignalVu-PC program is far frombasic. Base version measurements are shown below.
www.tek.com 1
Measurements and functions included in SignalVu-PC baseversion
General signal analysis DescriptionSpectrum analyzer Spans from 100 Hz to 7.5 GHz, 3 traces
+ math and spectrogram trace,5 markers with power, relative power,integrated power, power density anddBc/Hz functions
DPX spectrum/spectrogram Real time display of spectrum with 100%probability of intercept of 100 usecsignals in up to 40 MHz span
Amplitude, frequency, phase vs. time,RF I and Q vs. time
Basic vector analysis functions
Time overview/navigator Enables easy setting of acquisition andanalysis times for deep analysis inmultiple domains
Spectrogram Analyze and re-analyze your signal in 2-D or 3-D waterfall display
AM/FM listening Hear and record to file FM and AMsignals
Signal recording Record 40 MHz bandwidth for re-analysis in all domains including realtime spectrum analysis (requiresapplication SV56 for Playback)
Analog modulation analysis DescriptionAM, FM, PM analysis Measures key AM, FM, PM parametersRF measurements DescriptionSpurious measurement User-defined limit lines and regions
provide automatic spectrum violationtesting across the entire range of theinstrument.
Spectrum emission mask User-set or standards-specific masks.Occupied bandwidth Measures 99% power, -xdB down
points.Channel power and ACLR Variable channel and adjacent/alternate
power measurements.CCDF Complementary Cumulative Distribution
Function plots the statistical variations insignal level.
Signal strength with audio tone Measures signal strength and displays aspectrum and signal strength bar forinterference hunting and signal qualityevaluations.
The RSA600A combined with SignalVu-PCoffers advanced measurementsWith 40 MHz of real-time bandwidth, the unique DPX spectrum/spectrogram shows you every instance of an interfering or unknown signal,even down to 100 μs in duration. The following image shows a WLANtransmission (green and orange), and the narrow signals that repeat acrossthe screen are a Bluetooth access probe. The spectrogram (upper part ofthe screen) clearly separates these signals in time to show any signalcollisions.
Finding unexpected signals is easy with unattended mask monitoring. Amask can be created on the DPX spectrum display, and actions taken uponevery violation, including stop, save a picture, save acquisition, or send anaudible alert. In the illustration below, a mask violation has occurred in redon the mask, and a picture of the screen was saved as a result. Masktesting can be used for unattended monitoring and when playing backrecorded signals, enabling testing for different violations on the samesignals.
Datasheet
2 www.tek.com
The tracking generator (Option 04 on the RSA600) is controlled viaSignalVu-PC. Here you can enter start-stop frequencies, set number ofsteps in the span, adjust reference level, and normalize the trackinggenerator with a calibrate function. A bandpass filter response from800 MHz to 3 GHz is shown below.
SignalVu-PC application-specific licensesSignalVu-PC offers a wealth of application-oriented options including:
Buetooth® analysis of Low Energy, Basic Rate and Enhanced DataRate
P25 analysis of phase I and phase 2 signals
WLAN analysis of 802.11a/b/g/j/p, 802.11n, 802.11ac
LTE™ FDD and TDD Base Station (eNB) Cell ID & RF measurements
Mapping
Pulse analysis
AM/FM/PM/Direct Audio Measurement including SINAD, THD
Playback of recorded files, including complete analysis in all domains
Signal classification and survey
See the separate SignalVu-PC data sheet for complete details and orderinginformation. Selected applications are illustrated below.
General purpose modulation analysis
SignalVu-PC application SV21 bundles 27 different modulation types into asingle analysis package and offers constellation displays, eye diagrams,symbol tables, trellis diagrams, modulation quality summaries and more.Symbol rates and filter types are adjustable and an internal equalizer isincluded for signal optimization. The illustration below is of a TETRA-standard signal modulated with pi/4DQPSK modulation at 18.0 ksymbols/sec.
Bluetooth
With application SV27 you can perform Bluetooth SIG standard-basedtransmitter RF measurements in the time, frequency, and modulationdomains. This application supports Basic Rate and Low Energy Transmittermeasurements defined by Bluetooth SIG Test Specification RF.TS.4.1.1 forBasic Rate and RF-PHY.TS.4.1.1 for Bluetooth Low Energy. ApplicationSV27 also automatically detects Enhanced Data Rate packets,demodulates them and provides symbol information. Data packet fields arecolor encoded in the Symbol table for clear identification. Pass/Fail resultsare provided with customizable limits and the Bluetooth presets make thedifferent test set-ups push-button. The measurement below showsdeviation vs. time, frequency offset and drift, and a measurement summarywith pass/fail results.
APCO 25
SignalVu-PC application SV26 enables analysis of APCO P25 signals. Thefollowing image shows a Phase II HCPM signal being monitored foranomalies with the spectrogram while performing transmitter power,modulation, and frequency measurements to the TIA-102 standardsspecification.
Laboratory Spectrum Analyzer
www.tek.com 3
LTE
Application SV28 enables the following LTE base station transmittermeasurements:
Cell ID
Channel power
Occupied bandwidth
Adjacent channel leakage ratio (ACLR)
Spectrum emission mask (SEM)
Transmitter off power for TDD
The measurements follow the definition in 3GPP TS Version 12.5 andsupport all base station categories, including picocells and femtocells.Pass/Fail information is reported and all channel bandwidths are supported.
The Cell ID preset displays the Primary Synchronization Signal (PSS) andthe Secondary Synchronization Signal (SSS) in a Constellation diagram. Italso provides Frequency Error.
The illustration below shows spectral monitoring with the spectrogramdisplay combined with a Cell ID/Constellation, Spectrum Emission Maskand ACLR measurements.
Return Loss/VSWR, distance to fault and cable loss – Perform componentcharacterization tasks easily and cost-effectively. When equipped with the option04 tracking generator, the RSA500A series with application license SV60xx-SVPCmakes one-port measurements on cables, devices and antennas.
Return loss of a bandpass filter measured from 700 MHz to 2.6 GHz.Markers have been placed a 1.48 GHz (-34.4 dB return loss) and at1.73 GHz (-11.68 dB return loss), indicating the best and worse match inthe passband of the filter
WLAN 802.11a/b/g/j/p/n/ac
With options SV23, 24 and 25, sophisticated WLAN measurements areeasy. On the 802.11ac (20 MHz) signal shown, the spectrogram shows theinitial pilot sequence followed by the main signal burst. The modulation isautomatically detected as 64 QAM for the packet and displayed as aconstellation. The data summary indicates an EVM of -37.02 dB RMS, andburst power is measured at -17.32 dBm. SignalVu-PC applications areavailable for 802.11a/b/j/g/p, 802.11n, and 802.11ac to 40 MHz bandwidth.
Datasheet
4 www.tek.com
Playback
Application SV56, Playback of recorded signals, can reduce hours ofwatching and waiting for a spectral violation to minutes at your deskreviewing recorded data.
Recording length is limited only by storage media size, and recording is abasic feature included in SignalVu-PC. SignalVu-PC application SV56(Playback) allows for complete analysis by all SignalVu-PC measurements,including DPX Spectrogram. Minimum signal duration specifications aremaintained during playback. AM/FM audio demodulation can be performed.Variable span, resolution bandwidth, analysis length, and bandwidth are allavailable.
In the illustration below, the FM band is being replayed, with a maskapplied to detect spectral violations, simultaneous with listening to the FMsignal at the center frequency of 92.3 MHz.
Rackmount for 1 or 2 RSA600s
Laboratory Spectrum Analyzer
www.tek.com 5
SpecificationsAll specifications are guaranteed unless noted otherwise. All specifications apply to all models unless noted otherwise.
Frequency
Frequency rangeRSA603A 9 kHz to 3 GHzRSA607A 9 kHz to 7.5 GHz
Frequency marker readoutaccuracy
±(RE × MF + 0.001 × Span) Hz
RE: Reference Frequency Error
MF: Marker Frequency [Hz]
Reference frequency accuracyInitial accuracy at Cal (30 minwarm-up)
±1 x 10⁻⁶
First year aging, typical ±1 x 10⁻⁶ (1 year)Cumulative error (Initialaccuracy + temperature +aging), typical
3 x 10⁻⁶ (1 year)
Temperature drift ±0.9 x 10⁻⁶ (-10 to 60 °C)External reference input BNC connector, 50 Ω nominalExternal reference inputfrequency
Every 1 MHz from 1 to 20 MHz plus the following: 1.2288 MHz, 2.048 MHz, 2.4576 MHz, 4.8 MHz, 4.9152 MHz, 9.8304 MHz,13 MHz, and 19.6608 MHz.
The spurious level on the input signal must be less than -80 dBc within 100 kHz offset to avoid on-screen spurious.External reference input range ± 5 ppmExternal reference input level -10 to +10 dBm
9 kHz to 40 MHz ≤40 MHz 1 ±1.0 dB 0.60 dB>40 MHz to 4.0 GHz ≤20 MHz ±0.10 dB 0.08 dB 0.3°>4 GHz to 7.5 GHz ≤20 MHz ±0.35 dB 0.20 dB 0.7°>40 MHz to 4 GHz ≤40 MHz ±0.15 dB 0.08 dB 0.6°>4 GHz to 7.5 GHz ≤40 MHz ±0.40 dB 0.20 dB 1.0°
Channel response (Amplitudeflatness)
For these specifications, use a flat top window for maximum CW amplitude verification accuracy with the RF attenuator setting at10 dB. The specifications are valid for the test center frequencies listed at the end of the table.
Characteristic DescriptionAmplitude flatness
Span≤20 MHz ±0.5 dB≤40 MHz ±0.5 dB
Test center frequencies (in MHz) 21, 30, 500, 1000, 1500, 2000, 2500, 3000, 3500, 3950, 4050, 4500, 4850, 4950,5500, 5750, 5850, 6200, 6650, 6750, 7000, 7450
1 Span extents cannot exceed lower frequency limit of the instrument
Laboratory Spectrum Analyzer
RF input
www.tek.com 7
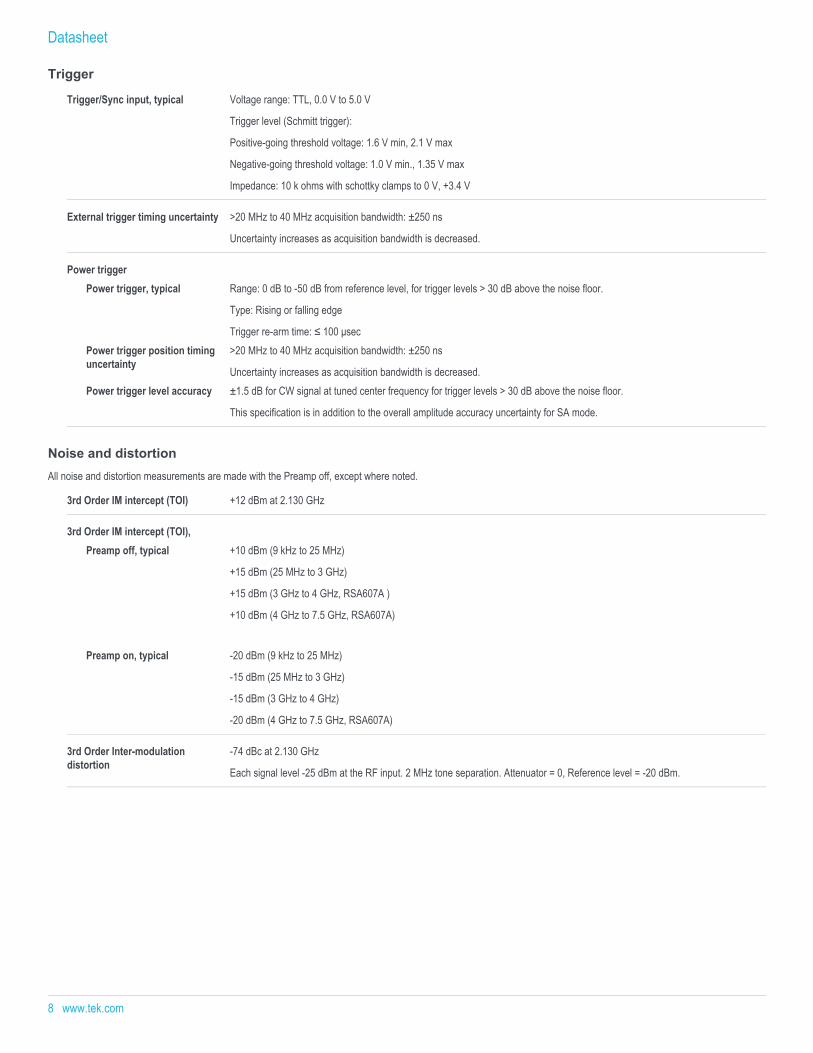
Trigger
Trigger/Sync input, typical Voltage range: TTL, 0.0 V to 5.0 V
Trigger level (Schmitt trigger):
Positive-going threshold voltage: 1.6 V min, 2.1 V max
Negative-going threshold voltage: 1.0 V min., 1.35 V max
Impedance: 10 k ohms with schottky clamps to 0 V, +3.4 V
Uncertainty increases as acquisition bandwidth is decreased.
Power triggerPower trigger, typical Range: 0 dB to -50 dB from reference level, for trigger levels > 30 dB above the noise floor.
Type: Rising or falling edge
Trigger re-arm time: ≤ 100 μsecPower trigger position timinguncertainty
>20 MHz to 40 MHz acquisition bandwidth: ±250 ns
Uncertainty increases as acquisition bandwidth is decreased.Power trigger level accuracy ±1.5 dB for CW signal at tuned center frequency for trigger levels > 30 dB above the noise floor.
This specification is in addition to the overall amplitude accuracy uncertainty for SA mode.
Noise and distortionAll noise and distortion measurements are made with the Preamp off, except where noted.
3rd Order IM intercept (TOI) +12 dBm at 2.130 GHz
3rd Order IM intercept (TOI),Preamp off, typical +10 dBm (9 kHz to 25 MHz)
+15 dBm (25 MHz to 3 GHz)
+15 dBm (3 GHz to 4 GHz, RSA607A )
+10 dBm (4 GHz to 7.5 GHz, RSA607A)
Preamp on, typical -20 dBm (9 kHz to 25 MHz)
-15 dBm (25 MHz to 3 GHz)
-15 dBm (3 GHz to 4 GHz)
-20 dBm (4 GHz to 7.5 GHz, RSA607A)
3rd Order Inter-modulationdistortion
-74 dBc at 2.130 GHz
Each signal level -25 dBm at the RF input. 2 MHz tone separation. Attenuator = 0, Reference level = -20 dBm.
Datasheet
8 www.tek.com
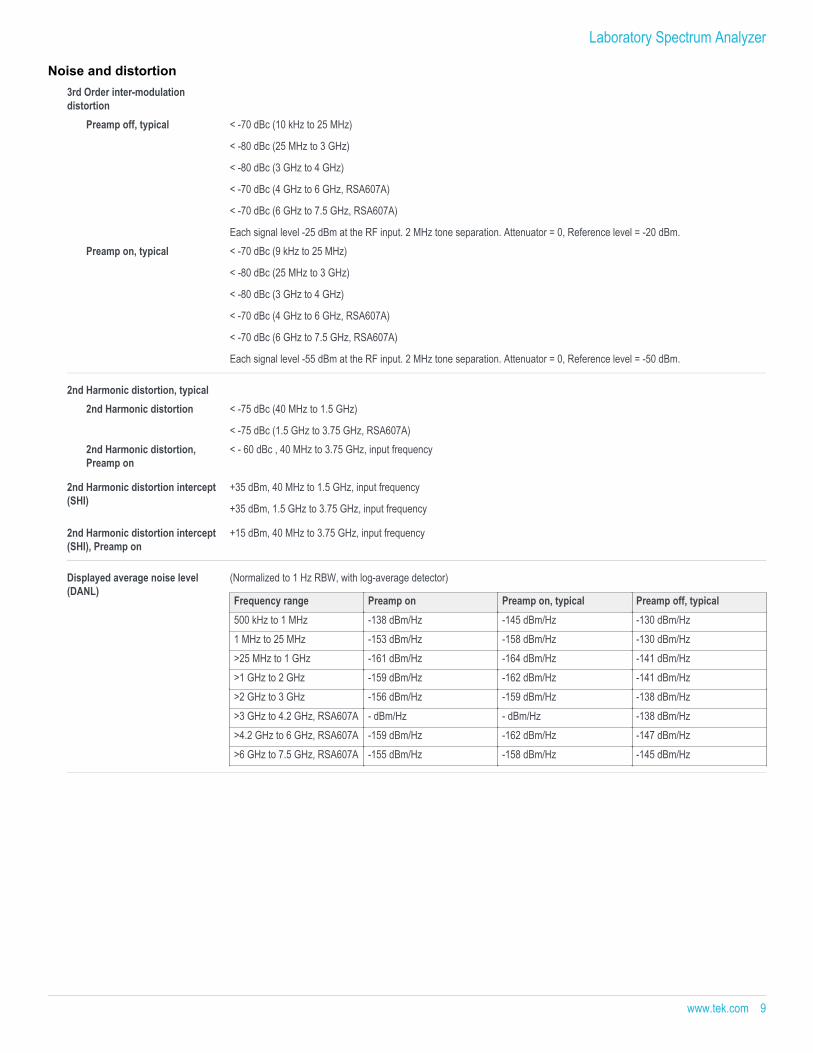
3rd Order inter-modulationdistortion
Preamp off, typical < -70 dBc (10 kHz to 25 MHz)
< -80 dBc (25 MHz to 3 GHz)
< -80 dBc (3 GHz to 4 GHz)
< -70 dBc (4 GHz to 6 GHz, RSA607A)
< -70 dBc (6 GHz to 7.5 GHz, RSA607A)
Each signal level -25 dBm at the RF input. 2 MHz tone separation. Attenuator = 0, Reference level = -20 dBm.Preamp on, typical < -70 dBc (9 kHz to 25 MHz)
< -80 dBc (25 MHz to 3 GHz)
< -80 dBc (3 GHz to 4 GHz)
< -70 dBc (4 GHz to 6 GHz, RSA607A)
< -70 dBc (6 GHz to 7.5 GHz, RSA607A)
Each signal level -55 dBm at the RF input. 2 MHz tone separation. Attenuator = 0, Reference level = -50 dBm.
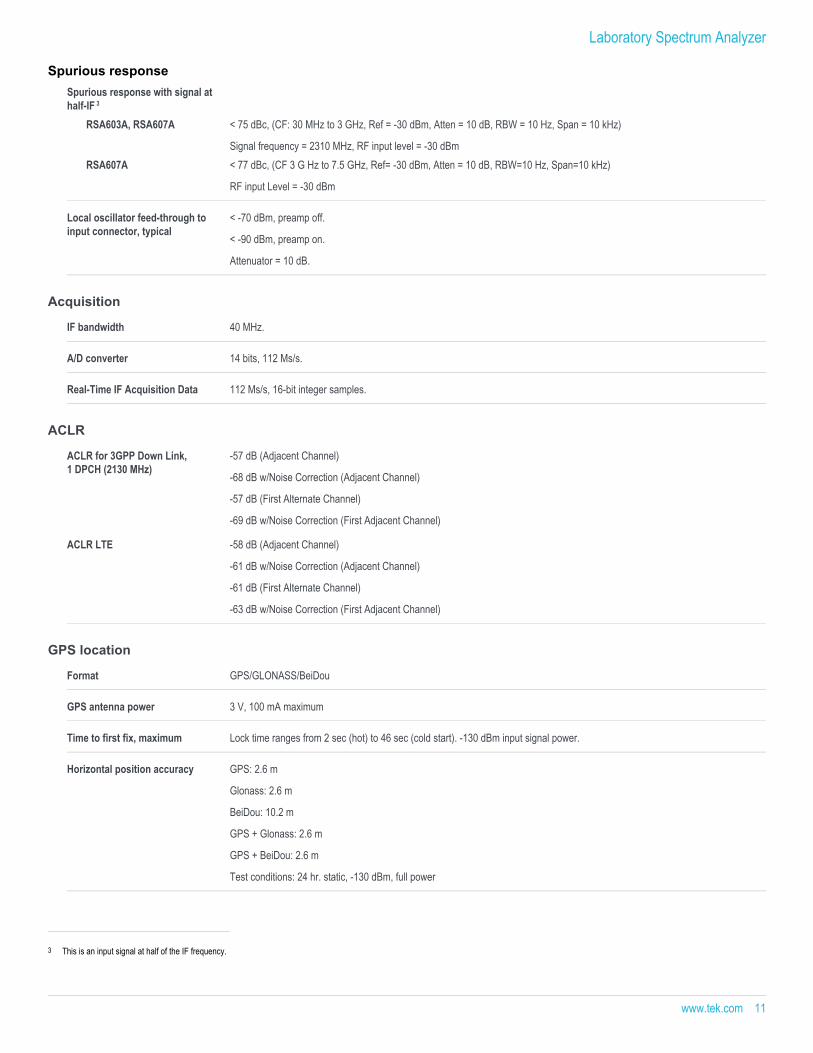
Signal frequency = 2310 MHz, RF input level = -30 dBmRSA607A < 77 dBc, (CF 3 G Hz to 7.5 GHz, Ref= -30 dBm, Atten = 10 dB, RBW=10 Hz, Span=10 kHz)
RF input Level = -30 dBm
Local oscillator feed-through toinput connector, typical
< -70 dBm, preamp off.
< -90 dBm, preamp on.
Attenuator = 10 dB.
Acquisition
IF bandwidth 40 MHz.
A/D converter 14 bits, 112 Ms/s.
Real-Time IF Acquisition Data 112 Ms/s, 16-bit integer samples.
ACLR
ACLR for 3GPP Down Link,1 DPCH (2130 MHz)
-57 dB (Adjacent Channel)
-68 dB w/Noise Correction (Adjacent Channel)
-57 dB (First Alternate Channel)
-69 dB w/Noise Correction (First Adjacent Channel)
ACLR LTE -58 dB (Adjacent Channel)
-61 dB w/Noise Correction (Adjacent Channel)
-61 dB (First Alternate Channel)
-63 dB w/Noise Correction (First Adjacent Channel)
GPS location
Format GPS/GLONASS/BeiDou
GPS antenna power 3 V, 100 mA maximum
Time to first fix, maximum Lock time ranges from 2 sec (hot) to 46 sec (cold start). -130 dBm input signal power.
Horizontal position accuracy GPS: 2.6 m
Glonass: 2.6 m
BeiDou: 10.2 m
GPS + Glonass: 2.6 m
GPS + BeiDou: 2.6 m
Test conditions: 24 hr. static, -130 dBm, full power
3 This is an input signal at half of the IF frequency.
Laboratory Spectrum Analyzer
Spurious response
www.tek.com 11
Tracking generator (Option 04)
Tracking Generator (Option 04)Frequency range 9 kHz to 3 GHz
9 kHz to 7.5 GHz Sweep speed 6700 MHz/second, 101 points, 50 kHz RBW (11 mS per point)
Measured using a Panasonic Toughpad FZ-G1, Intel® Core™ i5-5300U 2.3 GHz Processor, 8 GB RAM, 256 GB SSD,Windows®7 Pro.
Frequency resolution 100 HzTG output connector N typeVSWR < 1.8:1, 10 MHz to 7.5 GHz, -20 dBm output levelMaximum output power -3 dBmOutput power level settingrange
40 dB
Output power level step size 1 dBOutput power level step sizeaccuracy
± 0.5 dB
Output level accuracy ± 1.5 dB, 10 MHz to 7.5 GHz, -20 dBm output levelHarmonics < -22 dBcNon-harmonic spurious < -30 dBc; spurious < 2 GHz from TG output frequency
< -25 dBc; spurious ≥ 2 GHz from TG output frequencyReverse power withoutdamage
40 Vdc, +20 dBm RF
Transmission gainmeasurement error
Gain of +20 to -40 dB: ±1 dB
Transmission gainmeasurement dynamic range
70 dB
Return Loss, Distance-to-Fault, and Cable Loss measurements
Return Loss, Distance-to-Fault,and Cable Loss measurements
Measurements Return Loss, Cable Loss, Distance-to-FaultFrequency range 10 MHz to 3 GHz (RSA603A)
10 MHz to 7.5 GHz (RSA607A)Sweep speed 4 5 ms/point, Return Loss measurement
5 ms/point, Distance-to-Fault measurement
5 ms/point, Cable Loss measurementFrequency resolution 500 HzReturn Loss measurementerror
Return Loss of 0 to 15 dB: ±0.5 dB
Return Loss of 15 to 25 dB: ±1.5 dBReturn Loss of 25 to 35 dB: ±4.0 dB
Return Loss measurementerror at 14 dB Return Loss
±1.5 dB from 10 MHz to 6.8 GHz
±3.0 dB from 6.8 GHz to 7.5 GHz
±1.0 dB from 10 MHz to 6.8 GHz
±2.5 dB from 6.8 GHz to 7.5 GHz
4 201 point sweep Measured using a Panasonic Toughpad FZ-G1.
Datasheet
12 www.tek.com
Return Loss measurementrange
50 dB
Interference immunity Return Loss Measurement Error within specifications for the following conditions:
+5 dBm interferer power within 800 kHz of measurement point
+5 dBm interferer power more than 800 kHz away from measurement pointDistance-to-Fault range 1500 m or 15 dB one-way cable loss capable, user defined.
Maximum range is a function of the cable velocity factor and the frequency step size as follows:
Range = ( Vp × c2 ) × ( N − 1
Fstop − Fstart )Where:
Vp = Cable velocity factor relative to the speed of light
c = Speed of light (m/s)
Fstart = Sweep start frequency (Hz)
Fstop = Sweep stop frequency (Hz)
N = number of sweep pointsDistance-to-Fault resolution 0.03m (RSA503A, RG-58 (Vp=0.66)), User Definable 0.01m (RSA507A, RG-58 (Vp=0.66)), User Definable
Minimum resolution is a function of the cable velocity factor and the frequency step size as follows:
Resolution = ( Vp × c2 ) × ( 1
Fstop − Fstart )or
Resolution = ( RangeN − 1 )
Laboratory Spectrum Analyzer
Return Loss, Distance-to-Fault, and Cable Loss measurements
www.tek.com 13
SignalVu-PC standard measurements and performance
Measurements included General signal analysisSpectrum analyzer Spans from 1 kHz to 7.5 GHz
Three traces plus math and spectrogram traceFive markers with power, relative power, integrated power,power density and dBc/Hz functions
DPX Spectrum/Spectrogram Real time display of spectrum with 100% probability of interceptof 100 μsec signals in up to 40 MHz span
Amplitude, frequency, phase vs. time, RF I and Q vs. time Basic vector analysis functionsTime Overview/Navigator Enables easy setting of acquisition and analysis times for deep
analysis in multiple domainsSpectrogram Analyze and re-analyze your signal with a 2-D or 3-D waterfall
displayAM/FM listening Hear, and record to file, FM and AM signalsAnalog modulation analysisAM, FM, PM analysis Measures key AM, FM, PM parametersRF measurementsSpurious measurement User-defined limit lines and regions provide automatic spectrum
violation testing across the entire range of the instrumentSpectrum emission mask User-defined or standards-specific masksOccupied Bandwidth Measures 99% power, -xdB down pointsChannel Power and ACLR Variable channel and adjacent/alternate channel parametersMCPR Sophisticated, flexible multi-channel power measurementsCCDF Complementary Cumulative Distribution Function plots the
statistical variations in signal level
SignalVu-PC/RSA607A keycharacteristics
Maximum span 40 MHz real-time
9 kHz - 3 GHz swept
9 kHz - 7.5 GHz swept Maximum acquisition time 1.0 sMinimum IQ resolution 17.9 ns (acquisition BW = 40 MHz)Tuning Tables Tables that present frequency selection in the form of standards-based channels are available for the following.
DPX bitmap resolution 201x801Marker information Amplitude, frequency, signal density
Datasheet
14 www.tek.com
Minimum signal duration for100% probability of detection
100 μs
Span: 40 MHz, RBW = 300 kHz (Auto)
Due to the non-deterministic execution time of programs running under the Microsoft Windows OS, this specification may not bemet when the host PC is heavily loaded with other processing tasks
Span range (continuousprocessing)
1 kHz to 40 MHz
Span range (swept) Up to maximum frequency range of instrumentDwell time per step 50 ms to 100 sTrace processing Color-graded bitmap, +Peak, -Peak, averageTrace length 801, 2401, 4001, 10401 RBW range 1 kHz to 4.99 MHz
4001 (12,000 traces)Time resolution per line 1 ms to 6400 s, user selectable
Spectrum displayTraces Three traces + 1 math trace + 1 trace from spectrogram for spectrum displayTrace functions Normal, Average (VRMS), Max Hold, Min Hold, Average of LogsDetector Average (VRMS), Average, CISPR peak, +Peak, -Peak, SampleSpectrum trace length 801, 2401, 4001, 8001,10401, 16001, 32001, and 64001 pointsRBW range 10 Hz to 8 MHz
Analog modulation analysis(standard)
AM demodulation accuracy,typical
±2%
0 dBm input at center, carrier frequency 1 GHz, 1 kHz/5 kHz input/modulated frequency, 10% to 60% modulation depth
Signal Strength displaySignal strength indicator Located at right side of displayMeasurement bandwidth Up to 40 MHz, dependent on span and RBW settingTone type Variable frequency based on received signal strength
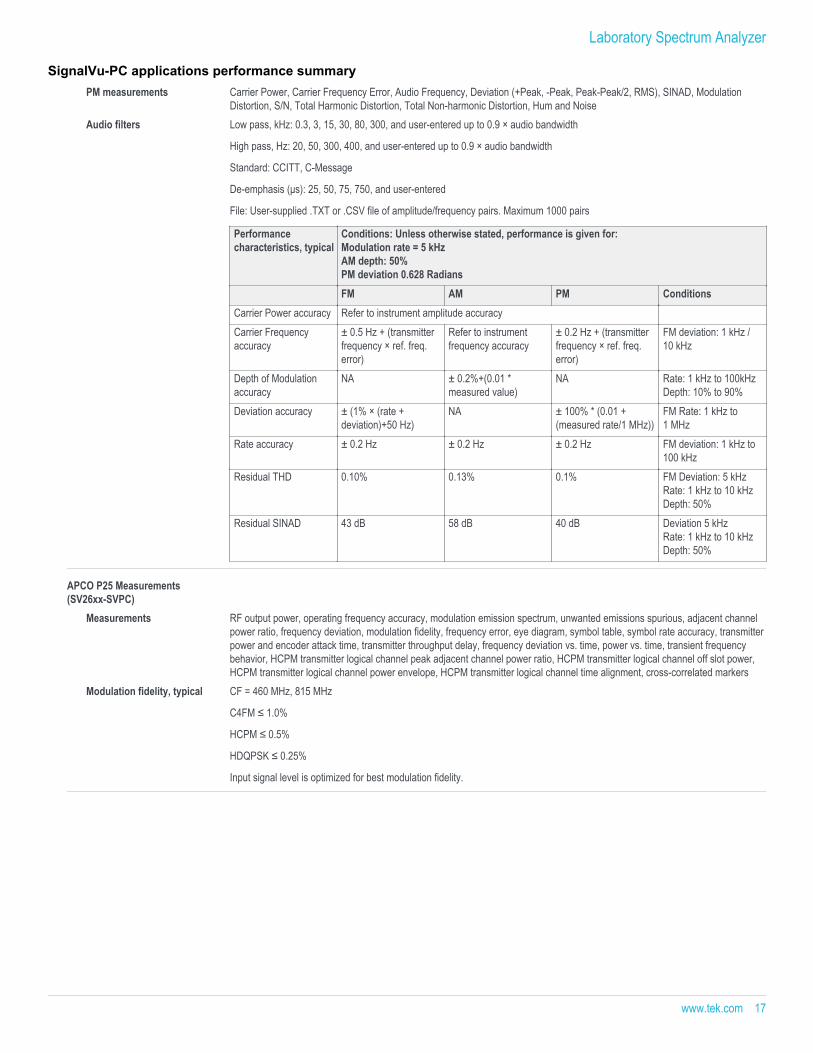
Residual THD 0.10% 0.13% 0.1% FM Deviation: 5 kHzRate: 1 kHz to 10 kHzDepth: 50%
Residual SINAD 43 dB 58 dB 40 dB Deviation 5 kHzRate: 1 kHz to 10 kHzDepth: 50%
APCO P25 Measurements(SV26xx-SVPC)
Measurements RF output power, operating frequency accuracy, modulation emission spectrum, unwanted emissions spurious, adjacent channelpower ratio, frequency deviation, modulation fidelity, frequency error, eye diagram, symbol table, symbol rate accuracy, transmitterpower and encoder attack time, transmitter throughput delay, frequency deviation vs. time, power vs. time, transient frequencybehavior, HCPM transmitter logical channel peak adjacent channel power ratio, HCPM transmitter logical channel off slot power,HCPM transmitter logical channel power envelope, HCPM transmitter logical channel time alignment, cross-correlated markers
Input signal level is optimized for best modulation fidelity.
Laboratory Spectrum Analyzer
SignalVu-PC applications performance summary
www.tek.com 17
Bluetooth Measurements (SV27xx-SVPC)
Modulation formats Basic Rate, Bluetooth Low Energy, Enhanced Data Rate - Revision 4.1.1
Packet types: DH1, DH3, DH5 (BR), Reference (LE)
Measurements Peak Power, Average Power, Adjacent Channel Power or InBand Emission mask, -20 dB Bandwidth, Frequency Error, Modulation
Characteristics including ΔF1avg (11110000), ΔF2avg (10101010), ΔF2 > 115 kHz, ΔF2/ΔF1 ratio, frequency deviation vs. timewith packet and octet level measurement information, Carrier Frequency f0, Frequency Offset (Preamble and Payload), MaxFrequency Offset, Frequency Drift f1-f0, Max Drift Rate fn-f0 and fn-fn-5, Center Frequency Offset Table and Frequency Drift table,color-coded Symbol table, Packet header decoding information, eye diagram, constellation diagram
Output power, In-bandemissions and ACP
Level uncertainty: refer to instrument amplitude and flatness specification
Analysis period Up to 81,000 samplesMeasurement filter Root Raised Cosine, Raised Cosine, Gaussian, Rectangular, IS-95 TX_MEA, IS-95 Base TXEQ_MEA, NoneReference Filter Gaussian, Raised Cosine, Rectangular, IS-95 REF, NoneFilter rolloff factor α:0.001 to 1, in 0.001 stepsMeasurements Constellation, Demod I&Q vs. Time, Error Vector Magnitude (EVM) vs. Time, Eye Diagram, Frequency Deviation vs. Time,
Magnitude Error vs. Time, Phase Error vs. Time, Signal Quality, Symbol Table, Trellis DiagramSymbol rate range 1 k symbols/s to 40 M symbols/s
Modulated signal must be contained entirely within the acquisition bandwidthAdaptive equalizer Linear, Decision-Directed, Feed-Forward (FIR) equalizer with coefficient adaptation and adjustable convergence rate. Supports
400 symbols measurement length, 20 Averages, normalization reference = maximum symbol magnitude256 QAM Residual EVM(center frequency = 2 GHz),typical
0.6 % (10 MHz symbol rate)
0.7 % (30 MHz symbol rate)
400 symbols measurement length, 20 Averages, normalization reference = maximum symbol magnitude
LTE Downlink RF measurements(SV28xx-SVPC)
Standard Supported 3GPP TS 36.141 Version 12.5 Frame Format supported FDD and TDDMeasurements and DisplaysSupported
Adjacent Channel Leakage Ratio (ACLR), Spectrum Emission Mask (SEM), Channel Power, Occupied Bandwidth, Power vs. Timeshowing Transmitter OFF power for TDD signals and LTE constellation diagram for Primary Synchronization Signal, SecondarySynchronization Signal with Cell ID, Group ID, Sector ID and Frequency Error.
ACLR with E-UTRA bands(typical, with noise correction)
1st Adjacent Channel 60 dB (RSA607A)
2nd Adjacent Channel 62 dB (RSA607A)
Mapping (MAPxx-SVPC)Supported map types Pitney Bowes MapInfo (*.mif), Bitmap (*.bmp), Open Street Maps (.osm)Saved measurement results Measurement data files (exported results)Map file used for themeasurements
Google Earth KMZ file
Recallable results files (traceand setup files)
MapInfo-compatible MIF/MID files
Pulse measurements (SVPxx-SVPC)
Measurements (nominal) Pulse-Ogram™ waterfall display of multiple segmented captures, with amplitude vs time and spectrum of each pulse. Pulsefrequency, Delta Frequency, Average on power, Peak power, Average transmitted power, Pulse width, Rise time, Fall time,Repetition interval (seconds), Repetition interval (Hz), Duty factor (%), Duty factor (ratio), Ripple (dB), Ripple (%), Droop (dB),Droop (%), Overshoot (dB), Overshoot (%), Pulse- Ref Pulse frequency difference, Pulse- Ref Pulsephase difference, Pulse- Pulsefrequency difference, Pulse- Pulse phase difference, RMS frequency error, Max frequency error, RMS phase error,Max phaseerror, Frequency deviation, Phase deviation, Impulse response (dB),Impulse response (time), Time stamp.
Minimum pulse width fordetection
150 ns
Average ON power at 18 °C to28 °C, typical
±0.3 dB + absolute amplitude accuracy
For pulses of 300 ns width or greater, duty cycles of .5 to .001, and S/N ratio ≥ 30 dBDuty factor, typical ±0.2% of reading
For pulses of 450 ns width or greater, duty cycles of .5 to .001, and S/N ratio ≥ 30 dBAverage transmitted power,typical
±0.5 dB + absolute amplitude accuracy
For pulses of 300 ns width or greater, duty cycles of .5 to .001, and S/N ratio ≥ 30 dBPeak pulse power, typical ±1.2 dB + absolute amplitude accuracy
For pulses of 300 ns width or greater, duty cycles of .5 to .001, and S/N ratio ≥ 30 dBPulse width, typical ±0.25% of reading
For pulses of 450 ns width or greater, duty cycles of .5 to .001, and S/N ratio ≥ 30 dB
Laboratory Spectrum Analyzer
SignalVu-PC applications performance summary
www.tek.com 19
Playback of recorded signals(SV56)
Playback file type R3F recorded by RSA306, RSA500, or RSA600Recorded file bandwidth 40 MHzFile playback controls General: Play, stop, exit playback
Location: Begin/end points of playback settable from 0-100%
Skip: Defined skip size from 73 μs up to 99% of file size
Live rate: Plays back at 1:1 rate to recording time
Loop control: Play once, or loop continuouslyMemory requirement Recording of signals requires storage with write rates of 300 MB/sec. Playback of recorded files at live rates requires storage with
read rates of 300 MB/sec.
WLAN Measurements, 802.11a/b/g/j/p (SV23xx-SVPC)
Measurements WLAN power vs. time; WLAN symbol table; WLAN constellation; spectrum emission mask; error vector magnitude (EVM) vs.symbol (or time), vs subcarrier (or frequency); mag error vs symbol (or time), vs. subcarrier (or frequency); phase error vs symbol(or time), vs. subcarrier (or frequency); channel frequency response vs. symbol (or time), vs. subcarrier (or frequency); spectralflatness vs. symbol (or time), vs. subcarrier (or frequency)
Input signal level optimized for best EVM, average of 20 bursts, ≥16 symbols eachResidual EVM - 802.11b,CCK-11, typical
2.4 GHz, 11 Mbps: 1.3 %
Input signal level optimized for best EVM, average of 1,000 chips, BT = .61
WLAN Measurements 802.11n(SV24xx-SVPC)
Measurements WLAN power vs. time; WLAN symbol table; WLAN constellation; spectrum emission mask; error vector magnitude (EVM) vs.symbol (or time), vs subcarrier (or frequency); mag error vs symbol (or time), vs. subcarrier (or frequency); phase error vs symbol(or time), vs. subcarrier (or frequency); channel frequency response vs. symbol (or time), vs. subcarrier (or frequency); spectralflatness vs. symbol (or time), vs. subcarrier (or frequency)
EVM performance - 802.11n,64-QAM, typical
2.4 GHz, 40 MHz BW: -38 dB
5.8 GHz, 40 MHz BW: -38 dB
Input signal level optimized for best EVM, average of 20 bursts, ≥16 symbols each
WLAN Measurements 802.11ac(SV25xx-SVPC)
Measurements WLAN power vs. time; WLAN symbol table; WLAN constellation; spectrum emission mask; error vector magnitude (EVM) vs.symbol (or time), vs subcarrier (or frequency); mag error vs symbol (or time), vs. subcarrier (or frequency); phase error vs symbol(or time), vs. subcarrier (or frequency); channel frequency response vs. symbol (or time), vs. subcarrier (or frequency); spectralflatness vs. symbol (or time), vs. subcarrier (or frequency)
EVM performance - 802.11ac,256-QAM, typical
5.8 GHz, 40 MHz BW : -38 dB
Input signal level optimized for best EVM, average of 20 bursts, ≥16 symbols each
Datasheet
SignalVu-PC applications performance summary
20 www.tek.com
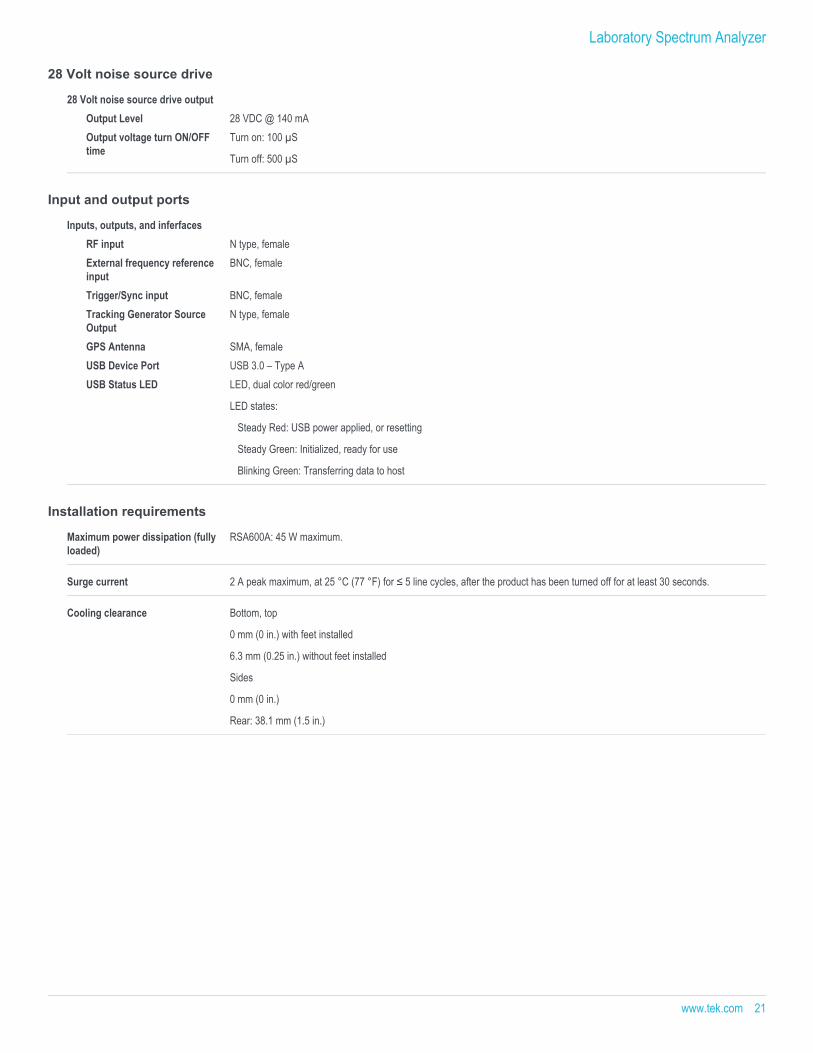
28 Volt noise source drive
28 Volt noise source drive outputOutput Level 28 VDC @ 140 mAOutput voltage turn ON/OFFtime
Turn on: 100 µS
Turn off: 500 µS
Input and output ports
Inputs, outputs, and inferfacesRF input N type, femaleExternal frequency referenceinput
ShockOperating Test method per Military Standard MIL-PRF-28800F 1-4 Non-Operating Exceeds the requirements of Military Standard MIL-PRF-28800F
Handling and transitBench handling, operating MIL-PRF-28800F Class 3 Transit drop, non-operating MIL-PRF-28800F Class 2
Datasheet
22 www.tek.com
Ordering information
ModelsRSA600A Series USB Spectrum Analyzer, 40 MHz acquisition bandwidth.
The RSA600 requires a PC with Windows 7, Windows 8/8.1, or Windows 10, 64-bit operating system. A USB 3.0 connection isrequired for operation of the RSA600. 8 GB RAM and 20 GB free drive space is required for installation of SignalVu-PC. For fullperformance of the real time features of the RSA600, an Intel Core i7 4th generation processor is required. Processors of lowerperformance can be used, with reduced real-time performance. Storage of streaming data requires that the PC be equipped with adrive capable of streaming storage rates of 300 MB/sec.
Includes: USB 3.0 cable (2 M), A-A connection, screw lock, quick-start manual (printed), connector covers, power cord, (seepower plug options), USB memory device with SignalVu-PC, API and documentation files.
Item DescriptionRSA603A USB real time spectrum analyzer, 9 kHz – 3.0 GHz, 40 MHz acquisition bandwidthOption 04 Tracking generator, 10 MHz – 3.0 GHzRSA607A USB real time spectrum analyzer, 9 kHz – 7.5 GHz, 40 MHz acquisition bandwidthOption 04 Tracking generator, 10 MHz – 7.5 GHzRSA5600RACK Rackmount, RSA500 and RSA600 Series. Holds 1 RSA500A or 2 RSA600A models
Options
RSA600A power plug options
Opt. A0 North America power plug (115 V, 60 Hz)
Opt. A1 Universal Euro power plug (220 V, 50 Hz)
Opt. A2 United Kingdom power plug (240 V, 50 Hz)
Opt. A3 Australia power plug (240 V, 50 Hz)
Opt. A4 North America power plug (240 V, 50 Hz)
Opt. A5 Switzerland power plug (220 V, 50 Hz)
Opt. A6 Japan power plug (100 V, 50/60 Hz)
Opt. A10 China power plug (50 Hz)
Opt. A11 India power plug (50 Hz)
Opt. A12 Brazil power plug (60 Hz)
Opt. A99 No power cord
RSA600A language options
Opt. L0 English manual
Opt. L1 French manual
Opt. L2 Italian manual
Opt. L3 German manual
Opt. L4 Spanish manual
Opt. L5 Japanese manual
Laboratory Spectrum Analyzer
www.tek.com 23
Opt. L6 Portuguese manual
Opt. L7 Simplified Chinese manual
Opt. L8 Traditional Chinese manual
Opt. L9 Korean manual
Opt. L10 Russian manual
Opt. L99 No manual
RSA600A service options
Opt. C3 Calibration Service 3 Years
Opt. C5 Calibration Service 5 Years
Opt. D1 Calibration Data Report
Opt. D3 Calibration Data Report 3 Years (with Opt. C3)
Opt. D5 Calibration Data Report 5 Years (with Opt. C5)
Opt. R5 Repair Service 5 Years (including warranty)
WarrantyRSA600 series warranty: 3 years.
FZ-G1 tablet: 3-year warranty with Business Class Support (provided by Panasonic in region of purchase).
Datasheet
24 www.tek.com
Tablet
Tablet controller available A tablet controller intended for portable applications using the Tektronix RSA306B and RSA500A series spectrum analyzers canalso be used with the RSA600A series. The Panasonic ToughPad FZ-G1 is available in limited geographies from Tektronix asshown in the ordering information below.
Item Description Regional availabilityFZ-G1-N Controller for USB Spectrum Analyzers,
Panasonic ToughPad FZ-G1. Includes tablet,battery, digitizer pen and tether, battery chargerwith power cord.
Canada, Columbia, Ecuador, Mexico, Philippines,Singapore, United States
FZ-G1F Controller for USB Spectrum Analyzers,Panasonic ToughPad FZ-G1. Includes tablet,digitizer pen and tether, battery charger with powercord
China
FZ-G1-I Controller for USB Spectrum Analyzers,Panasonic ToughPad FZ-G1. Includes tablet,battery, digitizer pen and tether, battery chargerwith power cord
India
FZ-G1-E Controller for USB Spectrum Analyzers,Panasonic ToughPad FZ-G1. Includes tablet,battery, digitizer pen and tether, battery chargerwith power cord.
FZ-G1-U Controller for USB Spectrum Analyzers,Panasonic ToughPad FZ-G1. Includes tablet,battery, digitizer pen and tether, battery chargerwith power cord.
Egypt, Kenya, Malaysia, United Kingdom
FZ-G1-B Controller for USB Spectrum Analyzers,Panasonic ToughPad FZ-G1. Includes tablet,battery, digitizer pen and tether, battery chargerwith power cord
Brazil
FZ-G1-J Controller for USB Spectrum Analyzers,Panasonic ToughPad FZ-G1. Includes tablet,battery, digitizer pen and tether, battery chargerwith power cord
Japan
Panasonic FZ-G1 accessories Item DescriptionFZ-VZSU84U 6 Li-ion battery, standard capacityFZ-VZSU88U 6 Long-life battery pack for Panasonic ToughPad FZ-G1FZ-BNDLG1BATCHRG9 Single battery charger bundle for FZ-G1. 1 charger and 1 adapterCF-LNDDC1209 Lind 120 W 12-32 Volt input vehicle adapter for Tough Pad and RSA500ATBCG1AONL-P Panasonic Toughmate always on case for FZ-G1TBCG1XSTP-P Infocase Toughmate X-strap for Panasonic FZ-G1
6 Not available in China, Hong Kong, Macau or Mongolia
Laboratory Spectrum Analyzer
www.tek.com 25
Licenses
SignalVu-PC application-specific modules
Application license DescriptionSVANL-SVPC AM/FM/PM/Direct Audio Analysis - Node Locked LicenseSVAFL-SVPC AM/FM/PM/Direct Audio Analysis - Floating LicenseSVTNL-SVPC Settling Time (frequency and phase) measurements - Node Locked LicenseSVTFL-SVPC Settling Time (frequency and phase) measurements - Floating LicenseSVMNL-SVPC General Purpose Modulation Analysis to work with analyzer of acquisition bandwidth <= 40 MHz or MDO - Node Locked LicenseSVMFL-SVPC General Purpose Modulation Analysis to work with analyzer of acquisition bandwidth <= 40 MHz or MDO- Floating LicenseSVPNL-SVPC Pulse Analysis to work with analyzer of acquisition bandwidth <= 40 MHz or MDO - Node Locked LicenseSVPFL-SVPC Pulse Analysis to work with analyzer of acquisition bandwidth <= 40 MHz or MDO- Floating LicenseSVONL-SVPC Flexible OFDM Analysis - Node Locked LicenseSVOFL-SVPC Flexible OFDM Analysis - Floating LicenseSV23NL-SVPC WLAN 802.11a/b/g/j/p measurement - Node Locked LicenseSV23FL-SVPC WLAN 802.11a/b/g/j/p measurement - Floating LicenseSV24NL-SVPC WLAN 802.11n measurement (requires SV23) - Node Locked LicenseSV24FL-SVPC WLAN 802.11n measurement (requires SV23) - Floating LicenseSV25NL-SVPC WLAN 802.11ac measurement to work with analyzer of acquisition bandwidth <= 40 MHz (requires SV23 and SV24) or MDO -
Node Locked LicenseSV25FL-SVPC WLAN 802.11ac measurement to work with analyzer of acquisition bandwidth <= 40 MHz (requires SV23 and SV24) or MDO -
Floating LicenseSV26NL-SVPC APCO P25 measurement - Node Locked LicenseSV26FL-SVPC APCO P25 measurement - Floating LicenseSV27NL-SVPC Bluetooth measurement to work with analyzer of acquisition bandwidth <= 40 MHz or MDO - Node Locked LicenseSV27FL-SVPC Bluetooth measurement to work with analyzer of acquisition bandwidth <= 40 MHz or MDO- Floating LicenseMAPNL-SVPC Mapping - Node Locked LicenseMAPFL-SVPC Mapping - Floating LicenseSV56NL-SVPC Playback of recorded files - Node Locked LicenseSV56FL-SVPC Playback of recorded files - Floating LicenseSV60NL-SVPC Return loss, VSWR, cable loss, and distance to fault - Node Locked LicenseSV60FL-SVPC Return loss, VSWR, cable loss, and distance to fault - Floating LicenseCONNL-SVPC SignalVu-PC live link to the MDO4000B series mixed-domain oscilloscopes - Node Locked LicenseCONFL-SVPC SignalVu-PC live link to the MDO4000B series mixed-domain oscilloscopes - Floating LicenseSV2CNL-SVPC WLAN 802.11a/b/g/j/p/n/ac and live link to MDO4000B to work with analyzer of acquisition bandwidth <= 40 MHz - Node Locked
LicenseSV2CFL-SVPC WLAN 802.11a/b/g/j/p/n/ac and live link to MDO4000B to work with analyzer of acquisition bandwidth <= 40 MHz - Floating
LicenseSV28NL-SVPC LTE Downlink RF measurement to work with analyzer of acquisition bandwidth <= 40 MHz or MDO - Node Locked LicenseSV28FL-SVPC LTE Downlink RF measurement to work with analyzer of acquisition bandwidth <= 40 MHz or MDO - Floating LicenseSV54NL-SVPC Signal survey and classification - Node Locked LicenseSV54FL-SVPC Signal survey and classification - Floating LicenseSV60NL-SVPC Return loss, distance to fault, VSWR, cable loss - Node Locked License (requires Option 04 on RSA500A/600A)SV60FL-SVPC Return loss, distance to fault, VSWR, cable loss - Floating License (requires Option 04 on RSA500A/600A)SV30NL-SVPC WiGig 802.11ad measurements - Node Locked License
Datasheet
26 www.tek.com
Application license DescriptionSV30FL-SVPC WiGig 802.11ad measurements - Floating LicenseEDUFL-SVPC Education-only version of all modules for SignalVu-PC - Floating License
Recommended accessoriesTektronix offers a wide variety of adapters, attenuators, cables, impedance converters, antennas and other accessories for the RSA600 series.
General purpose RF cables
012-1738-00 Cable,50 Ω, 40 inch,type-N(m) to type-N(M)
012-0482-00 Cable, 50 Ω, BNC (m) 3 foot (91 cm)
Adapters
103-0045-00 Adapter, coaxial, 50 Ω type-N(m) to type-BNC(f)
013-0410-00 Adapter, coaxial, 50 Ω type-N (f) to type-N (f)
013-0411-00 Adapter, coaxial, 50 Ω type-N (m) to type-N (f)
013-0412-00 Adapter, coaxial, 50 Ω, type-N(m) to type-N(m)
013-0402-00 Adapter, coaxial, 50 Ω type-N (m) to type-N 7/16(m)
013-0404-00 Adapter, coaxial, 50 Ω type-N(m) to type-7/16 (f)
013-0403-00 Adapter, coaxial, 50 Ω type-N(m) to type DIN 9.5(m)
013-0405-00 Adapter, coaxial, 50 Ω type-N(m) to type-DIN 9.5(f)
013-0406-00 Adapter, coaxial, 50 Ω type-N(m) to type-SMA(f)
013-0407-00 Adapter, coaxial, 50 Ω type-N(m) to type-SMA(m)
013-0408-00 Adapter, coaxial, 50 Ω type-N(m) to type-TNC(f)
013-0409-00 Adapter, coaxial, 50 Ω type-N(m) to type-TNC(m)
119-7246-00 Pre-filter, general purpose, 824 MHz to 2500 MHz, type-N (f) connector
Laboratory Spectrum Analyzer
www.tek.com 27
119-7426 Pre-filter, general purpose, 2400 MHz to 6200 MHz, type-N (f) connector
119-4146-00 EMCO E/H-field probes
E/H field probes, lower costalternative
Available from Beehive http://beehive-electronics.com/
RSA-DKIT RSA Version 3 demo board with N-BNC adapter, case, antenna, instructions
011-0227-00 Bias-T, type N(m) RF, type N(f) RF+DC, BNC(f) Bias, 1 W, 0.5 A, 2.5 MHz-6 GHz
Chargers, Additional batteries,Cables, Cases
WFMBA200 Replacement battery pack for RSA500A series
WFMBC200 External battery charger for WFMBA200, charges two batteries
CF-LNDDC120 Lind 120 W 12-32 Volt input vehicle adapter for RSA500A series and Panasonic Tough Pad (not available in China)
016-2109-01 Additional soft carry-case with shoulder strap
174-6810-00 Additional USB 3.0 cable (2 M), A-A connection, screw lock
Tracking generator accessoriesA variety of calibration kits and phase-stabilized cables are available for the RSA600 tracking generator when used with the optional cable and antenna measurementssoftware.
CALOSLNM Calibration kit, 3-in-1, open, short, load, DC to 6 GHz, Type-N(m), 50 ohm
CALOSLNF Calibration kit, 3-in-1, open, short, load, DC to 6 GHz, Type-N(f), 50 ohm
CALOSLNF Calibration kit, 3-in-1, open, short, load, DC to 6 GHz, 7/16 DIN(m)
CALOSL716F Calibration kit, 3-in-1, open, short, load, DC to 6 GHz, 7/16 DIN(f)
012-1745-00 Cable, rugged, phase-stable, type-N (m) to type-N (f), 5 ft or 1.5 m
012-1746-00 Cable, rugged, phase-stable, type-N(m) to type-N(f), 3.28 ft or 1 m
012-1747-00 Cable, rugged, phase-stable, type-N(m) to 7/16(f), 60 cm (23.6 in.)
Datasheet
28 www.tek.com
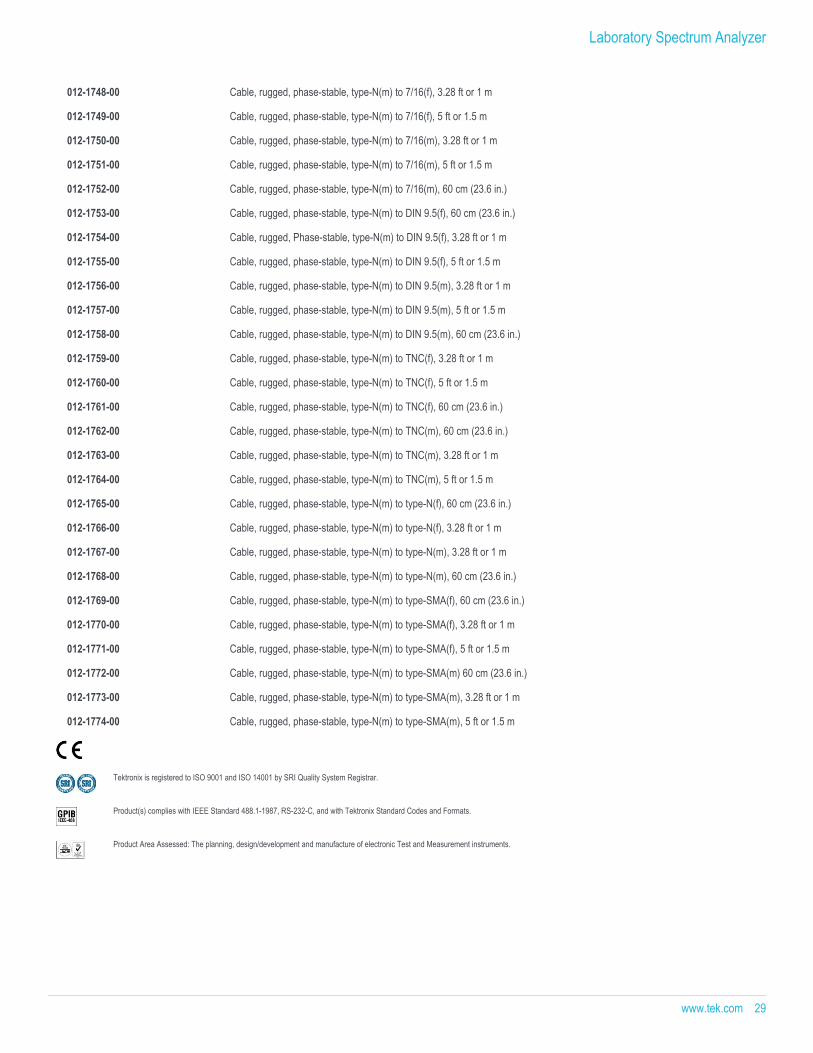
012-1748-00 Cable, rugged, phase-stable, type-N(m) to 7/16(f), 3.28 ft or 1 m
012-1749-00 Cable, rugged, phase-stable, type-N(m) to 7/16(f), 5 ft or 1.5 m
012-1750-00 Cable, rugged, phase-stable, type-N(m) to 7/16(m), 3.28 ft or 1 m
012-1751-00 Cable, rugged, phase-stable, type-N(m) to 7/16(m), 5 ft or 1.5 m
012-1752-00 Cable, rugged, phase-stable, type-N(m) to 7/16(m), 60 cm (23.6 in.)
012-1753-00 Cable, rugged, phase-stable, type-N(m) to DIN 9.5(f), 60 cm (23.6 in.)
012-1754-00 Cable, rugged, Phase-stable, type-N(m) to DIN 9.5(f), 3.28 ft or 1 m
012-1755-00 Cable, rugged, phase-stable, type-N(m) to DIN 9.5(f), 5 ft or 1.5 m
012-1756-00 Cable, rugged, phase-stable, type-N(m) to DIN 9.5(m), 3.28 ft or 1 m
012-1757-00 Cable, rugged, phase-stable, type-N(m) to DIN 9.5(m), 5 ft or 1.5 m
012-1758-00 Cable, rugged, phase-stable, type-N(m) to DIN 9.5(m), 60 cm (23.6 in.)
012-1759-00 Cable, rugged, phase-stable, type-N(m) to TNC(f), 3.28 ft or 1 m
012-1760-00 Cable, rugged, phase-stable, type-N(m) to TNC(f), 5 ft or 1.5 m
012-1761-00 Cable, rugged, phase-stable, type-N(m) to TNC(f), 60 cm (23.6 in.)
012-1762-00 Cable, rugged, phase-stable, type-N(m) to TNC(m), 60 cm (23.6 in.)
012-1763-00 Cable, rugged, phase-stable, type-N(m) to TNC(m), 3.28 ft or 1 m
012-1764-00 Cable, rugged, phase-stable, type-N(m) to TNC(m), 5 ft or 1.5 m
012-1765-00 Cable, rugged, phase-stable, type-N(m) to type-N(f), 60 cm (23.6 in.)
012-1766-00 Cable, rugged, phase-stable, type-N(m) to type-N(f), 3.28 ft or 1 m
012-1767-00 Cable, rugged, phase-stable, type-N(m) to type-N(m), 3.28 ft or 1 m
012-1768-00 Cable, rugged, phase-stable, type-N(m) to type-N(m), 60 cm (23.6 in.)
012-1769-00 Cable, rugged, phase-stable, type-N(m) to type-SMA(f), 60 cm (23.6 in.)
012-1770-00 Cable, rugged, phase-stable, type-N(m) to type-SMA(f), 3.28 ft or 1 m
012-1771-00 Cable, rugged, phase-stable, type-N(m) to type-SMA(f), 5 ft or 1.5 m
012-1772-00 Cable, rugged, phase-stable, type-N(m) to type-SMA(m) 60 cm (23.6 in.)
012-1773-00 Cable, rugged, phase-stable, type-N(m) to type-SMA(m), 3.28 ft or 1 m
012-1774-00 Cable, rugged, phase-stable, type-N(m) to type-SMA(m), 5 ft or 1.5 m
Tektronix is registered to ISO 9001 and ISO 14001 by SRI Quality System Registrar.
Product(s) complies with IEEE Standard 488.1-1987, RS-232-C, and with Tektronix Standard Codes and Formats.
Product Area Assessed: The planning, design/development and manufacture of electronic Test and Measurement instruments.
Laboratory Spectrum Analyzer
www.tek.com 29
Datasheet
ASEAN / Australasia (65) 6356 3900 Austria 00800 2255 4835* Balkans, Israel, South Africa and other ISE Countries +41 52 675 3777 Belgium 00800 2255 4835* Brazil +55 (11) 3759 7627 Canada 1 800 833 9200 Central East Europe and the Baltics +41 52 675 3777 Central Europe & Greece +41 52 675 3777 Denmark +45 80 88 1401 Finland +41 52 675 3777 France 00800 2255 4835* Germany 00800 2255 4835*Hong Kong 400 820 5835 India 000 800 650 1835 Italy 00800 2255 4835*Japan 81 (3) 6714 3086 Luxembourg +41 52 675 3777 Mexico, Central/South America & Caribbean 52 (55) 56 04 50 90 Middle East, Asia, and North Africa +41 52 675 3777 The Netherlands 00800 2255 4835* Norway 800 16098 People's Republic of China 400 820 5835 Poland +41 52 675 3777 Portugal 80 08 12370 Republic of Korea +822 6917 5084, 822 6917 5080 Russia & CIS +7 (495) 6647564 South Africa +41 52 675 3777 Spain 00800 2255 4835* Sweden 00800 2255 4835* Switzerland 00800 2255 4835*Taiwan 886 (2) 2656 6688 United Kingdom & Ireland 00800 2255 4835* USA 1 800 833 9200
* European toll-free number. If not accessible, call: +41 52 675 3777
For Further Information. Tektronix maintains a comprehensive, constantly expanding collection of application notes, technical briefs and other resources to help engineers working on the cutting edge of technology. Please visit www.tek.com.