Page 1
Resource
SPED Light Sheet Microscopy: Fast Mapping of
Biological System Structure and Function
Graphical Abstract
Highlights
d Light sheet microscopy speed is increased by extending the
detection depth of field
d A simple, scalable method is developed for extending the
axial point spread function
d Rapid, cellular-resolution nervous system mapping across
the entire larval zebrafish
d Fast automated identification of co-active neurons across
the nervous system
Tomer et al., 2015, Cell 163, 1796–1806December 17, 2015 ª2015 Elsevier Inc.http://dx.doi.org/10.1016/j.cell.2015.11.061
Authors
Raju Tomer, Matthew Lovett-Barron,
IsaacKauvar, ...,MichaelBroxton,Samuel
Yang, Karl Deisseroth
[email protected]
In Brief
By harnessing optical mechanisms that
normally result in unwanted spherical
aberrations, SPED light sheetmicroscopy
allows high-speed mapping of biological
structures such as the entire vertebrate
nervous system and its activity at a
cellular resolution.
Page 2
Resource
SPED Light Sheet Microscopy:Fast Mapping of Biological SystemStructure and FunctionRaju Tomer,1,2 Matthew Lovett-Barron,1,2 Isaac Kauvar,2,3 Aaron Andalman,1,2 Vanessa M. Burns,2,4
Sethuraman Sankaran,2 Logan Grosenick,2 Michael Broxton,5 Samuel Yang,2,3 and Karl Deisseroth1,2,6,7,*1Department of Bioengineering2CNC Program3Department of Electrical Engineering4Department of Chemical and Systems Biology5Department of Computer Science6Howard Hughes Medical Institute7Department of Psychiatry and Behavioral Sciences
Stanford University, Stanford, CA 94305, USA
*Correspondence: [email protected]
http://dx.doi.org/10.1016/j.cell.2015.11.061
SUMMARY
The goal of understanding living nervous systemshas driven interest in high-speed and large field-of-view volumetric imaging at cellular resolution. Lightsheet microscopy approaches have emerged forcellular-resolution functional brain imaging in smallorganisms such as larval zebrafish, but remainfundamentally limited in speed. Here, we have devel-oped SPED light sheet microscopy, which combineslarge volumetric field-of-view via an extended depthof field with the optical sectioning of light sheet mi-croscopy, thereby eliminating the need to physicallyscan detection objectives for volumetric imaging.SPED enables scanning of thousands of volumes-per-second, limited only by camera acquisitionrate, through the harnessing of optical mechanismsthat normally result in unwanted spherical aberra-tions. We demonstrate capabilities of SPED micro-scopy by performing fast sub-cellular resolutionimaging of CLARITY mouse brains and cellular-reso-lution volumetric Ca2+ imaging of entire zebrafishnervous systems. Together, SPED light sheetmethods enable high-speed cellular-resolution volu-metric mapping of biological system structure andfunction.
INTRODUCTION
Mapping cellular activity across entire vertebrate nervous sys-
tems at high spatiotemporal resolution is a methodology with
the potential to substantially advance our understanding of the
neural mechanisms driving behavior, including sensation, action,
internal states, and cognition. Electrophysiological approaches
have generated critical insights into nervous system function,
1796 Cell 163, 1796–1806, December 17, 2015 ª2015 Elsevier Inc.
but thesemethods are generally limited in the number of neurons
that can be recorded simultaneously. The development of ge-
netic tools for optical observation (Chen et al., 2013) and inter-
vention (Deisseroth, 2015) of neuronal activity have expanded
the spatial extent of neural circuits that can be studied, allowing
for analysis of information exchange within large ensembles of
active neurons in intact, behaving animals. In order to capitalize
on this ability to address large neural populations in intact ner-
vous systems, high-speed and high-resolution volumetric imag-
ing methods will be required to interact with the intact volumes
over large fields-of-view. The approach of light sheet micro-
scopy (LSM; Stelzer, 2015) has emerged as a useful platform
for meeting these goals, and has already been used for func-
tional neural imaging of ex vivo mouse vomeronasal organ (Hole-
kamp et al., 2008), portions of mouse neocortex (Bouchard et al.,
2015), and the entirety of small larval nervous systems of
Drosophila (Chhetri et al., 2015; Lemon et al., 2015) and the
larval zebrafish brain (Ahrens et al., 2013; Chhetri et al., 2015;
Freeman et al., 2014; Panier et al., 2013; Vladimirov et al.,
2014) at up to 1–3 volumes per second. Introduced more than
100 years ago (Siedentopf and Zsigmondy, 1903), LSM has
seen a revival in interest over the last two decades with success-
ful applications to neural activity mapping (Freeman, 2015; Keller
et al., 2015), developmental biology (Huisken et al., 2004; Keller
et al., 2008; Preibisch et al., 2010; Reynaud et al., 2015;Wu et al.,
2013), cell biology (Gao et al., 2012; Planchon et al., 2011), and
high-resolution whole-brain neuroanatomy (Lerner et al., 2015;
Tomer et al., 2014).
The essential idea of LSM involves illumination of a sample
with a thin sheet of light and detection of the emitted signal
with an orthogonally arranged wide-field detection arm. Critical
for in vivo imaging applications, this configuration limits photo-
bleaching and toxicity by minimizing the energy load of the exci-
tation light on the sample and allows for fast imaging by simulta-
neous sampling of an entire plane that can be visualized with
modern sCMOS or CCD cameras. Volumetric data can be ac-
quired this way by either scanning the sample through a sta-
tionary light sheet/detection objective, or by moving the light
Page 3
sheet/objective synchronously to scan a stationary sample. The
latter mode allows fast volumetric imaging and has been suc-
cessfully used for functional imaging experiments (Ahrens
et al., 2013; Holekamp et al., 2008). However, the volumetric
imaging speed of this approach is fundamentally limited by the
requirement to move heavy detection objectives, which are
mounted on piezo motors with range of motion limited to a few
hundred microns. Several distinct approaches are under explo-
ration to address this limitation. Huisken and colleagues (Fahr-
bach et al., 2013) used electrically tunable lenses to move the
focal plane of the stationary detection objective without physi-
cally moving the objective itself. Hillman and colleagues devised
an approach (Bouchard et al., 2015), building upon oblique plane
microscopy (Dunsby, 2008), to generate an oblique light sheet
through the detection objective itself, which is then swept
through the sample for volumetric imaging. Both of these ap-
proaches improve imaging speed but suffer from optical artifacts
(especially beyond the native focal plane or point), are generally
restricted to small sample depths, and require complex instru-
mentation and alignment procedures.
Here, we introduce a conceptually distinct microscopy
approach, SPED (SPherical-aberration-assisted Extended
Depth-of-field) light sheet microscopy, which turns spherical ab-
erration into an advantage by combining the large volumetric
field of view of an extended depth of field with the optical
sectioning of light sheet microscopy, thereby eliminating the
need to physically scan the detection objective for volumetric
imaging while maintaining spatial resolution. At the core of
SPED light sheet microscopy is a unique and scalable method
for extending the depth of field, by building upon the optical
mechanisms that induce spherical aberrations. An image volume
is acquired by scanning the light sheet only (using galvanometer
scanners) rather than the specimen or objective, thus providing
the capability to scan several thousands of volumes in a second:
imaging speed is therefore only limited by the camera rate of
acquisition of illuminated planes. We demonstrate the capability
of SPED light sheet microscopy by imaging 1-mm-thick
CLARITY (Chung et al., 2013; Tomer et al., 2014) mouse brain
samples at sub-cellular resolution, and by recording neural activ-
ity across the entire brain or nervous system (including the full
spinal cord) of 10 days post-fertilization (dpf) larval zebrafish at
12 volumes per second and >6 volumes per second, respec-
tively. The resulting datasets were readily adapted to automated
standard image segmentation and quantitative analysis pipe-
lines, demonstrating fast and practical cellular resolution capa-
bility across intact vertebrate nervous systems.
RESULTS
SPED Light Sheet MicroscopyWe combined extension of depth-of-field with the optical
sectioning of LSM to develop SPED light sheet microscopy (Fig-
ures 1, 2, and S1). An important feature of LSM is that the final
system point spread function (PSF) is the intersection of light
sheet thickness and detection objective PSF (Figure 1A); the
lateral resolution is thus determined by detection objective nu-
merical aperture (NA), and the axial resolution by light sheet
thickness. We hypothesized that by extending the axial extent
C
of the detection PSF (i.e., the depth of field), while maintaining
the lateral extent (i.e., x-y resolution), we could perform high-res-
olution and high-speed volumetric imaging by only scanning a
thin light sheet in the z axis, while bypassing the relatively slow
process of synchronously moving the heavy detection objective
with a piezo motor.
To implement this approach, we first sought to design a scal-
able method for extending the depth of field of an objective used
to image a large intact tissue volume. Several related methods
exist, including the use of a cubic phase mask (Quirin et al.,
2014; Quirin et al., 2013) behind the detection objective. This
method extends the axial extent of the PSF by a few hundred mi-
crons, but the elongated PSF suffers from non-linear bending;
the resulting images are thus not ideally suited to fast, quantita-
tive imaging over large volumes. In addition, for practical appli-
cations this method requires specialized deconvolution and
complex optical alignment procedures. Therefore, we set out
to develop a unique and simple method that would preserve
lateral resolution, and would also be scalable to match the large
range of imaging depths required by different experimental
needs. Building upon the observation that spherical aberration
in optical systems often results in PSF elongation, we devised
a simple and robust strategy to use a thick block of altered
refractive index material (beyond the design specifications of
the objective), between the objective and sample, thereby intro-
ducing a large yet uniform spherical aberration (Figure 1A). We
predicted that this approach could extend the depth-of-field by
orders of magnitude while largely maintaining lateral extent of
the PSF (Figure S1), since peripheral rays will travel a longer dis-
tance in the higher refractive index material compared to central
rays, and thus will focus on different points along the axis, result-
ing in an elongated PSF (Figure S1).
We tested this idea across four different objectives spanning a
broad range of specifications: (i) 43, 0.28 NA, 29.5 mm working
distance (WD), air + 5 mm water; (ii) 103, 0.25 NA, 21 mm WD,
air; (iii) 103, 0.3 NA, 17 mm WD, air; and (iv) 203, 0.4 NA,
11 mm WD. The WD of the objectives (i.e., the space between
the objective and the sample) was filled with a column of liquid
with a refractive index of 1.454 (Figures 1A and 2B; Experimental
Procedures). As shown in Figure 1B andMovie S1, this approach
yielded substantial PSF elongation, compared to the native PSF
of each objective in air, while maintaining the lateral extent of the
PSF (note that the 43/0.28 NA objective is designed for air and
5 mm of water column; therefore, the measured PSF in air alone,
shown in Figure 1B, has spherical aberrations as expected.) Fig-
ure 1C shows quantification of the elongated PSFs showing that
the lateral extent remains largely unchanged (top) and that
several hundred microns of the elongated PSFs are usable for
volumetric imaging (Figure 1C, bottom).
Next, we sought to identify and assess the crucial factors that
can be tuned to generate a desired depth of PSF. For this we
modeled the SPED system and performed simulations to char-
acterize the relevant parameters (see Figure S2 and Experi-
mental Procedures for Zemax modeling and simulation details).
As summarized in Figure 1D and Figures S2B–S2D PSF elonga-
tion is dependent on three parameters of the system: thickness
of the refractive index block, the refractive index of the block,
and the NA of the detection objective. We found that an increase
ell 163, 1796–1806, December 17, 2015 ª2015 Elsevier Inc. 1797
Page 4
A
B
C D
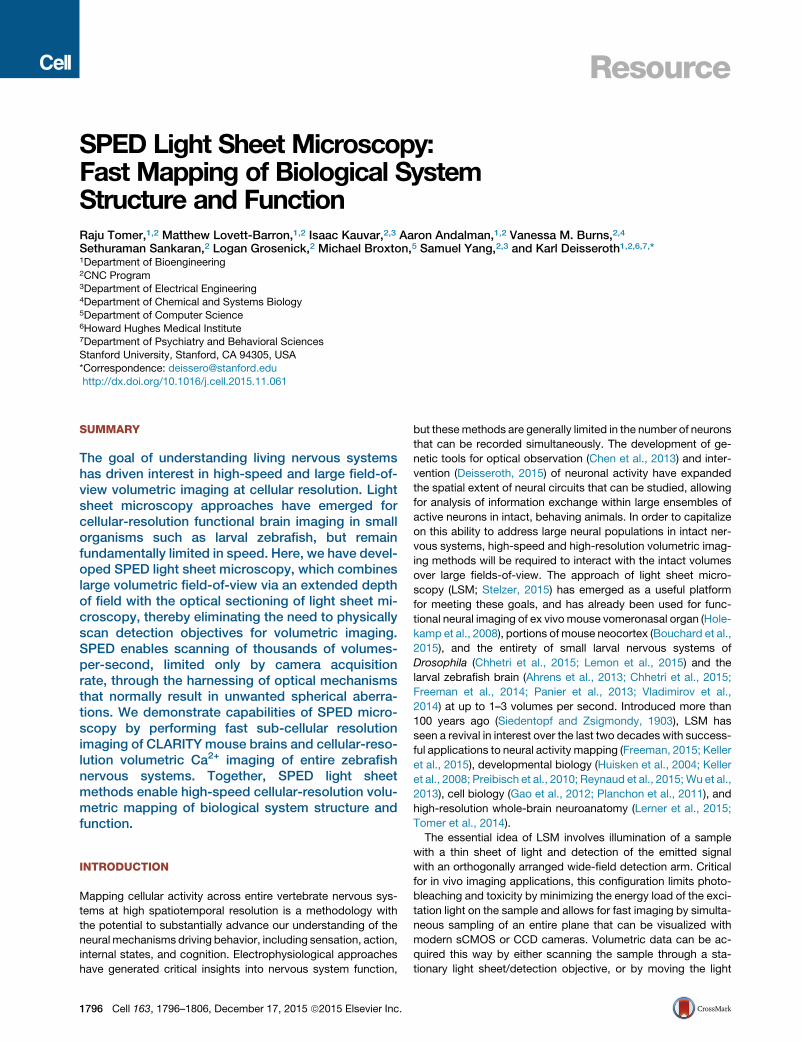
Figure 1. SPherical-Aberration-Assisted Ex-
tended Depth-of-Field Light Sheet Microscopy
(A) SPED light sheet concept compared with standard
light sheet microscopy (left). In standard light sheet
scanning (left), the light sheet and the detection
objective are moved synchronously to acquire a
3-dimensional volume. The detection objective is
typically mounted on a piezo motor for synchronous z
scanning. This design limits the speed of imaging (1–3
volumes per second) because of the mass of the
objective and also limits the depth coverage to the
piezo travel range (typically a few hundred microns).
SPED light sheet scanning (middle) combines a
greatly extended depth of field with the optical
sectioning of light sheet to provide the capacity to
scan thousands of volumes per second. A simple and
scalable new method (right) was developed to extend
the PSF by orders of magnitude. The method involves
placing of a block of higher (or lower) refractive index
(nb) material between the objective and the sample to
induce spherical aberrations that elongate the PSF.
t, thickness of the block.
(B) A comparison of the native PSF of an objective
(measured in air) with the elongated PSF, for four
different objectives: Olympus 203/0.4NA/12mmWD/
Air, Nikon 103/0.3NA/16 mm WD/Air, Olympus 103/
0.25NA/21 mm WD/Air and Olympus 43/0.28NA/
29.5 mm WD/Air + Water (5 mm). The 3D SPED light
sheet empirical PSFmeasurements for each objective
were obtained (Experimental Procedures) by scan-
ning 1 mm-diameter beads and the light sheet syn-
chronously (thus maintaining the uniform illumination
of beads) along the z axis, while keeping the detection
objective stationary. Individual bead images (n > = 5)
were manually extracted from the 3D image volume to
generate the final average PSFs. A block of refractive
index (1.454) liquid was used to span the entire
available working distance of the objective (see Fig-
ure S1 for further details).
(C) Characterization of PSF elongation. Top graph
plots the fold change in lateral full width at half-
maximum (FWHM) of the PSF as function of z position
relative to the minimum FWHM of the non-extended
air PSF of the same objective. The distribution shows
that the lateral extent of the PSF (i.e., lateral resolution)
remains largely unchanged for several hundred
microns. Note: 43/ 0.28 NA objective is designed for air and 5-mm-thick water layer, because of which the PSFmeasured in air shows aberrations. Bottom graph
plots the maximum intensity of the PSF as a function of depth.
(D) Simulations of the SPEDmicroscope were performed to assess the effect of the SPED-LS system parameters: Refractive Index (RI) of the block, its thickness
(t) and the NA of the detection objective used. The PSF elongation increases rapidly and reaches saturation with increasing RI of the block, increases linearly with
the RI block thickness and increases non-linearly with the increasing NA of the detection objective used. See also Figures S1 and S2 and Movie S1 for details of
SPED-LS implementation and PSF simulations.
in the refractive index of the block gives rise to non-linear elonga-
tion that saturates as the refractive index approaches 1.7 (Fig-
ure S2B). The PSF also can be elongated linearly by increasing
the block thickness, the maximum of which is dictated by the
WD of the objective (Figure S2C). Finally, an increase in the NA
of the detection objective gives rise to a large non-linear elonga-
tion (Figure S2D). These results generally were consistent with
measured experimental PSFs for the four different objectives,
indicating that this framework can serve as a resource for
choosing objectives with desired PSF properties and for
customizing objectives to induce spherical aberrations.
1798 Cell 163, 1796–1806, December 17, 2015 ª2015 Elsevier Inc.
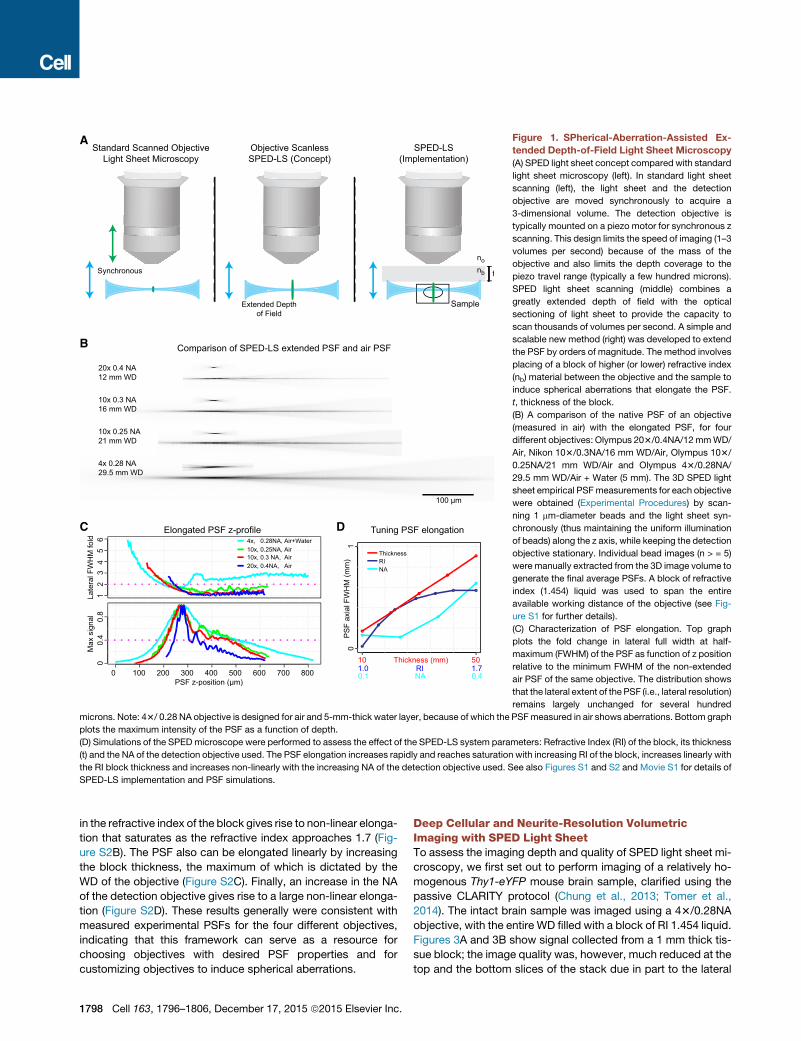
Deep Cellular and Neurite-Resolution VolumetricImaging with SPED Light SheetTo assess the imaging depth and quality of SPED light sheet mi-
croscopy, we first set out to perform imaging of a relatively ho-
mogenous Thy1-eYFP mouse brain sample, clarified using the
passive CLARITY protocol (Chung et al., 2013; Tomer et al.,
2014). The intact brain sample was imaged using a 43/0.28NA
objective, with the entire WD filled with a block of RI 1.454 liquid.
Figures 3A and 3B show signal collected from a 1 mm thick tis-
sue block; the image quality was, however, much reduced at the
top and the bottom slices of the stack due in part to the lateral
Page 5
A B Figure 2. SPED Light SheetMicroscopy Imple-
mentation
(A) One or two light sheets (second identical light
sheet illumination path is not shown in the figure) are
created from opposite sides, and the emitted signal is
detected with an orthogonal wide-field detection
arm. In addition, a block of higher refractive index
material is placed between the objective and the
sample to induce uniform spherical aberrations for
PSF elongation. The illumination arm includes laser
source, filter wheel, shutter, x-y 2d galvanometer
scanner, scan lens, tube lens, mirror and the illumi-
nation objective. The detection arm contains a
detection objective, filter wheel, tube lens and
sCMOS camera.
(B) First SPED prototype as implemented on the
CLARITY-optimized light sheet microscopy (COLM)
backbone (Tomer et al., 2014). The large horizontal
COLM sample chamber was filled with a specific
refractive index (nb) liquid (1.454 was used for the
majority of experiments) to implement the requisite
refractive index block for inducing spherical aberra-
tion-based PSF extension. Lens tubes (containing
quartz glass coverslips for separating the objectives from RI liquid) of varying lengths were used to achieve varying RI block thickness (t). The same effect can be
used on the illumination side to achieve increased field of view while maintaining light sheet thickness. Samples were mounted in custom thin-walled (0.5-mm-
thick) quartz glass cuvettes. All parts are as described in detail for the COLM framework (Tomer et al., 2014). Although the first prototype is implemented on the
COLM backbone, SPED is easily adaptable to any light sheet microscope by incorporating a liquid or solid block of transparent material of defined thickness and
refractive index to achieve desired axial elongation of the system PSF.
broadening of the PSF at its axial limits. Therefore, we tested the
standard Richardson-Lucy deconvolution method, using the
experimentally-measured PSF, and found that much of the infor-
mation (including neurite-resolution features) could be readily
restored, as shown in the comparison of x-y and x-z projections
of raw SPED, Richardson-Lucy deconvolved, and standard
CLARITY-optimized light sheet microscopy (COLM; Tomer
et al., 2014) imaging data (Figures 3, S3, S4, and Movie S2).
Next, we sought to assess imaging quality in live zebrafish
larvae, considering that one of the main advantages of SPED
microscopy could be fast, complete functional and anatomical
imaging of small and relatively transparent model organisms.
We acquired image stacks from live, unparalyzed 10 dpf zebra-
fish larvae expressing the genetically encoded Ca2+ indicator
GCaMP6s localized to the nucleus (Tg(elavl3:H2B-GCaMP6s);
Vladimirov et al., 2014) with two different objectives: 43/0.28
NA and 103/0.25 NA. As demonstrated in Figures 4 and S5
and Movies S3 and S4, SPED light sheet allows cellular
resolution imaging of entire zebrafish nervous systems. The
ability to resolve individual cells throughout the volume was
demonstrated by automated image segmentation of the cell
nuclei in live imaging datasets, as discussed below and shown
in Movie S8.
Comparison of SPED with Light Field MicroscopyWe next sought to compare this volumetric imaging method with
other methods for fast volumetric imaging. We and others have
developed methods such as light field microscopy (LFM; Brox-
ton et al., 2013; Cohen et al., 2014; Grosenick et al., 2009; Levoy
et al., 2006; Prevedel et al., 2014) and multifocus microscopy
(Abrahamsson et al., 2013; Abrahamsson et al., 2015) to attain
high volumetric imaging speeds, in which the entire volume is ac-
C
quired in a single snapshot. However, this speed comes at the
cost of resolution, limits on the sample size, and, in the case of
LFM, requirements for complex forms of volumetric deconvolu-
tion. SPED microscopy involves scanning the light sheet using
only galvanometer scanners, which can run at several KHz,
providing the capability to scan thousands of volumes (>1 mm
deep) per second while maintaining lateral (determined by
detection objective NA) and axial (determined by light sheet
thickness) resolution. SPED volumetric imaging speed is thus
only limited by the data acquisition rate of sCMOS cameras,
which are currently fast and continuously improving.
Cognizant of the potential tradeoffs in real-world application
settings, we set out to directly compare the quality of image vol-
umes acquired with LFM and SPED light sheet microscopy. We
consecutively imaged a 10 dpf Tg(elavl3:H2B-GCaMP6s) zebra-
fish larva sample with modern LFM methods (Broxton et al.,
2013) and SPED light sheet imaging, using comparable parame-
ters. The LFM image stack was acquired with 500 ms exposure
using a 103/0.6 NA (Olympus) water immersion objective and f/
11.36, 100 mm pitch lenslet array, whereas the SPED light sheet
volume was acquired with 460 ms exposure at half the NA (103/
0.3NA; Nikon), thus yielding comparable exposure times (500ms
for LFM, 460 ms for SPED light sheet). As shown in Figure 5,
SPED light sheet provides higher lateral and axial resolution,
even at 12 volumes per second (40 z slices, <100 ms exposure
per stack; Figure 6). While SPED light sheet and LFM volumetric
imaging rates are both currently limited by the camera acquisi-
tion speed (currently �1,000 images per second for smaller re-
gions of interest [ROIs]), LFM is fundamentally faster by acquiring
the entire volume in each snapshot, compared to the one plane-
per-snapshot of SPED light sheet. However, rapidly-improving
camera imaging speeds will continue to reduce this difference
ell 163, 1796–1806, December 17, 2015 ª2015 Elsevier Inc. 1799
Page 6
Figure 3. SPED Light Sheet Imaging Depth
Characterization
(A and B) One-millimeter-deep volumes of clarified
Thy1-eYFP transgenic mouse brain were imaged
with SPED light sheet microscopy and with
CLARITY-optimized light sheet microscopy (COLM)
using a 43/0.28NA objective to assess the SPED
imaging depth. (A) compares the x-y projections and
(B) the x-z projections of the raw SPED light sheet
image volume, after deconvolution using standard
Richardson-Lucy deconvolution with the empirically
measured PSF and the standard COLM imaging by
moving the sample through stationary light sheet and
in-focus detection objective.
(C) Volume rendering of the SPED light sheet volume.
Note that because of the low magnification (43) of
the imaging objective, the pixel sampling size was
�1.46micronswhich is not sufficient to visualize finer
details such as dendritic spines or thinner axons. See
also Figure S3 andMovie S2 for detailed comparison
of SPED raw and deconvolved data with the COLM
imaging, and Figure S4 for a detailed description of
the deconvolution pipeline.
to the point at which both methods are limited by the speed of
the genetically-encoded activity indicators.
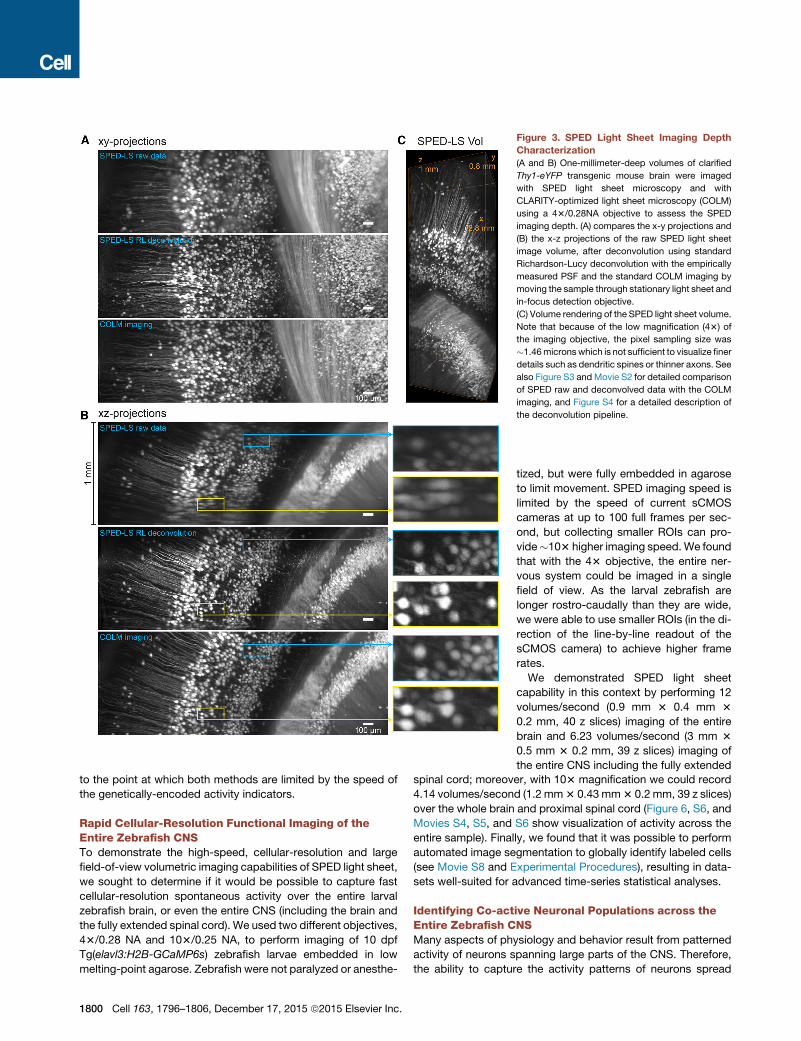
Rapid Cellular-Resolution Functional Imaging of theEntire Zebrafish CNSTo demonstrate the high-speed, cellular-resolution and large
field-of-view volumetric imaging capabilities of SPED light sheet,
we sought to determine if it would be possible to capture fast
cellular-resolution spontaneous activity over the entire larval
zebrafish brain, or even the entire CNS (including the brain and
the fully extended spinal cord). We used two different objectives,
43/0.28 NA and 103/0.25 NA, to perform imaging of 10 dpf
Tg(elavl3:H2B-GCaMP6s) zebrafish larvae embedded in low
melting-point agarose. Zebrafish were not paralyzed or anesthe-
1800 Cell 163, 1796–1806, December 17, 2015 ª2015 Elsevier Inc.
tized, but were fully embedded in agarose
to limit movement. SPED imaging speed is
limited by the speed of current sCMOS
cameras at up to 100 full frames per sec-
ond, but collecting smaller ROIs can pro-
vide�103 higher imaging speed.We found
that with the 43 objective, the entire ner-
vous system could be imaged in a single
field of view. As the larval zebrafish are
longer rostro-caudally than they are wide,
we were able to use smaller ROIs (in the di-
rection of the line-by-line readout of the
sCMOS camera) to achieve higher frame
rates.
We demonstrated SPED light sheet
capability in this context by performing 12
volumes/second (0.9 mm 3 0.4 mm 3
0.2 mm, 40 z slices) imaging of the entire
brain and 6.23 volumes/second (3 mm 3
0.5 mm 3 0.2 mm, 39 z slices) imaging of
the entire CNS including the fully extended
spinal cord; moreover, with 103 magnification we could record
4.14 volumes/second (1.2 mm3 0.43 mm3 0.2 mm, 39 z slices)
over the whole brain and proximal spinal cord (Figure 6, S6, and
Movies S4, S5, and S6 show visualization of activity across the
entire sample). Finally, we found that it was possible to perform
automated image segmentation to globally identify labeled cells
(see Movie S8 and Experimental Procedures), resulting in data-
sets well-suited for advanced time-series statistical analyses.
Identifying Co-active Neuronal Populations across theEntire Zebrafish CNSMany aspects of physiology and behavior result from patterned
activity of neurons spanning large parts of the CNS. Therefore,
the ability to capture the activity patterns of neurons spread
Page 7
Figure 4. Cellular-Resolution Imaging of the
Entire Larval Zebrafish CNS with SPED Light
Sheet Microscopy
(A and B) Volume renderings of 10 dpf Tg(elavl3:
H2B-GCaMP6s) zebrafish larvae imaged with 43/
0.28NA (A) and 103/0.25NA (B) objectives demon-
strate the large field of view of SPED microscopy,
while maintaining cellular resolution. Cyan and
magenta boxes provide magnified views. (A) Image
volumes of 10 consecutive time points were
collapsed into one volume by taking the maximum
values voxel-wise across the recording duration.
The bounding box size is 0.75 mm 3 2.99 mm 3
0.48 mm. (B) Image volumes of 7 consecutive time
points were collapsed into one volume by taking the
maximum values voxel-wise across the recording
duration. The bounding box size is 0.65 mm 3
1.20 mm 3 0.30 mm. See Movies S3 and S4 for
detailed 3-dimensional rendering and Figure S5 for
comparison of raw and deconvolved data.
across the entire nervous system is critical for understanding the
mechanisms underlying these processes. SPED microscopy,
by enabling rapid volumetric imaging of naturally functioning
nervous systems, provides a unique opportunity to reveal
fundamental principles of nervous system dynamics at cellular
resolution. To demonstrate this capability, we employed two
commonly used statistical approaches to analyze our datasets
of endogenous activity patterns spanning the entire CNS. First,
we used principal component analysis (PCA) to collapse highly
correlated cells into a lower dimensional space to detect salient
population-wide activity patterns (Figure 7). We analyzed DF/F
traces of active neurons (Experimental Procedures) to reveal
population dynamics along the three most significant dimen-
sions (principal components [PCs]), resulting in identification of
population synchrony events and the participatory neurons; as
shown in Figure 7, the peaks in recovered principal components
matched closely with peaks in the neuronal co-activation plots
(compare Figures 7A and 7B). To determine the spatial locations
and identities of participating neurons, we mapped the PC coef-
Cell 163, 1796–1806, D
ficient magnitudes in the sample space
(Figure 6E). In doing so, we identified neu-
rons scattered in spinal cord belonging to
all the three PCs (with the majority corre-
sponding to the forebrain PC), identifying
long-range (CNS-wide) co-active neurons.
To further reveal the underlying popula-
tion architecture, we performed indepen-
dent component analysis (ICA) of the
same dataset, resulting in recovery of six
independent components (ICs; see Exper-
imental Procedures). By comparing peaks
in Figures 7A–7C (dotted lines), we noted
that identified IC peaks matched well with
PC and co-activation peaks, indicating
another effective means of classifying
functionally related neurons from large-
scale recordings enabled by SPED light
sheet microscopy. A comparison of spatial maps of PCA and
ICA (Figure 7E) showed consistent populations in forebrain,
midbrain, hindbrain, and spinal cord, indicating comparable
functional segregation in anatomical space. These observations
underscore the capability and value of high-speed neuronal ac-
tivity measurement across the entire nervous system to reveal
global ensembles of functionally related circuitry.
DISCUSSION
Development of tissue clearing technology, and development of
optical cellular-activity sensors, together are providing unprece-
dented opportunities for interrogating large populations of cells
spread across entire organ systems or organisms. To help build
upon this opportunity, we have here developed SPED light sheet
microscopy, which combines the large volumetric field of view of
an extended depth of field with the optical sectioning of light
sheet microscopy to provide high volumetric imaging speed
across a large volume (such as the entire larval zebrafish CNS)
ecember 17, 2015 ª2015 Elsevier Inc. 1801
Page 8
Figure 5. Comparing Resolution of LFM and SPED Light Sheet
Methods
Three-dimensional volumes were acquired from a 10 dpf Tg(elavl3:H2B-
GCaMP6s) zebrafish larva with LFM and SPED light sheet microscopy, using
103/0.6NA (water immersion, Olympus) objective with 500 ms exposure and
103/0.3NA (air, Olympus) objective with 460ms exposure, respectively. SPED
light sheet images in Figure 6B were acquired with less than 100 ms exposure/
volume, still yielding cellular resolution. Scale bars, 100 mm.
at cellular resolution. At its core, SPED light sheet microscopy
consists of a simple and scalable implementation, requiring the
introduction of a transparent block of material in the detection
path of a standard light sheet microscope, for generating an
extended depth of field by inducing uniform spherical aberra-
tions. By choosing the appropriate combination of refractive in-
dex, block thickness, and detection objective NA, any desired
depth of field can be achieved; for example, we demonstrated
sub-cellular resolution structural imaging in clarified mouse
brains at 1 mm depth. Although we implemented the first
SPED light sheet prototype on the COLM framework (Tomer
et al., 2014), which provided particularly easy access to test liq-
uids of different refractive indices and thickness, the same effect
may be easily achieved on any standard light sheet microscope
(e.g., by using a solid transparent block of given refractive index
and thickness). This approach can also be extended to more
specialized systems such as 2-photon light sheet (Truong
et al., 2011; Wolf et al., 2015), lattice light sheet (Chen et al.,
2014), Bessel light sheet (Planchon et al., 2011), multi-direction
illumination configurations (Vladimirov et al., 2014), dual inverted
SPIM (diSPIM; Wu et al., 2013), openSPIM (Pitrone et al., 2013)
and IsoView microscopy (Chhetri et al., 2015). Moreover, the
PSF extension method described here may also be useful on
the light sheet illumination side to maintain light sheet thickness
over a large field of view.
SPED light sheet microscopy provides high spatial resolu-
tion comparable to standard light sheet microscopes, while
providing the potential to scanmore than 1,000 volumes per sec-
ond, as a galvanometer scanner can scan a light sheet through
an entire volume in less than a millisecond. The speed of this
method is therefore only limited by camera acquisition rates,
which are rapidly improving. In comparison to the IsoView light
sheet microscope (Chhetri et al., 2015), it may be noted that
SPED microscopy is simpler and less expensive to implement,
with faster imaging speeds at similar image quality, and can (if
desired) be similarly integrated with four orthogonal detection-
arm-based configurations to yield higher axial resolution. Here,
we used SPED light sheet microscopy to achieve cellular-resolu-
1802 Cell 163, 1796–1806, December 17, 2015 ª2015 Elsevier Inc.
tion functional imaging of the entire larval zebrafish CNS at up to
an order of magnitude greater speed than previously published
methods; more broadly, the features of SPED light sheet micro-
scopy may be ideally suited for rapid functional and/or structural
imaging of small, relatively transparent model organisms such as
zebrafish larvae, the isolated nervous system of Drosophila
larvae, andC. elegans, as well as of larger tissues including those
of mammalian origin (after clearing to reduce light scattering,
while preserving biomolecules for labeling). Indeed, the initial
construction of acrylamide-related polymer hydrogels from
within, and covalently linked to, biological tissues for selective
preservation or elimination of distinct tissue elements (Chung
et al., 2013; Tomer et al., 2014) was subsequently applied in
diverse approaches (Chung et al., 2013; Tomer et al., 2014;
Chen et al., 2015; present paper), including with expansion of
the composite tissue-polymer hybrid itself (Tomer et al., 2014;
Chen et al., 2015) and with new approaches to microscopy
that leverage the unique properties of hydrogel-tissue compos-
ites (Tomer et al., 2014; Chen et al., 2015; present paper, Fig-
ure 3). Adapting the unique properties of SPED light sheet micro-
scopy for transparent or semi-transparent biological samples to
increase imaging resolution and speed may thus find broad
application in biology.
While SPED light sheet can achieve fast imaging rates at
high spatial resolution, methods such as LFM andmulti-focal mi-
croscopy achieve faster volumetric imaging, because these
methods acquire an entire volume simultaneously in a single
snapshot. However, SPED has no fundamental limitation in
achieving much greater speeds as sCMOS camera technology
advances rapidly, while LFM, though operating at higher speeds,
currently remains limited in spatial resolution. It is worth noting
that although the SPED light sheet PSF is spread at the detector
(Figure S1C), nearly all of the photons will arrive at the sensor no
matter where the light sheet is (Figure S1C), providing good SNR
properties. Finally, the extended depth of field, and hence the
SNR, can be adapted in SPED light sheet to a desired range
for a given preparation; this is a feature lacking in other volu-
metric imaging methods such as multi-focal volumetric micro-
scopy (Abrahamsson et al., 2013). Next steps in SPED light sheet
may involve decoupling the SNR and PSF depth of field exten-
sion, further increasing the depth of field by 2-fold using two
opposite-side detection arms, and further PSF engineering
through objective design. Indeed, with imaging depths of up to
1 mm already demonstrated, it will be straightforward to extend
the SPED PSF further by choosing appropriate optical parame-
ters (as shown in Figure 1), and custom objectives for inducing
spherical aberrations will further enhance SPED capabilities.
SPED light sheet microscopy may be particularly useful for
neuroscience research in allowing both functional and structural
imaging at high speeds and may be integrated with complemen-
tary optics for optogenetics to perform simultaneous recording
and control of neural activity across the entire vertebrate nervous
system. As shown here, SPED already enables CNS-wide iden-
tification of distinct classes of fast neuronal population dynamics
as well as rapid high-resolution mapping of the structural
architecture of large intact clarified biological tissues. But devel-
opmental and cell biology experiments also can require rapid
capturing of events (such as cellular division, dynamics of
Page 9
A
B C
Figure 6. Rapid Cellular-Resolution Func-
tional Mapping of the Entire Larval Zebrafish
Nervous System
(A–C) The camera-frame-rate limited volumetric
imaging speed of SPED light sheet is demonstrated
by performing rapid cellular-resolution functional
mapping of the nervous system of 10 dpf
Tg(elavl3:H2B-GCaMP6s) zebrafish larvae. Three
smaller ROIs of the camera frame were used to
image: (A) the entire nervous system with a 43/0.28
NA objective at 6.23 volumes per second (3 mm 3
0.5 mm 3 0.2 mm, 39 z slices), (B) the whole brain
with a 43/0.28NA objective at 12 volumes per
second (0.9 mm 3 0.4 mm 3 0.2 mm, 40 z slices),
and (C) the whole brain and anterior spinal cord with
a 103/0.25NA objective at 4.14 volumes per sec-
ond (1.2 mm 3 0.43 mm 3 0.2 mm, 39 z slices).
The maximum intensity projection images were
generated from a collapsed 3D volume generated
by voxel-wise standard deviation (SD) across the
entire recording durations. Cellular resolution is
demonstrated by several examples of activity
traces (DF/F versus time) of neurons marked by
colored arrows, and of neighboring cells shown in
optical slices from respective volumes and their
automated 3D segmentation. See Figure S6 for the
top 99 example activity traces (ordered according
to the variance across time) from the three datasets.
Movies S5, S6, S7 exhibit the activity time series
(DF/F versus time) of these datasets, and Movie S8
shows details of automated 3D segmentation.
signaling pathways, release of neurotransmitters and tissue
morphogenesis) in three dimensions while minimizing imaging
energy load on the sample. Indeed, the high-speed, high-resolu-
tion volumetric imaging capabilities of SPED light sheet micro-
scopy may be helpful across diverse domains of life science
research which are increasingly dependent on the ability to
rapidly capture tissue events and elements within large intact
volumes.
EXPERIMENTAL PROCEDURES
SPED Light Sheet Implementation
SPED light sheet microscopy prototype was built on the previously described
COLM (Tomer et al., 2014) backbone, which provides an efficient platform for
testing diverse refractive indices and thicknesses of RI blocks as a layer of
liquid between the sample and the detection objective. Figure 2 shows the de-
tails of SPED optical implementation. Briefly, two light sheets are generated
from two opposite illumination arms that include a laser source, filter wheel,
shutter, x-y galvanometer scanner, scan lens, tube lens, mirror, and the illumi-
nation objective (Olympus Macro 43/0.28 NA). The emitted signal is detected
with an orthogonally arranged wide-field detection arm, including a detection
objective, emission filter wheel, tube lens, and sCMOS camera (Hamamatsu
Orca Flash 4.0 V2). Details of these parts were described previously (Tomer
et al., 2014). Note that we rotated the detection camera by 90 degrees (i.e.,
camera rows were orthogonal to the illumination beam propagation direction)
for live imaging experiments to maximize the data acquisition speed by mini-
mizing the number of rows that were needed to cover the samples. For the
12 volume per second whole-brain imaging, this resulted in isolated visual
line artifacts on the sample periphery in Movie S6. Refractive index (RI) blocks
to induce spherical aberration-based axial PSF elongation (SPED) were imple-
mented by filling the sample chamber (Figure 2) with specific refractive index
liquids (1.454 was used for the most of the experiments). The RI block thick-
ness was specified using variable lengths of lens tubes (Thorlabs, 2’’ diameter)
C
in the sample chamber (Figure 2). This is equivalent to using solid transparent
material of varying thickness. Samples were mounted in custom thin-walled
(0.5-mm-thick) quartz glass cuvettes (Starna Cells). The imaging procedures
for rapid light sheet scanning (while keeping all the other parts stationary)
and time lapse experiment data logging were implemented in the previously
described (Tomer et al., 2014) COLM software and electronics control
framework.
Experimental PSFs and Analysis
We used 1 mm diameter beads to assess the PSF of diverse objectives in the
SPED light sheet versus standard air imaging configurations. PSFs were re-
corded by synchronously moving the beads and the light sheet (typically in a
z step of 4 mm), so that the beads remained constantly and uniformly illumi-
nated throughout the image stacks. Beads were manually identified and crop-
ped using Fiji (Schindelin et al., 2012), were up-sampled 2-fold, and aligned
rigidly (with six parameters: three for translation and three for rotation) in Amira
(FEI). Final average PSFs were generated by taking an average of the normal-
ized (by subtracting mean signal, and dividing by the SD) images of all beads
(nR 5). Lateral PSF FWHMs as a function of z position were calculated by sub-
tracting the average background level, identifying the bead center in each slice
center, and then averaging the FWHM of four cross sections through this
center position.
SPED Light Sheet PSF Simulations
The effect of various SPED light sheet system parameters on the PSF exten-
sion was assessed by optical simulations performed using Zemax OpticStudio
13 (Kirkland, WA). The FFT PSF function, which includes the influence of wave-
optics for numerical apertures up to approximately 0.4, was used for all simu-
lations. The optical prescription is presented in Figure S2A. In brief, the objec-
tive and the tube lens were approximated as ideal (paraxial) lenses, and focal
lengths were set according to the working distance and the overall system
magnification. The numerical aperture (NA) was set as a system parameter
that controlled the size of an aperture stop at the back focal plane of the
objective lens. This optical prescription allowed access to all the system
ell 163, 1796–1806, December 17, 2015 ª2015 Elsevier Inc. 1803
Page 10
Figure 7. Population Analysis of Global
Zebrafish CNS Activity Recorded by SPED
Light Sheet Microscopy
Principal component analysis (PCA) and indepen-
dent component analysis (ICA) were used to
analyze the population dynamics of neurons
spread across the entire zebrafish larval CNS. The
dataset was acquired using a 43/0.28 NA objective
at 6.23 volumes/sec (as in Figure 6A). DF/F activity
profiles of all cells were first filtered to identify
active neurons by choosing a noise level corre-
sponding to 5% false positive rate as the cutoff,
followed by PCA and ICA; early time points that
may represent nonspecific responses to initial laser
illumination were excluded from analysis.
(A) Number of co-active neurons as a function of
time across the recording duration.
(B) Temporal traces of top three principal
components (PC) shown in red, green and
magenta respectively. y axis represents arbitrary
units in PCA space.
(C) Temporal traces of 6 recovered independent
components (IC) out of 10 (filtered to retain traces
in which the sum of minimum andmaximum values
was greater than zero); units are arbitrary. The
dotted lines across panels indicate peaks in the ICs
that correspond to the peaks in PCA and cellular
activity.
(D) Eigenvalues for the top 100 dimensions of
cellular (top) and time points (bottom) principal
components. Dashed lines mark the top 3 cellular
and the top 20 temporal PCA dimensions, which
were used in (B) and for data ‘‘whitening’’ before
ICA (methods) in (C).
(E) Spatial plots of each PC coefficient (absolute
value) and each IC (absolute value) were generated
to visualize the locations and identities of the
neurons associated with each component.
Different components were combined into multi-
color images (each color corresponding to coloring
of the temporal traces in B and C) after scaling for
contrast. Images shown are maximum intensity
projections through x, y or z. Fb, Forebrain; Mb,
midbrain, Hb, Hindbrain.
parameters: (i) the refractive index of the material in which the sample was
embedded and the sample z position, (ii) the thickness and the refractive index
of the coverglass separating the sample from the RI liquid, (iii) the thickness
and refractive index of the RI liquid block, (iv) the thickness and refractive index
of a coverglass between the RI liquid and the objective, and (v) the thickness of
the air gap between the objective and the cover glass. All the surfaces, before
the objective, were set to infinite flat curvature. The distance between the tube
lens and the sensor was varied for refocusing the position of the camera
sensor. We used a custom macro to sequentially step the z position of the ob-
ject (in 10 microns steps) to generate the 3D PSF, and wrote custom Python
scripts to process the Zemax output files.
Imaging Experiments
The clarified adult mouse brain sample was generated from a Thy1-eYFP
transgenic mouse, using the methods described previously in detail (Tomer
et al., 2014). The clarified brain sample was incubated in 65% glycerol and
mounted in a quartz cuvette for SPED light sheet and standard COLM imaging.
Live 10 dpf larval zebrafish, expressing nuclear-localized GCaMP6s Tg(elavl3:
H2B-GCaMP6s), weremounted in a quartz cuvette (Tomer et al., 2014) and im-
mobilized in a layer of 1% lowmelting point agarose (Sigma) in the corner of the
cuvette, which was then filled with fish system water. SPED light sheet micro-
1804 Cell 163, 1796–1806, December 17, 2015 ª2015 Elsevier Inc.
scopy under different configurations was performed by step-wise rapid scan-
ning of the light sheet and detecting the corresponding illuminated planes with
an sCMOS (Orca Flash 4.0 V2) camera. Uni-directional rolling shutter mode
was used for acquiring anatomy images, and the standard bi-directional
mode for live imaging experiments. A z step of 2 or 4 mmwas used for the anat-
omy images shown in Figure 4. For live imaging, a z step of 5 mm was used to
cover the entire depth in 40 slices. Light sheets used for the imaging
experiments were 4 to 6 mm thick. All imaging experiments were performed
with one side light sheet illumination. For LFM data collection, 10 dpf
Tg(elavl3:H2B-GCaMP6s) larvae were immobilized in 2% low melting point
agarose (Sigma) and placed on a standard petri dish filled with fish systemwa-
ter. LFM was performed on a Leica SP5 using a 103/0.6NA Olympus water-
dipping objective modified to have a 250 mm focal length tube lens, f/11.36
100 mm pitch microlens array (Jenoptics), and Andor Zyla sCMOS camera
attached to the wide-field imaging port. Fish were imaged at 2 Hz for 5 min us-
ing 2.3 mW light power (excitation: 450–490 nm; dichroic: 495 nm long-pass;
emission: 500–550 nm). Light field images were transferred to Amazon Web
Services S3, and volumes were reconstructed using the 3D deconvolution al-
gorithm described previously (Broxton et al., 2013) on a GPU cluster within
Amazon’s Elastic Compute Cloud (EC2). Volumes were reconstructed with a
voxel size of 3.6 3 3.6 3 5 mm.
Page 11
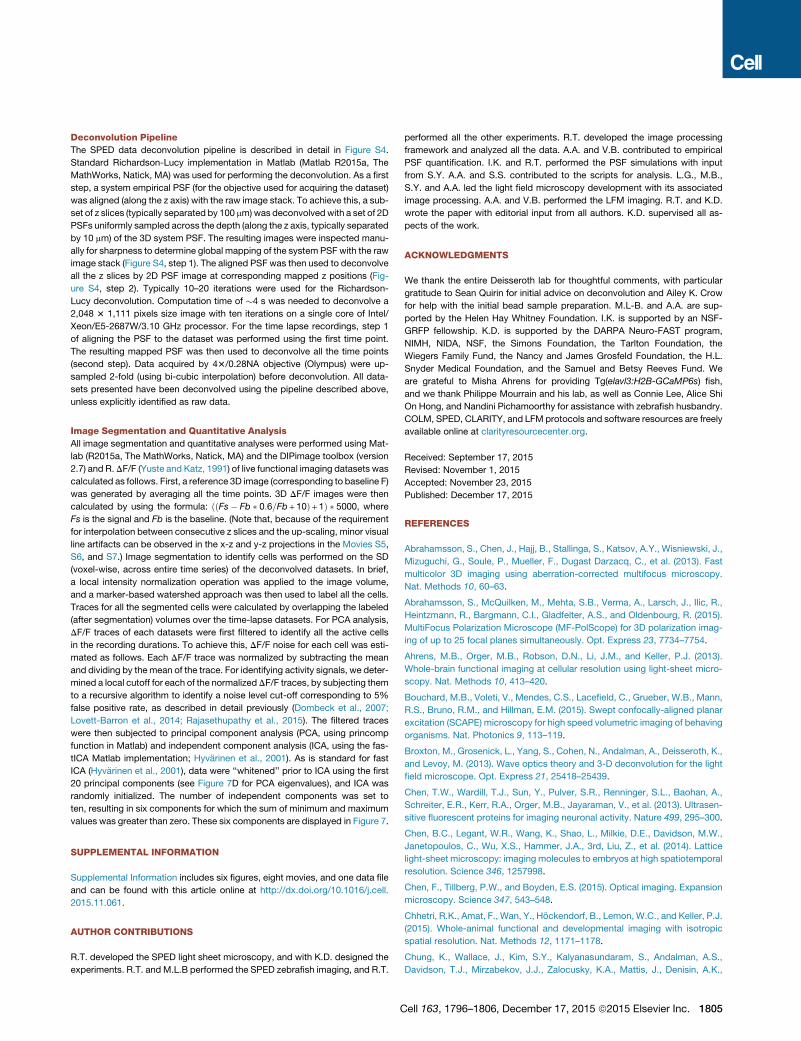
Deconvolution Pipeline
The SPED data deconvolution pipeline is described in detail in Figure S4.
Standard Richardson-Lucy implementation in Matlab (Matlab R2015a, The
MathWorks, Natick, MA) was used for performing the deconvolution. As a first
step, a system empirical PSF (for the objective used for acquiring the dataset)
was aligned (along the z axis) with the raw image stack. To achieve this, a sub-
set of z slices (typically separated by 100 mm)was deconvolvedwith a set of 2D
PSFs uniformly sampled across the depth (along the z axis, typically separated
by 10 mm) of the 3D system PSF. The resulting images were inspected manu-
ally for sharpness to determine global mapping of the system PSF with the raw
image stack (Figure S4, step 1). The aligned PSF was then used to deconvolve
all the z slices by 2D PSF image at corresponding mapped z positions (Fig-
ure S4, step 2). Typically 10–20 iterations were used for the Richardson-
Lucy deconvolution. Computation time of �4 s was needed to deconvolve a
2,048 3 1,111 pixels size image with ten iterations on a single core of Intel/
Xeon/E5-2687W/3.10 GHz processor. For the time lapse recordings, step 1
of aligning the PSF to the dataset was performed using the first time point.
The resulting mapped PSF was then used to deconvolve all the time points
(second step). Data acquired by 43/0.28NA objective (Olympus) were up-
sampled 2-fold (using bi-cubic interpolation) before deconvolution. All data-
sets presented have been deconvolved using the pipeline described above,
unless explicitly identified as raw data.
Image Segmentation and Quantitative Analysis
All image segmentation and quantitative analyses were performed using Mat-
lab (R2015a, The MathWorks, Natick, MA) and the DIPimage toolbox (version
2.7) and R. DF/F (Yuste and Katz, 1991) of live functional imaging datasets was
calculated as follows. First, a reference 3D image (corresponding to baseline F)
was generated by averaging all the time points. 3D DF/F images were then
calculated by using the formula: ððFs� Fb � 0:6=Fb+10Þ+1Þ � 5000, where
Fs is the signal and Fb is the baseline. (Note that, because of the requirement
for interpolation between consecutive z slices and the up-scaling, minor visual
line artifacts can be observed in the x-z and y-z projections in the Movies S5,
S6, and S7.) Image segmentation to identify cells was performed on the SD
(voxel-wise, across entire time series) of the deconvolved datasets. In brief,
a local intensity normalization operation was applied to the image volume,
and a marker-based watershed approach was then used to label all the cells.
Traces for all the segmented cells were calculated by overlapping the labeled
(after segmentation) volumes over the time-lapse datasets. For PCA analysis,
DF/F traces of each datasets were first filtered to identify all the active cells
in the recording durations. To achieve this, DF/F noise for each cell was esti-
mated as follows. Each DF/F trace was normalized by subtracting the mean
and dividing by themean of the trace. For identifying activity signals, we deter-
mined a local cutoff for each of the normalizedDF/F traces, by subjecting them
to a recursive algorithm to identify a noise level cut-off corresponding to 5%
false positive rate, as described in detail previously (Dombeck et al., 2007;
Lovett-Barron et al., 2014; Rajasethupathy et al., 2015). The filtered traces
were then subjected to principal component analysis (PCA, using princomp
function in Matlab) and independent component analysis (ICA, using the fas-
tICA Matlab implementation; Hyvarinen et al., 2001). As is standard for fast
ICA (Hyvarinen et al., 2001), data were ‘‘whitened’’ prior to ICA using the first
20 principal components (see Figure 7D for PCA eigenvalues), and ICA was
randomly initialized. The number of independent components was set to
ten, resulting in six components for which the sum of minimum and maximum
values was greater than zero. These six components are displayed in Figure 7.
SUPPLEMENTAL INFORMATION
Supplemental Information includes six figures, eight movies, and one data file
and can be found with this article online at http://dx.doi.org/10.1016/j.cell.
2015.11.061.
AUTHOR CONTRIBUTIONS
R.T. developed the SPED light sheet microscopy, and with K.D. designed the
experiments. R.T. and M.L.B performed the SPED zebrafish imaging, and R.T.
C
performed all the other experiments. R.T. developed the image processing
framework and analyzed all the data. A.A. and V.B. contributed to empirical
PSF quantification. I.K. and R.T. performed the PSF simulations with input
from S.Y. A.A. and S.S. contributed to the scripts for analysis. L.G., M.B.,
S.Y. and A.A. led the light field microscopy development with its associated
image processing. A.A. and V.B. performed the LFM imaging. R.T. and K.D.
wrote the paper with editorial input from all authors. K.D. supervised all as-
pects of the work.
ACKNOWLEDGMENTS
We thank the entire Deisseroth lab for thoughtful comments, with particular
gratitude to Sean Quirin for initial advice on deconvolution and Ailey K. Crow
for help with the initial bead sample preparation. M.L-B. and A.A. are sup-
ported by the Helen Hay Whitney Foundation. I.K. is supported by an NSF-
GRFP fellowship. K.D. is supported by the DARPA Neuro-FAST program,
NIMH, NIDA, NSF, the Simons Foundation, the Tarlton Foundation, the
Wiegers Family Fund, the Nancy and James Grosfeld Foundation, the H.L.
Snyder Medical Foundation, and the Samuel and Betsy Reeves Fund. We
are grateful to Misha Ahrens for providing Tg(elavl3:H2B-GCaMP6s) fish,
and we thank Philippe Mourrain and his lab, as well as Connie Lee, Alice Shi
On Hong, and Nandini Pichamoorthy for assistance with zebrafish husbandry.
COLM, SPED, CLARITY, and LFM protocols and software resources are freely
available online at clarityresourcecenter.org.
Received: September 17, 2015
Revised: November 1, 2015
Accepted: November 23, 2015
Published: December 17, 2015
REFERENCES
Abrahamsson, S., Chen, J., Hajj, B., Stallinga, S., Katsov, A.Y., Wisniewski, J.,
Mizuguchi, G., Soule, P., Mueller, F., Dugast Darzacq, C., et al. (2013). Fast
multicolor 3D imaging using aberration-corrected multifocus microscopy.
Nat. Methods 10, 60–63.
Abrahamsson, S., McQuilken, M., Mehta, S.B., Verma, A., Larsch, J., Ilic, R.,
Heintzmann, R., Bargmann, C.I., Gladfelter, A.S., and Oldenbourg, R. (2015).
MultiFocus Polarization Microscope (MF-PolScope) for 3D polarization imag-
ing of up to 25 focal planes simultaneously. Opt. Express 23, 7734–7754.
Ahrens, M.B., Orger, M.B., Robson, D.N., Li, J.M., and Keller, P.J. (2013).
Whole-brain functional imaging at cellular resolution using light-sheet micro-
scopy. Nat. Methods 10, 413–420.
Bouchard, M.B., Voleti, V., Mendes, C.S., Lacefield, C., Grueber, W.B., Mann,
R.S., Bruno, R.M., and Hillman, E.M. (2015). Swept confocally-aligned planar
excitation (SCAPE) microscopy for high speed volumetric imaging of behaving
organisms. Nat. Photonics 9, 113–119.
Broxton, M., Grosenick, L., Yang, S., Cohen, N., Andalman, A., Deisseroth, K.,
and Levoy, M. (2013). Wave optics theory and 3-D deconvolution for the light
field microscope. Opt. Express 21, 25418–25439.
Chen, T.W., Wardill, T.J., Sun, Y., Pulver, S.R., Renninger, S.L., Baohan, A.,
Schreiter, E.R., Kerr, R.A., Orger, M.B., Jayaraman, V., et al. (2013). Ultrasen-
sitive fluorescent proteins for imaging neuronal activity. Nature 499, 295–300.
Chen, B.C., Legant, W.R., Wang, K., Shao, L., Milkie, D.E., Davidson, M.W.,
Janetopoulos, C., Wu, X.S., Hammer, J.A., 3rd, Liu, Z., et al. (2014). Lattice
light-sheet microscopy: imaging molecules to embryos at high spatiotemporal
resolution. Science 346, 1257998.
Chen, F., Tillberg, P.W., and Boyden, E.S. (2015). Optical imaging. Expansion
microscopy. Science 347, 543–548.
Chhetri, R.K., Amat, F., Wan, Y., Hockendorf, B., Lemon,W.C., and Keller, P.J.
(2015). Whole-animal functional and developmental imaging with isotropic
spatial resolution. Nat. Methods 12, 1171–1178.
Chung, K., Wallace, J., Kim, S.Y., Kalyanasundaram, S., Andalman, A.S.,
Davidson, T.J., Mirzabekov, J.J., Zalocusky, K.A., Mattis, J., Denisin, A.K.,
ell 163, 1796–1806, December 17, 2015 ª2015 Elsevier Inc. 1805
Page 12
et al. (2013). Structural and molecular interrogation of intact biological sys-
tems. Nature 497, 332–337.
Cohen, N., Yang, S., Andalman, A., Broxton, M., Grosenick, L., Deisseroth, K.,
Horowitz, M., and Levoy, M. (2014). Enhancing the performance of the light
field microscope using wavefront coding. Opt. Express 22, 24817–24839.
Deisseroth, K. (2015). Optogenetics: 10 years of microbial opsins in neurosci-
ence. Nat. Neurosci. 18, 1213–1225.
Dombeck, D.A., Khabbaz, A.N., Collman, F., Adelman, T.L., and Tank, D.W.
(2007). Imaging large-scale neural activity with cellular resolution in awake,
mobile mice. Neuron 56, 43–57.
Dunsby, C. (2008). Optically sectioned imaging by oblique plane microscopy.
Opt. Express 16, 20306–20316.
Fahrbach, F.O., Voigt, F.F., Schmid, B., Helmchen, F., and Huisken, J. (2013).
Rapid 3D light-sheet microscopy with a tunable lens. Opt. Express 21, 21010–
21026.
Freeman, J. (2015). Open source tools for large-scale neuroscience. Curr.
Opin. Neurobiol. 32, 156–163.
Freeman, J., Vladimirov, N., Kawashima, T., Mu, Y., Sofroniew, N.J., Bennett,
D.V., Rosen, J., Yang, C.T., Looger, L.L., and Ahrens, M.B. (2014). Mapping
brain activity at scale with cluster computing. Nat. Methods 11, 941–950.
Gao, L., Shao, L., Higgins, C.D., Poulton, J.S., Peifer, M., Davidson, M.W., Wu,
X., Goldstein, B., and Betzig, E. (2012). Noninvasive imaging beyond the
diffraction limit of 3D dynamics in thickly fluorescent specimens. Cell 151,
1370–1385.
Grosenick, L., Anderson, T., and Smith, S.J. (2009). Elastic Source Selection
for in vivo imaging of neuronal ensembles. Biomedical Imaging: From Nano
to Macro, 2009 ISBI ‘09 IEEE International Symposium on June 28 2009-July
1 2009, 1263 - 1266.
Holekamp, T.F., Turaga, D., and Holy, T.E. (2008). Fast three-dimensional fluo-
rescence imaging of activity in neural populations by objective-coupled planar
illumination microscopy. Neuron 57, 661–672.
Huisken, J., Swoger, J., Del Bene, F., Wittbrodt, J., and Stelzer, E.H. (2004).
Optical sectioning deep inside live embryos by selective plane illumination mi-
croscopy. Science 305, 1007–1009.
Hyvarinen, A., Karhunen, J., and Oja, E. (2001). Independent Component Anal-
ysis (John Wiley & Sons).
Keller, P.J., Schmidt, A.D., Wittbrodt, J., and Stelzer, E.H. (2008). Reconstruc-
tion of zebrafish early embryonic development by scanned light sheet micro-
scopy. Science 322, 1065–1069.
Keller, P.J., Ahrens, M.B., and Freeman, J. (2015). Light-sheet imaging for sys-
tems neuroscience. Nat. Methods 12, 27–29.
Lemon,W.C., Pulver, S.R., Hockendorf, B., McDole, K., Branson, K., Freeman,
J., and Keller, P.J. (2015). Whole-central nervous system functional imaging in
larval Drosophila. Nat. Commun. 6, 7924.
Lerner, T.N., Shilyansky, C., Davidson, T.J., Evans, K.E., Beier, K.T.,
Zalocusky, K.A., Crow, A.K., Malenka, R.C., Luo, L., Tomer, R., and Deisser-
oth, K. (2015). Intact-Brain Analyses Reveal Distinct Information Carried by
SNc Dopamine Subcircuits. Cell 162, 635–647.
Levoy, M., Ng, R., Adams, A., Footer, M., and Horowitz, M. (2006). Light Field
Microscopy. Proc SIGGRAPH 25.
Lovett-Barron, M., Kaifosh, P., Kheirbek, M.A., Danielson, N., Zaremba, J.D.,
Reardon, T.R., Turi, G.F., Hen, R., Zemelman, B.V., and Losonczy, A. (2014).
Dendritic inhibition in the hippocampus supports fear learning. Science 343,
857–863.
1806 Cell 163, 1796–1806, December 17, 2015 ª2015 Elsevier Inc.
Panier, T., Romano, S.A., Olive, R., Pietri, T., Sumbre, G., Candelier, R., and
Debregeas, G. (2013). Fast functional imaging of multiple brain regions in intact
zebrafish larvae using selective plane illumination microscopy. Front. Neural
Circuits 7, 65.
Pitrone, P.G., Schindelin, J., Stuyvenberg, L., Preibisch, S., Weber, M., Eliceiri,
K.W., Huisken, J., and Tomancak, P. (2013). OpenSPIM: an open-access light-
sheet microscopy platform. Nat. Methods 10, 598–599.
Planchon, T.A., Gao, L., Milkie, D.E., Davidson, M.W., Galbraith, J.A., Gal-
braith, C.G., and Betzig, E. (2011). Rapid three-dimensional isotropic imaging
of living cells using Bessel beam plane illumination. Nat. Methods 8, 417–423.
Preibisch, S., Saalfeld, S., Schindelin, J., and Tomancak, P. (2010). Software
for bead-based registration of selective plane illumination microscopy data.
Nat. Methods 7, 418–419.
Prevedel, R., Yoon, Y.G., Hoffmann, M., Pak, N., Wetzstein, G., Kato, S.,
Schrodel, T., Raskar, R., Zimmer, M., Boyden, E.S., and Vaziri, A. (2014).
Simultaneous whole-animal 3D imaging of neuronal activity using light-field
microscopy. Nat. Methods 11, 727–730.
Quirin, S., Peterka, D.S., and Yuste, R. (2013). Instantaneous three-dimen-
sional sensing using spatial light modulator illumination with extended depth
of field imaging. Opt. Express 21, 16007–16021.
Quirin, S., Jackson, J., Peterka, D.S., and Yuste, R. (2014). Simultaneous
imaging of neural activity in three dimensions. Front. Neural Circuits 8, 29.
Rajasethupathy, P., Sankaran, S., Marshel, J.H., Kim, C.K., Ferenczi, E., Lee,
S.Y., Berndt, A., Ramakrishnan, C., Jaffe, A., Lo, M., et al. (2015). Projections
from neocortex mediate top-down control of memory retrieval. Nature 526,
653–659.
Reynaud, E.G., Peychl, J., Huisken, J., and Tomancak, P. (2015). Guide to
light-sheet microscopy for adventurous biologists. Nat. Methods 12, 30–34.
Schindelin, J., Arganda-Carreras, I., Frise, E., Kaynig, V., Longair, M., Pietzsch,
T., Preibisch, S., Rueden, C., Saalfeld, S., Schmid, B., et al. (2012). Fiji: an
open-source platform for biological-image analysis. Nat. Methods 9, 676–682.
Siedentopf, H., and Zsigmondy, R. (1903). Uber Sichtbarmachung und Gros-
senbestimmung ultramikroskopischer Teilchen, mit besonderer Anwendung
auf Goldrubinglaser. Ann. Phys. 10, 1–39.
Stelzer, E.H. (2015). Light-sheet fluorescence microscopy for quantitative
biology. Nat. Methods 12, 23–26.
Tomer, R., Ye, L., Hsueh, B., and Deisseroth, K. (2014). Advanced CLARITY for
rapid and high-resolution imaging of intact tissues. Nat. Protoc. 9, 1682–1697.
Truong, T.V., Supatto, W., Koos, D.S., Choi, J.M., and Fraser, S.E. (2011).
Deep and fast live imaging with two-photon scanned light-sheet microscopy.
Nat. Methods 8, 757–760.
Vladimirov, N., Mu, Y., Kawashima, T., Bennett, D.V., Yang, C.T., Looger, L.L.,
Keller, P.J., Freeman, J., and Ahrens,M.B. (2014). Light-sheet functional imag-
ing in fictively behaving zebrafish. Nat. Methods 11, 883–884.
Wolf, S., Supatto, W., Debregeas, G., Mahou, P., Kruglik, S.G., Sintes, J.M.,
Beaurepaire, E., and Candelier, R. (2015). Whole-brain functional imaging
with two-photon light-sheet microscopy. Nat. Methods 12, 379–380.
Wu, Y., Wawrzusin, P., Senseney, J., Fischer, R.S., Christensen, R., Santella,
A., York, A.G., Winter, P.W., Waterman, C.M., Bao, Z., et al. (2013). Spatially
isotropic four-dimensional imaging with dual-view plane illumination micro-
scopy. Nat. Biotechnol. 31, 1032–1038.
Yuste, R., and Katz, L.C. (1991). Control of postsynaptic Ca2+ influx in devel-
oping neocortex by excitatory and inhibitory neurotransmitters. Neuron 6,
333–344.
Page 13
Supplemental Figures
Standard detection rays SPED-LS detection rays C
n>1
A B
ray [degrees]
Foca
l dep
th [m
m]
26.6
26.8
27.0
27.2Focal depth vs ray angle
d0 d1 d2
θ1
θ0
n1=1.4
n0=1.0
θ0
θ0
0 6 10 12 16
Focal depth extension by refraction
Figure S1. Optical Mechanisms Underlying SPED Light Sheet Microscopy, Related to Figure 1Spherical aberrations elongate the PSF by focusing rays that pass through different parts of the objective aperture at different distances. (A) Ray tracing example
to demonstrate the extension of depth of focus caused by introduction of a high refractive index material in the optical path. (B) Relationship between the
incidence ray angle (the sine of which defines the numerical aperture) and the focal depth, demonstrating PSF elongation by the introduction of a block of high
refractive index material. (C) Comparative ray tracing of normal (aberration-free) and SPED detection systems, demonstrating elongation of the PSF achieved in
SPED light sheet.
Cell 163, 1796–1806, December 17, 2015 ª2015 Elsevier Inc. S1
Page 14
A
B
C
D
OBJComment
sample medium inf z+0.75 1.331.45
1.451 to 1.7
1.00
1.00
1.00
0.510 to 50
0.11
f_obj
sensor distf_tl
infinfinfinf
inf
inf
cover glassair gap
objective
tube lenssensor
stop
cover glassRI material
Radius GlassThickness
23456
STO8
IMA
n = 1.0
700
-300
z [μ
m]
n = 1.1 n = 1.2 n = 1.33 n = 1.45
Effect of Block thickness
Effect of Block refractive index
t = 10 mm
x [μm]-10 10
t = 20 mm t = 30 mm t = 40 mm t = 50 mm
Effect of detection objective NANA = 0.1 NA = 0.2 NA = 0.3 NA = 0.4
1000501 RI Thickness [mm]
n = 1.45, NA = 0.281000
PS
F ax
ial F
WH
M [μ
m]
numerical aperture (NA)
n = 1.45, Thickness = 15 mm
PS
F ax
ial F
WH
M [μ
m]
700
10004.001.0
Thickness = 30 mm, NA = 0.28
1.81.00
600
PS
F ax
ial F
WH
M [μ
m]
RI refractive index (n)
n = 1.56 n = 1.70
700
-300
z [μ
m]
700
-300
z [μ
m]
Zemax optical prescription used for SPED-LS PSF simulations
Figure S2. SPED Light Sheet PSF Simulations to Identify Crucial Tuning Parameters, Related to Figure 1
The detection arm of SPED-LSwasmodeled in Zemax using the optical prescription shown in (A). Note that the simulation design assumes ideal lenses, and thus
estimated FWHMs may not necessarily exactly match the empirically measured PSFs; the simulations do, however, describe the general trends associated with
varying system parameters. See Experimental Procedures for further details. (B-D) assess the effects of changing the refractive index (RI) of the block, its
thickness and the numerical aperture (NA) of the detection objective, respectively. As summarized in the graphs, the PSF elongation increases with corre-
sponding increases in all three parameters: linearly with block thickness, and non-linearly with RI and detection objective NA.
S2 Cell 163, 1796–1806, December 17, 2015 ª2015 Elsevier Inc.
Page 15
Figure S3. Comparison of SPED Light Sheet Microscopy with Standard COLM Imaging, Related to Figure 3
A consecutive series of optical sections (100 mm thick) is shown to demonstrate the volumetric imaging capability of SPED light sheet microscopy. Image volumes
were acquired by SPED or COLM, using a 43/0.28NA detection objective, of the same sample volume of clarified Thy1-eYFP transgenic mouse brain. Each panel
shows SPED raw and deconvolved images and the corresponding optical sections from the COLM stack. The z axis positions (middle of the stack set to 0 mm) are
labeled in yellow, marking the position of the middle of the 100-mm-thick optical sections. Detailed volume rendering of the image stack is shown in Figure 3C and
Movie S2. Scale bar, 100 mm.
Cell 163, 1796–1806, December 17, 2015 ª2015 Elsevier Inc. S3
Page 16
Figure S4. SPED Light Sheet Data Deconvolution Pipeline, Related to Figure 3
Schematics summarizing the SPED data deconvolution pipeline. In the first step, the empirically determined system PSF is aligned (along z axis) with the raw data
stack. This is achieved by performing deconvolution (Richardson-Lucy) of a small number of z slices (typically separated by 100 mm) of data with a set of 2D PSFs
sampled at different depths (typically separated by 10 mm). The resulting deconvolved images are analyzed (manually or automatically) for sharpness to determine
the global z axis alignment of the system PSF and the raw data stack. In the second step, all the z slices of the image stack are deconvolved using 2D PSFs
sampled from system PSF at correspondingly aligned z positions. For time-lapse datasets, PSF and stack alignment is calculated using the first time point data,
which is then used to deconvolve all the time points (second step). Scale bar, 100 mm.
S4 Cell 163, 1796–1806, December 17, 2015 ª2015 Elsevier Inc.
Page 17
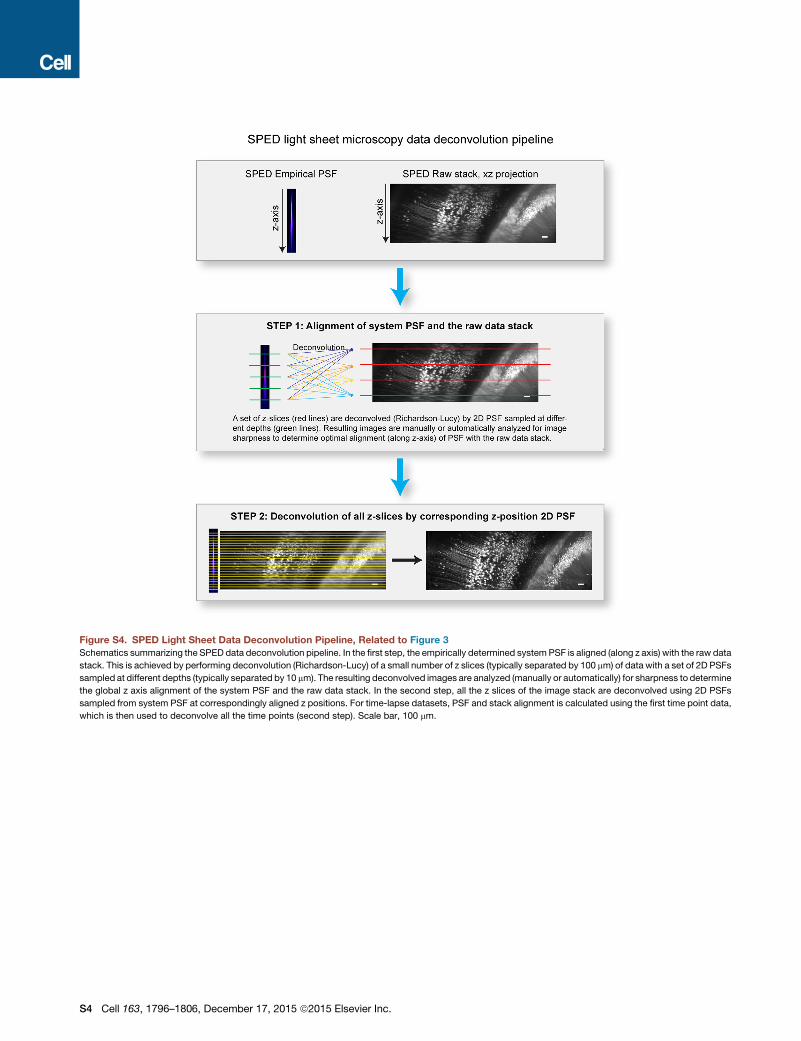
Figure S5. Comparison of Raw and Deconvolved SPED Light Sheet Data Stack, Related to Figure 4
A consecutive series of optical sections (50 mm thick) is shown to demonstrate image quality enhancement after deconvolution. Data were acquired from a 10 dpf
Tg(elavl3:H2B-GCaMP6s) zebrafish larva using 43/0.28NA detection objective. Image volumes of 10 consecutive time points (arbitrarily chosen number to
increase labeled cell count) were combined into one volume by taking the maximum values of the voxels across the time points. Detailed volume rendering of the
image stack is shown in Figure 3A and Movie S3. Scale bar, 100 mm.
Cell 163, 1796–1806, December 17, 2015 ª2015 Elsevier Inc. S5
Page 18
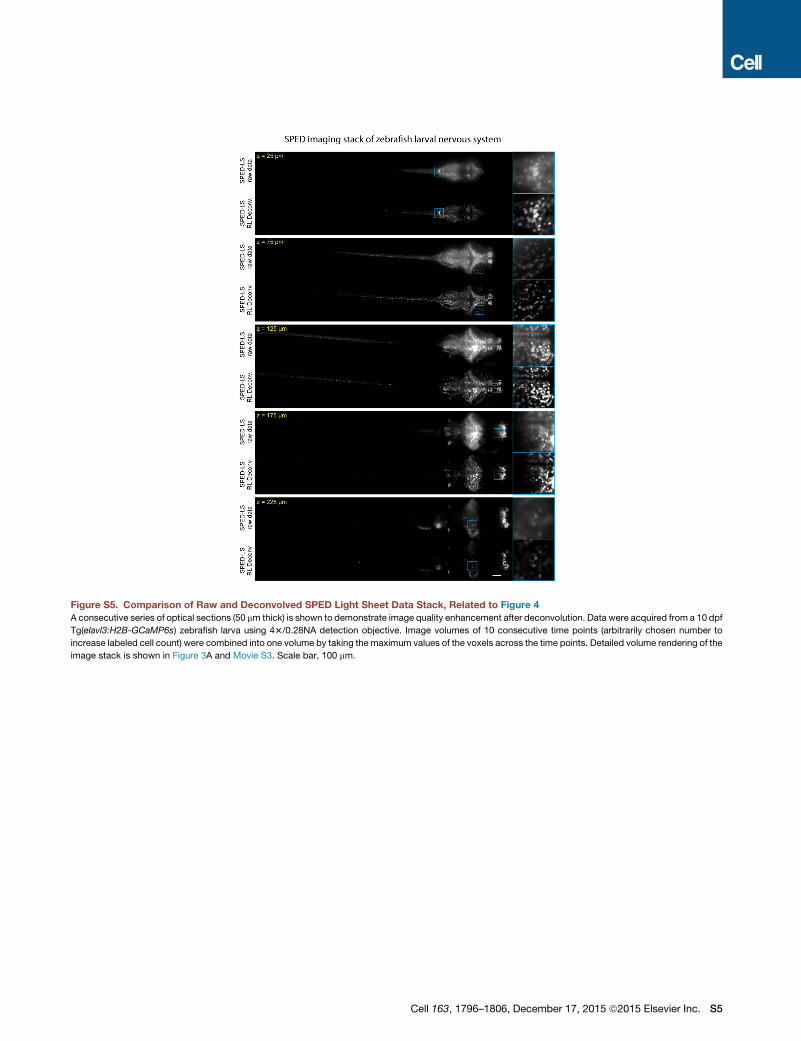
Figure S6. Neuronal Activity Time Series across the Intact Nervous System, Related to Figure 6
Neuronal activity traces (DF/F) are shown for top 99 most active neurons in the larval zebrafish nervous system (assessed by variance across the entire recording
duration), imaged using 43/0.28 NA objective at 6.23 volumes/second (3 mm3 0.5 mm3 0.2 mm, 39 z slices), 43/0.28 NA objective at 12 volumes per second
(0.9 mm3 0.4 mm3 0.2 mm, 40 z slices) and 103/0.25 NA objective at 4.14 volumes per second (1.2 mm3 0.43 mm3 0.2 mm, 39 z slices). Spatial distribution
of identified cells is overlaid on the maximum intensity projection image of voxel-wise SD across the entire recording duration. Scale bars, 100 mm.
S6 Cell 163, 1796–1806, December 17, 2015 ª2015 Elsevier Inc.