0 196/0202/85/0603-036S$02 00/0 Copyright (c 1985 by The Williams & Wilk~ns Co EAR AND HFARING Vol. 6. No. 3 Supplement Prin/d in U.S.A. Speech and Language Results in Children with a Cochlear Implant Karen ller Kirk, and Carolyn Hill-Brown House Ear Institute, Los Angeles, California ABSTRACT At the House Ear Institute, speech and language assessments are a regular part of the evaluation protocol for the cochlear implant clinical trials in children. The assessments are con- ducted preimplant and at specific postimplant intervals. Paired comparisons of the children’s performance at pre- and post- implant intervals reveal significant improvements in both imitative and spontaneous speech production abilities. However, some differences between groups are noted. Children implanted at an early age demonstrate a greater number of significant improve- ments in speech production, while children using oral communi- cation have better skills at all test intervals. In addition, significant improvements on three of the four receptive language measures and one of the four expressive language measures are demon- strated at the 6-mo postimplant test interval. A significant de- crease in performance is noted for one receptive language meas- ure. In a second study, the speech scores of control groups and postimplantgroups of the same age (3,4, or 5 yr) are compared. Implanted children score higher in all but one of 24 contrasts, and these differences are statistically significant in five of the comparisons. The progression of phonological and language devel- opment in children is well documented in the literature. Although the ages at which certain stages of development occur may vary, the sequence in which these stages occur is usually constant.27 Receptively, infants begin to differentiate between var- ious intensity levels almost immediately after birth and, by 1 week, exhibit gross frequency differentiation. By 6 weeks, infants pay more attention to speech than to other sounds, discriminate between voiced and unvoiced sounds, and prefer female to male voices.44 Expressively, reflexive vocalizations begin at birth and the child begins to proceed through the stages of develop- ment, which include pleasure sounds, vocal play, and babbling, until the first meaningful words begin to occur at or soon after 1 yr of age.3,27.46.5i Stress patterns begin to emerge during the babbling stages” along with pitch and/or intonational contour^.^.^^. According to Templin,” most children (75%) have ac- quired all the vowels and diphthongs by age 3 yr; by 7 yr of age most children (75%) are able to produce all the phonemes with the exception of /M/. Consonant blends are usually mastered by 8 yr of age, and phonological development has usually reached maturity by that time.27.46 By age 4% yr children are producing complex sentences. Estimates vary as to the vocabulary level attained by 5-yr- old children; Dale’ has reported an average of 2,000 words, while Schwab4’ has reported levels of 5,000 to 26,000 words. Nober and N ~ b e r ~ ~ state that most children have developed syntactic and morphological skills by age 5 yr and grammatical skills are fully developed by 8 yr of age. The major growth after this point is in vocabulary. By age 10 to 12 yr, most children have reached linguistic matu- Natural acquisition of speech and language skills is not often seen in those with profound hearing losses. One of the primary goals in fitting a deaf child with an auditory prosthesis (hearing aid or cochlear implant) is to improve the ease and the extent to which that child might be able to acquire these communication skills. Before the potential impact of a cochlear implant can be discussed, it is im- portant to be familiar with the known effects of hearing loss on speech and language development. It should be kept in mind that the children under discussion typically are not deaf children of deaf parents who acquire Ameri- can Sign Language as their native language. Speech and voice characteristics of deaf persons are generally acknowledged to differ si nificantly from those of hearing speakers. 1.16.28.3g, 32.34-36,43.44.51.58 It is well documented that a congenital or prelingually acquired hearing loss reduces the intelligibility of a deaf speaker and impairs the production of the nonsegmental and segmental aspects of Difficulties with the segmental aspects of speech include problems with the articulation of vowels and consonants, such as substitutions, distortions, and omission^;'^. 59 ex- cessive use of the neutral vowel /a/;” lack of adequate differentiation between various vowels;2q 22 and failure to differentiate between voiced and voiceless conso- nants.6, 29. ” While many deaf speakers can correctly pro- duce the phonemes in isolation, they are still unable to smoothly combine the phonemes in connected speech. Unintelligible speech is the result. rity.46 25* 26. 31. 45. 50 36s
Transcript
0 196/0202/85/0603-036S$02 00/0
Copyright (c 1985 by The Williams & Wilk~ns Co E A R AND H F A R I N G Vol. 6. No. 3 Supplement
P r i n / d in U.S .A.
Speech and Language Results in Children with a Cochlear Implant Karen ller Kirk, and Carolyn Hill-Brown
House Ear Institute, Los Angeles, California
ABSTRACT
At the House Ear Institute, speech and language assessments are a regular part of the evaluation protocol for the cochlear implant clinical trials in children. The assessments are con- ducted preimplant and at specific postimplant intervals. Paired comparisons of the children’s performance at pre- and post- implant intervals reveal significant improvements in both imitative and spontaneous speech production abilities. However, some differences between groups are noted. Children implanted at an early age demonstrate a greater number of significant improve- ments in speech production, while children using oral communi- cation have better skills at all test intervals. In addition, significant improvements on three of the four receptive language measures and one of the four expressive language measures are demon- strated at the 6-mo postimplant test interval. A significant de- crease in performance is noted for one receptive language meas- ure. In a second study, the speech scores of control groups and postimplant groups of the same age (3,4, or 5 yr) are compared. Implanted children score higher in all but one of 24 contrasts, and these differences are statistically significant in five of the comparisons.
The progression of phonological and language devel- opment in children is well documented in the literature. Although the ages at which certain stages of development occur may vary, the sequence in which these stages occur is usually constant.27
Receptively, infants begin to differentiate between var- ious intensity levels almost immediately after birth and, by 1 week, exhibit gross frequency differentiation. By 6 weeks, infants pay more attention to speech than to other sounds, discriminate between voiced and unvoiced sounds, and prefer female to male voices.44
Expressively, reflexive vocalizations begin at birth and the child begins to proceed through the stages of develop- ment, which include pleasure sounds, vocal play, and babbling, until the first meaningful words begin to occur at or soon after 1 yr of age.3,27.46.5i Stress patterns begin to emerge during the babbling stages” along with pitch and/or intonational contour^.^.^^.
According to Templin,” most children (75%) have ac- quired all the vowels and diphthongs by age 3 yr; by 7 yr
of age most children (75%) are able to produce all the phonemes with the exception of /M/. Consonant blends are usually mastered by 8 yr of age, and phonological development has usually reached maturity by that time.27.46
By age 4% yr children are producing complex sentences. Estimates vary as to the vocabulary level attained by 5-yr- old children; Dale’ has reported an average of 2,000 words, while Schwab4’ has reported levels of 5,000 to 26,000 words. Nober and N ~ b e r ~ ~ state that most children have developed syntactic and morphological skills by age 5 yr and grammatical skills are fully developed by 8 yr of age. The major growth after this point is in vocabulary. By age 10 to 12 yr, most children have reached linguistic matu-
Natural acquisition of speech and language skills is not often seen in those with profound hearing losses. One of the primary goals in fitting a deaf child with an auditory prosthesis (hearing aid or cochlear implant) is to improve the ease and the extent to which that child might be able to acquire these communication skills. Before the potential impact of a cochlear implant can be discussed, it is im- portant to be familiar with the known effects of hearing loss on speech and language development. It should be kept in mind that the children under discussion typically are not deaf children of deaf parents who acquire Ameri- can Sign Language as their native language.
Speech and voice characteristics of deaf persons are generally acknowledged to differ si nificantly from those of hearing speakers. 1.16.28.3g, 32.34-36,43.44.51.58 It is well documented that a congenital or prelingually acquired hearing loss reduces the intelligibility of a deaf speaker and impairs the production of the nonsegmental and segmental aspects of
Difficulties with the segmental aspects of speech include problems with the articulation of vowels and consonants, such as substitutions, distortions, and omission^;'^. 59 ex- cessive use of the neutral vowel /a/;” lack of adequate differentiation between various vowels;2q 22 and failure to differentiate between voiced and voiceless conso- nants.6, 29. ” While many deaf speakers can correctly pro- duce the phonemes in isolation, they are still unable to smoothly combine the phonemes in connected speech. Unintelligible speech is the result.
rity.46
25* 26. 31. 45. 50
36s
Speech and Language 37s
Timing and rhythm, pitch and intonation, and voice quality comprise the nonsegmental aspects of speech or voice production. Errors in the production of nonsegmen- tals have been noted and classified by N i ~ k e r s o n , ~ ~ whose categories are used here.
Timing and Rhythm Deaf speakers tend to speak slowly and often prolong syllables and/or sentences. Their slower speaking rate negatively affects the rhythm or the quality of speech.“.”.” They also insert inappropriate or frequent pauses in their ~peech.~’
Pitch and Intonation Deaf speakers frequently dem- onstrate differences in pitch and intonation.26. 5 5 They generally have a higher fundamental frequency than nor- mal hearing speakers.2,43 They vary pitch less than normal hearing speakers, producing a monotone,16 or show exces- sive pitch variation, resulting in pitch breaks and abrupt
Voice Quality According to a study by CalveG6 the most common descriptors used to describe the voice qual- ity of the deaf are “tense,” “flat,” “breathy,” “harsh,” and “throaty.” Voicing of deaf speakers may be too loud or too soft, or it may vary errat i~al ly .~~ Finally, deaf speakers frequently produce speech which is judged to be hyper-
The detrimental effects of a hearing loss are not limited to speech production skills. Difficulties with both the semantic and syntactic aspects are often noted in the language of deaf children. Deaf children are likely to have a restricted vocabulary. As noted previously, a normal- hearing 5-yr-old may have a vocabulary of anywhere from 2,000 to 26,000 words. An average, profoundly deaf child of the same age may have a vocabulary of only 250 words.8 Deaf children demonstrate delayed acquisition and use of pronouns, prepositions, adjectives, and conjunctions. More difficult semantic structures such as jargon, slang, idioms, homonyms, synonyms, antonyms, and modifiers are also incorrectly
When compared to their normal hearing peers, deaf children’s syntactic constructions are rigid and stereo- typed. Difficulties with verb tense agreement, passive tense, negation, question forms, and auxiliaries are com-
have stated that normal- hearing children have reached linguistic maturity by the age of 10 to 12 yr. However, Russell et aI4’ found that deaf children often did not master the simple noun phrase or verb phrase constructions until 10 yr of age. After studying the language skills of 450 deaf 18-yr-olds, Quigley and concluded that these children had lower skills than 8-yr-old, normal-hearing children. In a study on the syntactic skills of hearing-impaired children aged 6 to 15 yr, Geers and MoogI4 found that the majority of the children obtained scores below the average performance of the normal-hearing 3-yr-olds who were also tested. Clearly, the effects of a hearing loss on language skills can be extremely deleterious.
The extent to which speech and language development will be affected by a hearing loss varies according to the age at onset. Although a majority of the speech sounds in English are mastered by age 4 yr, and most of the gram- matical categories by 5 yr, it is not until the age of 8 yr that a normal-hearing child has fully mastered grammar
changes. I . 26.43.52
nasai.53
Quigley and man. 10. 14.44.47
and phonology, and has an extensive vocabulary.44 Thus, auditory deprivation early in life has serious consequences for subsequent development.’ In general, children with early, prelingual hearing losses more frequently display deficits in the respiratory, articulatory, and phonatory aspects of speech.’, lo. 19.44 Three important periods for onset of hearing loss have been described by de Quiros:” hearing loss during the first 2 yr of life, hearing loss between 2 and 5 yr, and after the age of 5 . If profound deafness occurs prior to 2 yr of age, speech will be severely disturbed. Hearing losses which occur between 2 and 5 yr of age will result in the loss of speech skills unless intensive training is provided. Finally, the author suggests that deafness which occurs after the age of 5 yr will result in inappropriate articulation.
Nober and N ~ b e r ~ ~ agree that the earlier the deafness occurs, the more marked the effects on speech develop- ment. They also point out the importance of age at onset for language development. They state:
. . . speech and language can emerge as relatively separate entities; hence, good speech does not ensure good language, nor does good language ensure good speech. These two independents may vary relative to age at onset of the hearing impairment. (p. 632) These authors suggest that once speech and language
have been firmly established, deafness would rarely affect the language process, although speech might rapidly de- teriorate. Hearing losses which occur between the range of 8 yr and adulthood may not cause significant language delays if programmed remediation and therapy are pro- vided to the child. These authors state that congenitally hearing-impaired children may never be able to achieve the language skills of adventitiously deafened children, even if the congenitally impaired have superior residual hearing.
Age at onset of hearing loss is not the only important prognostic indicator for speech and language development in hearing-impaired children. A second critical factor is the degree of hearing loss. In the classic study by Hudgins and Numbers,” they described an inverse relationship between articulatory errors and audiometric scores. Other authors have suggested that speech intelli ‘bility decreases as the degree of hearing loss increases.20, 6. 33 In addition, degree of hearing loss influences both linguistic and social de~elopment.~’ Several authors have recently described the effect of degree of hearing loss on speech and language development. lo. 44, 46 According to Quigley and chil- dren with a 41 to 55 dB (International Standards Organi- zation, IS0)l8 hearing level may exhibit limited vocabulary and speech anomalies: a 56 to 70 dB (ISO) hearing level may result in defective speech, deficiencies in language usage and comprehension, and limited vocabulary; while children with either a 71 to 90 dB (ISO) or a 91 dB or more (ISO) hearing level will be unlikely to spontaneously develop speech and language if the loss occurs before the age of 1 yr, or will have defective speech and language which will deteriorate, if the loss occurs after that time.
Since the early years in a child’s life (up to age 5 yr) are the time at which speech and language rapidly develop, the importance of early intervention, including suitable amplification where beneficial, can be seen. It is generally
!?
38s Kirk, and Hill-Brown
agreed that such intervention procedures are most effective when initiated as early as possible after the identification of the hearing According to Ling,24 the motor skills required for speech can be learned at any time, but they are most likely to be transferred to the spontaneous level if the child has not already developed firmly established error patterns. Intervention techniques should not only be initiated at an early stage, but should also mirror the normally hearing child’s pattern of d e ~ e l o p m e n t . ~ ~ . 5 ’
The important role of auditory information in speech and language development has been described above. Few would disagree that the hearing-impaired child should be provided with amplification whenever possible. However, for some profoundly deaf children, conventional amplifi- cation provides little or no benefit in the detection and comprehension of linguistic and nonlinguistic sounds. Until recently, these children have had no available alter- native to conventional amplification. Now, however, the single-channel cochlear implant has been made available to selected children, and its effect on speech and language skills is being investigated.
Little is yet known about the effect of long-term cochlear implant stimulation. For those children who cannot ben- efit from traditional hearing aids, the addition of sound through the cochlear implant may result in improved speech and/or language skills. During the last 2 yr, a study has been ongoing at the House Ear Institute to evaluate the effects of cochlear implant stimulation on the speech and language skills of implanted children. The purposes of this study are to evaluate speech and language skills over long term cochlear implant use, and to determine whether age at time of implantation or the child’s com- munication method affect the acquisition of speech and language skills.
STUDY ONE: REPEATED MEASURES
Method Subjects The subjects consisted of all children (<18 yr of
age) implanted by the House Ear Institute for whom both preim- plant and postimplant testing data were available.
Procedures All speech and language evaluations were con- ducted by certified and licensed speech-language pathologists at the Center for Deaf Children of the House Ear Institute.
All children received speech and language testing prior to cochlear implant surgery. Children through 7 yr of age were tested every 6 mo after receiving the external portion of their equipment and completing a brief training program designed to introduce sound through the device (Basic Guidance). Children 8 yr of age or greater were tested 6 mo postimplant, then annually thereafter.
Each child was tested using the method of communication used most frequently at home and at school, whether that was oral communication, total communication, or Cued Speech. When total communication was used, Signed English was used for the manual component. It was necessary to use parents for interpreters for those children who used Cued Speech.
Materials Children were assessed in the areas of speech production, receptive language, and expressive language. The tests used are listed below. At least one test in each content area was administered. Choice of test was determined for each child on the basis of age and skill level.
Speech Production ( 1 ) Phonetic Level Speech Evaluation.23 (2) Phonologic Level Speech Evalua t i~n .~~
Both of these evaluations are thoroughly described by Ling.z3 Both evaluations examine five sequential areas of speech pro- duction: ( 1 ) production of undifferentiated vocalization; (2) pro- duction of nonsegmental voice patterns varied in duration, in- tensity, and pitch; (3) production of vowels; (4) production of simple consonants in all positions in combination with different vowels; and ( 5 ) production of consonant blends in all positions in combination with different vowels. The Phonetic Level Speech Evaluation analyzes imitation of nonsense syllables. The Phon- ologic Level Speech Evaluation analyzes production in sponta- neous speech.
For the Phonetic Level Speech Evaluation, the various seg- mental aspects are tested in increasingly complex phonetic en- vironments to assess the automaticity of the child’s production. For example, a child is asked to imitatively produce vowels and diphthongs in a single syllable (/ba/), in a repeated syllable (/baba/), in alternated syllables (/babibabi/), and while varying the pitch. Simple consonants and consonant blends are tested in single and repeated syllables only.
In the standard presentation of the test, each nonsegmental and segmental aspect is judged as being produced consistently, inconsistently, or not at all. For this study, the test was quantified by assigning a numerical value to each type of response (consist- ent, inconsistent, or not at all) depending upon the phonetic environment. Thus, if a child were unable to imitatively produce a particular vowel or diphthong, the score would be 0; if it was inconsistently produced in a single syllable, the score would be 1; if it was consistently produced in a single syllable the score would be 2, etc. Consistently produced while varying pitch, the most complex environment, would yield a score of 8. The minimum score for nonsegmentals, simple consonants and con- sonant blends was zero. The maximum was six for nonsegmen- tals and four for the remaining categories. (Consonants were evaluated with different vowels; to be judged consistent, each consonant had to be produced consistently across vowels.) The values for each item in a category (nonsegmentals, vowels and diphthongs, simple consonants, word-initial blends, and word- final blends) were added to produce a total for that category.
The Phonologic Level Speech Evaluation is designed to assess a child’s ability to spontaneously produce the nonsegmental and segmental aspects of speech. Some type of spontaneous speech sample must first be collected before this evaluation can be completed. Again, each response was judged as produced con- sistently, inconsistently, or not at all. Numerical values from 0 to 2 were assigned and values were summed as described above.
Receptive Language 1. Peabody Picture Vocabulary Test (PPVT).” The PPVT
measures a child’s vocabulary recognition age. The standard presentation requires the child to point to pictures as they are spoken by the examiner. This test has normative data for normal- hearing children. It can be presented verbally to children who speechread. For some older children an additional written mode was provided. It is used to give some idea of the child’s vocabulary recognition skills, and to measure growth in this area over time.
2. Test for Auditory Comprehension of Language.’ This test assesses the child’s receptive knowledge of various vocabulary items along with morphological constructions, grammatical cat- egories, and syntactic structures. Again, it is used to measure a child’s growth in this area over time.
3. SKI*HI Language Development Scale.56 This evaluation is designed to assess the receptive and expressive language skills of hearing-impaired children ages 0 to 5 yr. Parents are provided with a list of observable language skills which a child would demonstrate at certain age levels. The parent is instructed to
Speech and Language 39s
observe the child for 1 week, marking on the list each skill observed. The point at which the child is demonstrating only half of the skills is the stopping point. Children are not penalized for the use of total communication or for misarticulations. Auditory items are not emphasized. An age equivalency for receptive and expressive language is derived from normative data on hearing-impaired children. 4. Grammatical Analysis of Elicited Language-Pre-Sentence
Level.40 This evaluation consists of a variety of toys and play activities designed to evaluate the receptive and expressive lan- guage of a child who is not yet comprehending or producing sentences. Percentile scores are derived for comprehension, prompted responses, and imitated responses. Normative data is provided on hearing-impaired children. Mean scores for the different age groups are available for hearing-impaired children educated in oral settings and for normal-hearing children.
Expressive Language I . Grammatical Analysis of Elicited Language-Pre-Sentence
Level (GAEL-P) (as described above).40 2. Grammatical Analysis of Elicited Language-Simple Sen-
tence Level (GAEL-S).38 This test evokes specific language struc- tures, which may not occur in a spontaneous sample of language, through the use of toys and activities provided in the GAEL-S kit. Both prompted and elicited imitative responses are required for each structure. Normative data are available for normally- hearing children and hearing-impaired children educated in oral settings; data are being collected by the test authors on the performance of profoundly deaf children.
3. Grammatical Analysis of Elicited Language-Complex Sentence Level (GAEL-C).39 This test evokes special language structures, which may not occur in a spontaneous sample of language, through the use of toys and activities provided in the GAEL-C kit. Both prompted and elicited imitative responses are required for each structure. Normative data are available for normally hearing children and for severely hearing-impaired and profoundly deaf children educated in oral settings. 4. SKI*HI Language Development Scales6 (as described
above). In addition to information obtained from administering the
assessment battery, the following data were collected for each implanted child: (1 ) age at onset of hearing loss, (2) age at each test interval, and (3) communication method used at home and at school.
RESULTS
As of July 1984, a total of 78 children have received pre- and/or postimplant speech and language testing at the House Ear Institute. Table 1 presents the number of children using each communication method and their age at onset of hearing loss. The majority of implanted chil- dren use total communication at home and at school.
Table 1. Number of children, mean age at onset of hearing loss, and range of age at onset by communication method
Mean Age at Range of Age
Communication Onset At Onset Method N (in mo) (in mo)
Total communication 55 12.4 0-66 Oral communication 20 44.9 0-1 26 Cued Speech 3 8.7 8-10 Total 78 20.6 0-1 26
Table 2. Numbers of children with prelingual vs postlingual hearing loss by communication method
Prelingual (age Postlingual (age Communication at onset at onset
Method c 2.0 yr) h 2.0 yr) Total
Total communication 43 12 55 Oral communication 4 16 20 Cued Speech 3 0 3 Total 50 28 78
Most of the remaining children use some form of oral communication; only three of the implanted children use Cued Speech. It is important to note that the children who use oral communication had a mean age at onset almost three years greater than the mean age at onset for the total communication children.
Table 2 presents the number of children with prelingual versus postlingual hearing losses. A prelingual hearing loss is defined as age at onset of less than 2 yr. Any hearing loss which occurred at the age of 2 yr or greater was defined as a postlingual hearing loss. Fifty of the implanted children to date have had prelingual hearing losses, and of these, 43 use total communication. Of the 20 children who use oral communication, 16 had postlingual hearing losses. The remaining 12 children with postlingual hearing losses use total communication.
The data obtained from speech and language testing were subjected to statistical analyses. Preimplant scores were compared to postimplant scores obtained at the 6- mo and 1 -yr test intervals. Paired comparison t-tests were conducted to measure each child‘s progress over time. (The Wilcoxon matched-pairs signed-ranks test, a nonpar- ametric statistic, was used for the analysis of the sponta- neous production of nonsegmentals due to the sample sizes and/or distribution characteristics.)
As the program was beginning, different assessment procedures were tried before the final protocol was chosen. Thus, not every child has preimplant data available for the tests analyzed here. At the present time, 39 children have had both preimplant and 6-mo postimplant imitative speech testing, and 37 have had preimplant and 6-mo postimplant spontaneous speech testing. Seventeen chil- dren have had both preimplant and I-yr postimplant imitative and spontaneous speech testing. The most no- ticeable changes in the children’s performances to date have been in the area of speech production. These results are presented below, followed by language results.
Speech Production Imitative Speech The mean imitative speech produc-
tion scores for those children tested at either the preim- plant, the 6-mo postimplant, or the I-yr postimplant test intervals are presented in Table 3. There was a general trend for the children’s imitation of nonsense syllables to improve with increased implant experience, particularly by the 1-yr postimplant interval. Table 4 presents the results of paired comparisons for imitative speech skills at pre- and postimplant intervals for those children who had
40s Kirk, and Hill-Brown
both preimplant and postimplant testing, and for children according to age category. The mean differences in imi- tative speech scores were obtained by subtracting each child's preimplant score from his or her postimplant scores. A positive difference indicates an increase in per- formance, while a negative difference indicates a decrease in performance. This table presents the mean differences for paired comparisons only. Please note that the overall means of children tested at any of the preimplant, 6-mo postimplant, or 1 -yr postimplant intervals and the possible range of scores are presented in Table 3.
At the 6-mo postimplant testing, the children as a group demonstrated significant improvement in their ability to imitatively produce all of the nonsegmental aspects of speech including vocal duration, intensity, and pitch. They also showed significant improvement in their ability to imitatively produce vowels, diphthongs, and consonants. No significant differences were noted in their ability to imitatively produce the consonant blends. These results were maintained at the I-yr postimplant interval.
Table 3. Mean imitative speech production scores for all implanted children tested at preimplant. 6-mo postimplant, and 1 -yr postimplant intervals
When the imitative speech skills of the children tested preimplant, 6 mo postimplant, and 1 yr postimplant were examined according to age category, differences between the groups were noted. The children were divided into three groups: age group 1 (2 to 5 yr); age group 2 (6 to 12 yr); age group 3 (13 to 18 yr). At both test intervals, the children in age group 1 demonstrated the greatest number of significant improvements in the production of all non- segmental aspects, and in the production of diphthongs, and simple consonants at 6 mo postimplant. With the exception of vocal pitch, these same significant improve- ments were noted at the I-yr postimplant evaluation.
At the preimplant testing, the children in age group 2 demonstrated more consistent imitative productions of both the nonsegmental and segmental aspects of speech than did those children in age group 1. Age group 2 showed improvements in both the nonsegmental and segmental aspects of speech; improvements in the production of vowels and diphthongs and simple consonants were sig- nificant at 6-mo and/or I -yr postimplant evaluations.
For age group 3, improvements were noted for nonseg- mental skills as a whole, vocal intensity, and consonant blends at the 6-mo postimplant interval. Vocal intensity also improved at the 1 -yr postimplant interval. However, none of these improvements was statistically significant. A decrease in performance was noted for some nonseg- mental and segmental skills, but again these were not significant.
When the children's preimplant and postimplant imi- tative speech skills were examined according to type of communication method, it was evident that the oral chil- dren had better skills in all areas. This is not an unexpected finding when the mean age at onset of hearing loss is considered. Table 5 presents the results of paired compar- isons for imitative speech skills at pre- versus postimplant intervals for those children who had both pre- and postim- plant testing. The results are presented separately for chil- dren by communication group. Total communication children demonstrated significant improvements in all
Table 4. Mean differences in imitative speech scores between preimplant and postimplant test intervals for all children, and for children according to each age category'
Preimplant vs 6 Mo Postimplant Preimplant vs 1 Yr Postimplant
Phonetic Level All 2-5 Yr 6-12 Yr 13-18 Yr All 2-5 Yr 6-12 Yr 13-18 Yr Speech Evaluation (N=39) (N=20) (N= 15) (N=4) (N= 17) (N=8) (N= 8) (N= 1)
Differences obtained by subtracting the preimplant from the postimplant scores; a positive difference represents an increase in performance, while a negative difference indicates a decrease in performance.
bp 5 0.001. "p c 0.07. dp c 0.05.
Speech and Language 41 s
Table 5. Mean differences in imitative speech scores between preimplant and postimplant test intervals for all children, and for total communication children (TC) and oral communication children (OC)"
~~
Preimplant vs 6 Mo Postimplant Preimplant vs 1 Yr Postimplant
a Differences obtained by subtracting the preimplant from the postimplant scores; a positive difference represents an increase in performance, while a negative difference represents a decrease in performance.
Includes one one or more children who use Cued Speech. "p 5 0.007. 'p 5 0.07. "p 5 0.05.
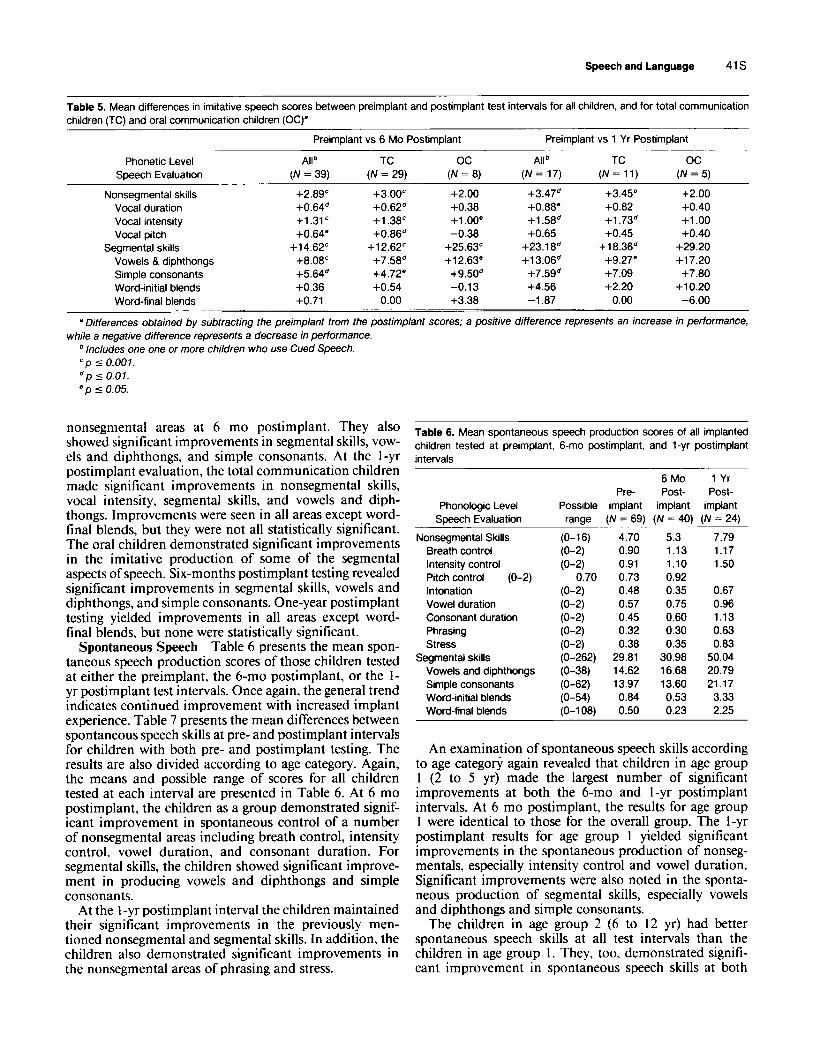
nonsegmental areas at 6 mo postimplant. They also showed significant improvements in segmental skills, vow- els and diphthongs, and simple consonants. At the 1-yr postimplant evaluation, the total communication children made significant improvements in nonsegmental skills, vocal intensity, segmental skills, and vowels and diph- thongs. Improvements were seen in all areas except word- final blends, but they were not all statistically significant. The oral children demonstrated significant improvements in the imitative production of some of the segmental aspects of speech. Six-months postimplant testing revealed significant improvements in segmental skills, vowels and diphthongs, and simple consonants. One-year postimplant testing yielded improvements in all areas except word- final blends, but none were statistically significant.
Spontaneous Speech Table 6 presents the mean spon- taneous speech production scores of those children tested at either the preimplant, the 6-mo postimplant, or the 1- yr postimplant test intervals. Once again, the general trend indicates continued improvement with increased implant experience. Table 7 presents the mean differences between spontaneous speech skills at pre- and postimplant intervals for children with both pre- and postimplant testing. The results are also divided according to age category. Again, the means and possible range of scores for all children tested at each interval are presented in Table 6. At 6 mo postimplant, the children as a group demonstrated signif- icant improvement in spontaneous control of a number of nonsegmental areas including breath control, intensity control, vowel duration, and consonant duration. For segmental skills, the children showed significant improve- ment in producing vowels and diphthongs and simple consonants.
At the 1-yr postimplant interval the children maintained their significant improvements in the previously men- tioned nonsegmental and segmental skills. In addition, the children also demonstrated significant improvements in the nonsegmental areas of phrasing and stress.
Table 6. Mean spontaneous speech production scores of all implanted children tested at preimplant, 6-mo postimplant, and 1 -yr postimplant intervals
An examination of spontaneous speech skills according to age category again revealed that children in age group 1 (2 to 5 yr) made the largest number of significant improvements at both the 6-mo and I-yr postimplant intervals. At 6 mo postimplant, the results for age group 1 were identical to those for the overall group. The I-yr postimplant results for age group I yielded significant improvements in the spontaneous production of nonseg- mentals, especially intensity control and vowel duration. Significant improvements were also noted in the sponta- neous production of segmental skills, especially vowels and diphthongs and simple consonants.
The children in age group 2 (6 to 12 yr) had better spontaneous speech skills at all test intervals than the children in age group I . They, too, demonstrated signifi- cant improvement in spontaneous speech skills at both
42s Kirk, and Hill-Brown
Table 7. Mean differences in spontaneous speech scores between preimplant and postimplant test intervals for all children, and for children according to each age category"
Preimplant vs 6 Mo Postimplant Preimplant vs 1 Yr Postimplant
Phonologic Level All 2-5 Yr 6-12 Yr 13-18 Yr All 2-5 Yr 6-12 Yr 13-18 Yr Speech Evaluation (N=37) (N= 19) ( N = 15) (N=3) ( N = 17) (N=8) (N=8) ( N = 1)
a Differences obtained by subtracting the preimplant from the postimplant scores; a positive difference represents an increase in performance,
Due to the limited range of possible scores, the Wilcoxon matched-pairs signed-ranks test was used for the analysis of the spontaneous while a negative difference represents a decrease in performance.
nonsegmentals. Therefore, ranks rather than mean differences were the basis of the analysis. "p 5 0.007. "p 5 0.01. 'p 5 0.05.
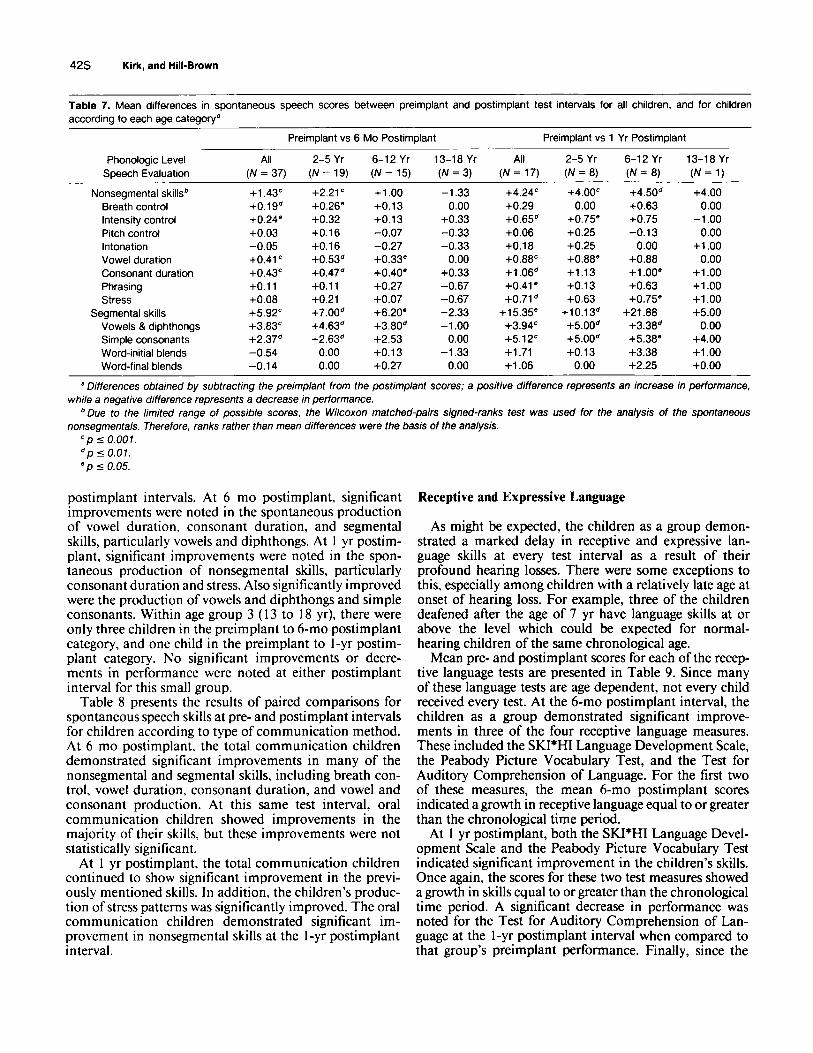
postimplant intervals. At 6 mo postimplant, significant improvements were noted in the spontaneous production of vowel duration, consonant duration, and segmental skills, particularly vowels and diphthongs. At 1 yr postim- plant, significant improvements were noted in the spon- taneous production of nonsegmental skills, particularly consonant duration and stress. Also significantly improved were the production of vowels and diphthongs and simple consonants. Within age group 3 ( 13 to 18 yr), there were only three children in the preimplant to 6-mo postimplant category, and one child in the preimplant to 1-yr postim- plant category. No significant improvements or decre- ments in performance were noted at either postimplant interval for this small group.
Table 8 presents the results of paired comparisons for spontaneous speech skills at pre- and postimplant intervals for children according to type of communication method. At 6 mo postimplant, the total communication children demonstrated significant improvements in many of the nonsegmental and segmental skills, including breath con- trol, vowel duration, consonant duration, and vowel and consonant production. At this same test interval, oral communication children showed improvements in the majority of their skills, but these improvements were not statistically significant.
At 1 yr postimplant, the total communication children continued to show significant improvement in the previ- ously mentioned skills. In addition, the children's produc- tion of stress patterns was significantly improved. The oral communication children demonstrated significant im- provement in nonsegmental skills at the 1-yr postimplant interval.
Receptive and Expressive Language
As might be expected, the children as a group demon- strated a marked delay in receptive and expressive lan- guage skills at every test interval as a result of their profound hearing losses. There were some exceptions to this, especially among children with a relatively late age at onset of hearing loss. For example, three of the children deafened after the age of 7 yr have language skills at or above the level which could be expected for normal- hearing children of the same chronological age.
Mean pre- and postimplant scores for each of the recep- tive language tests are presented in Table 9. Since many of these language tests are age dependent, not every child received every test. At the 6-mo postimplant interval, the children as a group demonstrated significant improve- ments in three of the four receptive language measures. These included the SKI*HI Language Development Scale, the Peabody Picture Vocabulary Test, and the Test for Auditory Comprehension of Language. For the first two of these measures, the mean 6-mo postimplant scores indicated a growth in receptive language equal to or greater than the chronological time period.
At 1 yr postimplant, both the SKI*HI Language Devel- opment Scale and the Peabody Picture Vocabulary Test indicated significant improvement in the children's skills. Once again, the scores for these two test measures showed a growth in skills equal to or greater than the chronological time period. A significant decrease in performance was noted for the Test for Auditory Comprehension of Lan- guage at the 1-yr postimplant interval when compared to that group's preimplant performance. Finally, since the
Speech and Language 43s
Table 8. Mean differences in spontaneous speech scores between preimplant and postimplant test intervals for all children tested, and for total communication children (TC) and oral communication children (OCY
Preimplant vs 6 Mo Preimplant vs 1 Yr Postimplant Postimplant
a Differences obtained by subtracting the preimplant from the postimplant scores; a positive difference represents an increase in performance, while a negative difference represents a decrease in performance.
Includes one child who uses Cued Speech. "p 5 0.007. 'p 5 0.07. *p 5 0.05.
Table 9. Mean receptive language scores for the preimplant vs 6 mo postimplant and the preimplant vs 1 yr postimplant paired comparison groups
6 Mo 1 Yr Test Preimplant Postimplant p 5 Preimplant Postimplant p 5
Age equivalency N = 8 32.05 mo 41.55 mo 0.05 N = 3 33.56 mo 45.25 mo 0.01
Age equivalency N = 11 64.21 mo 70.20 mo 0.05 N = 6 85.25 mo 108.33 mo 0.05
Ski' Hi Language Development Scale
Peabody Picture Vocabulary Test
Test for Auditory Comprehension of Language
Age equivalency N = 16 62.33 mo 66.29 mo 0.01 N = 7 75.60mo 69.50 mo 0.05 Grammatical Analysis of Elicited Lan-
guage-Pre-Sentence Level (comprehension score)
Percentile rank N = 5 57.50% 56.1 0% N = 7 NA' 65.71%
a NA, not applicable.
Grammatical Analysis of Elicited Language-Pre-Sen- tence Level was only recently published, preimplant data were not available for patients who received the device more than 1 yr ago.
Mean pre- and postimplant scores for the expressive language tests are presented in Table 10. Again, not every child received every test as the tests are age-dependent, and the number of children in these comparisons is quite small. At the 6-mo postimplant test interval, only one of the expressive language tests, the SKI*HI Language De- velopment Scale, showed significant improvement. This was the language scale completed by the parents of chil- dren aged 5 yr or younger. One year postimplant, scores from the expressive language test given to the children aged 8 to 12 yr were significantly improved.
STUDY TWO: CONTROL GROUPS
In the study previously described, significant gains were seen in several areas, especially in the development of speech skills. However, it is impossible to determine how much of this change was a direct result of the cochlear implant as opposed to devel- opmental gains or changes in training. The fact that improve- ments appeared early after the onset of implant stimulation is suggestive but not conclusive that these gains are tied to the introduction of the new prosthesis. Therefore, additional avenues of analysis were sought that might control for developmental factors.
The Phonetic Level Speech Evaluation and the Phonologic Level Speech Evaluation are used, in most situations, to deter- mine a baseline performance at the initiation of therapy and to measure the child's progress over time. They are clinical tools. Normative data are not available on these tests and, in their
44s Kirk, and Hill-Brown
Table 10. Mean expressive language scores for the preimplant vs 6 mo postimplant and the preimplant vs 1 yr postimplant paired comparison groups
6 Mo 1 Yr Test Preimplant Postimplant p 5 Preimplant Postimplant p 5
Ski' Hi Language Development Scale
Age equivalency N = 9 32.50 mo 35.73 mo 0.05 N = 3 32.11 mo 45.25 mo Grammatical Analysis of Elicited
Language-Pre-Sentence Level
Prompted percentile N = 2 40.00% 50.70% N = 7 NA' 50.71% Imitated percentile N = 2 60.00% 55.00% N = 7 NA 51.66%
Grammatical Analysis of Elicited Language-Simple Sentence Level
Prompted percentile N = 3 55.20% 56.57% N = 1 67.33% 90.00% Imitated percentile N = 3 54.aoo1~ 49.43% N = 1 70.00% 90.00%
Grammatical Analysis of Elicited Language-Complex Sen- tence Level
Prompted Percentile N = 5 52.29% 60.25% N = 4 68.50% 87.50% Imitated Percentile N = 5 5a.5701~ 67.63% N = 4 74.50% 92.1 7% 0.05
a NA, not applicable.
original form, it is not possible to quantify results or to compare implanted children's performance to that of their hearing-im- paired peers. The method of scoring described earlier, however, makes it possible to establish a procedure for this type of com- parison. The purpose of the following study is to compare speech scores of implanted children with those of other profoundly deaf children of the same age who have not been implanted, in an effort to determine if their skills are different.
The difficulty of defining and obtaining an appropriately matched control group has been discussed elsewhe~e.~ In the case of speech production skills, variables such as age, age at onset of hearing loss, communication method, educational history, and perhaps most importantly, residual hearing, are critical factors. As our subject population grows, however, we are able to develop a unique data base. The preimplant evaluations provide data that represent skill levels which would be expected for deaf children who meet the audiological and other criteria for implan- tation (i.e., control group). These skills can be compared to those ofchildren implanted at an earlier age who are now at the control group's age.
Eventually, critical variables besides age and audiological sta- tus can be controlled statistically as the number of subjects becomes large enough to do so. For the present, it was decided to proceed with an analysis for those age groups with enough subjects, though the sample size was often small. Although other key variables may not be controlled. use of the preimplant data from children who in most cases later received a cochlear implant represents the best possibility at matching, next to the subject- as-own-control procedure presented in Study One.
Both the control and the implanted groups of children were divided into three age categories (3 to 3-1 I , 4 to 4-1 I , and 5 to 5- I I yr). The implanted children were then further divided into groups according to length of use of the implant (6, 12, and 18 mo). There were no patient scores available for 3-yr-olds in the 12- and 18-mo postimplant category, and no scores were avail- able for 4-yr-olds at 18 mo postimplant. Due to the small numbers in each group, it was not possible at this time to control for age at onset of deafness or type of communication method. However, a mean age at onset was determined for each group. In all instances, these means were similar between paired groups (within 4.7 mo).
Some children who appeared in the control group for a partic- ular age were subsequently implanted and received postimplant testing while still in the same age category. In such a situation, these children were deleted from the control group since to include them would violate the statistical requirement of inde- pendence of the control and experimental groups. This occurred only in the comparison of control versus 6 mo postimplant and accounts for the variability of control group size within an age category. Statistical comparisons were made using the t-test for independent groups.
RESULTS
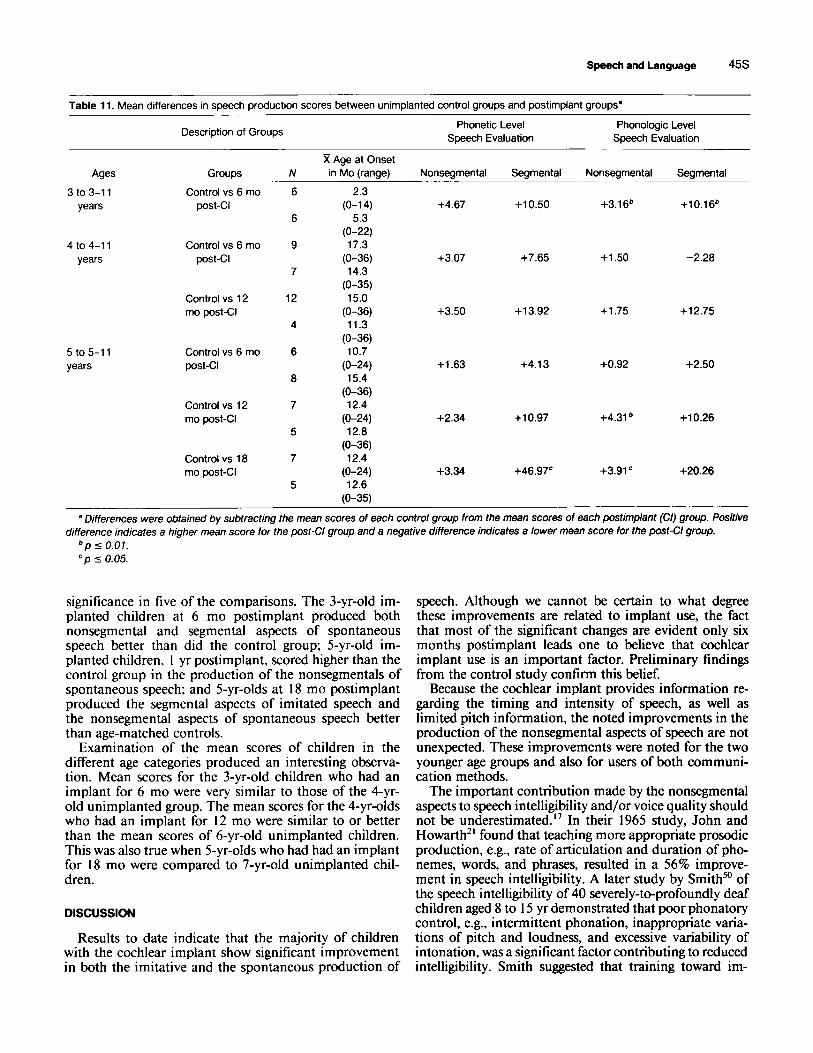
Table 1 1 presents the mean differences in test scores between the control and implanted groups for each age category. Differences were obtained by subtracting the mean scores of the control group from the mean scores of
Method Scores obtained as noted in Study One for the Phonetic Level
Speech Evaluation and the Phonologic Level Speech Evaluation were analyzed. Subjects were those children aged 3 to 6 yr who were assessed at the House Ear Institute for cochlear implanb- tion. Samples of older children were too limited, either for the control group or the implanted group, to be included at this time.
the implanted group. A positive difference indicates a higher mean score for the implanted group. A negative difference indicates a higher mean score for the control group. The number Of subjects in each group and the tnean and range of age at onset of deafness are also listed.
In all but one of the 24 contrasts, implanted children scored higher than their age-matched controls. In spite of the small sample sizes, these differences achieved statistical
Speech and Language 45s
Table 11. Mean differences in speech production scores between unimplanted control groups and postimplant groups”
Description of Groups Phonetic Level Phonologic Level Speech Evaluation Speech Evaluation
Ages Groups ~ _ _ _ _ _ ~ ~ _ _
3 to 3-1 1 Control vs 6 mo years post-CI
4 to 4-1 1 Control vs 6 mo years post-Cl
Control vs 12 mo post-Cl
5 to 5-11 years
Control vs 6 mo post-CI
Control vs 12 mo post-CI
Control vs 18 mo postGI
N R Age at Onset in Mo (range)
6
6
9
7
12
4
6
8
7
5
7
5
2.3 (0-1 4)
5.3 (0-22) 17.3
14.3
15.0
11.3
10.7
15.4
12.4 (0-24) 12.8
(0-36) 12.4
(0-24) 12.6
(0-36)
(0-35)
(0-36)
(0-36)
(0-24)
(0-36)
(0-35)
Nonsegmental
+4.67
+3.07
+3.50
+1.63
+2.34
+3.34
Segmental Nonsegmental Segmental
+10.50 +3.16’ +10.16’
+7.65 +1.50 -2.28
+13.92 +1.75 +12.75
+4.13 +0.92 +2.50
+10.97 +4.31 ’ +10.26
+46.97’ +3.91 ‘ +20.26
. .
a Differences were obtained by subtracting the mean scores of each control group from the mean scores of each postimplant (Cl) group. Positive
’ p 5 0.07. ‘ p 5 0.05.
difference indicates a higher mean score for the post-Cl group and a negative difference indicates a lower mean score for the post-CI group.
significance in five of the comparisons. The 3-yr-old im- planted children at 6 mo postimplant produced both nonsegmental and segmental aspects of spontaneous speech better than did the control group; 5-yr-old im- planted children, 1 yr postimplant, scored higher than the control group in the production of the nonsegmentals of spontaneous speech; and 5-yr-olds at I8 mo postimplant produced the segmental aspects of imitated speech and the nonsegmental aspects of spontaneous speech better than age-matched controls.
Examination of the mean scores of children in the different age categories produced an interesting observa- tion. Mean scores for the 3-yr-old children who had an implant for 6 mo were very similar to those of the 4-yr- old unimplanted group. The mean scores for the 4-yr-olds who had an implant for 12 mo were similar to or better than the mean scores of 6-yr-old unimplanted children. This was also true when 5-yr-olds who had had an implant for 18 mo were compared to 7-yr-old unimplanted chil- dren.
DISCUSSION
Results to date indicate that the majority of children with the cochlear implant show significant improvement in both the imitative and the spontaneous production of
speech. Although we cannot be certain to what degree these improvements are related to implant use, the fact that most of the significant changes are evident only six months postimplant leads one to believe that cochlear implant use is an important factor. Preliminary findings from the control study confirm this belief.
Because the cochlear implant provides information re- garding the timing and intensity of speech, as well as limited pitch information, the noted improvements in the production of the nonsegmental aspects of speech are not unexpected. These improvements were noted for the two younger age groups and also for users of both communi- cation methods.
The important contribution made by the nonsegmental aspects to speech intelligibility and/or voice quality should not be underestimated.” In their 1965 study, John and Howarth2’ found that teaching more appropriate prosodic production, e.g., rate of articulation and duration of pho- nemes, words, and phrases, resulted in a 56% improve- ment in speech intelligibility. A later study by Smith” of the speech intelligibility of 40 severely-to-profoundly deaf children aged 8 to 15 yr demonstrated that poor phonatory control, e.g., intermittent phonation, inappropriate varia- tions of pitch and loudness, and excessive variability of intonation, was a significant factor contributing to reduced intelligibility. Smith suggested that training toward im-
46s Kirk, and Hill-Brown
provement in the stress and intonation patterns of deaf speakers might enable listeners to compensate for pho- nemic errors.
These conclusions were supported by Osberger and L e ~ i t t ~ ~ who found that using a computer simulation to correct certain timing errors made by deaf speakers re- sulted in improved intelligibility ratings. Although the authors stated that improvements in timing could not compensate for a large number of phonemic errors, they did suggest that adequate control of timing may facilitate correct production of phonemes. Finally, Monsen” sug- gested that inappropriate timing contributes to the percep- tion of poor voice quality in deaf speakers. Monsen states: “There is a tendency for those hearing impaired subjects who produced aberrantly long words to be ranked as having poorer voice quality.” (p. 276)
It is interesting to note that although the implant pro- vides only limited information regarding the segmental aspects of speech (fundamental frequency, first formant information for vowels, and manner of production for consonants, but no second formant information for vowels and no place of production for consonants),” the children in this study exhibited significant improvements in their ability to imitate and spontaneously produce these ele- ments of speech. These improvements appear to be stable over time, at least up to age 13 yr, with continued im- provements being noted at each test interval.
While there is evidence that children can learn to pro- duce sounds which they are unable to acoustically per- ~ e i v e , ~ ~ this small but steady improvement in the produc- tion of segmentals is not typical for profoundly deaf chil- dren as a group. On the contrary, Hudgins and Numbers” found that as profoundly deaf children increased in age their speech production skills did not tend to improve, and in fact declined. It may be that some implanted children have the ability to use minimal auditory cues to maximum benefit.
A comparison of the children’s speech production skills by age at time of implant revealed several interesting differences. First, although some improvements were noted across age groups, the youngest children (2 to 5 yr) made the largest number of significant improvements. This might be expected since these children were still in that critical age period for speech and language develop- ment. In a study examining the effects of age on vowel learning by deaf children, Gulian et all’ also found that children made greater progress when they were still in the critical stage for speech and language acquisition.
Currently, only children in age group 3 (1 3 to 18 yr) have shown decrements in the production of several non- segmental and/or segmental skills following implantation, although none of these decrements was statistically signif- icant. Since the number of children within that age group is very small, it is difficult to know whether the size and direction of this change represents a consistent pattern. As mentioned previously, Hudgins and Numbers” have no- ticed a decline in speech skills as profoundly deaf children grow older, and the implanted children in this study may be following that trend. Another possibility is that these adolescent cochlear implant users initially find the sound distracting, but with increased use, will become accus-
tomed to it. In fact, this phenomenon has been reported by some adult cochlear implant users.” Finally, since these adolescents have had longer periods of auditory depriva- tion, it may be that they will require longer rehabilitation periods to demonstrate change.
Of particular interest is the finding that improved speech production skills were demonstrated by both total com- munication and oral children following implantation. Ac- tually, the total communication children made a greater number of significant improvements than did the oral children, although they started at a somewhat lower level. It has been suggested that the use of signs in conjunction with speech inhibits the acquisition of speech skills. Some believe that if a child is not forced to rely exclusively on speech for communication, he or she will not have the motivation to acquire those skills. This has not been true for the majority of total communication children who use the cochlear implant; they have demonstrated improved imitative and spontaneous speech production skills. In some cases, the children have attempted to communicate using speech alone in familiar situations or with familiar persons. This finding seems to lend credence to the asser- tion by Montgomery3’ that it is the hearing loss which is responsible for the lack of speech development, not man- ual communication.
Finally, it is interesting that the children showed a larger number of significant improvements in their receptive than in their expressive language skills. This may reflect the natural progression of comprehension preceding pro- duction.
Although early results seem encouraging, the number of subjects is small. Speech and language skills must be measured over time, as they take years to develop. Because the tests are age dependent, it is more difficult to gather long-term data. Additional experience with those children already implanted will be required before the benefits of the cochlear implant can be fully defined. Implications for Future Research
Although the implanted children have demonstrated improvements in most of the areas assessed, and especially in speech production skills, they still have a long way to go. Most of the prelingually deafened children do not have intelligible speech, and the vast majority of implanted children show marked language delays. Many years of intensive therapy are needed. However, it is hoped that the addition of sound through the cochlear implant will make the acquisition of those skills a little easier. The children currently implanted will continue to be evaluated in an effort to measure the long-term effects of cochlear implant stimulation.
Projects currently in progress at the House Ear Institute include a study designed to evaluate the pragmatic skills of preschool-aged profoundly deaf children within the child-caregiver dyad and to assess how the addition of a cochlear implant affects this interaction (L. McLean, and K. I . Kirk, in progress, 1985). A second study currently ongoing is designed to measure changes in the frequency of occurrence of vocalizations following implantation in children who use total communication (T. B. Sperling, K. I . Kirk, and C. Hill-Brown, in progress, 1985).
Speech and Language 47s
In the future we would like to examine in more detail the speech production improvements made by implanted children. In particular, we are interested in whether these improvements correlate with the type of auditory infor- mation provided by the implant (e.g., first formant infor- mation for vowels and manner of production for conso- nants). It is only through continued study that we will discover the ultimate benefits of the cochlear implant. This knowledge could have far-reaching implications for the medical management, education, and training of se- lected profoundly deaf children.
References
I .
7 -.
3.
4.
>.
Abberton. E., and A. J. Fourcin. 1975. Visual feedback and the acquisition of intonation. pp. 157-165. in E. H. Lenneberg. and E. Lennenberg. eds. Forin- durrorr.t o/ Lun,criu,ee D r v ~ ~ / o p r m w ~ Academic Press. New York. Angelocci A. A.. G. A. Kopp. and A. Holbrook. 1964. The vowel formants of deaf and normal-hearing eleven- to fourteen-year old boys. J. Speech Hear. Disord. 29. 159- 170. Bangs. T. E. 1968. Lun,yiiu,qc und I.curninp Di.\order.s ol / I r e Prr-.4cudemri~ C%i/d. Prentice-Hall. Inc.. Enelewood Cliffs. NJ. Berliner. K. I.. and L. S. Eisenberg. 1985. Methods and issues in the cochlear implantation of children: An overview. Ear Hear. (Suppl.) 6, 6s- 13.5. Binnie. C. A,. R. G. Daniloff. and H. W. Buckingham. Jr. 1982. Phonetic disintegration in a five-year-old following sudden hearing loss. J. Speech Hear. Disord. 47, I8 I - 189.
6. Calvert. D. R. 1962. Speech sound duration and the surd-sonant error. Volta Rev. 64. 401-402.
8. Dale. D. M. C. 1974. Lungiiu,gc, Dc~wlopmcnr in Drulund Parriullv Hearing Children. Charles C Thomas. Springfield. IL.
9. Davis. H. 1965. The young deaf child: Identification and management. Acta Oto-Laryngol. (Suppl. 206) 1-258.
10. de Quiros. J. B. 1980. Influence of hearing disorders on language development. Folia Phoniatr. 32, 103-1 18.
I I . Dunn. L. M. 1965. Piwhod>, Picrrirr I 'ocuhrr1ur.r Trsr. American Guidance Service. Circle Pines. MN.
12. Eisenberg. L. S. 1982. Use of the cochlear implant by the prelingually deaf. Ann. Otol. Rhinol. Laryngol. (Suppl. 91) 91, 62-66.
13. Eisenberg. L. S. 1985. Perceptual capabilites with the cochlear implant: Impli- cations for aural rehabilitation. Ear Hear. (Suppl.) 6, 60s-69s.
14. Geers. A. E.. and J. S. Moog. 1978. Syntactic maturity of spontaneous speech and elicited imitations of hearing-impaired children. J. Speech Hear. Disord. 43, 380-39 I .
15. Gulian. E.. P. Hinds. F. Fallside. and S. Brooks. 1983. Vowel-learning and the vowel system of deaf children: Age and feedback-related differences. J. Com- mun. Disord. 16,449-469.
16. Hood. R. B., and R. F. Dixon. 1969. Physical characteristics ofspeech rhythm of deaf and normal-hearing speakers. J. Commun. Disord. 2,20-28.
17. Hudgins, C. V.. and F. C. Numbers. 1942. An investigation ofthe intelligibility of the speech of the deaf. Genet. Psychol. Monogr. 25,289-392.
18. International Standards Organization. 1964. Standard Reference Zero for the Calibration of Pure-Tone Audiometers. ( IS0 Recommendation R389) Amer- ican National Standards Institute. New York.
19. Itoh, M., Y. Horii. R. G. Daniloff. and C. A. Binnie. 1982. Selected aerody- namic characteristics of deaf individuals during various speech and nonspeech tasks. Folia Phoniatr. 34, 191-209.
20. Jensema. C. J.. M. A. Karchmer. and R. J. Trybus. 1978. The Rated Speech Intelligibility of Hearing-Impaired Children: Basic Relationships and a Detailed Analysis (Ser. R. No. 6). Ofice of Demographic Studies. Gallaudet College. Washington. DC.
21. John. J. E. J.. and J. N. Howarth. 1965. The effect of time distortions on the intelligibility of deaf children's speech. Lang. Speech. 8. 127- 134.
22. Levitt. H.. and H. Stromberg. 1983. Segmental characteristics of the speech of hearing-impaired children: Factors affecting intelligibility. pp. 53-73. in I. Hochberg. H. Levitt. and M. J. Osberger. eds. Speech o/rhe Hearing Impuired: Research, Training. and Per.sonnc.l Prc~ura~ion. University Park Press. Balti- more.
23. Ling. D. 1976. Spcwk und rhr Hiwing Impoired Child: Theory und Pracrice. Alexander Graham Bell Association for the Deaf. Washington. DC.
24. Ling. D. 1979. Principles underlying the development of speech communica- tion skills among hearing-impaired children. Volta Rev. 81. 21 1-223.
25. Markides. A. 1970. The speech of deaf and partially-hearing children with special reference to factors affecting intelligibility. Br. J. Commun. Disord. 5, 126- 140.
26. McGarr. N. S.. and M. J. Osberger. 1978. Pitch deviancy and intelligibility of
27
28
29
30
31
32
33
34.
35.
36.
37.
38.
39.
40.
41.
42. 43.
44.
45.
46.
47.
48.
49.
50.
51.
Menyuk. P. 1972. The Drwlopmenl q/Speecli. Bobbs-Memll. Indianapolis. IN. Monsen. R. B. 1974. Durational aspects of vowel production in the speech of deafchildren. J. Speech Hear. Res. 17, 386-398. Monsen. R. B. 1976. The production of English stop consonants in the speech ofdeaf children. J. Phonet. 4, 29-41. Monsen. R. B. 1978. Toward measuring how well hearing-impaired children speak. J. Speech Hear. Res. 21, 197-219. Monsen. R. B. 1979. Acousticqualitiesofphonation in young hearing-impaired children. 1. Speech Hear. Res. 22, 270-288. Monsen. R. B. 1983. Voice quality and speech intelligibility among deaf children. Am. Ann. Deaf 128, 12-19. Monsen. R. B. 1983. The oral speech intelligibility of hearing-impaired talkers. J. Speech Hear. Disord. 48,286-296. Monsen. R. B., and A. M. Engebretson. 1977. Study of variations in the male and female glottal wave. 1. Acoust. Soc. Am. 62. 981-993. Monsen. R. B., A. M. Engebretson, and N. R. Vemula. 1978. Indirect assess- ment of the contribution of subglottal air pressure and vocal-fold tension to changes of fundamental frequency in English. J. Acoust. Soc. Am. 64,65-80. Monsen. R. B.. A. M. Engebretson. and N. R. Vemula. 1979. Some effects of deafness on the generation of voice. J. Acoust. Soc. Am. 66, 1680-1690. Montgomery. G. W. G. 1966. The relationship of oral skills to manual communication in profoundly deafadolescents. Am. Ann. Deaf 111,557-565. Moog, J. S.. and A. E. Geers. 1979. Grummurical Anal.vsis of Elicired Lun- giruge-Simplr Srnrcwe Level. Central Institute for the Deaf. St. Louis, MO. Moog. J. S.. and A. E. Geers. 1980. Grummurical Analysis ofElicired Lan- guage-Cump1e.x Senrc~ncc~ Level. Central Institute for the Deaf. St. Louis. MO. Moog, J. S.. and A. E. Geers. 1983. Grammuricul Anal.vsis of Elicited Lan- guug[,-Pre-Senic,nc.e Lc4 . Central Institute for the Deaf. St. Louis, MO. Musselman. C. L.. P. H. Lindsay. and A. Wilson. 1984. Linguistic and social development in preschool deafchildren. Paper presented at Annual Convention of American Speech-Language-Hearing Association. San Francisco. Newby. H. A. 1972. .41idiulogj: Ed. 3. Appleton-Century-Crofts. New York. Nickerson. R. B. 1975. Characteristics of the speech of deaf persons. Volta Rev. 77. 342-362. Nober. E. H.. and L. W. Nober. 1977. Effects of hearing loss on speech and language in the postbabbling stage. pp. 630-639. in B. F. Jaffe. ed. Hearing Loss in Children. University Park Press. Baltimore. Osberger. M. J.. and H. Levitt. 1979. The effect of timing errors on the intelligibility of deaf children's speech. J. Acoust. Soc. Am. 66, 1316-1324. Quigley. S. P.. and P. V. Paul. 1984. Language and Deafness. College-Hill Press. San Diego. CA. Russell. W. K.. S. P. Quigley. and D. J. Power. 1976. Linguisrics and Deaf Children. Alexander Graham Bell Association for the Deaf, Washington. DC. Schwab. W. A. 1977. Effects of hearing loss on education. pp. 650-654. in B. F. Jaffe. ed. Hearing Loss in Children. University Park Press, Baltimore. Silverman. S. R. 1983. Speech training then and now: A critical review. pp. I - 20. in 1. Hochberg. H. Levitt. and M. J. Osberger. eds. Speech ofrhe Hearing Impaired: Reseurch. Training, and Personnel Preparation. University Park Press. Baltimore. Smith. C. R. 1975. Residual hearing and speech production in deaf children. I. SDeech Hear. Res. 18. 795-8 I I . Staik. R. E. 1983. Phonatory development in young normally hearing and hearing-impaired children. pp. 251-266. in 1. Hochberg. H. Levitt. and M. J. Osberger. eds. Speech uf rhe Hearing Impaired: Research. Training, and Per- sonnel Prepurariun. University Park Press, Baltimore.
52. Stevens. K. N., R. S. Nickerson, and A. M. Rollins. 1983. Suprasegmental and postural aspects of speech production and their effect on articulatory skills and intelligibility. pp. 35-51. in I. Hochberg. H. Levitt, and M. J. Osberger. eds. Speech of rhe Hearing Impaired: Research, Training, and Personnel Preparu- r i m University Park Press. Baltimore.
53. Stevens. K. N.. R. S. Nickerson, A. Boothroyd. and A. M. Rollins. 1976. Assessment of nasalization in the speech of deaf children. J. Speech Hear. Res. 19,393-416.
54. Subtelny. J. D. 1983. Patterns of performance in speech perception and production. pp. 215-230. in 1. Hochberg, H. Levitt. and M. J. Osberger. eds. Speech of /he Hearing Impuired: Research, Training. and Personnel Prepara- r im. University Park Press. Baltimore.
55. Templin. M. C. 1957. Certain language skills in children, their development and interrelationships. Institute of Child Welfare Monograph Series 26(54). University of Minnesota Press. Minneapolis.
56. Tonelson. S., and S. Watkins. 1979. The S K P H l Language Developmen/ Scale. University of Utah, Project SKI*HI, Logan, UT.
57. Whitehead. R. L. 1983. Some respiratory and aerodynamic patterns in the speech of the hearing-impaired. pp. 97-1 16. in LHochberg. H. Levitt, and M. J. Osberger. eds. Speech qf rhe Hearing Impaired. Research, Training and Personnel Preparation. University Park Press. Baltimore.
58. Win. S. L.. J. D. Subtelny. and R. L. Whitehead. 1981. Perceptual and spectrographic study oftense voice in normal and deafsubjects. Folia Phoniatr. 33.23-36.
59. Zimmerman. G.. and P. Rettaliata. 1981. Articulatory patterns of an adventi- tiously deaf speaker: Implications for the role of auditory information in speech
deaf speech. J. Commun. Disord. 11, 237-247. production. J. Speech Hear. Res. 24, 169-178