1 Speed and Road Traffic Noise The role that lower speeds could play in cutting noise from traffic A report commissioned by the UK Noise Association. Researched and written by Paige Mitchell December 2009
Transcript
1
Speed and Road
Traffic Noise
The role that lower speeds could play in cutting noise from traffic
A report commissioned by the UK Noise Association. Researched and written by Paige Mitchell December 2009
2
3
Summary
Road traffic noise: the extent of the problem Road traffic is the biggest cause of noise pollution in the UK. It disturbs 12 million people. The signs are the situation is getting worse. The UK, though, is not alone. Over 210 million people in Europe are exposed to traffic noise levels exceeding the threshold at which the World Health Organisation has found noise becomes a serious problem for people. The annual cost of traffic noise to the European Union has been put at 40bn euros. Traffic noise can also have a serious impact on people’s health.
Road traffic noise: the impact of speed There is a measureable link between traffic noise and speed. In urban areas with speeds of between 20 and 35 mph, reducing speeds by 6 mph would cut noise levels by up to 40%. Reducing 70mph and 60mph speeds on urban motorways would cut noise by up to 50%.
Road traffic noise: other important factors Traffic volumes affect noise. 200 vehicles passing in one hour sound half as loud as 2000 vehicles. So volumes need to fall fairly significantly to have a noticeable effect. Cutting traffic even by a small amount could improve noise levels by reducing the overall number of noise events. However, even here speed reduction is crucial. Traffic noise will not fall automatically with a drop in vehicles numbers if it simply allows the remaining traffic to speed up. The traffic mix is an important factor in both overall noise and noise peaks. Heavy vehicles, mopeds and motorcycles are disproportionately noisy. At 30 km/h (19mph) one heavy vehicle can emit as much noise as 15 cars. However, light vehicles dominate traffic noise because they account for most of the traffic. Even on roads where there is a greater percentage of heavy traffic, cars will still usually dominate noise levels because of their higher speeds. Accelerating and braking influence overall traffic noise and noise peaks. Noise events caused by aggressive or heavy-footed driving stand out from the anonymous background, and can have a disproportionate effect on the perception of noisiness. Acceleration is more significant than braking and its importance is greater at lower speeds. Acceleration can account for 10% of traffic noise.
Road traffic noise: solutions Conventional traffic calming can reduce average noise levels by up 4dB or more with careful scheme design. Adaptations to vehicles, the most cost-effective and equitable method of cutting speed as the cost falls on the manufacturer and on the user and not on the public purse, would also assist. These include in-car information and devices to limit engine speed. Until on-board speed limiters become the norm, effective enforcement is also critical. It is also essential that new ‘greener’ cars, designed to combat climate change and the end of cheap oil, are properly noise tested. Potentially, they can be quieter. But new technology should not be regarded as a magic bullet.
Road traffic noise: international bodies recognize speed is a factor The European Conference of Transport Ministers and the Organisation for Economic Co-operation and Development recommend taking noise into account along with the wider benefits of speed reduction, such as safety, when setting speed limits: “Appropriate speed limits should also take into consideration noise levels generated by traffic for people living in the surroundings.”
Road traffic noise: conclusions The UK Government has shown little interest in tackling traffic noise through speed reduction. Yet, if the nettle were to be grasped, there is considerable scope for doing so. Cutting speeds is the most immediate, the most cost-effective and most equitable way of reducing traffic noise.
In urban areas with speeds of between 30 and 60 kph per hour, reducing speeds by 10 kph per hour would cut noise levels by up to 40%. Reducing 70mph and 60mph speeds on urban motorways would
cut noise by up to 50%.
4
Noise Traffic Aircraft Neighbour/hood
Heard noise 84% 71% 81%
Bothered, annoyed or disturbed by it To some extent 40% 20% 37% Moderately, very or extremely 22% (12.7 million 7% (3.6m) 19% (11m) Very or extremely 8% (4.6m) 2% (1.2m) 2% (1.2m)
From the 2001 survey carried out by the Building Research Establishment (BRE) for DEFRA – the most comprehensive work of recent years.
The Extent of the Problem
12 million people are disturbed by traffic noise in the UK (BRE 2001)
Road traffic is the biggest cause of noise pollution in the UK. And it is getting worse. A study carried out by MORI, two years after the BRE work was published, found 18% of people are extremely or very annoyed by traffic noise (MORI 2003). And a study carried out in Merseyside in 2004 found 30% of people felt traffic noise had become worse over the previous five years (Merseyside Transport and Health Forum 2004). There is evidence to suggest that traffic noise, certainly in urban areas, has become predominately a main road problem. Many ‘residential’ roads have been traffic-calmed, cutting traffic volumes, speed and, usually, noise. A study found a fifth of council tenants in the London Borough of Greenwich rated traffic noise as big a problem as crime, with those living on main roads the most concerned (Stewart 1998). But traffic noise is also now a big problem in many rural areas. A report published in 2008 found traffic causes “severe levels of noise disturbance” in many rural areas, largely the result of the huge rise in the amount of traffic using rural roads in recent years (Transport for Quality Life 2008). The UK is not alone. Over 210 million people in Europe are exposed to traffic noise levels exceeding the threshold at which the World Health Organisation has found noise becomes a serious problem for people (den Boer and Schroten 2007).
Figure 1: What London sounds like
(Source: Vancluysen ed. 2006: 90) It is estimated that noise above 50 Lden begins to disturb people, i.e. all except the areas marked in green. Traffic noise reaches similar levels in most other UK cities.
5
Traffic noise costs the EU 40 billion Euros a year
The annual cost of traffic noise to the European Union has been put at 40bn euros, 0.4% of GDP, about one-third the estimated cost of road crashes (den Boer & Schroten 2007). The European Green Paper on the Future of Noise Policy notes that the total cost of noise in the European Union could be as high as 2% of GDP (European Commission 1996). It has been estimated that the social benefit to the UK of a 1 dB(A) reduction in noise exposure for households would be worth over £500 million a year (Watts et al 2005).
When does noise become disturbing? In addition to loudness, the health impacts of noise depend on duration, predictability, pitch and context (Robertson et al. 1998). Sudden or sharp noise peaks can be as or more annoying than overall noise levels, especially at night when they disturb sleep. Therefore traffic noise impacts should be measured not just in terms of overall levels (dB(A)Leq), but also peaks (dB(A)Lmax). The frequency, or pitch, should also be measured. • A 10 decibel (dB) decrease is perceived as a halving of noise. A 10 dB increase corresponds to a doubling
of noise. • For a single vehicle, a 1dB change in loudness is normally only perceptible under laboratory conditions.
But on a busy road, with a mix of traffic, a reduction of 1dB can be noticeable because it signals a reduction in the number of disturbing noise events.
• A 3 dB change in loudness is very noticeable. • The World Health Organisation has found that during the day people start to get moderately annoyed by
noise at 50dB (A) LAeq and seriously at 55 dB(A) LAeq (den Boer and Schroten 2007). Millions of people in the UK are daily exposed to noised levels higher than those recommended by the
World Health Organisation
The economic costs
The health costs
Traffic noise triggers a complex chain of responses affecting human health and well-being (den Boer and Schroten 2007). After prolonged exposure, the impacts of annoyance, stress and sleep disturbance can cause physiological responses resulting in heart disease, high blood pressure and mental illness. Traffic noise disrupts hearing, learning and understanding, impacts which are particularly significant for child development. Long term exposure to the level of noise commonly experienced near major roads can cause hearing loss. And the effects of noise are inequitably distributed. People disadvantaged by reasons of income, age or disability are likely to be disproportionately affected by noise. It can also impact on wildlife.
6
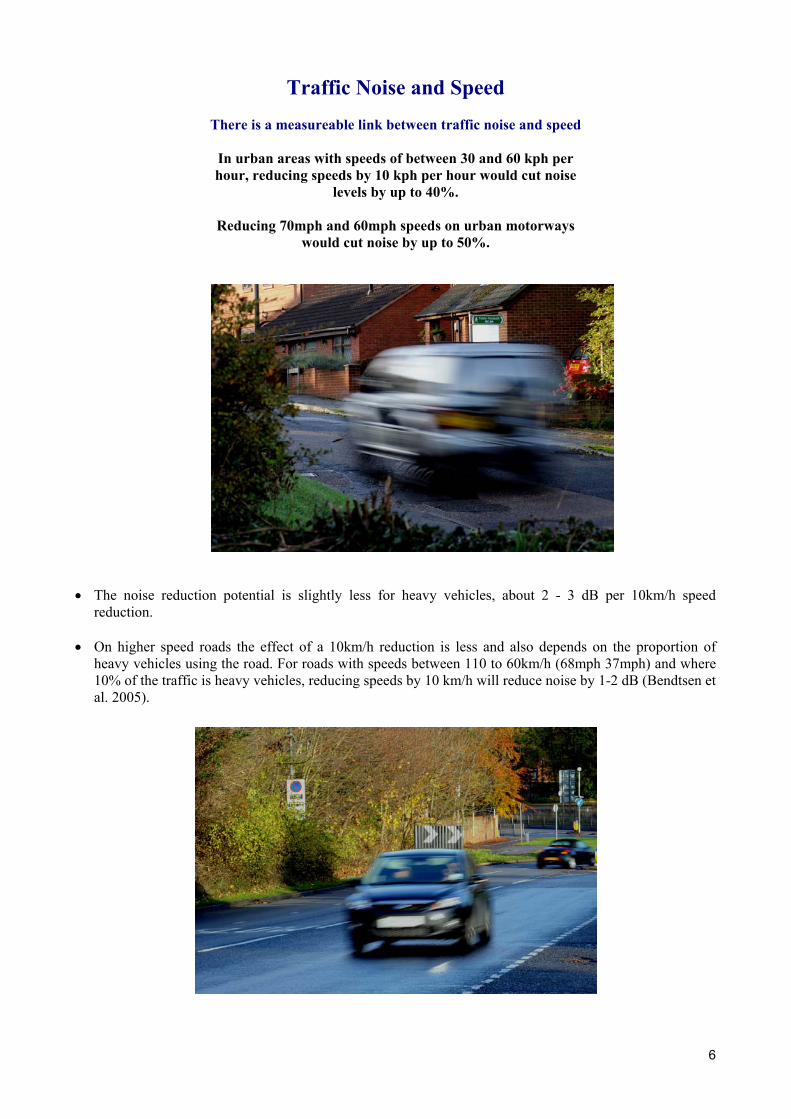
Traffic Noise and Speed
There is a measureable link between traffic noise and speed
In urban areas with speeds of between 30 and 60 kph per hour, reducing speeds by 10 kph per hour would cut noise
levels by up to 40%.
Reducing 70mph and 60mph speeds on urban motorways would cut noise by up to 50%.
• The noise reduction potential is slightly less for heavy vehicles, about 2 - 3 dB per 10km/h speed
reduction. • On higher speed roads the effect of a 10km/h reduction is less and also depends on the proportion of
heavy vehicles using the road. For roads with speeds between 110 to 60km/h (68mph 37mph) and where 10% of the traffic is heavy vehicles, reducing speeds by 10 km/h will reduce noise by 1-2 dB (Bendtsen et al. 2005).
7
Case Studies – Munich and Bristol
The effects of speed reductions on noise have been modelled for heavily trafficked urban distributor roads and urban motorways in Munich and Bristol. • A speed limit reduction was evaluated for one of the busiest roads in Munich in a densely populated area.
The speed limit reduction from 60 km/h (37mph) to 30km/h (19mph) was predicted to produce an average 3 dB reduction with no change in traffic flow or composition. This was considered ‘modest ... but relevant for the population’ (Annecke and Zimmerman 2008:52).
• A speed limit reduction from 130 km/h (81mph) to 80 km/h (50mph) was modelled for a motorway
outside of Munich with a 3dB reduction predicted (Annecke and Zimmerman 2008). • A modelled speed limit reduction from 70mph (113 km/h) and 60mph (97 km/h) to 40mph on the M32
urban motorway in Bristol was predicted to reduce noise by 3 to 5dB (Crawshaw 2008).
Figure 2: Potential speed limit reduction effect on noise from heavy traffic in Munich
Source: (Annecke and Zimmerman 2008:52, Figures 8.8 and 8.9)
8
The relationship between speed and noise: the technical side
Traffic noise is created by a combination of rolling noise (arising from the tyres interacting with the road) and propulsion noise (comprising engine noise, exhaust systems, transmissions and brakes) – see Figure 3. As a rule of thumb, tyre-road interaction is the main cause of noise above 55 kph for most cars, and above about 70 kph for lorries with engine noise predominating at lower speeds, although changes in technology mean that rolling noise can now dominate at speeds above above 20-40 km/h (12-25mph) for new cars and at 30-60 km/h (19-37mph) for new lorries (ECMT/OECD 2006). The speed dependence of the relative contribution of propulsion and rolling noise to overall noise levels is critical to the effectiveness of different noise reduction measures in different contexts. In urban environments both propulsion and rolling noise are important. On roads with speed limits higher than 50km/h (30mph) noise reduction depends on reducing rolling noise. Engine noise varies with engine size, power and load, as Figure 4 shows. Rolling noise increases linearly with speed but the relationship varies with tyre width and road surface. Traffic speed, volume and vehicle mix are interacting dynamic factors that determine overall traffic impacts, including noise. These factors also constitute the driving environment for driving patterns - essentially acceleration and braking the other main factor in traffic noise. Driving patterns depend on driver behaviour and vehicle design as well as the driving environment. Figure 3: A generalised relationship between propulsion and rolling noise and the way both change with vehicle speed.
(Source: ECMT/OECD 2006:45, Figure 2.8)
9
Table 1: cut in traffic reduces noise, assuming no changes in speed, traffic composition or driving patterns (Source: Ellebjerg 2008a: 11, Table 2.1)
The role other factors play in noise:
Traffic Volumes Traffic volumes affect noise. 200 vehicles passing in one hour sound half as loud as 2000 vehicles. So volumes need to fall fairly significantly to have a noticeable effect. Cut traffic even by a small amount could improve noise levels by reducing the overall number of noise events. However, even here speed reduction is crucial. Traffic noise will not fall automatically with a drop in vehicles numbers if it simply allows the remaining traffic to speed up.
Traffic Mix
Figure 4: Average maximum noise emissions for different vehicle types in free flowing traffic
(Source: Ellebjerg 2008a:12, Figure 2.1) Table 2: Effect of speed reduction on traffic noise for light and heavy vehicles (Source: Ellebjerg 2008a:14, Table 2)
Traffic mix is an important factor in both overall noise and noise peaks. Heavy vehicles, mopeds and motorcycles are disproportionately noisy – see Figure 4. At 30 km/h (19mph) one heavy vehicle can emit as much noise as 15 cars. However, light vehicles dominate traffic noise because they account for most of the traffic. Even on roads where there is a greater percentage of heavy traffic, cars will still usually dominate noise levels because of their higher speeds (Ellebjerg 2008a). In the Munich noise study, a ban on HGV through traffic was evaluated for the same urban distributor. A modelled 15% reduction in lorry traffic was predicted only to reduce noise by 0.5 to 1.0 dB (Annecke and Zimmerman 2008).
Reduction in traffic volume Reduction in noise (LAeq)
10% 0.5 dB
20% 1.0 dB
30% 1.6 dB
40% 2.2 dB
50% 3.0 dB
75% 6.0 dB
Reduction in speed Noise reduction
(LAE, dB) - light
vehicles
Noise reduction
(LAE, dB) - heavy
vehicles
km/h mph
40 to 30 25 to 19 3.6 2.7
50 to 40 31 to 25 2.8 2.1
60 to 50 37 to 31 2.3 1.7
70 to 60 44 to 37 1.9 1.4
10
Driving patterns Accelerating and braking influence overall traffic noise and noise peaks. Noise events caused by aggressive or heavy-footed driving stand out from the anonymous background, and can have a disproportionate effect on the perception of noisiness. Acceleration is more significant than braking and its importance is greater at lower speeds. The relationship between noise and acceleration is a function of vehicle weight and power, as well as speed of acceleration (Ellebjerg 2008a). In general, for passenger cars, ‘average acceleration’ at 30km/h (19mph) can increase noise by 2dB. At speeds between 50 - 60 km/h (31-37mph) acceleration can increase noise by 1 - 1.5dB. At higher speeds the contribution of acceleration to noise is negligible because of the increased importance of rolling noise and the reduced incidence of acceleration. Accelerations at low speeds have been found to account for a significant proportion of total driving under normal urban conditions (driving on residential and main streets).
Acceleration can account for 10% of traffic noise A Dutch study found that medium accelerations from 20 km/h to 50 km/h accounted for 10% of traffic noise while accelerating from traffic lights accounted for 5% (Watts et al. 2005). Driving style has a significant influence on the noise associated with acceleration. It has been calculated that hard acceleration from 50 km/h (31mph) by the driver of a passenger car can increase noise by nearly 3dB, as Table 3 shows (Ellebjerg 2008a). Rates of acceleration are similar for most vehicles in congested urban conditions. The normal range for accelerating from signals is predicted to be between 0.5 and 1.0metre per squared second. Unsurprisingly, more powerful cars accelerate more rapidly when roads are less heavily trafficked, with measured acceleration rates from traffic signals well above 2.0metres per squared second (Watts et al 2005). Compared to moderate driving, aggressive driving, for example, when accelerating from a junction, has been shown to increase noise by as much as 6 dB due to increased engine speed (Ellebjerg 2008b). Table 3: Modelled difference between moderate and harsh acceleration and braking compared to constant speed
of 50 km/h for vehicles of different weights
Acceleration/deceleration Vehicle type Noise influence Note
1 m/s2 Light + 1.7 dB Moderate acceleration
2 m/s2 Light + 4.5 dB High acceleration
0.5 m/s2 Heavy + 2.1 dB Moderate acceleration
1 m/s2 Heavy + 4.5 dB High acceleration
-1 m/s2 Light - 0.8 dB Slow deceleration
-2 m/s2 Light - 1.2 dB High deceleration
-1.5 m/s2 Heavy, 2 axles - 4.5 dB Moderate deceleration
(Source: Ellebjerg 2008a:16 Table 2.4)
11
Figure 5 below shows the simulated effect of halving the rate of acceleration and braking on noise at junctions when approach speed is 50km/h. The figure illustrates the noise impact of difference rates of acceleration (travelling to the left, away from the junction) and braking (travelling to the right, toward junction) by the same vehicle. Halving the rate of acceleration from 2 metres per second squared to 1 metre per second squared reduces noise by around 3db when the car is travelling a 50km/h.
Figure 5a: Accelerating and braking at 2m per squared second
STOP
STOP
STOP
STOP
Figure 5b: Acceleration and braking at 1m per squared second
STOP
STOP
STOP
STOP
(Source: Vancluysen, ed. 2006:98)
12
What the authorities say about speed and noise
Recommendations of international bodies The European Conference of Transport Ministers and the Organisation for Economic Co-operation and Development recommend taking noise into account along with the wider benefits of speed reduction, such as safety, when setting speed limits. They give guidance for setting limits where noise is an issue (ECMT/OECD 2006):
The speed limit setting process should take into consideration elements such as road alignment and surface quality, as well as the number and location of people living along the road and the presence of pedestrians and other vulnerable road users. . . . Appropriate speed limits should also take into consideration noise levels generated by traffic for people living in the surroundings. (ECMT/OECD 2006: 86)
Table 4 sets out the limits recommended by the ECMT/OECD. The upper ranges represent current speed limit setting practice in most member states. When managing speed for noise reduction the low end of the lower, ‘environmental quality’, range is generally recommended.
Table 4: Speed limit ranges for given road type and noise impact
Road type Recommended upper speed limit range Speed limit range when managing for environmental quality, including noise
Motorways and principal inter-urban roads
90-130 km/h (56-81mph) 70-90 km/h (44-56mph)
Urban arterial roads and main roads
50-60-70 km/h (30-37-44mph) 30-60 km/h (19-37mph)
Urban residential roads 30 km/h (19mph) 30 km/h (19mph)
Rural main roads 70-90 km/h (44-56mph) 60-90 km/h (37-56mph)
Minor rural roads 40-60 km/h (25-37mph) 40-60 km/h (25-37mph)
(Source ECMT/OECD 2006:88, Table 5.1) It has been suggested that in hilly areas lower speed limits may be justified on uphill gradients in order to reduce propulsion noise from heavy vehicles (Amundsen and Klaeboe 2005).
Current UK guidance on setting speed limits Local authorities have powers to reduce speed limits on local roads. This has lead to increasing variation in speed limits across the highway network. Rather than overhauling national speed limits to address this trend (and meet some pressing policy objectives on climate, environment and public health that would be assisted by lower speeds), in 2006 the Department for Transport issued new guidance on setting speed limits, Circular 01/2006, to local authorities. At the same time the Department required them to evaluate, and if necessary adjust, speed limits on A and B class roads by 2011, potentially leaving lower quality C and U class roads with the national 60mph limit in force. Circular 01/2006 treats speed limit reduction as a measure to be used with great caution. Local authorities are expected to introduce the new limits for single carriageway roads gradually, ‘subject to their meeting local needs and considerations’ (DfT 2006:42). The only mention of noise in the guidance occurs in a paragraph on rumble strips. However, the road environment and traffic composition, including existing and potential pedestrian and cycle use, are considered as important factors.
International bodies have much more to say about noise and speed than the UK Government which hardly mentions noise in its guidance
13
Tables 5 and 6 summarise the current UK guidance on appropriate speed limits, according to environment and road quality
Table 5: Department for Transport guidance on urban speed limits
Speed limit Characteristics
20mph (32 km/h) In town centres, residential areas and in the vicinity of schools where there is a high presence of vulnerable road users.
30mph (48 km/h) The standard limit in built-up areas with development on both sides of the road.
40mph (64 km/h) Higher quality suburban roads or those on the outskirts of urban areas where there is little development. Should be few vulnerable road users. Should have good width and layout, parking and waiting restrictions in operation, and buildings set back from the road. Should wherever possible cater for the needs of non-motorised users through segregation of road space, and have adequate footways and crossing places.
50mph (81 km/h) Usually most suited to special roads, dual carriageway ring or radial routes or bypasses which have become partially built up. Should be little or no roadside development.
(Source: DfT 2006:41, Table 1)
Table 6: Department for Transport guidance on rural speed limits
Speed limit Upper tier – roads with predominant traffic flow function
Lower tier – roads with important access and recreational function
60mph (97 km/h)
high quality strategic A and B roads best quality C and Unclassified roads (In the longer term, these roads should be assessed against upper tier criteria.)
50mph (81 km/h)
lower quality A and B roads, and where lower limit does not interfere with traffic flow
lower quality C and Unclassified roads
40mph (64 km/h)
for roads with a high number of bends, junctions or accesses, substantial development or where there is a strong environmental or landscape reason, or where there are considerable numbers of vulnerable road users
for roads with a predominantly local, access or recreational function, or if part of a route for vulnerable road users.
30mph (48 km/h)
Should be the norm in villages
(Source: DfT 2006:42, Table 2)
14
Speed reducing measures which will cut noise Traffic management measures for urban roads The volume and composition of traffic affect the choice of suitable speed reducing measures, as does road geometry. Conventional traffic calming measures are suited to minor (and some major) roads while traffic smoothing through traffic control signals and speed limit enforcement may be the best options on large urban roads with high flows of traffic and high proportions of heavy vehicles (Ellebjerg 2007). Conventional traffic calming measures can reduce average noise levels by up 4dB or more with careful scheme design (Bendtsen et al. 2005). Road humps and speed cushions reduce overall noise from car traffic (Department for Transport 1996). The proportion of heavy vehicles in the traffic stream is a major determinant of suitable measures and overall noise reduction. Schemes should be designed so body noise effects from heavy vehicles at traffic calming features do not offset the noise reductions obtained by reducing their engine speeds. Rumble strips and cobble or granite sett-type paving stones can increase noise. Humps and speed cushions can decrease or increase noise depending on their height, profile and width (Bendtsen et al. 2005). For roads with significant numbers of heavy vehicles round top humps and narrow speed cushions are preferable to flat top humps and wide cushions (Department for Transport 2006). Table 7 summarises a list of typical measures and their scope for noise reduction. The predicted noise reductions assume that heavy vehicles are 10% of the traffic. Greater noise reductions should be achieved where there are fewer lorries. Table 7: Summary of effects of traffic management measures on traffic noise, with 10% heavy vehicles
Traffic calming / Environmentally adapted through roads Up to 4 dB
30 km/h (20mph) zone Up to 2 dB
Roundabouts Up to 4 dB
Round-top/circle-top road humps Up to 2 dB
Flat-top humps Up to 6 dB increase
Narrow speed cushions Up to 1 dB increase
Night time restrictions on heavy vehicles Up to 7 dB at night time
Speed limits combined with signs about noise disturbance 1 – 4 dB
Rumble strips of thermoplastic Up to 4 dB noise increase
Rumble areas of paving stones Up to 3 dB noise increase
Rumble wave devices 0 dB
(Source: Bendtsen et al. 2005:6) Physical measures should be spaced to encourage a steady driving pattern and to discourage rapid acceleration and deceleration between measures. The appropriate distance between physical measures depends on the desired maximum speed limit. Current regulations for 20mph zones require that no part of the zone should be further than 50m from a traffic calming feature (Department for Transport 2006). Extrapolating from this, around 90m would be the maximum spacing to maintain steady driving in a 30mph limit (Ellebjerg 2008a). On streets with traffic signals, signal timing could help to smooth traffic and reduce noise by as much as 4 dB, as long as drivers understand the system and it does not lead to overall increases in speed and/or traffic (Ellebjerg 2008a). ‘Green waves’ reward drivers who comply with posted limits. If speed reduction along a link is not feasible, it may be possible to reduce speed limits on the approach to junctions. Roundabouts replacing signalised or ordinary intersections can reduce noise by up to 4 dB (Ellebjerg 2008a).
15
Sign only limits Signed only limits can reduce speeds but the effect is relatively small. Signed only speed limits are unlikely to reduce noise perceptibly without other measures to encourage speed limit compliance. Driver-activated signs showing the prevailing speed limit and/or the driver’s current speed can encourage better compliance, with potential reductions in noise of up to 3 dB depending on the speed reduction. But widespread use of these signs is predicted to reduce their effectiveness (Ellebjerg 2008b). Active traffic management Motorways are increasingly equipped with technology allowing traffic managers to monitor conditions. One of the most important parameters measured is traffic speed. Accompanying this trend is the use of ‘intelligent’ signs to warn drivers of conditions ahead and advise on appropriate responses, including speed reductions. These temporary limits are enforceable. A successful early trial of active traffic management found that the reduction in stop-start driving and improved compliance with 50mph speed limits reduced weekday traffic noise adjacent to the carriageway by around 0.7 dB with reductions of up to 2.3 dB in source noise (Highways Agency 2004). Active traffic management has been introduced in Gleisdorf, Austria, to reduce night time motorway traffic noise. Interactive signs display lower speed limits when microphones on the façades of nearby dwellings register noise exceeding specified levels (Ellebjerg 2008a). ‘Drive slow go faster’ ‘Drive slow go faster’ is an urban traffic flow measure which involves road re-design and lane narrowing to reduce speed and prevent overtaking. The reduced speeds and more even driving have resulted in 26% reduction in fuel consumption and reduced emissions, including noise, and are accompanied by reduced travel times. High driver approval means that it is considered a measure ‘with only positive effects’, ‘typically a no regret measure’ (van Beek et al. 2007:13). Speed limiters, eco-driving and other driver-assistance technology In-car speed limiters In-car speed limiters are cheaper and more cost-effective than ‘end-of-pipe’ measures. Most attention has been paid to Intelligent Speed Adaptation (ISA) where the prevailing speed limit is communicated to equipment within the car via satellite or highway infrastructure. ISA can be voluntary or mandatory. A recent study of the effects of voluntary ISA adherence to existing speed limits found negligible impacts on noise reduction, but recognised beneficial impacts in urban areas where ISA could reduce harsh acceleration and the incidence of speeding when roads are not congested (Carsten et al. 2008). In the spring of 2009 Transport for London made a digital map of London speed limits available to drivers using satnav systems with advisory ISA which alerts drivers when they are exceeding the speed limit (Local Transport Today 2009). Eco-driving techniques Eco-driving techniques have been developed to conserve fuel but involve practices that should contribute to noise reduction (Smokers et al 2006). These include shifting up as soon as possible, driving at a steady speed, driving at low engine speeds in the highest gear possible and anticipating road conditions. On-board devices such as fuel economy meters and gear shift indicators can assist eco-driving to help ensure the behaviour change is maintained. On-board computer processors coupled with the latest transmission technology (for example automated manual transmission and continuous variable transmission) could also be used to reduce or eliminate aggressive acceleration. It has been estimated that noise reductions of up to 3 dB(A) can be achieved by keeping speed as constant as possible for the driving situation and vehicle (Amundsen and Klaeboe 2005). In-car information In-car information has been tested alone and in conjunction with devices to limit engine speed (the latter for heavy vehicles) to promote eco-driving, especially within noise-sensitive areas. For trucks, ‘low-rev’ driving reduced propulsion noise by 3 dB and total noise by up to 2.7 dB depending on road type and average speed. The largest reductions were at the slowest speeds where engine noise predominates and would be particularly suitable for 30 km/h (19mph) limits in vulnerable areas (Wiberg and Mårdh 2008).
Adaptations to vehicles are the most cost-effective and equitable method of cutting speed as the cost falls on the manufacturer and on the user and not on the public purse
16
Effective Enforcement Enforcement technology is evolving in response to the recent emphasis on speed limit enforcement. Conventional static and mobile (police operated) speed cameras are effective in reducing speed but when highly visible they can have the effect of causing dangerous and noisy acceleration once drivers pass the camera site. The best way to secure wider compliance, and steadier driving, is for drivers to be sure that limits are being enforced, but unsure about the location of speed detectors (Kallberg et al. 1998). This can be achieved by a combination of publicity and covert enforcement. Speed cameras have been used to enforce night-time speed limits on the Nantes Ring Road, reducing noise by more than 2 dB (Ellebjerg 2008a). The latest developments in automatic enforcement overcome the problem of visibility. Average speed, or ‘time-over-distance’ cameras enforce speed limits by monitoring the time a car enters and leaves a given stretch of road. These cameras are very effective in eliminating high end speeding and encouraging a steady, slower speed. Both of these impacts reduce noise. The third generation of average speed cameras using wireless technology enables their use over networks of roads. This makes them attractive for enforcing urban speed limits. Many London boroughs are now considering using the new generation of average speed cameras to enforce 20mph zones and Transport for London will be carrying out pilots at a number of locations over the next three years (to 2012/13) (London Assembly Transport Committee 2009). Widespread use of these cameras would reduce reliance on conventional traffic calming, secure wider speed limit compliance and contribute to steadier and smoother driving, with concomitant noise reductions. Cars of the future Although the internal combustion engine is likely to remain the dominant power source for passenger cars up to and beyond 2030 (Kahn Ribeiro et al 2007) new types of vehicles will soon hit the streets, vehicles designed for an age threatened by climate change and the prospect of soaring oil prices, vehicles like hybrid electric cars. What is urgently needed are ways of assessing the noise they will make and of coming up with effective measures to deal with it. Vehicle weight, acceleration (driving style) and driving speed are critical factors in both fuel consumption and noise emissions. Reducing weight and acceleration capabilities across current size classes could reduce fuel consumption by between 25% to 40%, with the greatest reductions under urban driving conditions (Plowden and Lister 2008), where the reduced acceleration would also have the greatest potential benefits in noise reduction. However, reduced speed limits would still be needed to set the framework for ‘eco cars’.
17
Conclusions 1. Speed plays a significant role in causing traffic noise. 2. Reducing speed is the most immediate and equitable way of cutting traffic noise. 3. Traffic speeds can be reduced through effective enforcement of current limits and the introduction of lower limits backed up by appropriate traffic management, including enforcement where appropriate. 4. Adaptations to vehicles, the most cost-effective and equitable method of cutting speed as the cost falls on the manufacturer and on the user and not on the public purse, would reduce speed through the installation of devices such on-board speed limiters and in-car information. 5. International bodies recognize speed as a factor in traffic noise but, so far, the UK Government has shown little inclination to do anything about it. 6. Useful guidelines to follow would be those set out by the European Conference of Transport Ministers and the Organisation for Economic Co-operation and Development recommend (ECMT/OECD 2006):
Recommended speed limit ranges for given road type and noise impact
Road type Recommended upper speed limit range
Speed limit range when managing for environmental quality, including noise
Recommended Motorways and principal inter-urban roads
90-130 km/h (56-81mph) 70-90 km/h (44-56mph)
Urban arterial roads and main roads
50-60-70 km/h (30-37-44mph) 30-60 km/h (19-37mph)
Urban residential roads 30 km/h (19mph) 30 km/h (19mph)
Rural main roads 70-90 km/h (44-56mph) 60-90 km/h (37-56mph)
Minor rural roads 40-60 km/h (25-37mph) 40-60 km/h (25-37mph)
6. Cutting speed, and thus traffic noise, would cut the cost noise imposes on the economy and would improve the health and well-being of millions of people in the UK. 7. The impact on noise of any new ‘eco vehicles’ needs to be assessed before they reach the streets. But blind faith in new technology to solve either the key problems associated with vehicles – emissions, road, danger and noise – needs to be avoided. Improved technology is not a substitute for other activities.
18
References: Amundsen, A.H. & Klaeboe, R. (2005) A Nordic perspective on noise reduction at the source TOI report 806/2005 Oslo, Institute of Transport Economics (TOI) Annecke, R. and Zimmerman, U. (2008) 'Examples of using traffic management measures on noise in cities - Munich' in Ellebjerg, L. (ed) (2008) Bendtsen, H., Haberl, J., Sandberg, U., Watts, G., Pucher, E. (2005) Traffic Management and Noise Reducing Pavements - Recommendations on Additional Noise Reducing Measures SILVIA (Sustainable Road Surfaces for Traffic Noise Control) Project Report, Roskilde, Denmark: Danish Road Institute/Road Directorate Building Research Establishment (2001) The UK National Noise Attitude Survey, Building Research Establishment Carsten, O., Lai, F., Chorlton, K., Goodman, P., Carslaw, D. and Hess, S. (2008) Speed Limit Adherence and its Effect on Road Safety and Climate Change: Final Report Leeds: University of Leeds Institute of Transport Studies Crawshaw, S. (2008) 'Examples of using traffic management measures on noise in cities - Bristol' in Ellebjerg, L. (ed) (2008) van Beek, W., Derriks, H., Wilbers, P., Morsink, P., Wismans, L., van Beek, P. (2007) ‘The Effects of Speed Measures on Air Pollution and Traffic Safety’, Proceedings of European Transport Conference 2007 den Boer, L.C. & Schroten, A. (2007) Traffic Noise Reduction in Europe — Health effects, social costs and technical and policy options to reduce road and rail traffic noise Delft, The Netherlands CE Delft Department for Transport (1996) Traffic Calming: traffic and vehicle noise, Traffic Advisory Leaflet 6/96 Department for Transport (2006) Setting Local Speed Limits Circular 01/2006 European Commission (1996) Future Noise Policy (COM(96) 540) ECMT/OECD (European Conference of Ministers of Transport/Organisation for Economic Cooperation and Development) (2006) Speed Management OECD Ellebjerg, L. (2007) Effectiveness and Benefits of Traffic Flow Measures on Noise Control WP H.1 Methods for Noise Control by Traffic Management SILENCE, SILENCE_H.D1_20070105_DRI.doc http://www.eukn.org/eukn/themes/Urban_Policy/Urban_environment/Environmental_sustainability/Noise/traffic-flow-measures_1035.html accessed 090701 Ellebjerg, L. (2008a) ‘Basic traffic - noise relations’ in Ellebjerg, L. (ed.) (2008) Ellebjerg, L. (2008b) 'The effect of individual traffic flow measures', in Ellebjerg, L. (ed.) (2008) Ellebjerg, L. (ed.) (2008) Noise Reduction in Urban Areas from Traffic and Driver Management - A toolkit for city authorities, Deliverable no. H.D2 in Work Package H.2 Methods for Noise Control by Traffic Management, SILENCE_H.D2_20080816_DRI.pdf, accessed 090701 from www.silence-ip.org Highways Agency (2004) M25 Controlled Motorways: Summary Report Kahn Ribeiro, S., Kobayashi, S., Beuthe, M., Gasca, J., Green, D., Lee, D.S., Muromachi, Y., Newton, P.J., Plotkin, S., Sperling, D., Wit, R., Zhou, P.J. (2007) Transport and its infrastructure in Metz et al. Kallberg, V.-P., Allsop, R., Ward, H., van der Horst, R. and Varhelyi, A. (1998) Recommendations for Speed Management Strategies and Policies Deliverable 12, MASTER/VTT Communities & Infrastructure Local Transport Today (2009) 'TfL launches digital speed limit mpa for use in satnav and ISA systems', Local Transport Today No. 516, 27 March 2009, p3 London Assembly Transport Committee (2009) 20mph Speed Limits in London, London: Greater London Authority Merseyside Noise Study (2004), Merseyside Transport and Health Forum
19
Metz., B., Davidson, O.R., Bosch, P.R., Dave, R., Meyer, L.A. (eds) Climate Change 2007: Mitigation. Contribution of Working Group III to the Fourth Assessment Report of the Intergovernmental Panel on Climate Change Cambridge, United Kingdom: Cambridge University Press MORI (2003), Neighbour Noise, DEFRA Plowden, S. and Lister, S. (2008) Cars Fit For Their Purpose: What They Would Be and How To Achieve Them London: Local Transport Today Robertson, S., Ward, H., Marsden, G., Sandberg, U., Hammerstrom, U. (1998) The effect of speed on noise, vibration and emissions from vehicles - MASTER Working Paper 1.2.1 MASTER (Managing Speeds of Traffic on European Roads), VTT: Finland Smokers, R., Vermeulen, R., van Mieghem, R., Gense, R., Skinner, I., Fergusson, M., MacKay, E., ten Brink, P., Fontaras, G., & Samaras, Z. (2006) Review and analysis of the reduction potential and costs of technological and other measures to reduce CO2-emissions from passenger cars Final Report, Delft, The Netherlands: TNO Science and Industry Stewart J (1998) Poor Show, ALARM UK Transport for Quality of Life (2008) Traffic Noise in Rural Areas, The Noise Association Vancluysen, K., ed. (2006) Silence — Proceedings of the First Silence Seminar WP J.1 Dissemination and Networking SILENCE_J.D7_240406_POLIS.pdf accessed 090701 Watts, G., Nelson, P., Treleven, C. and Balsom, M. (2005) An examination of vehicle noise test procedures, TRL PPR044, TRL Ltd Wiberg, A. and Mårdh, S. (2008) 'Driver assistance systems' in Ellebjerg, L. (ed) (2008)
20
Speed and Road Traffic Noise has been published by the Noise Association, the charitable arm of the UK Noise Association. It was written and researched by Paige Mitchell who is a freelance transport policy researcher. It was edited and designed by John Stewart. The Noise Association can be contacted at PO Box 551, Chatham, Kent, ME4 9AJ. Tel 01634 863852. Email: [email protected] www.ukna.org.uk