16
Speed Dating Data Set Vaibhav, Tejasvi, Ritesh, Foram, Mary
| Date post: | 14-Apr-2017 |
| Category: |
Data & Analytics |
| Upload: | ritesh-kp |
| View: | 12 times |
| Download: | 0 times |
Speed Dating Data SetVaibhav, Tejasvi, Ritesh, Foram, Mary
Outline• Introduction & Business Problem• Description of Data• Pre-Processing Steps• Exploratory Techniques & Interesting Observations• BI Model• Conclusions

Introduction & Business ProblemCurrent popular dating apps geared toward young adults do not take
preferences and interests into consideration.
Goal: To create a superior dating app that results in a higher percentage of dates and relationships.
How: Use data from speed dating events to predict whether users are compatible.

Description of Data• Source: Kaggle• 8,378 Observations from twenty-one speed dating events from
2002 to 2004• Each observation represents a four-minute date between two
people• Includes:
• User demographics• User interests/preferences• Scorecard for each user• Whether each user desired a second date with their partner

Description of Data - Scorecard

Pre-Processing Steps• Four of the speed dating events used a different ranking method for
their preferences• For these observations, we used the following method to scale the data
= ×
We rejected the following variables:• Match• Dec_o• Num_in_3
Pre-Processing Steps• For certain models, the following nodes were applied:
• Impute• Mean value replaced blank interval variables• Median value replaced blank ordinal variables
• Replacement• Missing values replaced with a ‘.’
• Variable Transformation• Skewed variables transformed using log
• Variable Selection• Computed automatically by SAS
Exploratory Techniques & Interesting Observations
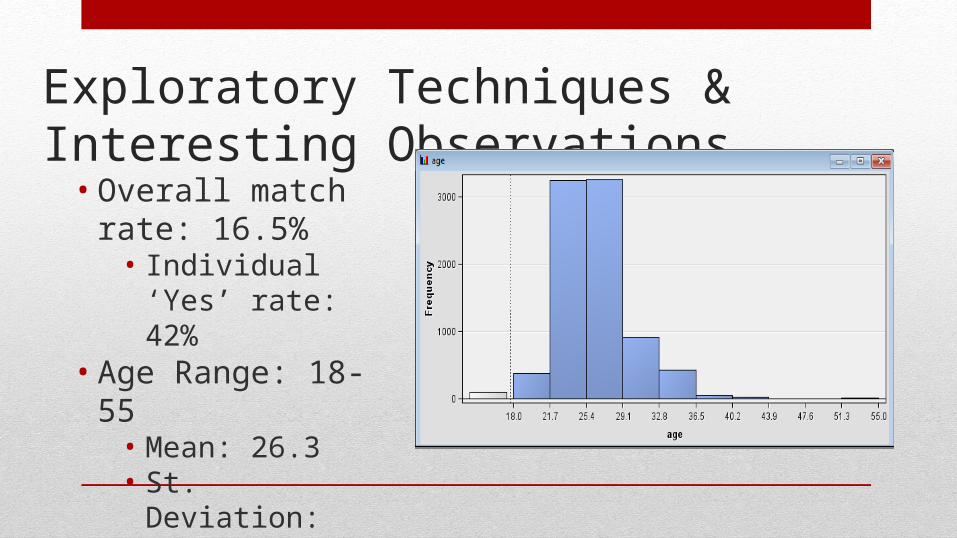
• Overall match rate: 16.5%
• Individual ‘Yes’ rate: 42%
• Age Range: 18-55• Mean: 26.3• St. Deviation: 3.566• Skewness: 1.07

Exploratory Techniques & Interesting Observations
> Gender
Note:‘0’ represents female ‘1’ represents male
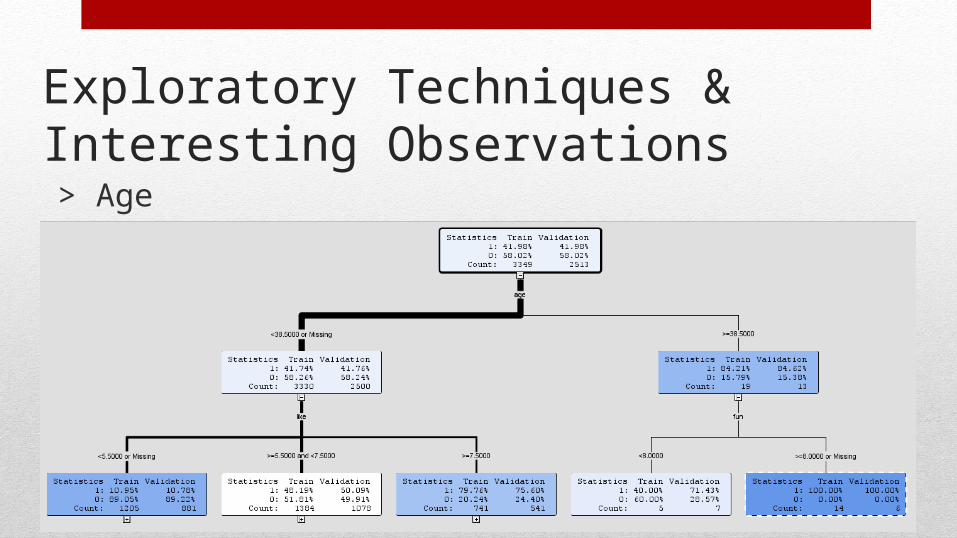
Exploratory Techniques & Interesting Observations> Age

Exploratory Techniques & Interesting Observations> Season
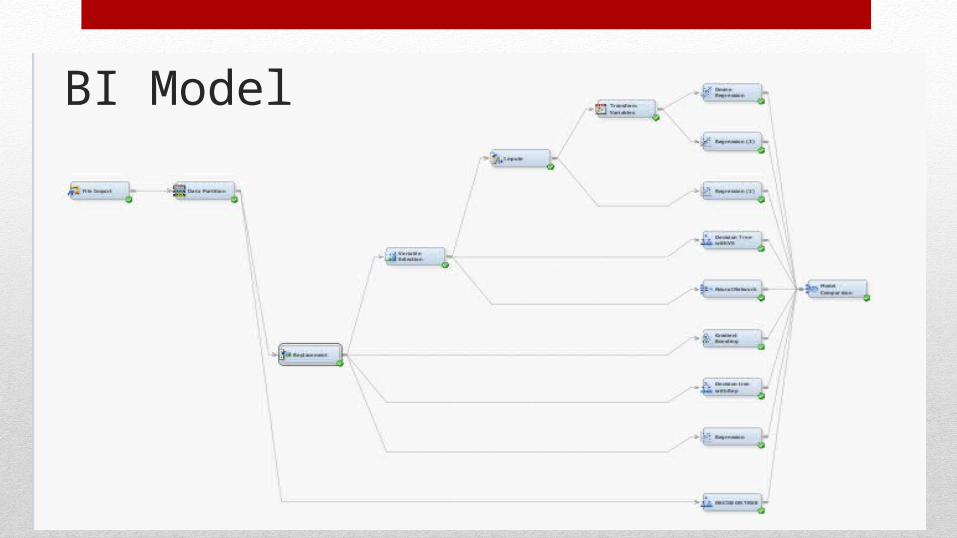
BI Model
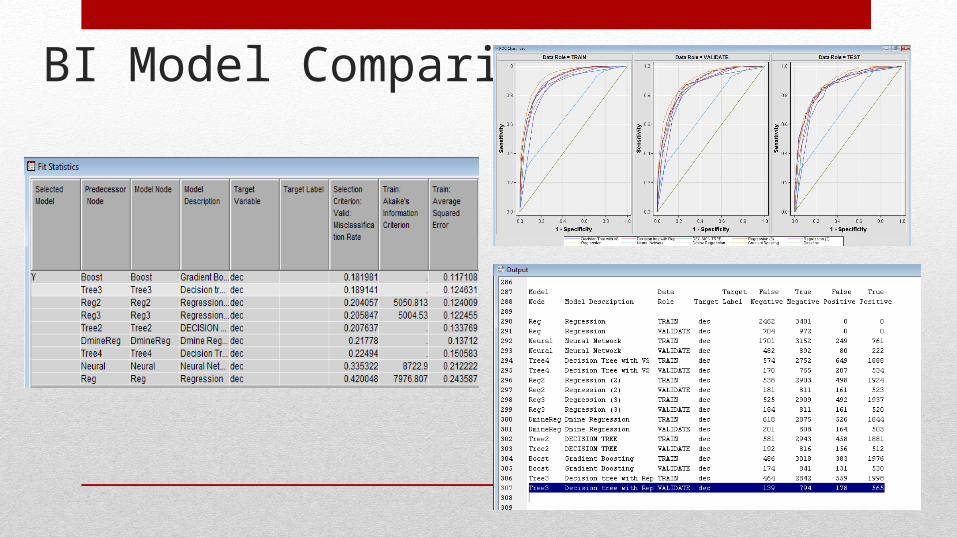
BI Model Comparison
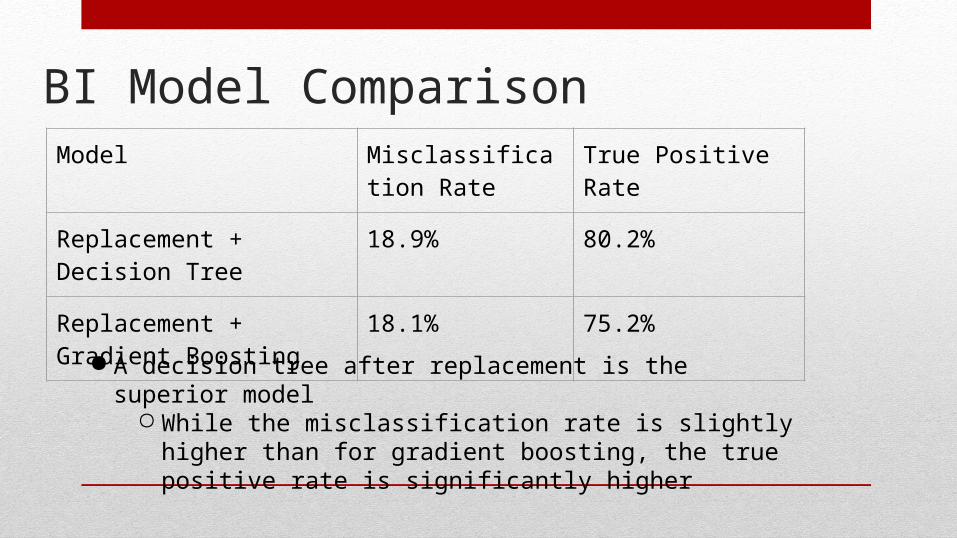
BI Model ComparisonModel Misclassification
RateTrue Positive Rate
Replacement + Decision Tree 18.9% 80.2%
Replacement + Gradient Boosting
18.1% 75.2%
● A decision tree after replacement is the superior model○ While the misclassification rate is slightly higher than for gradient
boosting, the true positive rate is significantly higher
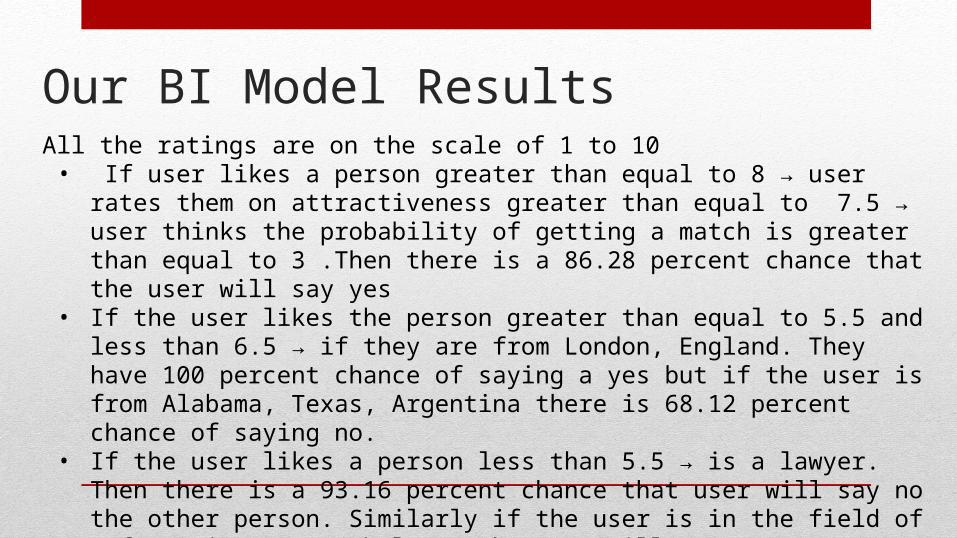
Our BI Model ResultsAll the ratings are on the scale of 1 to 10• If user likes a person greater than equal to 8 → user rates them on attractiveness
greater than equal to 7.5 → user thinks the probability of getting a match is greater than equal to 3 .Then there is a 86.28 percent chance that the user will say yes
• If the user likes the person greater than equal to 5.5 and less than 6.5 → if they are from London, England. They have 100 percent chance of saying a yes but if the user is from Alabama, Texas, Argentina there is 68.12 percent chance of saying no.
• If the user likes a person less than 5.5 → is a lawyer. Then there is a 93.16 percent chance that user will say no the other person. Similarly if the user is in the field of Informatics or Psychology, the user will say no 100 percent of the time and if the user is a journalist, there is an 83 percent chance of saying a yes.

ConclusionWe are going to use the BI model for building an application and
the overview for the Dating Application will be :• User profile• Suggesting users people based on their preferences• Users ratings for the suggested profiles • BI model used for suggesting potential partners using the
ratings• Chat option• After a significant user base implement recommendation system


