2nd Conference of Transportation Research Group of India (2nd CTRG)
Speed Distribution Curves for Pedestrians during Walking and Crossing
Satish Chandraa*, Anish Kumar Bhartib
a Professor, Department of Civil Engineering, Indian Institute of Technology, Roorkee 247 667, India b Assistant Professor, Department of Civil Engineering, Natinal Institute of Technology, Kurukshetra, India
Keywords: Pedestrians; Crossing speed; Walking speed; Speed Ratio; Distribution
1. Introduction
Pedestrian movement is a mode of travel to a given destination on foot. It is an effective mode of transportation for short trips. Walking is a major mode of transportation in Indian cities also. Modal share of Tiruchirapalli city revealed that 64.7% of the total trips are made on foot (Arasan et al., 1994). Another study conducted in Mumbai revealed that all persons walk in a day irrespective of their income (Montgomery, 2006). Though walking has higher modal share than other modes in Indian cities, yet most of the cities provide a large
661 Satish Chandra and Anish Kumar Bharti / Procedia - Social and Behavioral Sciences 104 ( 2013 ) 660 – 667
share of scarce road space to motor vehicles. This has made the present traffic system chaotic. Now the local authorities are interested in providing good pedestrian facilities to encourage walking. Pedestrian speed whether it is during walking or crossing forms a major factor in the design and analysis of these facilities. The present study analyses the pedestrian speeds on the basis of gender and type of facility and compares the walking and crossing speeds of pedestrians in different cities.
2. Literature Review
Fruin (1971) studied 1000 non-baggage-carrying pedestrians inside the Port Authority Bus Terminal and Penns Station in New York City. He observed that the males walk faster than the females and the walking speed mostly declines after the age of 65. Wilson and Grayson (1980) examined the relationship of pedestrian speed with age and gender. They found that the average walking speed for men was 1.32 m/s and that for female was 1.27 m/s. Polus et al. (1983) analyzed properties and characteristics of pedestrian flow on sidewalks in Haifa (Israel). They found that walking speeds of men were significantly greater than those of women. Speeds were found inversely proportional to densities. Griffiths et al. (1984) found that crossing speed at unsignalized crossing averaged 1.72 m/s for the young, 1.47 m/s for the middle-aged, and 1.16 m/s for the elderly. Tanaboriboon et al. (1986) found that school age children in Singapore have crossing speeds similar to the elderly pedestrians as 0.9 m/s. Tanaboriboon and Guyano (1991) also observed similar results for walking speeds on a signalized intersection in Bangkok and found crossing speeds of male pedestrians to be 1.31 m/s and those of female pedestrians to be 1.23 m/s. Bowman and Vecellio (1994) described a Swedish study in which 15 percent of the older pedestrians crossed at speeds below 0.7 m/s. Coffin and Morrall (1995) based on their study in Canada, recommended a design speed of 1.0 m/s to be used at mid-block crossings where there are a large number of older pedestrians. Knoblauch et al. (1996) found a mean crossing speed of 1.51 m/s for younger pedestrians and 1.25 m/s for older pedestrians in Eastern cities of Florida. They found 15th percentile speeds of 1.25 and 0.97 m/s for younger and older pedestrians respectively, and recommended a value of 0.9 m/s in areas with many older
sings for a mix of pedestrian age groups in the range of 1.2 m/s to 1.35 m/s. In case the crossings are less busy, the average walking speed approximates to the free-flow walking speed of 1.6 m/s. For disabled persons, 0.5 m/s is defined as the more appropriate value. Tarawneh (2001) evaluated pedestrian speeds in Jordan and found that pedestrians between the ages of 21-30 years were the fastest and pedestrians over 65 years were the slowest group of pedestrians. Male crossing speeds (1.35 m/s) were significantly higher than female crossing speeds (1.33 m/s). The average and 15th percentile pedestrian crossing speeds were 1.34 and 1.11 m/s, respectively. Carey (2005) found that the average walking speed and the 15th percentile walking speed was greater for the younger pedestrians than the older ones. He also found that when the pedestrians are crossing in groups their walking speeds tends to be slower.
Manual of Traffic Studies (1999) used a pedestrian crossing speed of 1.1 m/s to 1.2 m/s. The US Institute of Transportation Engineers (ITE) suggests speed of 0.75 m/s at a location with higher proportion of seniors. This value is expected to accommodate 87% of pedestrian population. The crosswalk walking speeds given in HCM (2010) are based on the proportion of elderly (above 65 years) in the total facility users. For less than 20% elders, it suggests a speed of 1.2 m/s and above that it is taken as 1.0 m/s. The Manual on Uniform Traffic Control Devices (MUTCD 2003) suggests a standard value of 1.21 m/s to allow users to walk from the curb to the far side of the travelled way. The above discussion indicates that the pedestrian speeds are different during crossing and walking and there exit a large variation in these speed in different countries. Walking and crossing speed are important input to the design of pedestrian facilities. Therefore the present study was taken up to determine speed of pedestrian on different types of facilities in India.
662 Satish Chandra and Anish Kumar Bharti / Procedia - Social and Behavioral Sciences 104 ( 2013 ) 660 – 667
3. Data Collection
Data for pedestrian speeds were collected in different parts of the country under a CSIR sponsored research scheme during 2008-2009. Seven sites were selected for the present study; four for walking and three four crossing conditions. These sites belong to three different cities of India; Coimbatore, New Delhi and Chandigarh. Each location has different pedestrian volume, traffic volume and width of facility. Four different types of walking conditions i.e. Sidewalks, Wide-Sidewalks, Precincts and Carriageway and three types of crossing conditions i.e. 2-lane unidirectional, 3-lane bidirectional and 4-lane bidirectional traffic are considered. Data was collected by videography and the pedestrians were categorized on the basis of their gender. Details of the study location are given in Table 1.
Table 1. Details of Study Locations Sl. No. Location Type of Facility Pedestrian Movement Sample Size
2 Outside income tax office (I.T.O.), New Delhi Wide-sidewalk Walking 234
3 City centre, Chandigarh Precinct Walking 168
4 Gandhipuram, Coimbatore Carriageway Walking 379
5 Connaught place, New Delhi 2-lane, Unidirectional Crossing 281
6 Sukna lake, Chandigarh 3-lane undivided, Bi-directional
Crossing 47
7 Old Washermenpet, Chennai 4-lane undivided, Crossing 175
4. Analysis of Walking Speed
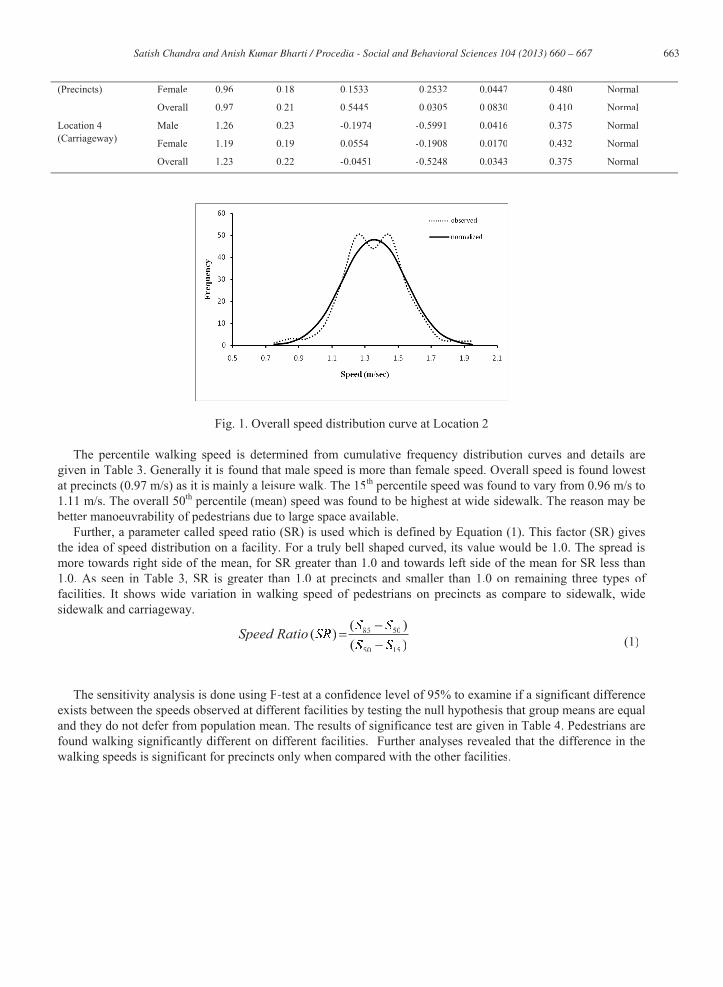
The walking speed on various types of facilities is estimated and suitable distribution function is fitted to the data. The details of the analysis are given in Table 2 for four types of facilities and a typical fitted distribution function is shown in Figure 1. Two peaks in this figure are due to male and female pedestrians. Table 2 shows that pedestrian walking speed follows the normal distribution in all types of facilities and mean walking speed is maximum at location outside the I.T.O, New Delhi (Wide-sidewalk). The minimum walking speed is observed at city centre location on precincts. On sidewalks and on carriageway, skewness value is negative indicating that normal distribution curve has more spread in left side of the mean value.
Table 2. Statistical results of normal distribution curve for different facilities
Location Gender Mean
speed (m/sec)
S.D. (m/sec)
Skewness
Kurtosis K-S test
Observed Critical Distribution
Location1, (Sidewalk)
Male 1.27 0.21 -0.1682 -0.1950 0.0192 0.391 Normal
Female 1.19 0.19 -0.5151 0.9341 0.04798 0.432 Normal
Overall 1.25 0.21 -0.1695 -0.0436 0.0243 0.391 Normal
Location 2, (Wide-Sidewalk)
Male 1.37 0.19 0.0033 0.9716 0.0325 0.375 Normal
Female 1.27 0.15 0.4706 1.2582 0.0261 0.521 Normal
Overall 1.36 0.19 0.0582 0.8687 0.0231 0.375 Normal
Location 3 Male 0.97 0.22 0.5713 -0.1271 0.0376 0.410 Normal
663 Satish Chandra and Anish Kumar Bharti / Procedia - Social and Behavioral Sciences 104 ( 2013 ) 660 – 667
(Precincts) Female 0.96 0.18 0.1533 -0.2532 0.0447 0.480 Normal
Overall 0.97 0.21 0.5445 -0.0305 0.0830 0.410 Normal
Location 4(Carriageway)
Male 1.26 0.23 -0.1974 -0.5991 0.0416 0.375 Normal
Female 1.19 0.19 0.0554 -0.1908 0.0170 0.432 Normal
Overall 1.23 0.22 -0.0451 -0.5248 0.0343 0.375 Normal
Fig. 1. Overall speed distribution curve at Location 2
The percentile walking speed is determined from cumulative frequency distribution curves and details aregiven in Table 3. Generally it is found that male speed is more than female speed. Overall speed is found lowestat precincts (0.97 m/s) as it is mainly a leisure walk. The 15th percentile speed was found to vary from 0.96 m/s to1.11 m/s. The overall 50th percentile (mean) speed was found to be highest at wide sidewalk. The reason may bebetter manoeuvrability of pedestrians due to large space available.
Further, a parameter called speed ratio (SR) is used which is defined by Equation (1). This factor (SR) givesthe idea of speed distribution on a facility. For a truly bell shaped curved, its value would be 1.0. The spread ismore towards right side of the mean, for SR greater than 1.0 and towards left side of the mean for SR less than1.0. As seen in Table 3, SR is greater than 1.0 at precincts and smaller than 1.0 on remaining three types of facilities. It shows wide variation in walking speed of pedestrians on precincts as compare to sidewalk, wide sidewalk and carriageway.
85 50
50 15
( )85 50)( )50 15
85 5Speed Ratio SR(50 1
(1)
The sensitivity analysis is done using F-test at a confidence level of 95% to examine if a significant difference exists between the speeds observed at different facilities by testing the null hypothesis that group means are equaland they do not defer from population mean. The results of significance test are given in Table 4. Pedestrians arefound walking significantly different on different facilities. Further analyses revealed that the difference in thewalking speeds is significant for precincts only when compared with the other facilities.
664 Satish Chandra and Anish Kumar Bharti / Procedia - Social and Behavioral Sciences 104 ( 2013 ) 660 – 667
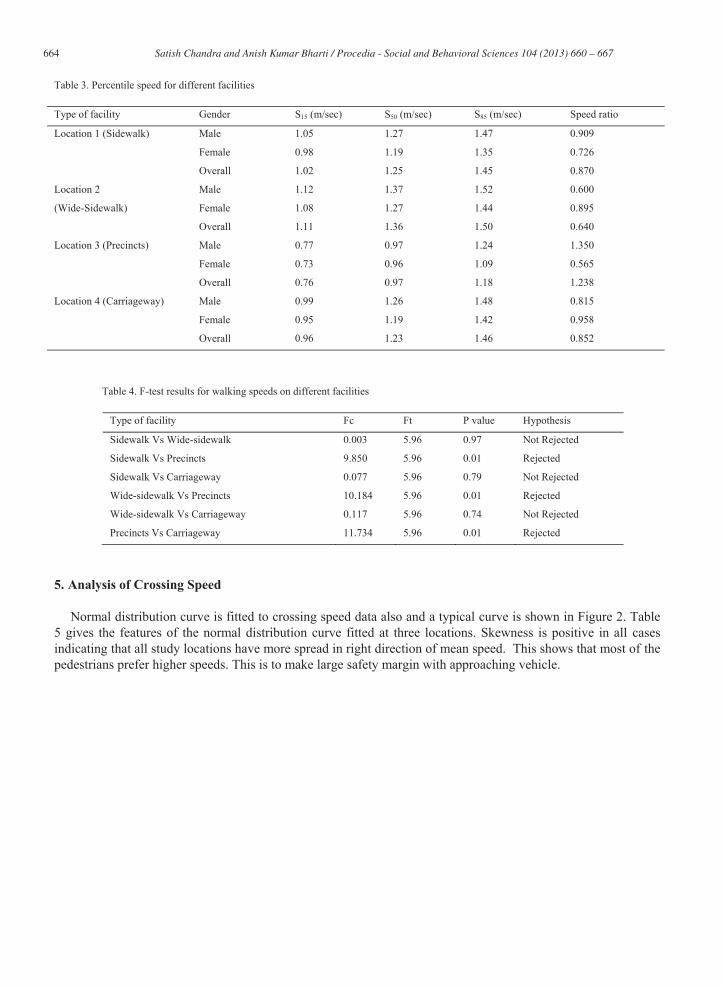
Table 3. Percentile speed for different facilities
Type of facility Gender S15 (m/sec) S50 (m/sec) S85 (m/sec) Speed ratio
Location 1 (Sidewalk) Male 1.05 1.27 1.47 0.909
Female 0.98 1.19 1.35 0.726
Overall 1.02 1.25 1.45 0.870
Location 2
(Wide-Sidewalk)
Male 1.12 1.37 1.52 0.600
Female 1.08 1.27 1.44 0.895
Overall 1.11 1.36 1.50 0.640
Location 3 (Precincts) Male 0.77 0.97 1.24 1.350
Female 0.73 0.96 1.09 0.565
Overall 0.76 0.97 1.18 1.238
Location 4 (Carriageway) Male 0.99 1.26 1.48 0.815
Female 0.95 1.19 1.42 0.958
Overall 0.96 1.23 1.46 0.852
Table 4. F-test results for walking speeds on different facilities
Type of facility Fc Ft P value Hypothesis
Sidewalk Vs Wide-sidewalk 0.003 5.96 0.97 Not Rejected
Sidewalk Vs Precincts 9.850 5.96 0.01 Rejected
Sidewalk Vs Carriageway 0.077 5.96 0.79 Not Rejected
Wide-sidewalk Vs Precincts 10.184 5.96 0.01 Rejected
Wide-sidewalk Vs Carriageway 0.117 5.96 0.74 Not Rejected
Precincts Vs Carriageway 11.734 5.96 0.01 Rejected
5. Analysis of Crossing Speed
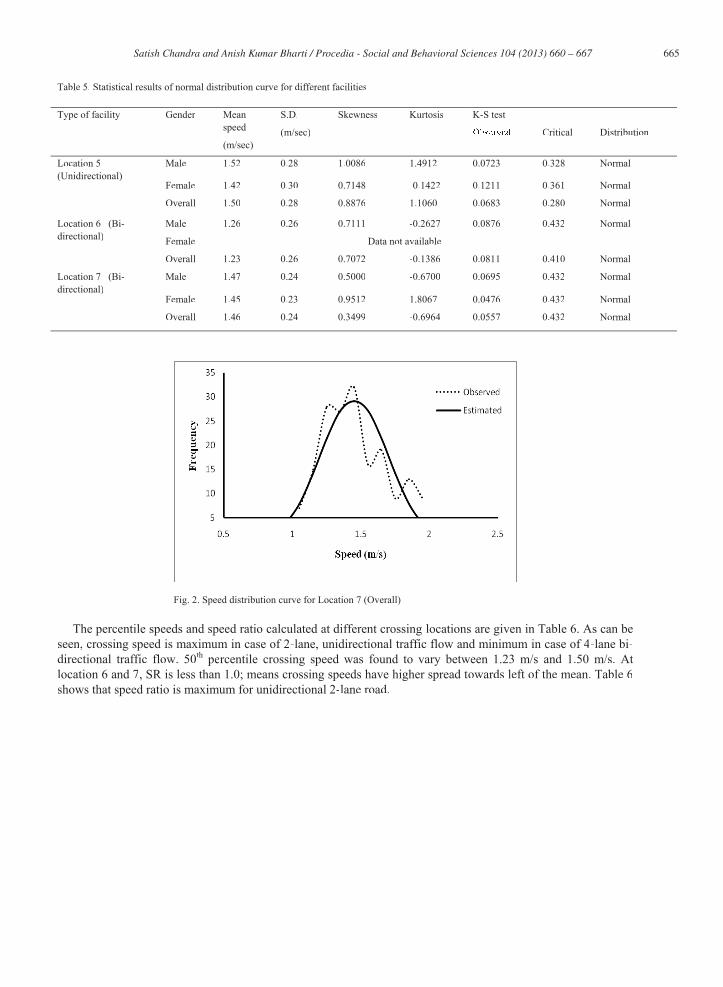
Normal distribution curve is fitted to crossing speed data also and a typical curve is shown in Figure 2. Table 5 gives the features of the normal distribution curve fitted at three locations. Skewness is positive in all cases indicating that all study locations have more spread in right direction of mean speed. This shows that most of the pedestrians prefer higher speeds. This is to make large safety margin with approaching vehicle.
665 Satish Chandra and Anish Kumar Bharti / Procedia - Social and Behavioral Sciences 104 ( 2013 ) 660 – 667
Table 5. Statistical results of normal distribution curve for different facilities
Type of facility Gender Meanspeed
(m/sec)
S.D.
(m/sec)
Skewness Kurtosis K-S test
Critical Distribution
Location 5(Unidirectional)
Male 1.52 0.28 1.0086 1.4912 0.0723 0.328 Normal
Female 1.42 0.30 0.7148 -0.1422 0.1211 0.361 Normal
Overall 1.50 0.28 0.8876 1.1060 0.0683 0.280 Normal
Location 6 (Bi-directional)
Male 1.26 0.26 0.7111 -0.2627 0.0876 0.432 Normal
Female Data not available
Overall 1.23 0.26 0.7072 -0.1386 0.0811 0.410 Normal
Location 7 (Bi-directional)
Male 1.47 0.24 0.5000 -0.6700 0.0695 0.432 Normal
Female 1.45 0.23 0.9512 1.8067 0.0476 0.432 Normal
Overall 1.46 0.24 0.3499 -0.6964 0.0557 0.432 Normal
Fig. 2. Speed distribution curve for Location 7 (Overall)
The percentile speeds and speed ratio calculated at different crossing locations are given in Table 6. As can be seen, crossing speed is maximum in case of 2-lane, unidirectional traffic flow and minimum in case of 4-lane bi-directional traffic flow. 50th percentile crossing speed was found to vary between 1.23 m/s and 1.50 m/s. At location 6 and 7, SR is less than 1.0; means crossing speeds have higher spread towards left of the mean. Table 6shows that speed ratio is maximum for unidirectional 2-lane road.
666 Satish Chandra and Anish Kumar Bharti / Procedia - Social and Behavioral Sciences 104 ( 2013 ) 660 – 667
Table 6. Percentile speed for different facilities
Table 7 shows that there exists a significant difference in the crossing speeds of pedestrians for different types
of carriageway. However there is no statistically significant difference between speeds of male and female pedestrians. Important point is that walking speeds are significantly different from crossing speeds (Table 8).
Table 7. F-test results for pedestrian crossing speeds on different facilities
Type of carriageway Fc Ft Pvalue Hypothesis
Facilities 4.3277 3.8 0.04 Rejected
2-lane,Unidirectional Vs 3-lane, Bi-directional
0.0504 7.6 0.83 Not Rejected
2-lane,Unidirectional Vs 4-lane, Bi-directional
5.6852 7.6 0.063 Not Rejected
3-lane, Bi-directional Vs 4-lane, Bi-directional
7.3710 7.6 0.052 Not Rejected
Table 8. F-test results for male and female for walking and crossing speeds
Male Vs Female Fc Ft Pvalue Hypothesis
Walking 0.88 4.2 0.36 Not Rejected
Crossing 1.25 4.6 0.28 Not Rejected
Walking Vs crossing 19.53 4.06 0.00 Rejected
6. Conclusions
Pedestrian walking speeds follow the normal distribution for all types of facilities and at all site locations.
Precincts show lower pedestrians walking speeds as compared to other three types of facilities. Out of the four study locations, the one near I.T.O, New Delhi shows higher mean walking speed. This location has many government offices and this could be the reason for higher speeds. In all the four study locations male walking speed is higher than female pedestrians walking speed. Similar results are observed by Fruin (1971), Polus et al. (1983) and Montufar et al. (2007) also. Precincts show significant difference in walking speed compared to other three types of facilities. Speed ratio is higher in the case of precincts and lower in the case of wide-sidewalks.
Type of facility Gender S15 (m/sec) S50 (m/sec) S85 (m/sec) Speed ratio
Location 5
(2-lane Unidirectional)
Male 1.28 1.52 1.81 1.208
Female 1.11 1.41 1.73 1.067
Overall 1.22 1.50 1.78 1.071
Location 6
(3-lane bidirectional)
Male 0.95 1.26 1.51 0.806
Female Data Not available
Overall 0.90 1.23 1.49 0.788
Location 7 (4-lane bi directional)
Male 1.18 1.47 1.49 0.966
Female 1.17 1.45 1.74 1.036
Overall 1.18 1.46 1.71 0.893
667 Satish Chandra and Anish Kumar Bharti / Procedia - Social and Behavioral Sciences 104 ( 2013 ) 660 – 667
Pedestrian crossing speeds also follow normal distribution for all the sites selected for this study. The crossing speeds of male pedestrians are higher than female pedestrians which is similar to the findings of Tarawneh (2001). Location 6 shows lower crossing speed as compared to other sites. Two-lane one way road section shows higher pedestrian crossing speed as compared to other two sites. There is a significant difference in the pedestrian crossing speed of different facilities. There is no significant difference in walking speeds and crossing speeds of male and female pedestrians.
The crossing speeds of pedestrians are found higher than the walking speed irrespective of gender. It is observed that the walking speeds of pedestrians are significantly different from their crossing speeds. This supports the findings of Montufar et al. (2007). The walking speeds of male pedestrians in India are lower than those reported by various researchers. Female pedestrian speeds are comparable to the findings of Kotkar et al. (2010), but are greater than those reported for Jordan by Tarawneh, 2001. It can be stated that pedestrian characteristics in India are different from other countries and hence the design of pedestrian facility should be based on the characteristics of Indian pedestrians, rather than following other international standards.
References
Journal of Transportation Engineering, ASCE, 120(2), 283 294 Bowman, B Transportation Research Record: Journal of Transportation Research Board, No 1438, pp.67 73. Coffin, A. and J. Morrall (1995) Walking Speeds of Elderly Pedestrians at Crosswalks. In Transportation Research Record, No. 1487, TRB, National Research Council, Washington, DC, pp. 63-67.
Metropolitan Association of Urban Designers and Environmental Planners, New York. Traffic
Engineering and Control, 25, pp. 365 371. Highway Capacity Manual, (2000) Special Report No. 209, Transportation Research Board. Washington, DC, USA.
rban planning and development,ASCE, Vol. 136,No.1, pp.23-33. Knoblauch, R.L., M.T. P - Transportation Research Record, No. 1538, TRB, National Research Council, Washington, DC, 1995, pp. 27-38. Manual of Uniform Traffic Control Devices MUTCD (2003), US Department of Transportation, Federal Highway Administration Manual of Traffic studies (1999) Institite of Transportation Engineers, US
Transportation Research Record 2002, TRB, National Research Council, Washington D C, USA, 90-97
Journal of Transportation
Engineering, 112, ASCE, USA, pp.229 235. Journal of Safety
Research 32, pp.229-236. J. of Transportation Engineering. Proc. ASCE 109,
pp. 46 57. Journal of
Transportation Research Board, No 1294, pp 52-56. Wilson, D. G. and Age- , Transport Research Laboratory, Report No. LR 933, TRB, NCHRP, Washington, DC, USA.