16
Spending retirement assets...or not? NOVEMBER 2017 MKTG1117U-310118-923193
Spending retirement assets...or not?
NOVEMBER 2017
MKTG1117U-310118-923193
Who ever thought spending retirement assets would be so difficult?
…today’s retirees apparently.
Something unexpected has been the shared experience
for our most recent generation of retirees. The vast majority
haven't been spending their retirement savings—leaving
nest eggs mostly untouched and living on ready sources
of income instead. However, future retirees may be
less fortunate.
While on the surface this is indeed good news—and appears to support the
argument that fears of a future retirement crisis are overstated, the conditions
that supported this spending and savings behavior are unlikely to persist.
Future retirees will face a much different retirement landscape and will need
to adopt new sets of skills—behavioral and financial—that will help them
systematically tap into retirement savings to support future spending.
Financial industry norms and academic theories have always assumed assets
accumulated for retirement would be systematically withdrawn—following the
“4% rule” or some other rule of thumb or system—by retirees in order to
maintain a consistent standard of living. Technically, this is referred to as
“consumption smoothing” whereby individuals seek to have consistent
spending on par with pre-retirement levels. With concerns that retirement
savings for individuals may be dangerously low,1 the fear has been that
withdrawals for such smoothing could leave retirees running out of funds well
short of their passing away.
This research conducted by the BlackRock Retirement Institute (BRI) in
conjunction with the Employee Benefit Research Institute (EBRI) found that
on average across all wealth levels, most current retirees still have 80% of
their pre-retirement savings after almost two decades in retirement.
1 National Institute on Retirement Security, The Retirement Savings Crisis: Is It Worse Than We Think? 2013
INTRODUCTION
By Bruce Wolfe, CFA
Managing Director and
Executive Director of the
BlackRock Retirement Institute
Robert Brazier
Content Developer and
Manager for the BlackRock
Retirement Institute
2 SPENDING RETIREMENT ASSETS.. .OR NOT?
MKTG1117U-310118-923193
This is significant because:
1 These findings begin to challenge
industry norms and academic theories
about lifecycle consumption especially
during the retirement phase
2 Across all wealth levels measured, more
than one third of current retirees grew
their assets—leaving considerable
potential consumption on the table
3 Late in life out-of-pocket medical
expenses—a major reason to retain
assets—do not appear to be warranted
except for a very small portion of the
population
4 The financial landscape for future
retirees will most likely be more
challenging, requiring different savings
and spending behaviors
This paper sets to lay the foundation for how
retirees have managed their sources of cash—
assets and income—against their spending
behaviors. The resulting “husbanding” of assets
over the past two decades may be due to a host of
favorable environmental factors current retirees
benefited from during their working, accumulation
years. These included beneficial changes to Social
Security and Medicare, a relatively high
percentage of jobs that offered defined benefit
pensions, strong real estate appreciation and an
investment market that generally delivered strong
returns and high interest rates. Has the confluence
of these factors created a situation whereby
retirees may not have felt the pressure to draw
down principal from retirement savings in order
to maintain a reasonable standard of living?
Perhaps retirees had other plans for their assets
beyond themselves—bequests or charitable
donations come to mind. Possibly they would have
preferred to spend more freely but lacked the
financial confidence or tools to efficiently
decumulate their assets or were worried about
end-of-life healthcare expenses? Looking further,
perhaps there were strong emotional biases at
play—with fear of outliving retirement assets at the
top of the list.2
2 Gallup's Economy and Personal Finance survey, 2016
Methodology
The objective of the study was to analyze the “how” and some possible “whys” spending and liquid assets
change during retirement, taking into account (non-housing) assets, income, spending, out-of-pocket
medical expenses and bequests. Data was collected from the bi-annual Health and Retirement Study (HRS,
1992-2014) and the Consumption and Activities Mail Survey (CAMS, 2005-2015). A sample of 7,148 retiree
households provided self-reported asset data and out-of-pocket medical expenditure and a subsample
of 1,660 households provided the household expenditure data. Retirees were segmented into three
groups based on pre-retirement non-housing retirement assets — $0 to less than $200,000 (lowest wealth),
$200,000 to less than $500,000 (medium wealth) and $500,000 and above (highest wealth).
BLACKROCK RETIREMENT INSTITUTE 3
MKTG1117U-310118-923193
Retirement assets mostly resilient over time
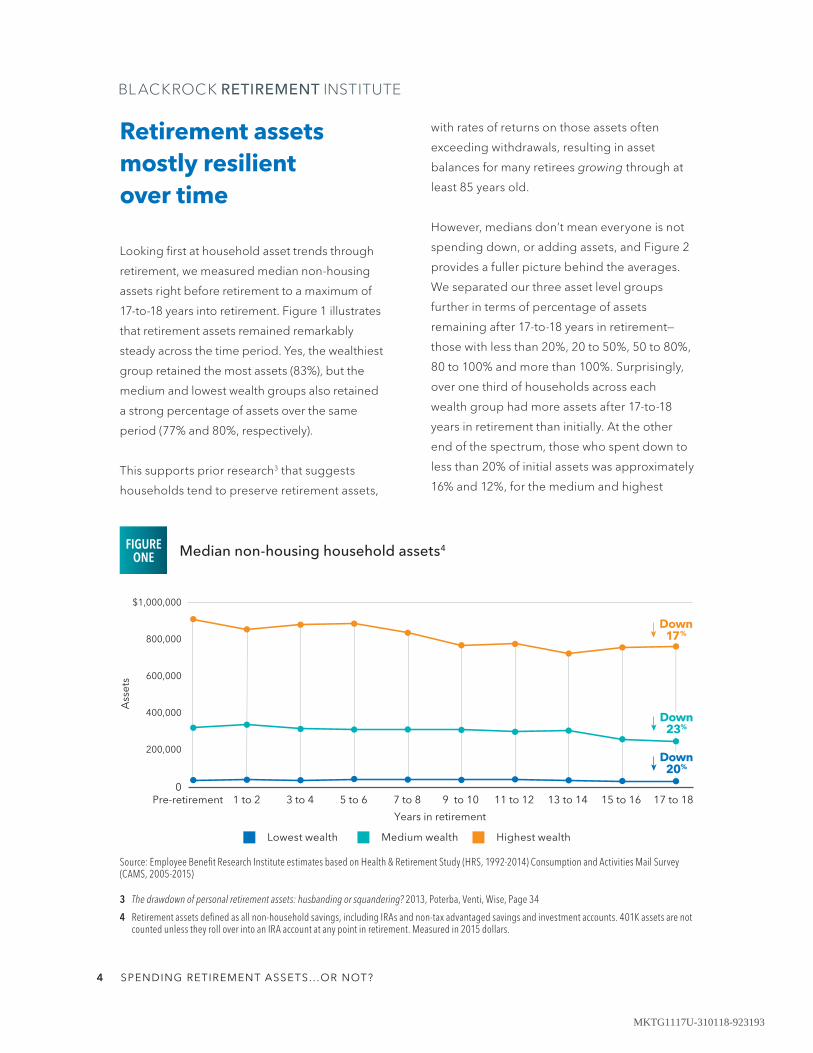
Looking first at household asset trends through
retirement, we measured median non-housing
assets right before retirement to a maximum of
17-to-18 years into retirement. Figure 1 illustrates
that retirement assets remained remarkably
steady across the time period. Yes, the wealthiest
group retained the most assets (83%), but the
medium and lowest wealth groups also retained
a strong percentage of assets over the same
period (77% and 80%, respectively).
This supports prior research3 that suggests
households tend to preserve retirement assets,
with rates of returns on those assets often
exceeding withdrawals, resulting in asset
balances for many retirees growing through at
least 85 years old.
However, medians don’t mean everyone is not
spending down, or adding assets, and Figure 2
provides a fuller picture behind the averages.
We separated our three asset level groups
further in terms of percentage of assets
remaining after 17-to-18 years in retirement—
those with less than 20%, 20 to 50%, 50 to 80%,
80 to 100% and more than 100%. Surprisingly,
over one third of households across each
wealth group had more assets after 17-to-18
years in retirement than initially. At the other
end of the spectrum, those who spent down to
less than 20% of initial assets was approximately
16% and 12%, for the medium and highest
Median non-housing household assets4
Source: Employee Benefit Research Institute estimates based on Health & Retirement Study (HRS, 1992-2014) Consumption and Activities Mail Survey (CAMS, 2005-2015)
3 The drawdown of personal retirement assets: husbanding or squandering? 2013, Poterba, Venti, Wise, Page 34
4 Retirement assets defined as all non-household savings, including IRAs and non-tax advantaged savings and investment accounts. 401K assets are not counted unless they roll over into an IRA account at any point in retirement. Measured in 2015 dollars.
FIGURE ONE
Pre-retirement 1 to 2 3 to 40
200,000
400,000
600,000
800,000
$1,000,000
Years in retirement
Ass
ets
5 to 6 7 to 8 9 to 10 11 to 12 13 to 14 15 to 16 17 to 18
Down17%
Down23%
Down20%
Lowest wealth Medium wealth Highest wealth
4 SPENDING RETIREMENT ASSETS.. .OR NOT?
MKTG1117U-310118-923193
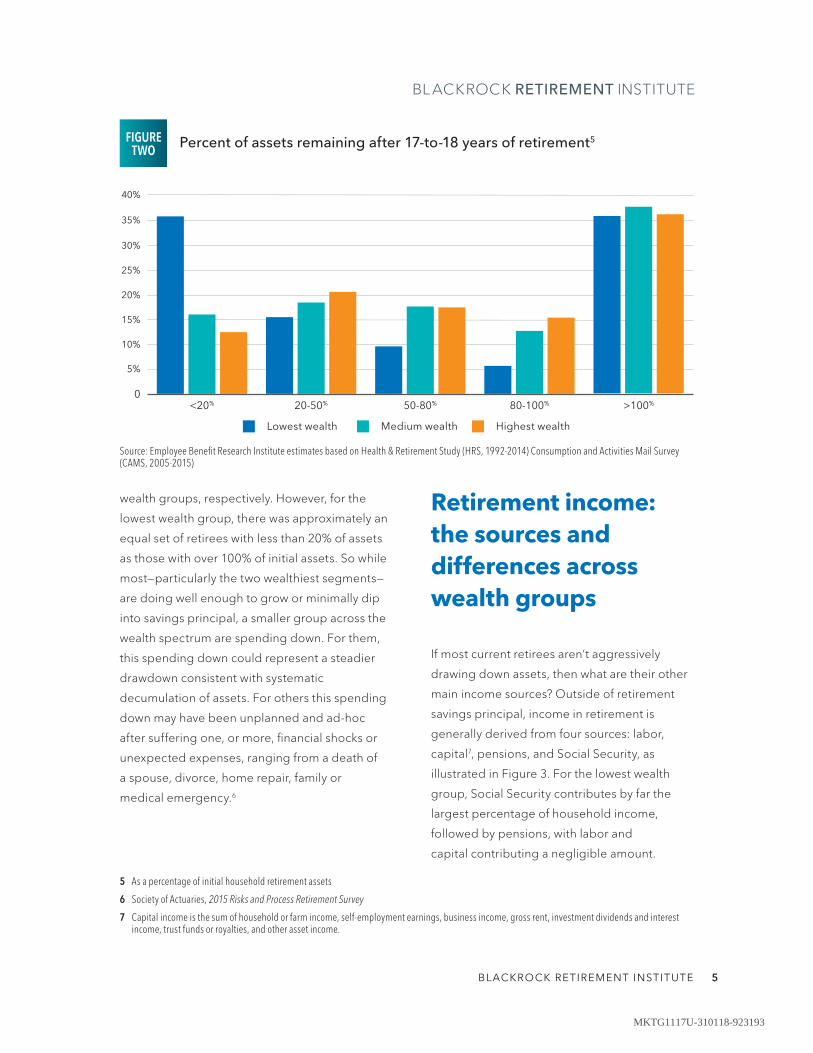
wealth groups, respectively. However, for the
lowest wealth group, there was approximately an
equal set of retirees with less than 20% of assets
as those with over 100% of initial assets. So while
most—particularly the two wealthiest segments—
are doing well enough to grow or minimally dip
into savings principal, a smaller group across the
wealth spectrum are spending down. For them,
this spending down could represent a steadier
drawdown consistent with systematic
decumulation of assets. For others this spending
down may have been unplanned and ad-hoc
after suffering one, or more, financial shocks or
unexpected expenses, ranging from a death of
a spouse, divorce, home repair, family or
medical emergency.6
Retirement income: the sources and differences across wealth groups
If most current retirees aren’t aggressively
drawing down assets, then what are their other
main income sources? Outside of retirement
savings principal, income in retirement is
generally derived from four sources: labor,
capital7, pensions, and Social Security, as
illustrated in Figure 3. For the lowest wealth
group, Social Security contributes by far the
largest percentage of household income,
followed by pensions, with labor and
capital contributing a negligible amount.
Percent of assets remaining after 17-to-18 years of retirement5
Source: Employee Benefit Research Institute estimates based on Health & Retirement Study (HRS, 1992-2014) Consumption and Activities Mail Survey (CAMS, 2005-2015)
5 As a percentage of initial household retirement assets
6 Society of Actuaries, 2015 Risks and Process Retirement Survey
7 Capital income is the sum of household or farm income, self-employment earnings, business income, gross rent, investment dividends and interest income, trust funds or royalties, and other asset income.
FIGURE TWO
>100%80-100%50-80%20-50%<20%
Lowest wealth Medium wealth Highest wealth
0
5%
10%
15%
20%
25%
30%
35%
40%
BLACKROCK RETIREMENT INSTITUTE 5
MKTG1117U-310118-923193
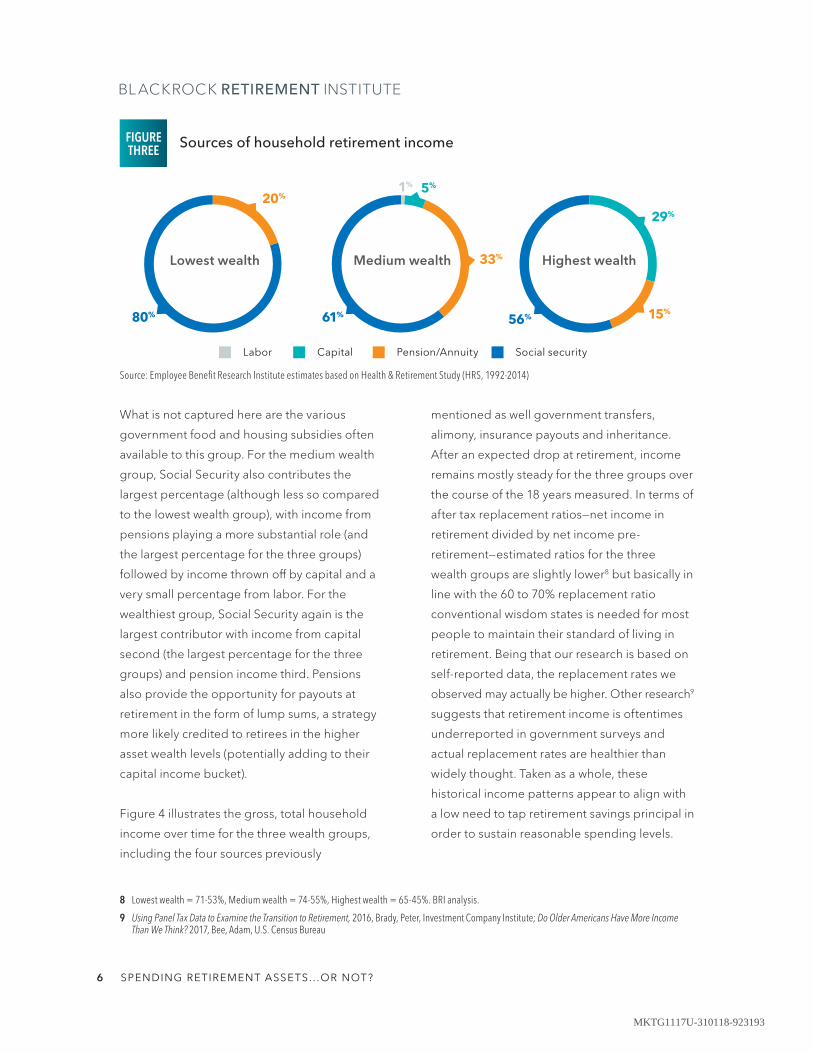
What is not captured here are the various
government food and housing subsidies often
available to this group. For the medium wealth
group, Social Security also contributes the
largest percentage (although less so compared
to the lowest wealth group), with income from
pensions playing a more substantial role (and
the largest percentage for the three groups)
followed by income thrown off by capital and a
very small percentage from labor. For the
wealthiest group, Social Security again is the
largest contributor with income from capital
second (the largest percentage for the three
groups) and pension income third. Pensions
also provide the opportunity for payouts at
retirement in the form of lump sums, a strategy
more likely credited to retirees in the higher
asset wealth levels (potentially adding to their
capital income bucket).
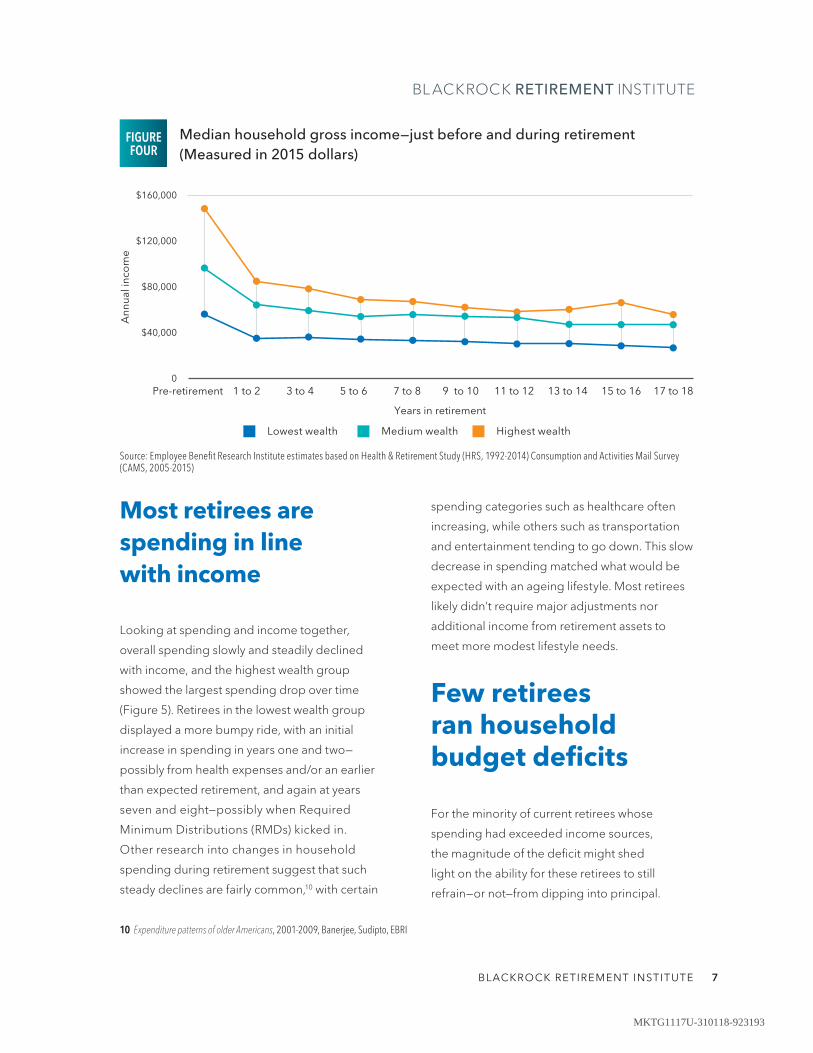
Figure 4 illustrates the gross, total household
income over time for the three wealth groups,
including the four sources previously
mentioned as well government transfers,
alimony, insurance payouts and inheritance.
After an expected drop at retirement, income
remains mostly steady for the three groups over
the course of the 18 years measured. In terms of
after tax replacement ratios—net income in
retirement divided by net income pre-
retirement—estimated ratios for the three
wealth groups are slightly lower8 but basically in
line with the 60 to 70% replacement ratio
conventional wisdom states is needed for most
people to maintain their standard of living in
retirement. Being that our research is based on
self-reported data, the replacement rates we
observed may actually be higher. Other research9
suggests that retirement income is oftentimes
underreported in government surveys and
actual replacement rates are healthier than
widely thought. Taken as a whole, these
historical income patterns appear to align with
a low need to tap retirement savings principal in
order to sustain reasonable spending levels.
Sources of household retirement income
Source: Employee Benefit Research Institute estimates based on Health & Retirement Study (HRS, 1992-2014)
FIGURE THREE
Labor Capital Pension/Annuity Social security
Highest wealthMedium wealthLowest wealth
15%56%61%
29%
1% 5%
33%
20%
80%
8 Lowest wealth = 71-53%, Medium wealth = 74-55%, Highest wealth = 65-45%. BRI analysis.
9 Using Panel Tax Data to Examine the Transition to Retirement, 2016, Brady, Peter, Investment Company Institute; Do Older Americans Have More Income Than We Think? 2017, Bee, Adam, U.S. Census Bureau
6 SPENDING RETIREMENT ASSETS.. .OR NOT?
MKTG1117U-310118-923193
Most retirees are spending in line with income
Looking at spending and income together,
overall spending slowly and steadily declined
with income, and the highest wealth group
showed the largest spending drop over time
(Figure 5). Retirees in the lowest wealth group
displayed a more bumpy ride, with an initial
increase in spending in years one and two—
possibly from health expenses and/or an earlier
than expected retirement, and again at years
seven and eight—possibly when Required
Minimum Distributions (RMDs) kicked in.
Other research into changes in household
spending during retirement suggest that such
steady declines are fairly common,10 with certain
spending categories such as healthcare often
increasing, while others such as transportation
and entertainment tending to go down. This slow
decrease in spending matched what would be
expected with an ageing lifestyle. Most retirees
likely didn’t require major adjustments nor
additional income from retirement assets to
meet more modest lifestyle needs.
Few retirees ran household budget deficits
For the minority of current retirees whose
spending had exceeded income sources,
the magnitude of the deficit might shed
light on the ability for these retirees to still
refrain—or not—from dipping into principal.
10 Expenditure patterns of older Americans, 2001-2009, Banerjee, Sudipto, EBRI
Median household gross income—just before and during retirement (Measured in 2015 dollars)
Source: Employee Benefit Research Institute estimates based on Health & Retirement Study (HRS, 1992-2014) Consumption and Activities Mail Survey (CAMS, 2005-2015)
FIGURE FOUR
Pre-retirement 1 to 2 3 to 40
$40,000
$80,000
$120,000
$160,000
Ann
ual i
nco
me
5 to 6 7 to 8 9 to 10 11 to 12 13 to 14 15 to 16 17 to 18
Years in retirement
Lowest wealth Medium wealth Highest wealth
BLACKROCK RETIREMENT INSTITUTE 7
MKTG1117U-310118-923193
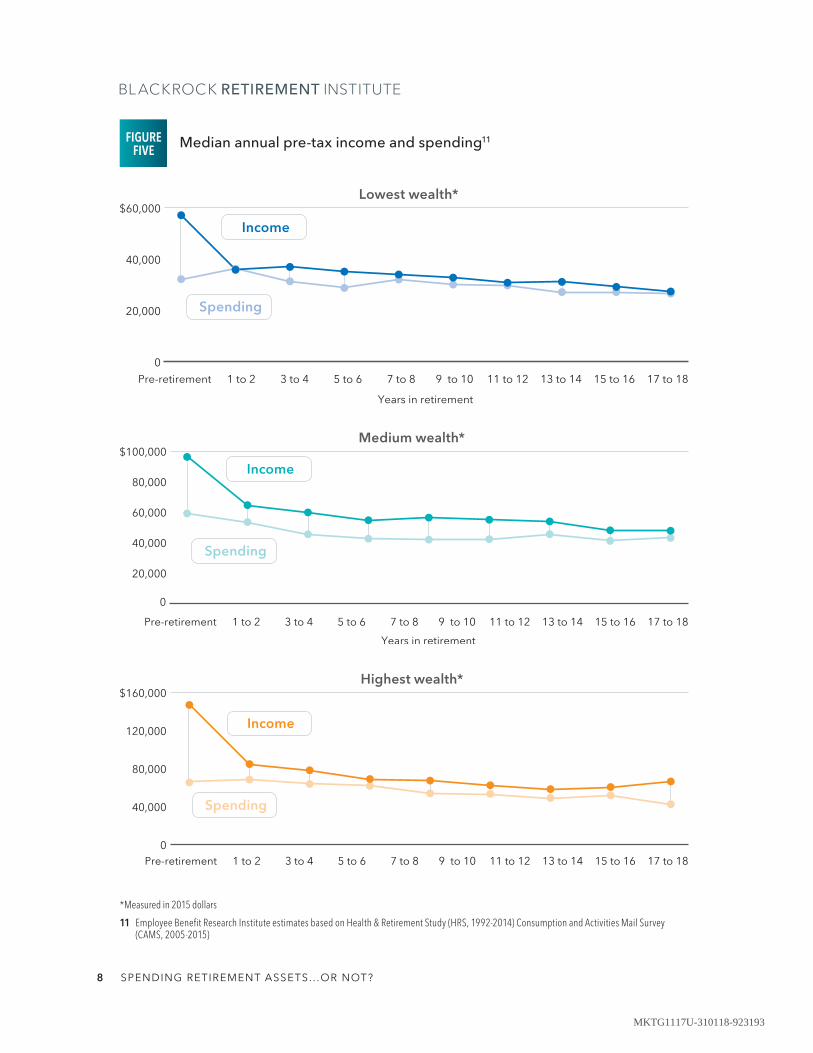
Median annual pre-tax income and spending11
Pre-retirement 1 to 2 3 to 4
0
20,000
40,000
$60,000
Years in retirement
5 to 6 7 to 8 9 to 10 11 to 12 13 to 14 15 to 16 17 to 18
Lowest wealth*
Income
Spending
Pre-retirement 1 to 2 3 to 4 5 to 6 7 to 8 9 to 10 11 to 12 13 to 14 15 to 16 17 to 18
Income
Spending
20,000
60,000
80,000
40,000
$100,000
Years in retirement
0
Medium wealth*
Pre-retirement 1 to 2 3 to 4 5 to 6 7 to 8 9 to 10 11 to 12 13 to 14 15 to 16 17 to 18
Income
Spending
0
120,000
80,000
40,000
$160,000Highest wealth*
FIGURE FIVE
*Measured in 2015 dollars
11 Employee Benefit Research Institute estimates based on Health & Retirement Study (HRS, 1992-2014) Consumption and Activities Mail Survey (CAMS, 2005-2015)
8 SPENDING RETIREMENT ASSETS.. .OR NOT?
MKTG1117U-310118-923193
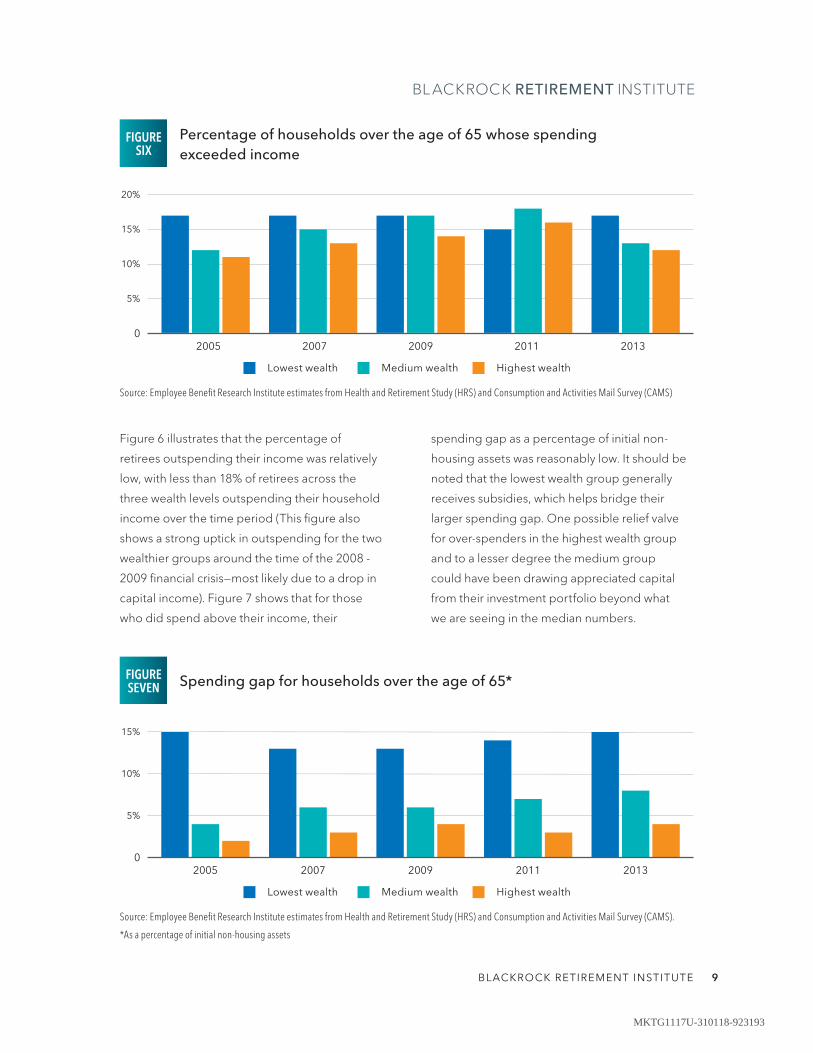
Figure 6 illustrates that the percentage of
retirees outspending their income was relatively
low, with less than 18% of retirees across the
three wealth levels outspending their household
income over the time period (This figure also
shows a strong uptick in outspending for the two
wealthier groups around the time of the 2008 -
2009 financial crisis—most likely due to a drop in
capital income). Figure 7 shows that for those
who did spend above their income, their
spending gap as a percentage of initial non-
housing assets was reasonably low. It should be
noted that the lowest wealth group generally
receives subsidies, which helps bridge their
larger spending gap. One possible relief valve
for over-spenders in the highest wealth group
and to a lesser degree the medium group
could have been drawing appreciated capital
from their investment portfolio beyond what
we are seeing in the median numbers.
FIGURE SIX
FIGURE SEVEN
Percentage of households over the age of 65 whose spending exceeded income
Spending gap for households over the age of 65*
Source: Employee Benefit Research Institute estimates from Health and Retirement Study (HRS) and Consumption and Activities Mail Survey (CAMS)
Source: Employee Benefit Research Institute estimates from Health and Retirement Study (HRS) and Consumption and Activities Mail Survey (CAMS).
*As a percentage of initial non-housing assets
0
5%
10%
15%
20%
20132011200920072005
Lowest wealth Medium wealth Highest wealth
0
5%
10%
15%
20132011200920072005
Lowest wealth Medium wealth Highest wealth
BLACKROCK RETIREMENT INSTITUTE 9
MKTG1117U-310118-923193
During the 2005-2013 period, investment
returns for a conservative 20% equity-80% fixed
income portfolio and a more aggressive
60%-40% portfolio delivered annualized
returns of 5.3-6.4% respectively. Looking at the
time period for the entire study (1992-2015)
similar portfolios delivered annualized returns
of 6.6-8.0%, respectively.12
Accessing these appreciated assets could
meaningfully contribute to any shortfall without
reducing principal. Further analysis here is
needed, but it’s within reason to suggest that even
for these “over-spenders,” the need to dip into
principal to fund a deficit was minimal—if at all.
Why are current retirees spending perhaps less than anticipated?
It would appear that for most retirees, keeping
up with the day-to-day expenses of retirement
isn’t requiring them to dip into retirement
capital. While this sounds like good news for
those worried that we might already be mired in
a retirement crisis, why then aren’t retirees
loosening the purse strings more on their
retirement assets to fund additional
discretionary spending? We looked at
two common reasons often attributed to
holding on to retirement savings.
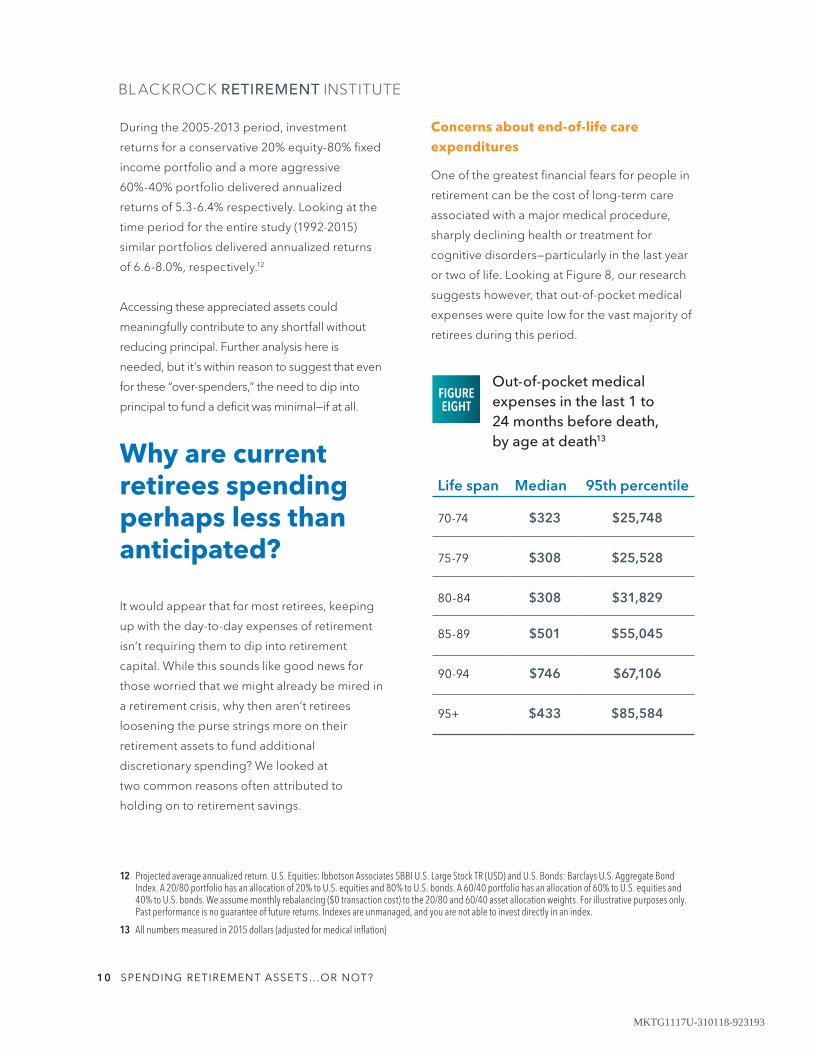
Concerns about end-of-life care expenditures
One of the greatest financial fears for people in
retirement can be the cost of long-term care
associated with a major medical procedure,
sharply declining health or treatment for
cognitive disorders—particularly in the last year
or two of life. Looking at Figure 8, our research
suggests however, that out-of-pocket medical
expenses were quite low for the vast majority of
retirees during this period.
12 Projected average annualized return. U.S. Equities: Ibbotson Associates SBBI U.S. Large Stock TR (USD) and U.S. Bonds: Barclays U.S. Aggregate Bond Index. A 20/80 portfolio has an allocation of 20% to U.S. equities and 80% to U.S. bonds. A 60/40 portfolio has an allocation of 60% to U.S. equities and 40% to U.S. bonds. We assume monthly rebalancing ($0 transaction cost) to the 20/80 and 60/40 asset allocation weights. For illustrative purposes only. Past performance is no guarantee of future returns. Indexes are unmanaged, and you are not able to invest directly in an index.
13 All numbers measured in 2015 dollars (adjusted for medical inflation)
Life span Median 95th percentile
70-74 $323 $25,748
75-79 $308 $25,528
80-84 $308 $31,829
85-89 $501 $55,045
90-94 $746 $67,106
95+ $433 $85,584
Out-of-pocket medical expenses in the last 1 to 24 months before death, by age at death13
FIGURE EIGHT
10 SPENDING RETIREMENT ASSETS.. .OR NOT?
MKTG1117U-310118-923193
It’s not until the 95th percentiles of those
surveyed that out-of-pocket expenses jumped
to more significant levels. Even then, it could
be argued that for someone facing such an
acute medical situation late in life, they would
unlikely be spending money on much else. For
them, most if not all of their income—social
security, pensions, investment income—would
be diverted to full-time medical care,
potentially lessening the need to dip deeply
into retirement assets.
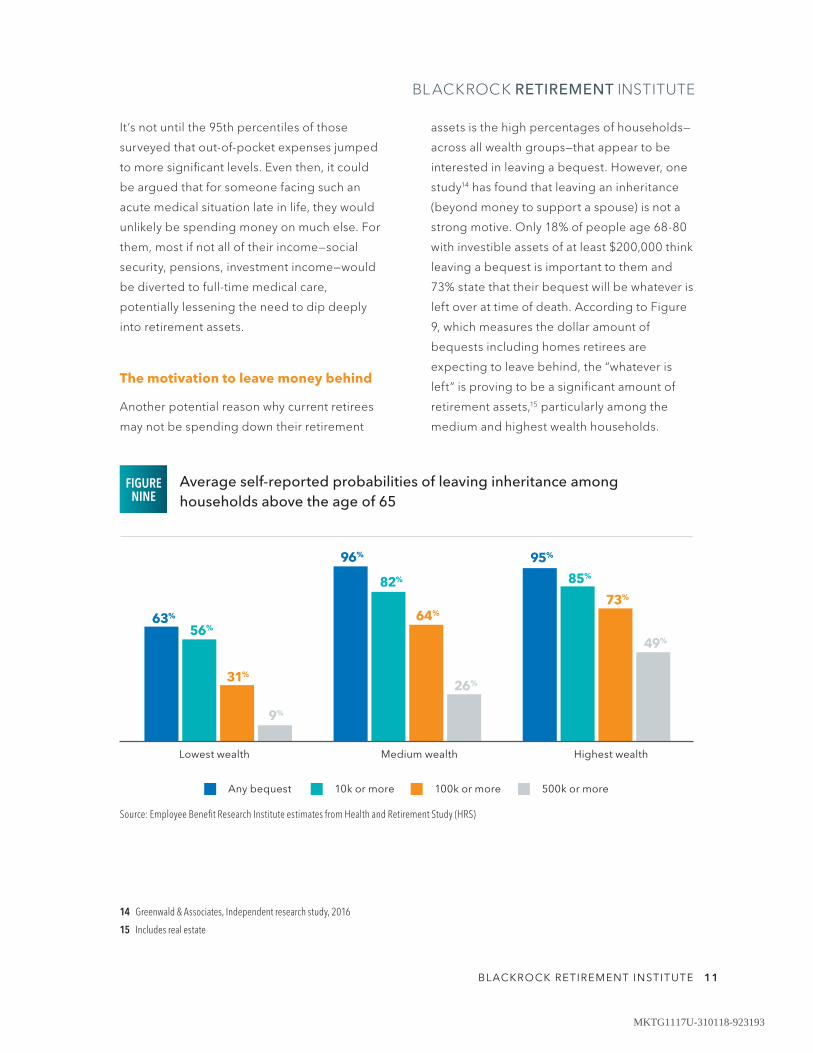
The motivation to leave money behind
Another potential reason why current retirees
may not be spending down their retirement
assets is the high percentages of households—
across all wealth groups—that appear to be
interested in leaving a bequest. However, one
study14 has found that leaving an inheritance
(beyond money to support a spouse) is not a
strong motive. Only 18% of people age 68-80
with investible assets of at least $200,000 think
leaving a bequest is important to them and
73% state that their bequest will be whatever is
left over at time of death. According to Figure
9, which measures the dollar amount of
bequests including homes retirees are
expecting to leave behind, the “whatever is
left” is proving to be a significant amount of
retirement assets,15 particularly among the
medium and highest wealth households.
14 Greenwald & Associates, Independent research study, 2016
15 Includes real estate
FIGURE NINE
Average self-reported probabilities of leaving inheritance among households above the age of 65
Source: Employee Benefit Research Institute estimates from Health and Retirement Study (HRS)
63%
56%
31%
9%
96%
82%
64%
26%
95%
85%
73%
49%
Any bequest
Lowest wealth
10k or more
Medium wealth
100k or more 500k or more
Highest wealth
BLACKROCK RETIREMENT INSTITUTE 11
MKTG1117U-310118-923193
Looking back: most didn’t need to or didn’t want to spend savings
Most retirees in our study appear to have coped
and managed pretty well in retirement. Many
could have afforded to withdraw a little and, in
some cases, a lot more from their retirement
accounts but chose not to, potentially leaving in
some cases large amounts of hard-earned
savings unspent.
While many might find this puzzling, research
suggests16 that people would rather not touch
their savings and instead adjust their lifestyle,
making cutbacks where necessary and shifting
to “needs” over “wants.” Others may feel the
need to hold on to wealth as a form of self-
insurance instead of acquiring an annuity to deal
with a number of life’s uncertainties, such as
longevity risk. Retirees may also hold back due
to deeper behavioral biases or tendencies. After
being told to “save, save, save,” for decades, the
idea of shifting to “spend, spend, spend”
underweights the power of inertia and the
comfort associated with the status quo.17
The common framing of decumulation as a time
to withdraw or remove assets rather than say
gaining new experiences faces a strong
“loss aversion” bias as well.18 Even the uncertainty
or ambiguity regarding longevity itself can lead
people to select more certain, but possibly
sub-optimal decisions.19 These biases can be
exacerbated given the person’s risk tolerances,
experience (or lack of) with the investment industry
and investing and the overall saving/spending
relationship (often family influenced). Retirement
planning and financial advice that acknowledges
and incorporates solutions to these types of biases
could help mitigate behaviors getting in the way of
retirees spending a bit more on themselves and
using those assets saved over decades.
Looking forward: need to spend down retirement assets may only increase
Many of the retirees captured in this research
were fortunate to be able to maintain a
reasonable standard of living without significantly
tapping into their retirement savings principal.
Future retirees may not be so lucky. Many will
likely retire into an environment with multiple
headwinds and face growing pressure to save
more and maximize the value of their entire
retirement savings—principal and all—unless they
are willing/able to make dramatic cuts in their
retirement lifestyle. Several major challenges rise
to the surface as we look ahead (Figure 10):
• Pension benefits—on average, 42% of the
retirees tracked in the research received
income from a defined benefit (DB) pension:
few, if any, of those retiring over the next 10-
20 years can expect income from a DB plan.
16 Post-retirement experiences of individuals retired for 15 years or more, 2016, Society of Actuaries, page 6
17 Status Quo bias
18 Loss aversion in older people
19 Ellsberg Paradox
12 SPENDING RETIREMENT ASSETS.. .OR NOT?
MKTG1117U-310118-923193
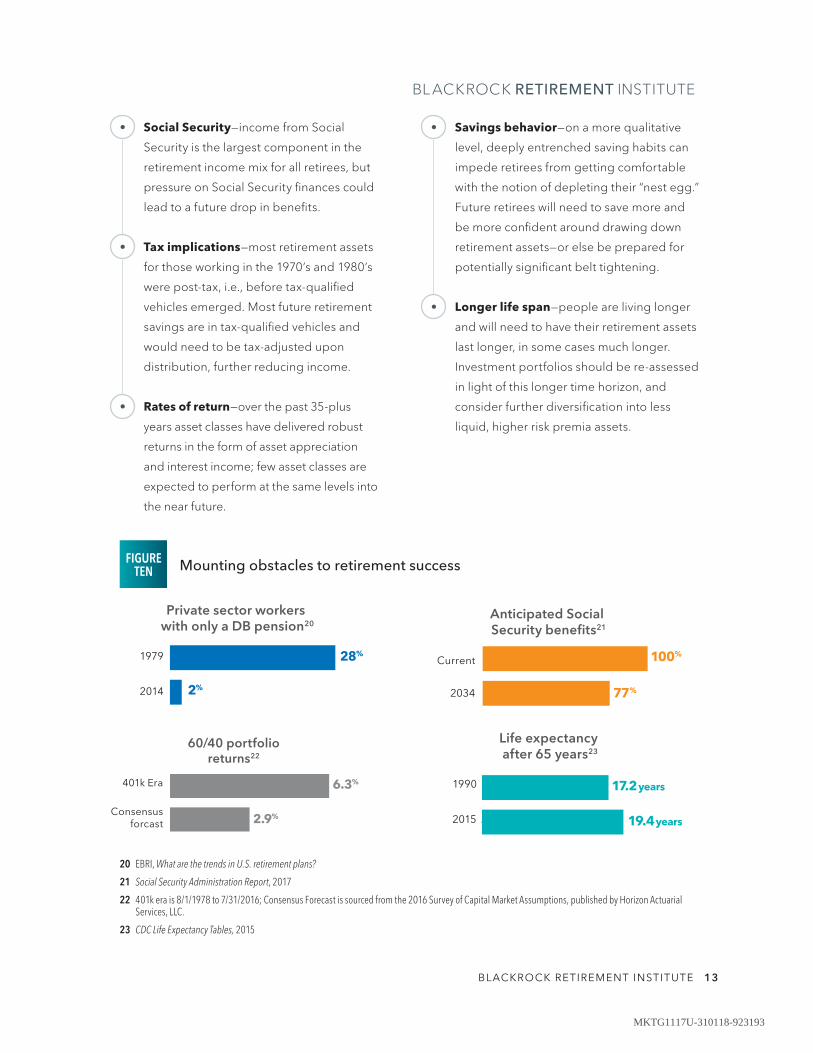
• Social Security—income from Social
Security is the largest component in the
retirement income mix for all retirees, but
pressure on Social Security finances could
lead to a future drop in benefits.
• Tax implications—most retirement assets
for those working in the 1970’s and 1980’s
were post-tax, i.e., before tax-qualified
vehicles emerged. Most future retirement
savings are in tax-qualified vehicles and
would need to be tax-adjusted upon
distribution, further reducing income.
• Rates of return—over the past 35-plus
years asset classes have delivered robust
returns in the form of asset appreciation
and interest income; few asset classes are
expected to perform at the same levels into
the near future.
• Savings behavior—on a more qualitative
level, deeply entrenched saving habits can
impede retirees from getting comfortable
with the notion of depleting their “nest egg.”
Future retirees will need to save more and
be more confident around drawing down
retirement assets—or else be prepared for
potentially significant belt tightening.
• Longer life span—people are living longer
and will need to have their retirement assets
last longer, in some cases much longer.
Investment portfolios should be re-assessed
in light of this longer time horizon, and
consider further diversification into less
liquid, higher risk premia assets.
FIGURE TEN Mounting obstacles to retirement success
2%
1979
2014
28%
Private sector workers with only a DB pension20
17.2 years
19.4 years2%
1990
2015
Life expectancy after 65 years23
100%
77%
Current
2034
Anticipated Social Security benefits21
20 EBRI, What are the trends in U.S. retirement plans?
21 Social Security Administration Report, 2017
22 401k era is 8/1/1978 to 7/31/2016; Consensus Forecast is sourced from the 2016 Survey of Capital Market Assumptions, published by Horizon Actuarial Services, LLC.
23 CDC Life Expectancy Tables, 2015
6.3%
2.9%
401k Era
Consensusforcast
60/40 portfolioreturns22
BLACKROCK RETIREMENT INSTITUTE 13
MKTG1117U-310118-923193
Shifting demographics and a more challenging market environment
will only elevate the complexity and importance of helping retirees
maximize the value of retirement savings. Future retirees will face
obstacles not seen by prior generations and many of the apparent
behavioral biases possibly holding back current retirees from
spending will be at play among future retirees as well. Whether they
can gain the confidence to spend retirement assets if and when
needed—or not and potentially see major adjustments to their
lifestyle instead—remains to be seen.
But the good news is that with improved savings behavior, steady
and consistent investing, and sound guidance on retirement income,
future retirees can take the steps necessary towards a comfortable
standard of living. Such guidance can come from a financial advisor
who may need to expand their role as a fiduciary to include prodding
systematic withdrawal of assets by their retirees. Defined contribution
platforms can also be a familiar source for guidance and deliver
products designed for both accumulation and decumulation—helping
retirees maintain consistent spending in retirement, while providing
a seamless transition from the savings phase. While the intent of
this paper was not to further fan the flames of the retirement crisis
debate, the research and analysis of this study is a step towards better
understanding an important gap in knowledge about the financial
behavior of American retirees. Further analysis and study into the
underlying motivations behind the numbers could be the next step
towards closing that gap.
CONCLUSION
14 SPENDING RETIREMENT ASSETS.. .OR NOT?
MKTG1117U-310118-923193
The BlackRock Retirement Institute
(BRI) is BlackRock’s global thought
leadership platform on retirement
and longevity established to enable
our clients and broader community
to make better decisions toward
a financially secure and dignified
retirement.
Lifespans have shot up over the last
several decades but the way the
world thinks and acts to address
this new reality has yet to catch up.
We at BlackRock recognize this
emerging revolution—its challenges,
its opportunities—and through BRI
we join our voice with the voices of
other experts to create and
amplify some of the best thinking
on retirement and longevity.
As the world’s largest asset
manager24—with two-thirds of
the funds we manage related to
retirement—BlackRock understands
that our firm has a special
responsibility to assist people all
over the globe to live out their later
years with dignity and security.
An essential component of that is
helping governments, institutions
and individuals understand and
take action in response to this new
phase in mankind’s history—that’s
what BRI is here to do.
ABOUT
BlackRock Retirement Institute
24 Based on $5.97 trillion assets under management as of 9/30/17.
The BlackRock Retirement Institute helps to enable our clients and broader communities to make better decisions towards a financially secure and dignified retirement.
BLACKROCK RETIREMENT INSTITUTE 15
MKTG1117U-310118-923193
Why BlackRockBlackRock helps people around the world, as well as the world’s largest institutions and governments, pursue their investing goals. We offer:
• A comprehensive set of innovative solutions, including mutual funds, separately managed accounts, alternatives and iShares® ETFs
• Global market and investment insights
• Sophisticated risk and portfolio analytics
We work only for our clients, who have entrusted us with managing $5.97 trillion*, earning BlackRock the distinction of being trusted to manage more money than any other investment firm in the world.
* AUM as of 9/30/17.
This material is provided for educational purposes only and should not be construed as research. The information on this website is not a complete analysis of the global retirement landscape. The opinions expressed herein are as of 11/15/17 and are subject to change at any time due to changes in the market, the economic or regulatory environment or for other reasons. The material does not constitute investment, legal, tax or other advice and is not to be relied on in making an investment or other decision.
Note: The opinions expressed in the third party articles or content do not necessarily reflect the views of BlackRock. BlackRock makes no representation as to the completeness or accuracy of any third party statement.
No part of this material may be reproduced, stored in any retrieval system or transmitted in any form or by any means, electronic, mechanical, recording or otherwise, without the prior written consent of BlackRock. This publication is not intended for distribution to, or use by any person or entity in any jurisdiction or country where such distribution or use would be contrary to local law or regulation.
©2017 BlackRock, Inc. All Rights Reserved. BLACKROCK is a registered trademark of BlackRock, Inc. or its subsidiaries in the United States and elsewhere. All other trademarks are those of their respective owners.
FOR INSTITUTIONAL AND FINANCIAL PROFESSIONAL USE ONLY. Not to be shown or distributed to the public.
Prepared by BlackRock Investments, LLC, member FINRA.
Not FDIC Insured • May Lose Value • No Bank Guarantee
Lit. No. DECUM-DC-1117 171544T-1017
Want to know [email protected] 877-992-5532 (1-877-99-BLKDC)
MKTG1117U-310118-923193


