Sphagnum-Dominated Peat Bog: A Naturally Acid Ecosystem [and Discussion] Author(s): R. S. Clymo, J. R. Kramer and D. Hammerton Reviewed work(s): Source: Philosophical Transactions of the Royal Society of London. Series B, Biological Sciences, Vol. 305, No. 1124, Ecological Effects of Deposited Sulphur and Nitrogen Compounds (May 1, 1984), pp. 487-499 Published by: The Royal Society Stable URL: http://www.jstor.org/stable/2396100 . Accessed: 23/07/2012 05:11 Your use of the JSTOR archive indicates your acceptance of the Terms & Conditions of Use, available at . http://www.jstor.org/page/info/about/policies/terms.jsp . JSTOR is a not-for-profit service that helps scholars, researchers, and students discover, use, and build upon a wide range of content in a trusted digital archive. We use information technology and tools to increase productivity and facilitate new forms of scholarship. For more information about JSTOR, please contact [email protected]. . The Royal Society is collaborating with JSTOR to digitize, preserve and extend access to Philosophical Transactions of the Royal Society of London. Series B, Biological Sciences. http://www.jstor.org
Transcript
Sphagnum-Dominated Peat Bog: A Naturally Acid Ecosystem [and Discussion]Author(s): R. S. Clymo, J. R. Kramer and D. HammertonReviewed work(s):Source: Philosophical Transactions of the Royal Society of London. Series B, BiologicalSciences, Vol. 305, No. 1124, Ecological Effects of Deposited Sulphur and Nitrogen Compounds(May 1, 1984), pp. 487-499Published by: The Royal SocietyStable URL: http://www.jstor.org/stable/2396100 .Accessed: 23/07/2012 05:11
Your use of the JSTOR archive indicates your acceptance of the Terms & Conditions of Use, available at .http://www.jstor.org/page/info/about/policies/terms.jsp
.JSTOR is a not-for-profit service that helps scholars, researchers, and students discover, use, and build upon a wide range ofcontent in a trusted digital archive. We use information technology and tools to increase productivity and facilitate new formsof scholarship. For more information about JSTOR, please contact [email protected].
.
The Royal Society is collaborating with JSTOR to digitize, preserve and extend access to PhilosophicalTransactions of the Royal Society of London. Series B, Biological Sciences.
Phil. Trans. R. Soc. Lond. B 305, 487-499 (1984) 487
Printed in Great Britain
Sphagnum-dominated peat bog: a naturally acid ecosystem
BY R. S. CLYMO
Botany Department, Westfield College, London NW3 75 T, U.K.
Sphagnum-dominated peat bogs are naturally acid and cover perhaps 1% of the Earth's land surface. The temporal and spatial variations of pH in a peat-bog in the northern Pennines are used to illustrate the relative importance of different sources of acidity. At this site, where the pH of rain in summer was 4.0-4.2, rain and cation exchange of metal cations in the rain for H+ in the newly grown Sphagnum were of about equal importance, though cation exchange probably dominated on hummocks in summer. Strongly acid 'events' are likely to follow heavy rain that follows a dry spell. The effects of interconversion of sulphur- and nitrogen-containing compounds on acidity is obscure.
Those peat bogs in which Sphagnum flourishes have long been known to be unusually acid: pH values between 3.2 and 4.0 are common. Peat-forming communities are widespread as the country-by-country descriptions in Gore (I983) show. The reliability of estimates of the area covered by peat differs among countries, but Kivinen & Pakarinen (i 98 I) conclude that about 3 % of the Earth's land surface is peat-covered. Probably at least 1 % of the land is covered by acid Sphagnum-dominated peat bog.
There are several causes of the acidity of such peat bogs and these causes are illustrated here by results from work done at Moor House National Nature Reserve (2?21' W, 54?46' N) in the north Pennines. Water samples were collected and Sphagnum growth measured on the area known locally as Burnt Hill (National Grid reference NY754328). The vegetation of the region is described by Eddy et al. (I969). Burnt Hill is covered by blanket peat 2-3.5 m deep. The nearly flat summit at 575 m altitude has a well-developed pool and hummock complex (Clymo & Reddaway I 97 I). Five pools, five lawns and five hummocks were chosen, and samples were taken from the same 15 sites at approximately monthly intervals from April to October 1968-1970. During 1969 more detailed analyses were made and at the same time rain was collected in four gauges. Dry deposition was not measured separately. During 1968 and 1969 the growth of Sphagnum capillifolium (a hummock species), S. papillosum (lawn) and S. cuspidatum (pool) was measured. Details are given in Appendix 1.
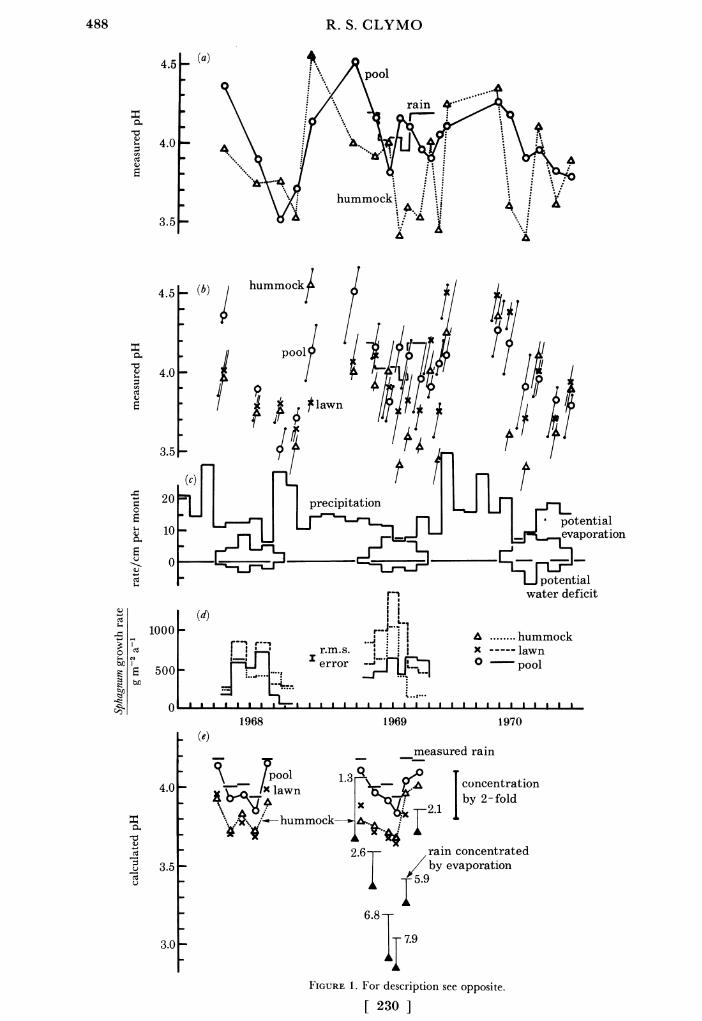
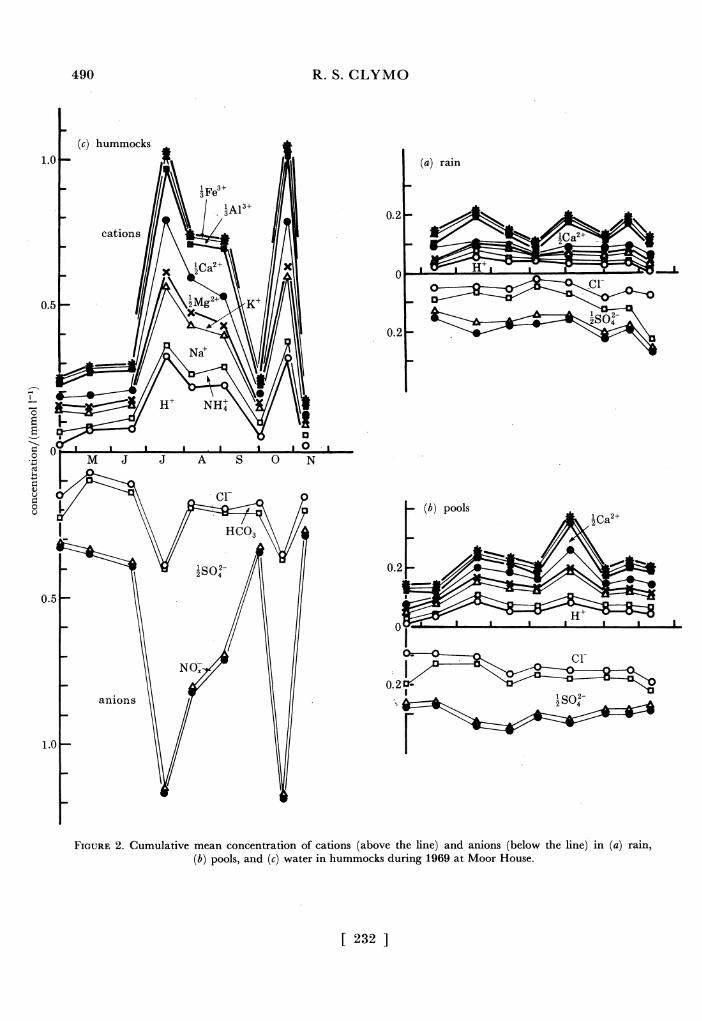
The values of pH, climatic variables, and growth rate of Sphagnum during 1968-70 are shown in figure 1, and detailed water chemistry for 1969 in figure 2. The main results were these.
(1) Rain pH in 1969 was 4.0-4.2, well below the theoretical 5.5-5.6 for a dilute solution of neutral salts in equilibrium with atmospheric CO2.
(2) For rain, the correlation coefficients, r, and the concentration quotients, C, between all pairs of Na+, lMg2+, Cl- and _SO2- were calculated. (The SI convention of lMg2+ etc. and the unit mol is used because charge balances are involved.) For Na+ against Cl-, r = 0.56 (n = 29). The range of r for the other five pairs was - 0.07-0.23. The quotient of Cseawater/Crain was 1.2 for NaCl. For MgSO4 it was 3.2 and for the other pairs the range was 12-56. It seems plausible to assume, therefore, that much of the Na+ and Cl- but only part of the lMg2+ and
[ 229]
488 R. S. CLYMO
Q (a) j*
4.0
; 1000 r , F! i hummock":
3.5 ~ ~
(b) humhummoc
45 4
_ (b) hmok
pool 4.0 1
S potentialocetrte < t l Zby evaporation~~~~~~evaoraio
SO2- come from sea spray. If all the Na+ and Cl- are assumed to come from sea spray and to be accompanied by the corresponding concentration of lMg2+ and _SO2- then over two- thirds of the LMg2+ and more than 95 % of the _SO2- is of non-marine origin.
(3) The mean concentrations of Cl-, ASO2- and of NO_ in rain were about 0.06, 0.07 and 0.02 mmol 1-1 and r for the last two was 0.82. This is consistent with, but by no means proof of, an anthropogenic origin for most of the -SO2-. The mean concentration of H+ (about 0.11 mmol 1-1) was about equal to the sum of _SO2- and NO-, but their individual correlations with H+ were only -0.28 and -0.10 in contrast to the 0.77 and 0.88 found by Fowler et al. (i982) for similar concentration ranges in Scotland. Indeed none of the other correlations between H+, NH+, Na+, K+, lMg2+, ICa2+, A3Al3+, AFe3+, Cl-, _SO2- and NO- fell outside the range + 0.3. This lack of correlation is probably a consequence of the relatively large coefficient of variation at low concentrations. The simplest view is that about 1 of the solutes derive from the sea, and that 1SO2- and NO- are accompanied by a variety of cations differing in proportions at different times.
(4) Some of the changes in median pH of water in hummocks, lawns and pools seem at first sight to be erratic. But in most cases all five sites in a given habitat show much the same change, so these effects are probably real ones.
(5) The pH of water in hummocks, lawns and pools was below that in rain for most of the summer. The lowest values were usually in hummocks during drier periods. The pH was lower in July 1969, during which the Sphagnum capillifolium grew rapidly, than it was in July 1968 when S. capillifolium growth was slower. In September 1968 when heavy rain followed drought then the pools became more acid than the hummocks and the same tendency was visible in the other years too. This may have been because rain flushed very acid water from hummocks into the pools.
(6) Ranking sites in a given habitat on pH value tended to produce the same order on each occasion (figure 1): large tall hummocks were more acid than low small ones; large pools were less acid than small ones.
(7) The pattern of mean values and correlations between concentrations of ions in water from hummocks and pools in 1969 was different from that in rain. The mean concentration of all ions in the three types was 1.3, 0.60, and 0.47 mmol 1-1. In the 37 hummock samples H+, lMg2+ and _SO2- had mean concentrations of 0.18, 0.10 and 0.39 mmol 1-, and were highly intercorrelated (r = 0.93-0.96). Intercorrelated at r > 0.80 with these three and with each other were Na+, -Ca2+, 4Al3+ and Cl-, and only slightly less strongly intercorrelated was K+. In turn r for 4Al3+ and 4Fe3+ was 0.71. Independent of this large group, but correlated with each other (r = 0.74) were NH+ and NO-. This striking pattern is consistent with the
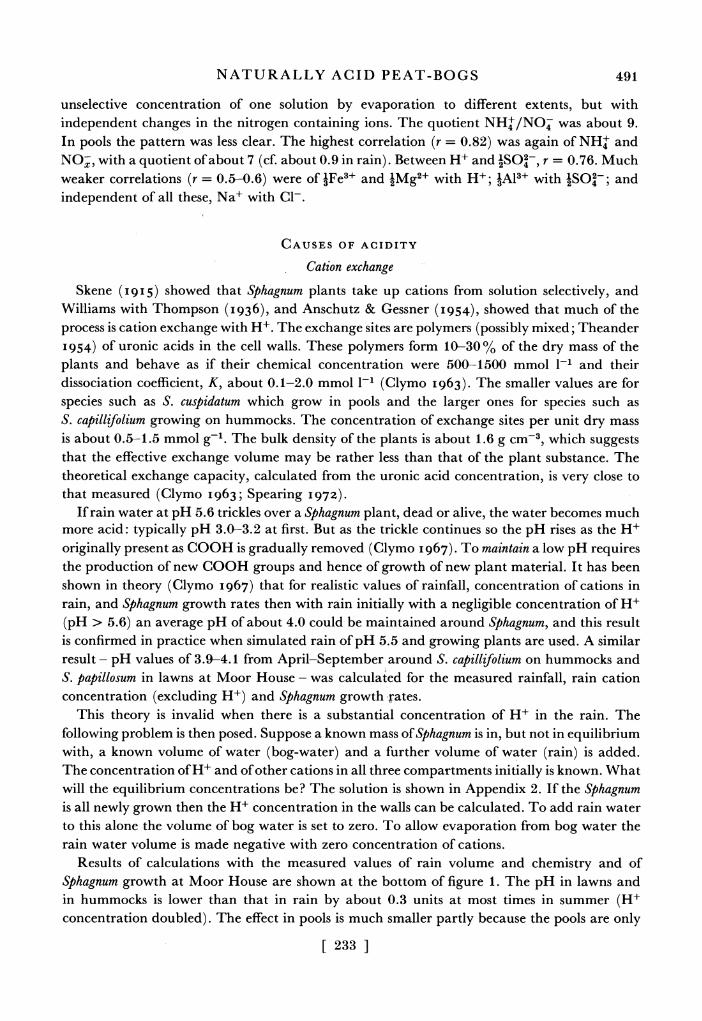
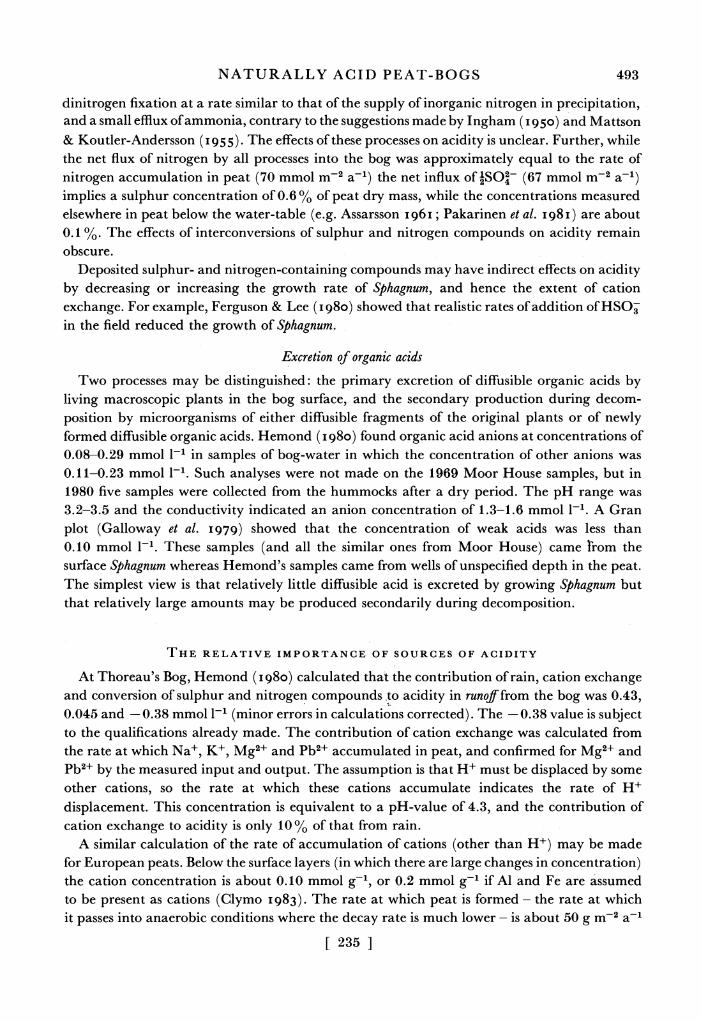
FIGURE 1. Measured and calculated values at Moor House 1968-1970. (a) Median measured pH of water in 5 hummocks and 5 pools, and (histogram) in rain during 1969. (b) Details of measured pH as in (a) and in 5 lawns. Oblique lines show the range. Those with a small dot at the end show times when the same site was most (or least) acid. (c) Measured precipitation, potential evaporation, and, below the line, potential water deficit. (d) Measured growth rate of Sphagnum capillifolium on hummocks, S. papillosum in lawns, and S. cuspidatum in pools. (e) Calculated pH (as a consequence of cation exchange) in water in hummocks, lawns and pools. (The pH measured in rain in 1969 is repeated for comparison.) For 1969 the simple effect of concentration of the rain by evaporation by the numerical factor given (Clhummock/Clrain) is shown as a thin horizontal bar, and the calculated effect of cation exchange below that as a solid triangle. The vertical bar indicates doubling of the H+ concentration. The 1969 rain chemistry was assumed for 1968, and pools were assumed to be a quarter covered by S. cuspidatum. The value of K (Appendix 2) was 1 mmol l-l, and of Z and Ym (mmol l-l) were: S. capillifolium (hummock) 0.2, 1500; S. papillosum (lawn) 0.2, 1000; S. cuspidatum (pool) 0.1, 500.
[ 231 ]
490 R. S. CLYMO
(c) hummocks 1.0 (a) rain
OFe3 1
o M J J A s 0 N 3 ~~~~~~0.2
-cations Ca 2 _=
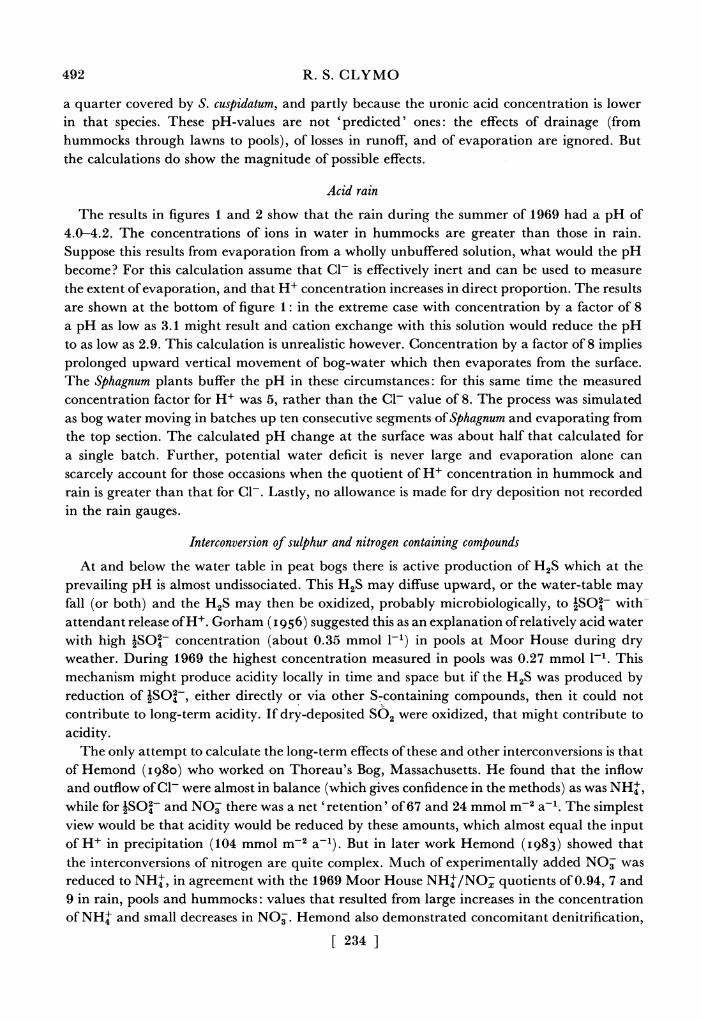
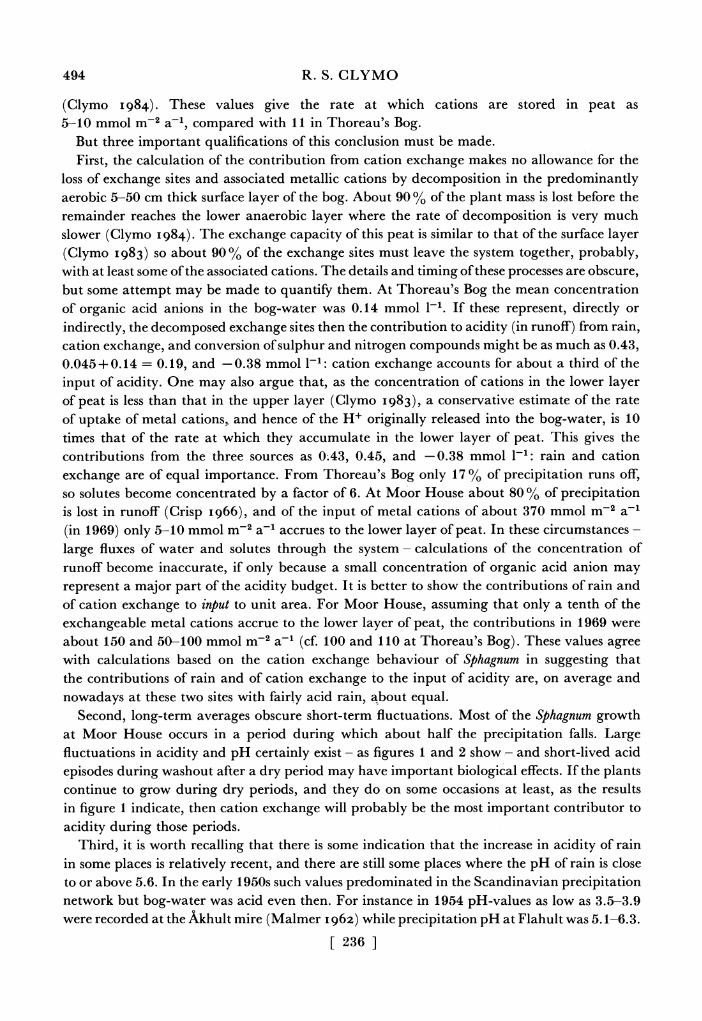
FIGURE 2. Cumulative mean concentration of cations (above the line) and anions (below the line) in (a) rain, (b) pools, and (c) water in hummocks during 1969 at Moor House.
[ 232 ]
NATURALLY ACID PEAT-BOGS 491
unselective concentration of one solution by evaporation to different extents, but with independent changes in the nitrogen containing ions. The quotient NH+/NO- was about 9. In pools the pattern was less clear. The highest correlation (r = 0.82) was again of NH+ and NO- with a quotient of about 7 (cf. about 0.9 in rain). Between H+ and ASO2, r = 0.76. Much weaker correlations (r = 0.5-0.6) were of AFe3+ and lMg2+ with H+; AAl3+ with lSO2-; and independent of all these, Na+ with Cl-.
CAUSES OF ACIDITY
Cation exchange
Skene (1915) showed that Sphagnum plants take up cations from solution selectively, and Williams with Thompson (1936), and Anschutz & Gessner (1954), showed that much of the process is cation exchange with H+. The exchange sites are polymers (possibly mixed; Theander 1954) of uronic acids in the cell walls. These polymers form 10-30% of the dry mass of the plants and behave as if their chemical concentration were 500-1500 mmol 1-1 and their dissociation coefficient, K, about 0.1-2.0 mmol 1-1 (Clymo I963). The smaller values are for species such as S. cuspidatum which grow in pools and the larger ones for species such as S. capillifolium growing on hummocks. The concentration of exchange sites per unit dry mass is about 0.5-1.5 mmol g-1. The bulk density of the plants is about 1.6 g cm3, which suggests that the effective exchange volume may be rather less than that of the plant substance. The theoretical exchange capacity, calculated from the uronic acid concentration, is very close to that measured (Clymo I963; Spearing 1972).
If rain water at pH 5.6 trickles over a Sphagnum plant, dead or alive, the water becomes much more acid: typically pH 3.0-3.2 at first. But as the trickle continues so the pH rises as the H+ originally present as COOH is gradually removed (Clymo I967). To maintain a low pH requires the production of new COOH groups and hence of growth of new plant material. It has been shown in theory (Clymo I967) that for realistic values of rainfall, concentration of cations in rain, and Sphagnum growth rates then with rain initially with a negligible concentration of H+ (pH > 5.6) an average pH of about 4.0 could be maintained around Sphagnum, and this result is confirmed in practice when simulated rain of pH 5.5 and growing plants are used. A similar result - pH values of 3.9-4.1 from April-September around S. capillifolium on hummocks and S. papillosum in lawns at Moor House - was calculated for the measured rainfall, rain cation concentration (excluding H+) and Sphagnum growth rates.
This theory is invalid when there is a substantial concentration of H+ in the rain. The following problem is then posed. Suppose a known mass of Sphagnum is in, but not in equilibrium with, a known volume of water (bog-water) and a further volume of water (rain) is added. The concentration of H+ and of other cations in all three compartments initially is known. What will the equilibrium concentrations be? The solution is shown in Appendix 2. If the Sphagnum is all newly grown then the H+ concentration in the walls can be calculated. To add rain water to this alone the volume of bog water is set to zero. To allow evaporation from bog water the rain water volume is made negative with zero concentration of cations.
Results of calculations with the measured values of rain volume and chemistry and of Sphagnum growth at Moor House are shown at the bottom of figure 1. The pH in lawns and in hummocks is lower than that in rain by about 0.3 units at most times in summer (H+ concentration doubled). The effect in pools is much smaller partly because the pools are only
[ 233 ]
492 R. S. CLYMO
a quarter covered by S. cuspidatum, and partly because the uronic acid concentration is lower in that species. These pH-values are not 'predicted' ones: the effects of drainage (from hummocks-through lawns to pools), of losses in runoff, and of evaporation are ignored. But the calculations do show the magnitude of possible effects.
Acid rain
The results in figures 1 and 2 show that the rain during the summer of 1969 had a pH of 4.0-4.2. The concentrations of ions in water in hummocks are greater than those in rain. Suppose this results from evaporation from a wholly unbuffered solution, what would the pH become? For this calculation assume that Cl- is effectively inert and can be used to measure the extent of evaporation, and that H+ concentration increases in direct proportion. The results are shown at the bottom of figure 1: in the extreme case with concentration by a factor of 8 a pH as low as 3.1 might result and cation exchange with this soluti-on would reduce the pH to as low as 2.9. This calculation is unrealistic however. Concentration by a factor of 8 implies prolonged upward vertical movement of bog-water which then evaporates from the surface. The Sphagnum plants buffer the pH in these circumstances: for this same time the measured concentration factor for H+ was 5, rather than the Cl- value of 8. The process was simulated as bog water moving in batches up ten consecutive segments of Sphagnum and evaporating from the top section. The calculated pH change at the surface was about half that calculated for a single batch. Further, potential water deficit is never large and evaporation alone can scarcely account for those occasions when the quotient of H+ concentration in hummock and rain is greater than that for Cl-. Lastly, no allowance is made for dry deposition not recorded in the rain gauges.
Interconversion of sulphur and nitrogen containing compounds
At and below the water table in peat bogs there is active production of H2S which at the prevailing pH is almost undissociated. This H2S may diffuse upward, or the water-table may fall (or both) and the H2S may then be oxidized, probably microbiologically, to ASO2- with- attendant release of H+. Gorham (I956) suggested this as an explanation of relatively acid water with high ASO2- concentration (about 0.35 mmol 1-1) in pools at Moor House during dry weather. During 1969 the highest concentration measured in pools was 0.27 mmol 1-1. This mechanism might produce acidity locally in time and space but if the H2S was produced by reduction of ISO2-, either directly or via other S-containing compounds, then it could not contribute to long-term acidity. If dry-deposited SO2 were oxidized, that might contribute to acidity.
The only attempt to calculate the long-term effects of these and other interconversions is that of Hemond (I980) who worked on Thoreau's Bog, Massachusetts. He -found that the inflow and outflow of Cl- were almost in balance (which gives confidence in the methods) as was NH+, while for ISO2- and NO- there was a net 'retention' of 67 and 24 mmol m-2 a-'. The simplest view would be that acidity would be reduced by these amounts, which almost equal the input of H+ in precipitation (104 mmol m-2 a-'). But in later work Hemond (I983) showed that the interconversions of nitrogen are quite complex. Much of experimentally added NO3 was reduced to NH+, in agreement with the 1969 Moor House NH+/NO quotients of 0.94, 7 and 9 in rain, pools and hummocks: values that resulted from large increases in the concentration of NH4+ and small decreases in NO3 . Hemond also demonstrated concomitant denitrification,
[ 234 ]
NATURALLY ACID PEAT-BOGS 493
dinitrogen fixation at a rate similar to that of the supply of inorganic nitrogen in precipitation, and a small efflux of ammonia, contrary to the suggestions made by Ingham (I950) and Mattson & Koutler-Andersson (I 955). The effects of these processes on acidity is unclear. Further, while the net flux of nitrogen by all processes into the bog was approximately equal to the rate of nitrogen accumulation in peat (70 mmol m-2 a-') the net influx of 1SO2- (67 mmol m-2 a-1) implies a sulphur concentration of 0.6 % of peat dry mass, while the concentrations measured elsewhere in peat below the water-table (e.g. Assarsson I96I; Pakarinen et al. I98I) are about 0.1 %. The effects of interconversions of sulphur and nitrogen compounds on acidity remain obscure.
Deposited sulphur- and nitrogen-containing compounds may have indirect effects on acidity by decreasing or increasing the growth rate of Sphagnum, and hence the extent of cation exchange. For example, Ferguson & Lee (1 980) showed that realistic rates of addition of HSQ3 in the field reduced the growth of Sphagnum.
Excretion of organic acids
Two processes may be distinguished: the primary excretion of diffusible organic acids by living macroscopic plants in the bog surface, and the secondary production during decom- position by microorganisms of either diffusible fragments of the original plants or of newly formed diffusible organic acids. Hemond (i 980) found organic acid anions at concentrations of 0.08-0.29 mmol 1-1 in samples of bog-water in which the concentration of other anions was 0.11-0.23 mmol 1-1. Such analyses were not made on the 1969 Moor House samples, but in 1980 five samples were collected from the hummocks after a dry period. The pH range was 3.2-3.5 and the conductivity indicated an anion concentration of 1.3-1.6 mmol 1-1. A Gran plot (Galloway et al. I979) showed that the concentration of weak acids was less than 0.10 mmol 1-1. These samples (and all the similar ones from Moor House) came lrom the surface Sphagnum whereas Hemond's samples came from wells of unspecified depth in the peat. The simplest view is that relatively little diffusible acid is excreted by growing Sphagnum but that relatively large amounts may be produced secondarily during decomposition.
THE RELATIVE IMPORTANCE OF SOURCES OF ACIDITY
At Thoreau's Bog, Hemond (I980) calculated tha;t the contribution of rain, cation exchange and conversion of sulphur and nitrogen compounds to acidity in runoff from the bog was 0.43, 0.045 and -0.38 mmol 1-1 (minor errors in calculations corrected). The -0.38 value is subject to the qualifications already made. The contribution of cation exchange was calculated from the rate at which Na+, K+, Mg2+ and Pb2+ accumulated in peat, and confirmed for Mg2+ and Pb2+ by the measured input and output. The assumption is that H+ must be displaced by some other cations, so the rate at which these cations accumulate indicates the rate of H+ displacement. This concentration is equivalent to a pH-value of 4.3, and the contribution of cation exchange to acidity is only 10 % of that from rain.
A similar calculation of the rate of accurnulation of cations (other than H+) may be made for European peats. Below the surface layers (in which there are large changes in concentration) the cation concentration is about 0.10 mmol g-1, or 0.2 mmol g-1 if Al and Fe are assumed to be present as cations (Clymo 1983). The rate at which peat is formed - the rate at which it passes into anaerobic conditions where the decay rate is much lower - is about 50 g m-2 a-l
[ 235 ]
494 R. S. CLYMO
(Clymo I984). These values give the rate at which cations are stored in peat as 5-10 mmol m-2 a-', compared with 11 in Thoreau's Bog.
But three important qualifications of this conclusion must be made. First, the calculation of the contribution from cation exchange makes no allowance for the
loss of exchange sites and associated metallic cations by decomposition in the predominantly aerobic 5-50 cm thick surface layer of the bog. About 90 % of the plant mass is lost before the remainder reaches the lower anaerobic layer where the rate of decomposition is very much slower (Clymo I984). The exchange capacity of this peat is similar to that of the surface layer (Clymo I983) so about 90 % of the exchange sites must leave the system together, probably, with at least some of the associated cations. The details and timing of these processes are obscure, but some attempt may be made to quantify them. At Thoreau's Bog the mean concentration of organic acid anions in the bog-water was 0.14 mmol 1-1. If these represent, directly or indirectly, the decomposed exchange sites then the contribution to acidity (in runoff) from rain, cation exchange, and conversion of sulphur and nitrogen compounds might be as much as 0.43, 0.045+0.14 = 0.19, and -0.38 mmol 1-1: cation exchange accounts for about a third of the input of acidity. One may also argue that, as the concentration of cations in the lower layer of peat is less than that in the upper layer (Clymo I983), a conservative estimate of the rate of uptake of metal cations,. and hence of the H+ originally released into the bog-water, is 10 times that of the rate at which they accumulate in the lower layer of peat. This gives the contributions from the three sources as 0;43, 0.45, and -0.38 mmol 1-1: rain and cation exchange are of equal importance. From Thoreau's Bog only 17 % of precipitation runs off, so solutes become concentrated by a factor of 6. At Moor House about 80 % of precipitation is lost in runoff (Crisp I966), and of the input of metal cations of about 370 mmol m-2 a-' (in 1969) only 5-10 mmol m-2 a-' accrues to the lower layer of peat. In these circumstances - large fluxes of water and solutes through the system - calculations of the concentration of runoff become inaccurate, if only because a small concentration of organic acid anion may represent a major part of the acidity budget. It is better to show the contributions of rain and of cation exchange to input to unit area. For Moor House, assuming that only a tenth of the exchangeable metal cations accrue to the lower layer of peat, the contributions in 1969 were about 150 and 50-100 mmol m-2 a-' (cf. 100 and 110 at Thoreau's Bog). These values agree with calculations based on the cation exchange behaviour of Sphagnum in suggesting that the contributions of rain and of cation exchange to the input of acidity are, on average and nowadays at these two sites with fairly acid rain, about equal.
Second, long-term averages obscure short-term fluctuations. Most of the Sphagnum growth at Moor House occurs in a period during which about half the precipitation falls. Large fluctuations in acidity and pH certainly exist - as figures 1 and 2 show - and short-lived acid episodes during washout after a dry period may have important biological effects. If the plants continue to grow during dry periods, and they do on some occasions at least, as the results in figure 1 indicate, then cation exchange will probably be the most important contributor to acidity during those periods.
Third, it is worth recalling that there is some indication that the increase in acidity of rain in some places is relatively recent, and there are still some places where the pH of rain is close to or above 5.6. In the early 1950s such values predominated in the Scandinavian precipitation network but bog-water was acid even then. For instance in 1954 pH-values as low as 3.5-3.9 were recorded at the Akhult mire (Malmer I1962) while precipitation pH at Flahult was 5.1-6.3.
[ 236 ]
NATURALLY ACID PEAT-BOGS 495
Calculations of the same kind as those already described show that with the rain composition recorded at Flahult and neighbouring sites, an average pH of 4.0-4.1 might be expected as a consequence of cation exchange alone. If the pH of rain falls to these values then the average pH of bog-water would fall, as a result of cation exchange, to about 3.7-3.8. Because the pH scale is logarithmic the effect of cation exchange seems less important, but it is still contributing, about half the H+. The real reason why the presence of acid rain is so obvious in peat-bogs- is that Sphagnum requires a constant supply of water if it is to grow, but that most species are unable to tolerate the combination of high pH and high Ca2+ in water (Clymo I973). Most species of Sphagnum therefore flourish only in places where they are entirely dependent on precipitation which they would, naturally, make about as acid as 'acid rain'.
APPENDIX 1
Water samples: collection and analysis
Rain was collected in cylindrical polythene gauges 140 mm diameter with rims 10 cm above a Sphagnum lawn in which the polythene collecting bottles were sunk. Inside the cylinder were two concentric funnels leading to separate bottles. A 600 cone of 2.5 mm mesh stainless steel, point uppermost inside the cylinder, covered both funnels. The rare large contaminants such as pieces of leaf and tipulids fell or were washed to the outer edge. Rainfall was measured from both bottles, but only that in the central collector was used for chemical analyses. Water samples from hummocks and lawns were squeezed into polythene bottles. The pH and electrical conductivity, G, ofsub-samples of all water samples was measured at once. During April-October 1969 other analyses were made too. On these occasions the rest of the sample was filtered through a pre-washed 2 gm-pore filter. These samples were frozen, transported to Merlewood Research Station, and stored cold for 3-8 months until analysis inJanuary 1970. The following analyses were made by the methods of Allen et al. (I 974) [page number in brackets]: NH+ - N [449]; Na+, K+ [215, 221]; lMg2+, Cl- [446] NO- = NO- + NO- [451]. The residual samples were moved to London, stored at 4 ?C, and the following analyses made during 1971-1972: pH; G; Na+ and K+ by EEL flame photometer; 'AA3+ and 'Fe3+ colorimetrically (Davenport 1949); Cl- by conductimetric titration; 1SO2- turbidimetrically (Golterman & Clymo 1969, method 4.7.1) with correction for self-colour. The samples were lost before a second method for ASO2- could be tried, or before 'bicarbonate' could be measured. For illustrative proposes the concentration of bicarbonate (mmol 1-1) is estim4ted as 1O(PH-5.6): it was a small proportion of the concentration of all anions (figure 2). The pH-measurements in the field and laboratory were made using a KNO3 + KCI salt bridge to reduce diffusion potentials (Grove-Rasmussen 195 I), and two dilute buffer solutions at the sample temperature as standards. The concentration of H+ was calculated with the assumption of simple Debye-Huckel behaviour. This procedure is fairly close to thar later recommended by Galloway et al. (I 979). The correlation coefficient, r, and slope, B, of the reduced major axis for the 128-140 measurements made by different methods and workers and up to two years apart were: pH 0.93, 1.18; Na+ 0.77, 1.11; K+ 0.71, 1.04; Cl- 0.95, 1.11; G 0.86, 0.78. If the methods were perfectly accurate values of 1.00, 1.00 would have been found. The relatively low values of r for Na+ and K+ result mainly from a few improbable values about equally distributed between analysts. In such cases both values were rejected. In all other cases except pH the mean value was used. For pH the laboratory measurement was taken because all the samples were measured at the same temperature. The
[ 237 ]
496 R. S. CLYMO
slope of the relation between the two values of G is mainly a reflection of temperature difference. The general equation at 20 ?C is G(pS cm-') = 0.81 1 ions (mmol 1-1). For conductivity the measured values of G and those calculated from ion concentrations (Onsager & Kim 1957) were closely correlated (r = 0.96) and had B = 0.99. Another check is given by the relation between sum of cation concentrations and that of anions, for which r = 0.95, B = 1.12. The samples of greatest ionic strength generally had an excess of about 0.10 mmol 1-1 of cations. These are the most acid samples and the excess is usually attributed to unanalysed organic acid anions in solution (Malmer I963; Hemond i 980). For pH in samples taken on successive rainless days from 15 sites (5 in each of 3 habitats) analysis of variance gave: habitat F2 14 = 5.0 (P< 0.02); day F114 = 0.7; site F12,14 = 1.37 (P > 0.1). The mean values of concentration (mmol 11) of some elements in these rain samples may be compared with those in samples collected year-round from the same area in 1959-1965 by Gore (1 968): N 0.03/0.03; Na+ 0.05/0.07; K+ 0.003/0.003; 1Mg2- 0.04/0.03; lCa2+ 0.09/0.03. Finally, the mean values in pools may be compared with those in samples from pools in the same area collected by Gorham (I956): Na+ 0.1/0.2; K+ 0.01/0.01; lMg2+ 0.05/0.07; ACa2+ 0.07/0.08; Cl- 0.14/0.15; ISO2- 0.13/0.15.
Sphagnum growth
The growth rate was measured with 5 cm-long transplants by the 'capitulum correction' method (Clymo 1970). The stems lost less than 5 % of their mass during the experiment. Results were expressed per unit mass of original capitulum. The mass of capitula per unit area - 2.0 g dm-2 - is almost independent of species, so the growth rate per unit area can be calculated.
APPENDIX 2
A weak acid cation exchanger (Sphagnum) is in a dilute solution (bog-water) of ions of various valence (in practice up to trivalent). More solution (rain) with different concentrations of the same ions is added. What will be the equilibrium concentrations of cations in exchange phase and in solution? An approximate solution, which uses concentration rather than activity and ignores specific ion affinities other than that of H+, follows.
Represent the concentrations of H+ and of other cations X+n of valence n = 1... 3 in the exchange phase and in solution by H, X+f, h, and X+n respectively. Corresponding volumes are V and v. For convenience let U = I X+n. Let th-e total amounts of H+ and X+nf in the system be H and x+n. Subscripts s, r and e indicate the state at the start, in rain, and at equilibrium, so Ve = Vs + vr. The exchanger is a polymer - possibly mixed - of uronic acids of residual molecular mass 176 which form a proportion Z of the dry mass D of the plant. The dissociation coefficient K is defined by
K = HY/ ( Ym -U-H), (A 1)
where Y is the concentration of (indiffusible) COO- anions and Ym is the concentration when all the acid is dissociated. The values of Z, D, K, and Ym can be measured (Clymo I963). The effective volume of the exchanger is then V = DZ/ (176 Ym). In the conditions of ecological interest J ~ Vs~. For Sphagnum Ym - 1000 mmol 1-1 and in bog-water the concentration of cations is 0.2-2 mmol 1-1 so diffusible anions are virtually excluded from the exchange phase (Briggs et al. 1961) and the Donnan quotient Q is given by
Q = H/h = (Xn // Xn / (A 2)
[ 238 ]
NATURALLY ACID PEAT-BOGS 497
Substituting Y = U+H in (A 1) gives
U [K(Ym-H)-H2]/(Y+H). (A 3)
Equating amounts at the start and at equilibrium gives, for each cation other than H+,
=+n VX+n + v x4+n +vrx+ = V4e+ ex+. (A 4)
For hydrogen that amount in undissociated acid must be included:
H= V(Ym-Us)+vs hs+Vrhr V(YmUe)+Vehe (A5)
If the exchanger is initially in the H form then X+n = 0 and from (A 3)
H= K(1 + 4 Ym/K)1/2. (A 6)
At later stages X+n and H will be known. It follows from (A 5) that
Ue =Ym-(H-Vehe)/V. (A7)
Equating this with (A 3) gives
he H/Ve-V{ Ym + [He-K(Ym-He)]/[K+He]}/Ve. (A 8)
From (A 2) and (A 4) X+n = x+n/ ( V+ Ve Qn). Summing X+n to give Ue and equating with U in (A 3) gives
[X+8(K + He) ] / [ V+ Ve Qn] + K(He -Ym) + He = 0. (A 9)
Given a trial value of He then Qe is got from (A 8) and (A 2), and the validity of (A 9) may be tested. There is only one solution between 0.0 and the value given by (A 6) and it may be found by iteration to any required accuracy. Bisection is safe and satisfactory.
I thank E. J. F. Reddaway for help in the field, S. Allen for making some of the chemical analyses, Mrs P. Ratnesar for help with the other analyses and, together with T. Clymo, for help in preparing the manuscript, and the Natural Environment Research Council for a grant.
REFERENGCES
Allen, S. E., Grimshaw, H. M., Parkinson,J. A. & Quarmby, C. I974 Chemical analysis of ecological materials. Oxford: Blackwell Scientific Publications.
Anschutz, I. & Gessner, F. 1954 Flora, Jena 141, 178-236. Assarsson, G. I96I Sverig. geol. Unders. Ajh. 55:2. Briggs, G. E., Hope, A. B. & Robertson, R. N. R. I96I Electrolytes and plant cells. Oxford: Blackwell Scientific
Publications. Clymo, R. S. I963 Ann. Bot. 27, 309-324. Clymo, R. S. I967 In Chemical environment in the aquatic habitat (ed. H. L. Golterman & R. S. Clymo), pp. 273-284.
Amsterdam: North Holland. Clymo, R. S. 1970 J. Ecol. 58, 13-49. Clymo, R. S. I973 J. Ecol. 61, 849-869. Clymo, R. S. I983 Peat. In Mires: swamp, bog, fen and moor. Ecosystems of the world, vol. 4 (ed. by A. J. P. Gore),
pp. 159-224. Amsterdam: Elsevier. Clymo, R. S. I984 Phil. Trans. R. Soc. Lond. B 303, 605-654. Clymo, R. S. & Reddaway, E. J. F. 197I Hidrobiologia 12, 181-192. Crisp, D. T. I966 J. appl. Ecol. 3, 327-348. Davenport, W. H. 1949 Analyt. Chem. 21, 710-712. Eddy, A., Welch, D. & Rawes, M. I969 Vegetatio 16, 239-284.
[ 239 ]
498 R. S. CLYMO
Ferguson, P. & Lee, J. A. I980 Environ. Pollut. A 21, 59-71. Fowler, D., Cape, J. N., Leith, I. D., Paterson, I. S., Kinnaird, J. W. & Nicholson, I. A. I982 Nature, Lond. 297,
383-386. Galloway, J. N., Cosby, B. J. & Likens, G. E. I979 Limnol. Oceanogr. 24, 1161-1165. Golterman, H. L. & Clymo, R. S. I969 Methods for chemical analysis offresh waters. Oxford: Blackwell Scientific
Publications. Gore, A. J. P. I968 J. Ecol. 56, 483-495. Gore, A. J. P. (ed.) I983 Swamp, bog, fen and moor. Ecosystems of the world, vol. 4. Amsterdam: Elsevier. Gorham, E. 1956 J. Ecol. 44, 375-382. Grove-Rasmussen, K. V. 195I Acta chem. scand. 5, 422-427. Hemond, H. F. I980 Ecol. Mongr. 50, 507-526. Hemond, H. F. I983 Ecology 64, 99-109. Ingham, G. 1950 J. agric. Sci., Camb. 40, 55-61. Kivinen, E. & Pakarinen, P. I98I Suomal. Tiedeakat. Toim. 132, 1-28. Malmer, N. I962 Op. bot. Soc. bot. Lund. 7:1, 1-322. Malmer, N. I963 Bot. Notiser 116, 249-256. Mattson, S. & Koulter-Anderson, E. 1955 K. LantbrukHogsk. Annlr. 22, 219-224. Onsager, L. & Kim, S. K. 1957 J. phys. Chem. 61, 215-229. Pakarinen, P., Tolonen, K. & Soveri, J. I98I In Proceedings of the 6th International Peat Congress, pp. 645-648. Skene, M. 1915 Ann. Bot. 29, 65-87. Spearing, A. M. 1972 Bryologist 75, 154-158. Theander, 0. 1954 Acta chem. scand. 8, 989-1000. Williams, K. T. with an abstract by Thompson, T. G. 1936 Int. Rev. Hydrobiol. 33, 271-275.
Discussion
J. R. KRAMER (McMaster University, Hamilton, Ontario L8S 4MI, Canada). There are a number of procedures and consistency checks on pH-measurements.
(i) Invariably junction potential effects with the reference electrode pose a problem and also strong buffer memory exists. To overcome these;
(a) an inert electrolyte may be added to the solution (to about 1 mmol). The electrolyte must be certified to be free of acid or base by titration and trace analysis. (b) For low pH waters an acid reference solution is often better than a buffer.
(ii) The electrode system should be shown to respond in a Nernstian fashion by acid-base titrations.
(iii) Given a linear response, the pH can be ascertained better by standard addition techniques; for low pH (under 5) and probably especially pertinent to precipitation samples.
(iv) At low alkalinity (less than - 1O-5 eq 1-1), the pH is approximately the logarithm of the absolute value of alkalinity; this consistency check can be made routinely.
(v) A pH-measurement, alkalinity measurement and acidity measure give an overdetermined situation for carbonate protolytes. Consistency checks can be made by considering pairs of values.
R. S. CLYMO. The measurement of pH in poorly buffered or low ionic strength solutions, or both, certainly needs care. The paper records most of the precautions taken: it does not mention that the same electrodes were used for all these measurements and for no others, that they were stored in distilled water, and that Nernstian behaviour for activity and temperature were checked. Dilute buffer solutions (0.01 M) were used for calibration in the field because the working conditions were sometimes such that the additional safety of buffered solutions seemed desirable. This may have been a mistake, but the cation-anion balances and the conductivity checks reported in the paper suggest that if there are substantial inaccuracies in the pH measurements then they must have been of overestimating [H+].
[ 240 ]
NATURALLY ACID PEAT-BOGS 499
In general, for fairly acid rain and soil or stream water of low ionic strength, it is still true that inaccuracy in [H+] is close to, or is, the highest among those ions contributing to 95 % of the total ions and unusual precautions are worth taking.
D. HAMMERTON (Clyde River Purification Board, Rivers House, Murray Road, East Kilbride, Glasgow, U.K.). Dr Clymo has indicated that Sphagnum peat bogs are about 0.3 pH units (?) more acid than the average rainfall. Does this not imply that peat bogs have also undergone acidification as a result of acid precipitation since the industrial revolution?
This leads one to the comment that it is surely misleading to apply the term 'naturally acid ecosystems' only to peat bogs. In fact all the ecosystems referred to at this meeting were naturally acid (whether as a result of geological or biological causes) before the impact of recent acid precipitation.
R. S. CLYMO. The causes of acidity in peat bogs are described in the paper. If the rain became more acid I should expect the peat bog to become more acid too, though not in direct proportion (see the equations in Appendix 2) but I know of no direct evidence that this has actually happened: that is, there is no reliable evidence one way or the other.
Yes, of course it is true that many of the ecosystems referred to at this meeting are naturally acid, though some of the lakes may not always have been so, and it was not the intention of the organizers of this meeting to imply anything else, I think. Rather than re-survey the whole field I deliberately restricted attention to one relatively extreme exemplary system half way between terrestrial and aquatic environments. Most of the processes discussed here quantitatively have been mentioned qualitatively by earlier speakers. The importance of cation exchange and of the temporal and spatial variation of flow in soils are obvious examples. The main differences are that peat bogs do not neutralize acid (in the sense that this process is usually considered to occur in soils) and that new exchange sites are produced at the surface by plant growth in a fairly clearly defined zone, whilst the site of addition of new exchange sites in soils is not so obviously defined.