Page 1
Cornelia Wunderer, MPE SPI-Team Meeting, Paris, 7.-9.10.98 SPI-ACS EM Measurements
SPI - ACS EM SPI - ACS EM Scientific MeasurementsScientific Measurements
August 19 - September 4, 1998
at DSS (Friedrichshafen)
A. v. Kienlin, R. Georgii, C. Wunderer
Page 2
Cornelia Wunderer, MPE SPI-Team Meeting, Paris, 7.-9.10.98 SPI-ACS EM Measurements
OverviewOverview
• ACS EM configuration for scientific measurements• Results
– Linearity and Calibration of Energy and Event Thresholds• Single Photoelectron Spectrum
• Gamma-ray Line Spectra
– Processing Times and Jitter
– Overrange Signals, overall ACS rate monitor (“burst mode”)
– Problems encountered
• SPI Documents: SPI-MPE-PL-12-22 (Plan)SPI-MPE-RP-12-26 (Report, in preparation)
Page 3
Cornelia Wunderer, MPE SPI-Team Meeting, Paris, 7.-9.10.98 SPI-ACS EM Measurements
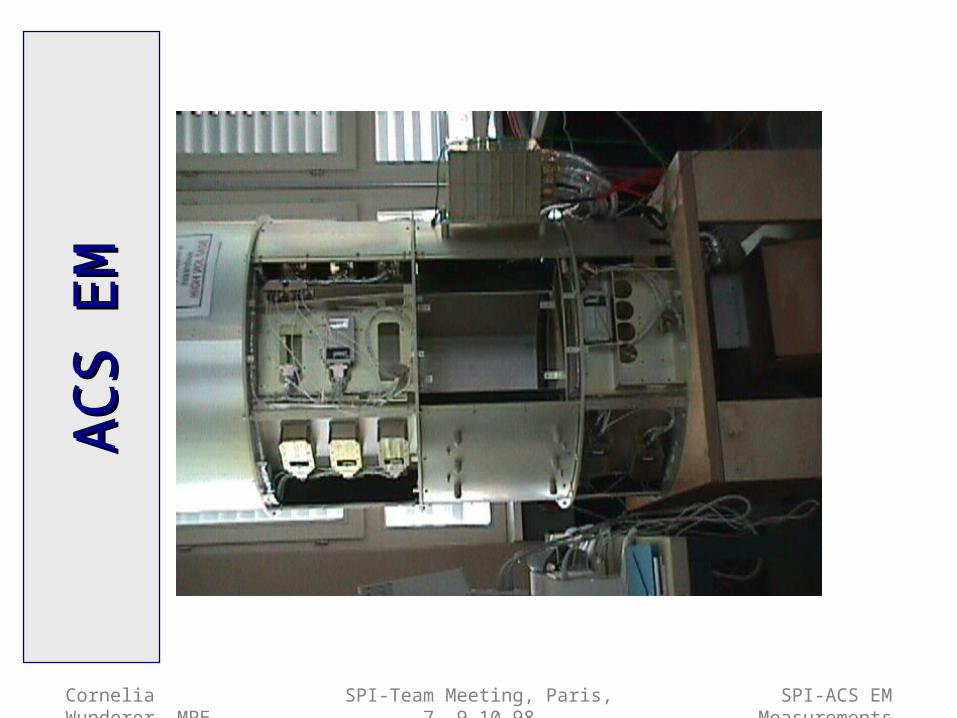
AC
S E
MA
CS
EM
Page 4
Cornelia Wunderer, MPE SPI-Team Meeting, Paris, 7.-9.10.98 SPI-ACS EM Measurements
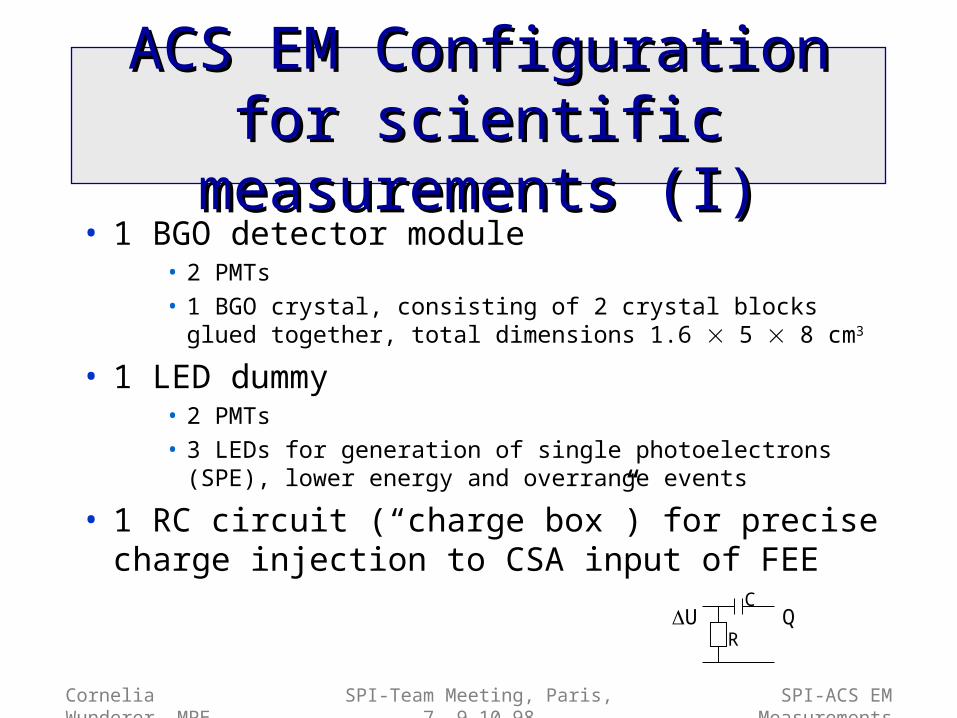
ACS EM Configuration for ACS EM Configuration for scientific measurements (I)scientific measurements (I)
• 1 BGO detector module• 2 PMTs
• 1 BGO crystal, consisting of 2 crystal blocks glued together, total dimensions 1.6 5 8 cm3
• 1 LED dummy• 2 PMTs
• 3 LEDs for generation of single photoelectrons (SPE), lower energy and overrange events
• 1 RC circuit (“charge box”) for precise charge injection to CSA input of FEE U Q
R
C
Page 5
Cornelia Wunderer, MPE SPI-Team Meeting, Paris, 7.-9.10.98 SPI-ACS EM Measurements
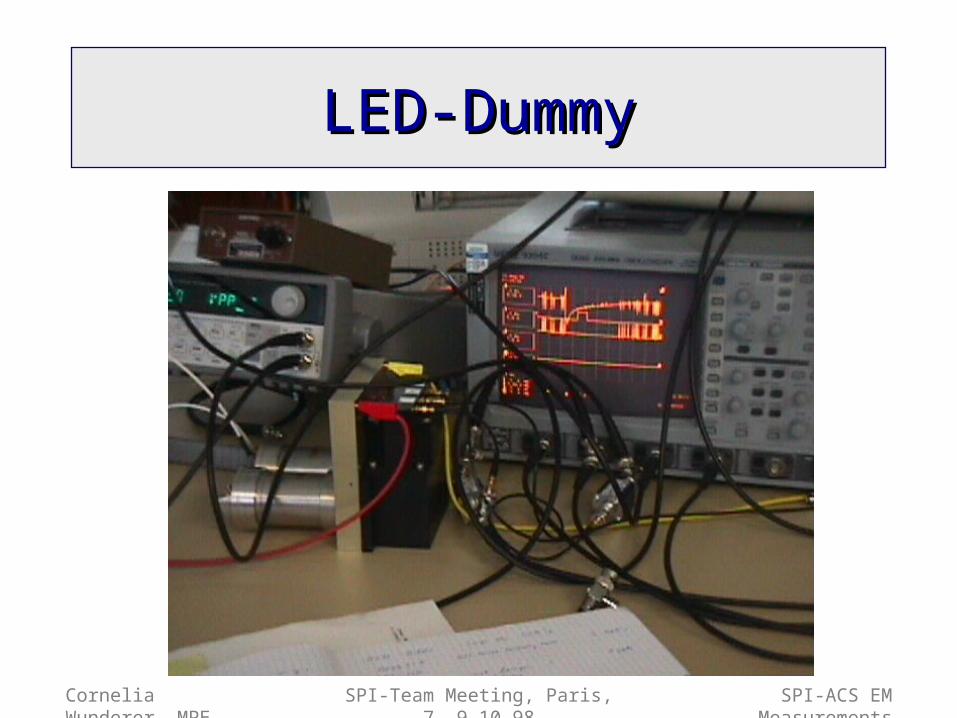
LED-DummyLED-Dummy
Page 6
Cornelia Wunderer, MPE SPI-Team Meeting, Paris, 7.-9.10.98 SPI-ACS EM Measurements
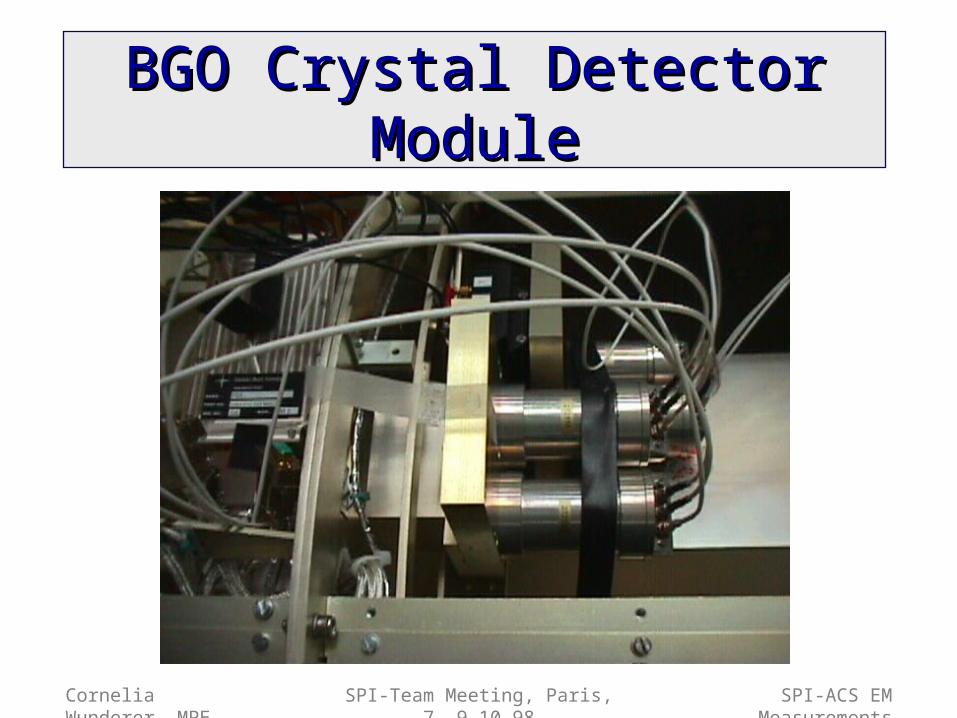
BGO Crystal Detector ModuleBGO Crystal Detector Module
Page 7
Cornelia Wunderer, MPE SPI-Team Meeting, Paris, 7.-9.10.98 SPI-ACS EM Measurements
ACS EM Configuration for ACS EM Configuration for scientific measurements (II)scientific measurements (II)
• 1 FEE with CSA output connector (“reference FEE”)(not officially part of ACS EM)
• FEE Unit Tester (FEE-UT)
• 2 FEEs • EMC representative ACS EM with VCU• VCU Unit Tester (VCU-UT)
all 3 FEEs: design status MARCH 1998
Page 8
Cornelia Wunderer, MPE SPI-Team Meeting, Paris, 7.-9.10.98 SPI-ACS EM Measurements
FEE-Unit Tester FEE-Unit Tester with FEE and LED-Dummywith FEE and LED-Dummy
Page 9
Cornelia Wunderer, MPE SPI-Team Meeting, Paris, 7.-9.10.98 SPI-ACS EM Measurements
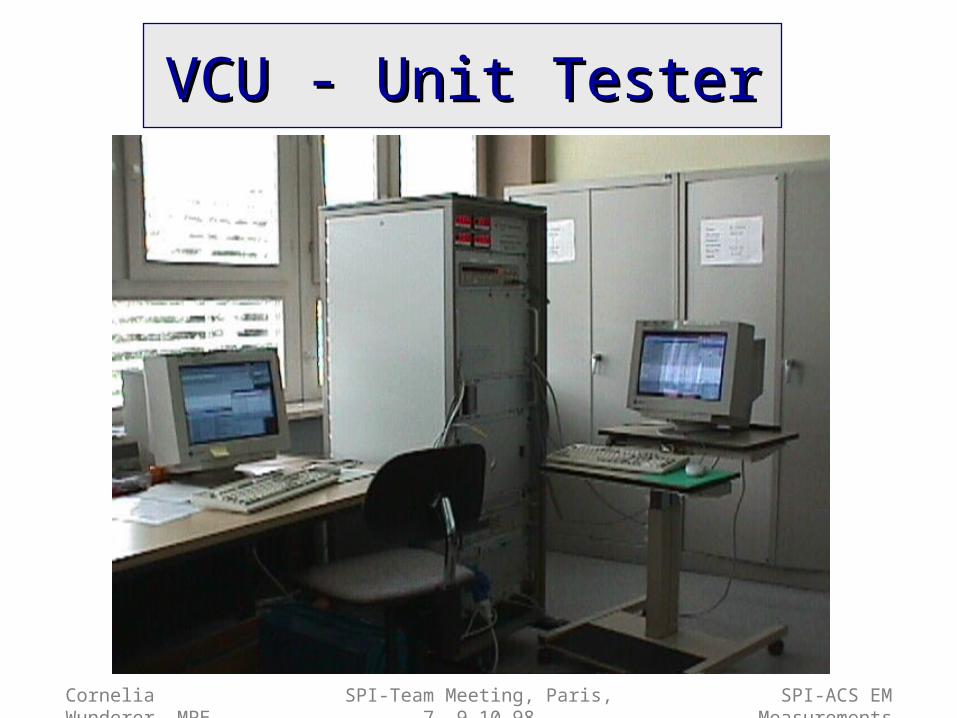
VCU - Unit TesterVCU - Unit Tester
Page 10
Cornelia Wunderer, MPE SPI-Team Meeting, Paris, 7.-9.10.98 SPI-ACS EM Measurements
Linearity of Linearity of Event-Trigger ThresholdsEvent-Trigger Thresholds
0 5 10 15 20 25 30 350
100
200
300
400
500
Schw
elle
(m
V)
Event Trigger Level
Event Trigger LiniaritätEn=0; HV=13100 Hz24.8.98 14:45
Y =14,60051+14,54792 X; R=0.99993
Y =8,55803+15,53954 X-0,02664 X2; R=0.99999
Schwelle EVLin10Sc EVLin10Sc
0,0
0,2
0,4
0,6
0,8
1,0
1,2
1,4
1,6
(app
roxim
ate
) N
um
be
r o
f P
ho
toe
lectr
on
s
Page 11
Cornelia Wunderer, MPE SPI-Team Meeting, Paris, 7.-9.10.98 SPI-ACS EM Measurements
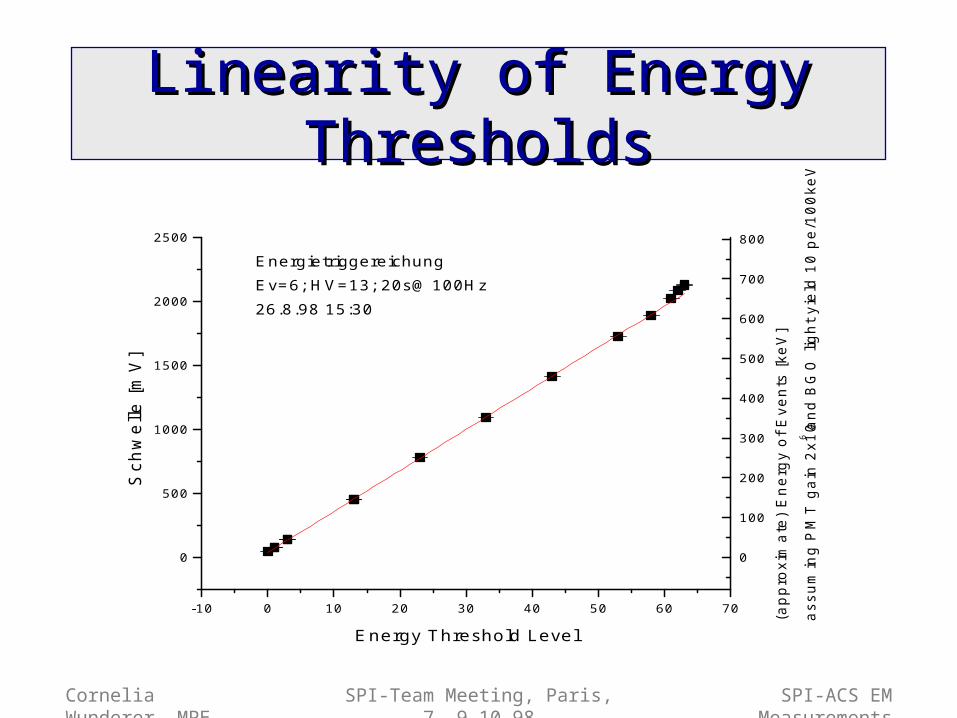
Linearity of Energy ThresholdsLinearity of Energy Thresholds
-10 0 10 20 30 40 50 60 70
0
500
1000
1500
2000
2500
EnergietriggereichungEv=6; HV=13; [email protected] 15:30
Sch
we
lle [
mV
]
Energy Threshold Level
0
100
200
300
400
500
600
700
800
(ap
pro
xim
ate
) E
ne
rgy
of E
ven
ts [ke
V]
ass
um
ing
PM
T g
ain
2x1
06 a
nd
BG
O li
gh
t yi
eld
10
pe
/10
0ke
V
Page 12
Cornelia Wunderer, MPE SPI-Team Meeting, Paris, 7.-9.10.98 SPI-ACS EM Measurements
Generation of Differential SpectraGeneration of Differential Spectra
• Measure number of counts per 5 sec for each energy or event-trigger threshold setting
• This „Stepping Method“ yields integral energy spectra (counts above threshold)
• Differentiate to obtain energy spectra (counts per channel)
0 5 10 15 20 25 30 35
-100
0
100
200
300
400
500
600
700
Differentielles Spektrum EM-F8Single Photoelectrons from LED 10x730,0A
Cou
nts/
Cha
nnel
Event Trigger Level
0 5 10 15 20 25 30 350
2000
4000
6000
8000
10000
12000
Messung EM-F8Integral Spectrum Single Photoelectrons from LED
Cou
nts
Event Trigger Level
Page 13
Cornelia Wunderer, MPE SPI-Team Meeting, Paris, 7.-9.10.98 SPI-ACS EM Measurements
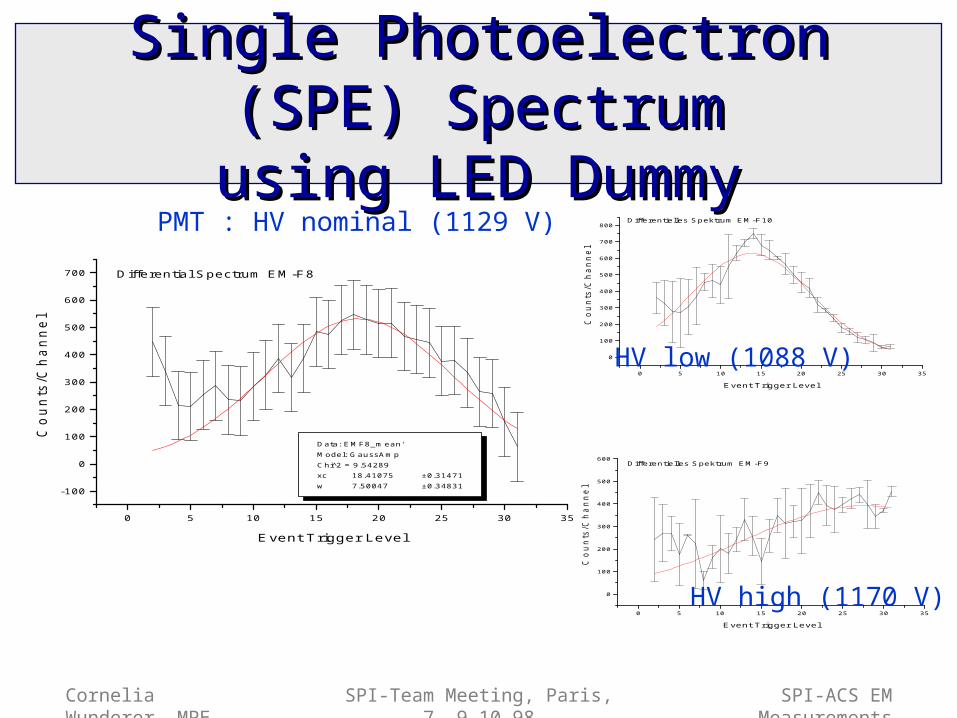
Single Photoelectron (SPE) SpectrumSingle Photoelectron (SPE) Spectrumusing LED Dummyusing LED Dummy
0 5 10 15 20 25 30 35
-100
0
100
200
300
400
500
600
700 Differential Spectrum EM-F8
Data: EMF8_mean'Model: GaussAmpChi^2 = 9.54289xc 18.41075 ±0.31471w 7.50047 ±0.34831
Co
un
ts/C
ha
nn
el
Event Trigger Level
0 5 10 15 20 25 30 35
0
100
200
300
400
500
600
700
800Differentielles Spektrum EM-F10
Co
un
ts/C
ha
nne
l
Event Trigger Level
0 5 10 15 20 25 30 35
0
100
200
300
400
500
600Differentielles Spektrum EM-F9
Co
un
ts/C
ha
nn
el
Event Trigger Level
PMT : HV nominal (1129 V)
HV low (1088 V)
HV high (1170 V)
Page 14
Cornelia Wunderer, MPE SPI-Team Meeting, Paris, 7.-9.10.98 SPI-ACS EM Measurements
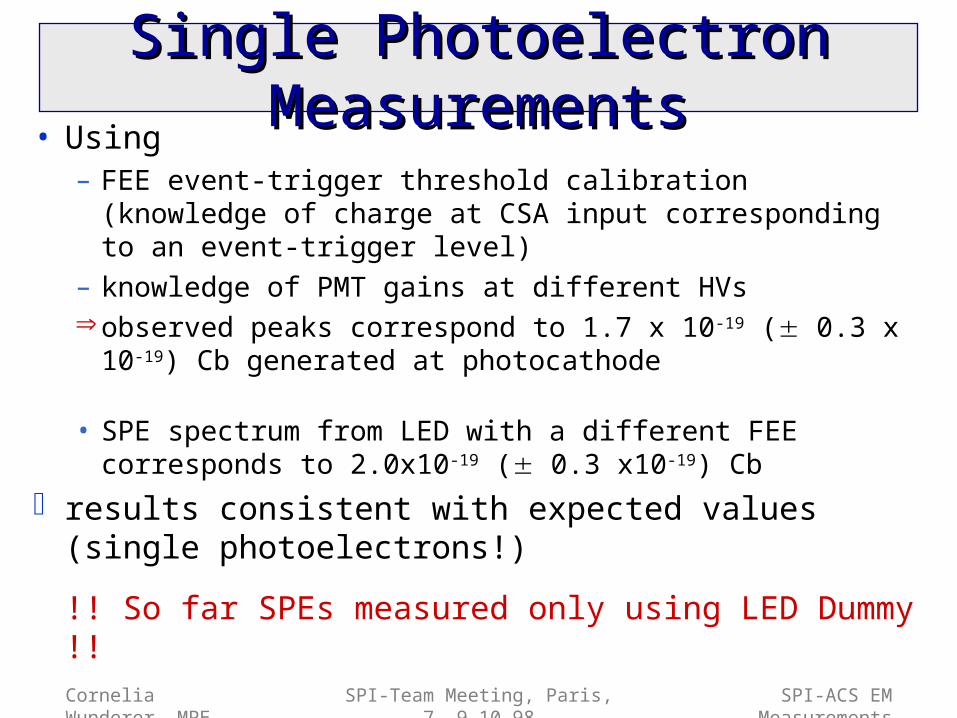
Single Photoelectron MeasurementsSingle Photoelectron Measurements• Using
– FEE event-trigger threshold calibration (knowledge of charge at CSA input corresponding to an event-trigger level)
– knowledge of PMT gains at different HVsobserved peaks correspond to 1.7 x 10⁻¹⁹ ( 0.3 x 10⁻¹⁹) Cb
generated at photocathode
• SPE spectrum from LED with a different FEE corresponds to 2.0x10⁻¹⁹ ( 0.3 x10⁻¹⁹) Cb
results consistent with expected values (single photoelectrons!)
!! So far SPEs measured only using LED Dummy !!
Page 15
Cornelia Wunderer, MPE SPI-Team Meeting, Paris, 7.-9.10.98 SPI-ACS EM Measurements
Ab hier „Reservefolien“Ab hier „Reservefolien“
Page 16
Cornelia Wunderer, MPE SPI-Team Meeting, Paris, 7.-9.10.98 SPI-ACS EM Measurements
Detail ACS EMDetail ACS EMLED-Dummy and „Crystal Dummy“LED-Dummy and „Crystal Dummy“
Page 17
Cornelia Wunderer, MPE SPI-Team Meeting, Paris, 7.-9.10.98 SPI-ACS EM Measurements
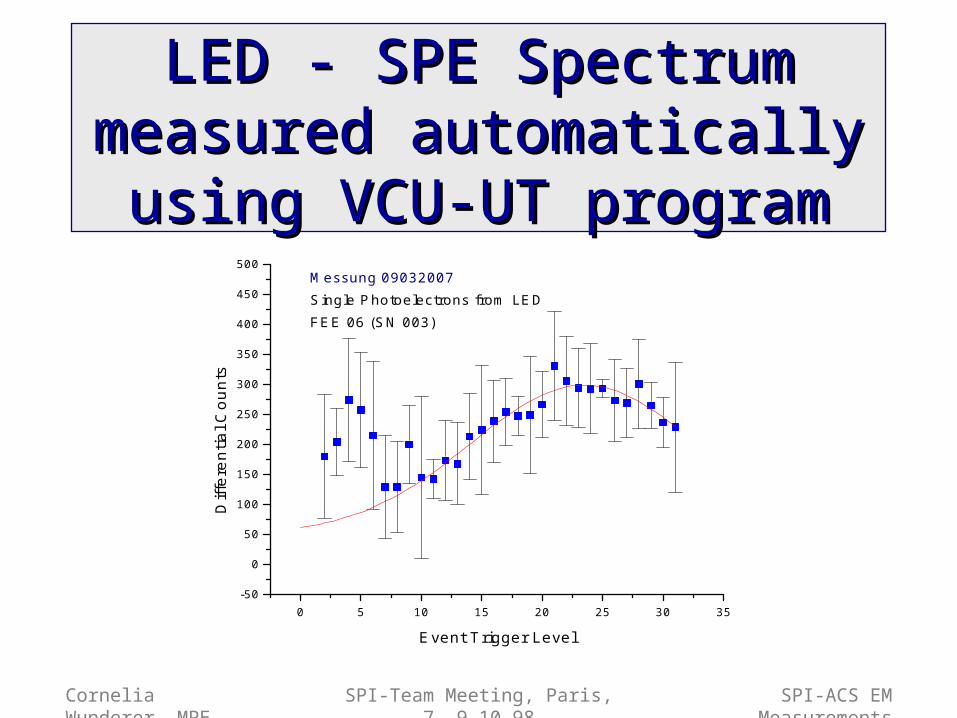
LED - SPE Spectrum measured LED - SPE Spectrum measured automatically using VCU-UT automatically using VCU-UT
programprogram
0 5 10 15 20 25 30 35-50
0
50
100
150
200
250
300
350
400
450
500Messung 09032007Single Photoelectrons from LEDFEE 06 (SN 003)
Diff
eren
tial C
ount
s
Event Trigger Level