Spinal Cord Injury in Wisconsin: 1995 to 1996 May 1999 Wisconsin Department of Health and Family Services Division of Supportive Living Bureau of Aging and Long Term Care Resources Office for Persons with Physical Disabilities Supported by grant H133N50024 of the Model Spinal Cord Injury System from the National Institute on Disability and Rehabilitation Research, Office of Special Education and Rehabilitative Services, U.S. Department of Education, Washington, D.C.
Transcript
Spinal Cord Injury in Wisconsin:1995 to 1996
May 1999
Wisconsin Department of Health and Family ServicesDivision of Supportive Living
Bureau of Aging and Long Term Care ResourcesOffice for Persons with Physical Disabilities
Supported by grant H133N50024 of the Model Spinal Cord Injury System from theNational Institute on Disability and Rehabilitation Research, Office of Special Education
and Rehabilitative Services, U.S. Department of Education, Washington, D.C.
2
3
Acknowledgements
This research was supported in part by grant H133N50024 of the Model SpinalCord Injury System from the National Institute on Disability and RehabilitationResearch, Department of Education, Washington, D.C.
Co-Principle Investigators:Dennis Maiman, M.D., Ph.D Irma G. Fiedler, Ph.D.Department of Neurosurgery Department of Physical
Medicine and Rehabilitation
Medical College of Wisconsin9200 W. Wisconsin AvenueMilwaukee, WI 53226(414) 259-2126
Report Author:Kimberly Schindler, M.S., C.R.C.
Contact Information:Wisconsin Spinal Cord Registry1 West Wilson Street, Room 450PO Box 7851Madison, WI 53707-7851(608) 266-8905 Voice(608) 267-9880 TTY(608) 267-2913 [email protected]
Alternate versions of this report are available on request.
4
5
T A B L E O F C O N T E N T S
PREFACE INTRODUCTION
Registry Background
Data Sources
Data Security
Other Security
Data Quality
Wisconsin’s Population
Glossary of Terms
Introduction to Spinal Cord Injury
9
11
13
14
14
14
16
21
23
REPORT EXECUTIVE SUMMARY
Spinal Cord Injury Events: 1995-1996
Incidence of Spinal Cord Injury
� Sex
� Age
� Ethnicity
Hospitalization and Cost Information
� Admission Day, Month, Type and Source
� Length of Inpatient Stay
� Costs of Inpatient Hospital Care
� Payer Type
� Primary and Secondary Payer
Circumstances of Spinal Cord Injury
� Causes of Injury
� Level and Severity of Injury
Discharge Location
Spinal Cord Injury Rates by County of Residence
Appendix 1.1: Hospitals and E-Codes
Appendix 1.2: Spinal Cord Injuries by Year
27
29
29
29
30
31
32
32
33
34
35
36
36
36
40
43
44
47
53
SUMMARY CONCLUSIONS
REFERENCES
61
63
6
LIST OF MAPS, TABLES AND GRAPHS
Table 1.1 WI Population Projections / County Projections by
Total Population 17
Table 1.2 WI Population Projections by Age Group 19
Graph 1.1 Incidence of Spinal Cord Injuries 29
Graph 1.2 Injuries by Gender and Year 30
Graph 1.3 Injuries by Age and Gender 30
Graph 1.4 Average Age by Year and by Gender 31
Graph 1.5 Injuries by Race 32
Graph 1.6 Admission by Day of the Week 32
Graph 1.7 Admission by Month 33
Graph 1.8 Type of Admission 33
Graph 1.9 Average Length of Inpatient Stay 34
Graph 1.10 Average Cost of Inpatient Hospital Care 35
Graph 1.11 Payer Type 35
Graph 1.12 Causes of Injury 36
Table 1.3 Causes of SCI, by Gender 37
Table 1.4 Causes of SCI, by Selected Age Groups 38
Graph 1.13 Severity of Injury 41
Table 1.5 Principal Diagnosis 42
Graph 1.14 Patient Discharge Location 43
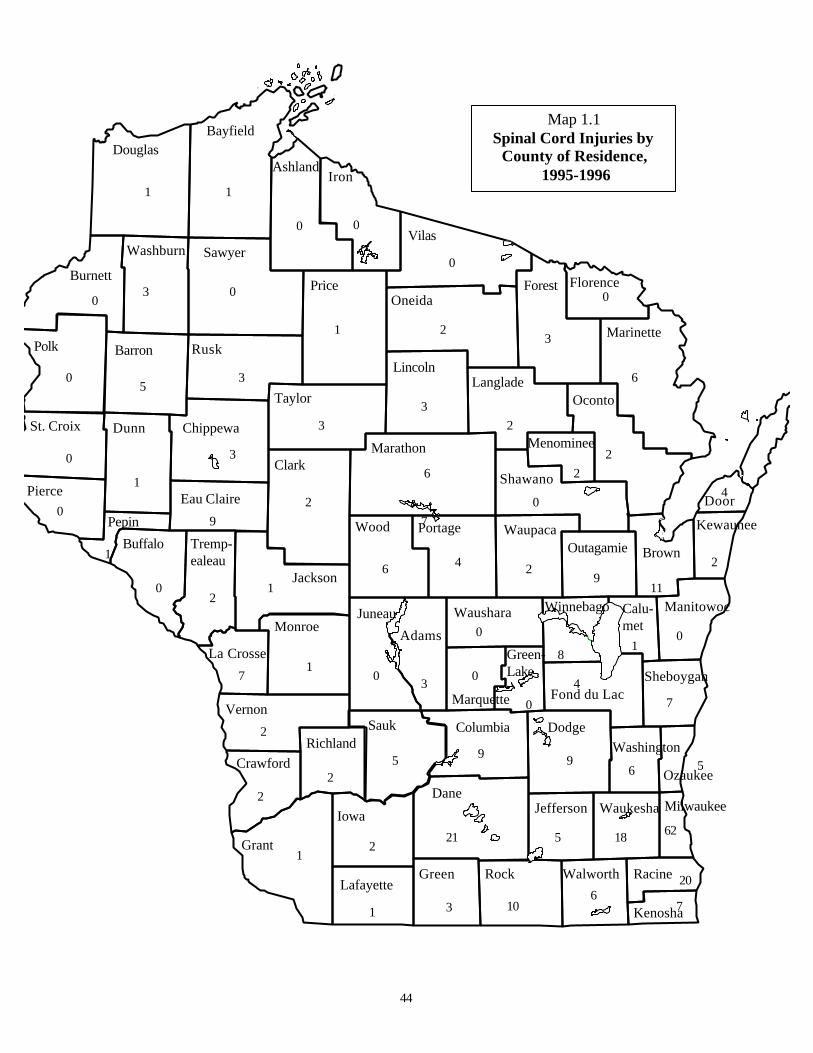
Map 1.1 Spinal Cord Injuries by County of Residence 44
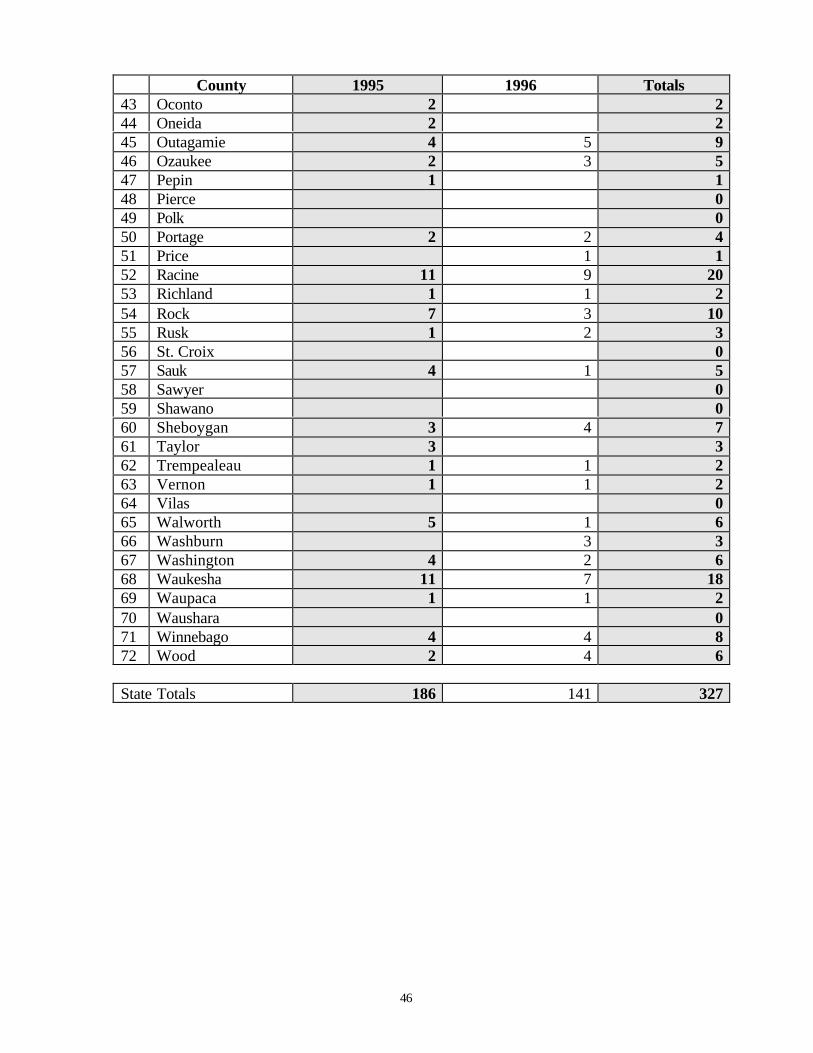
Table 1.6 Injuries by Year and County of Residence 45
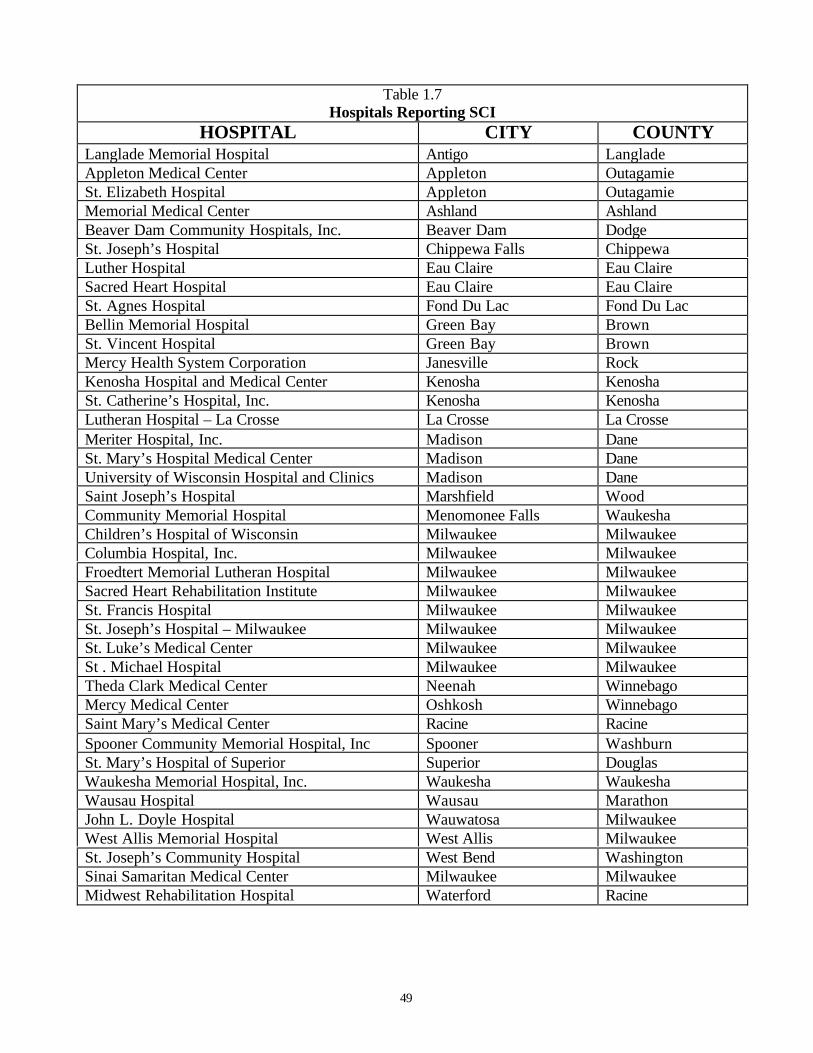
Table 1.7 Hospitals Reporting SCI 49
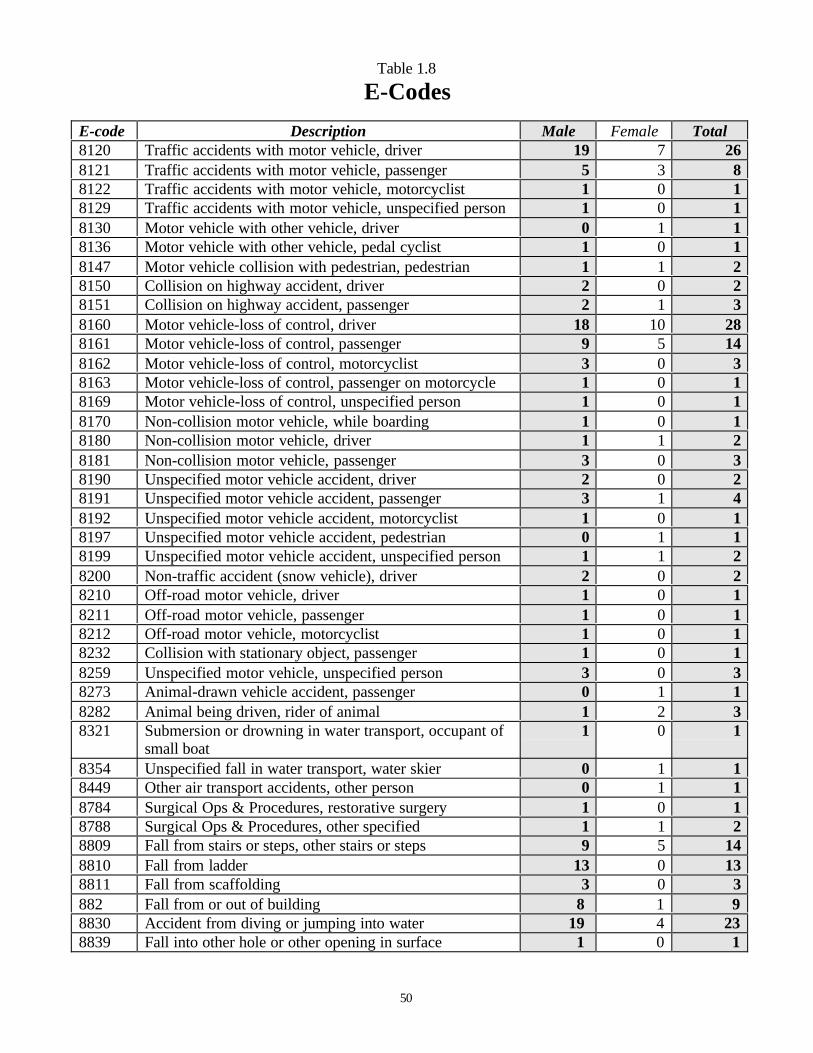
Table 1.8 E-Codes 50
Table 1.9 1995 Data 55
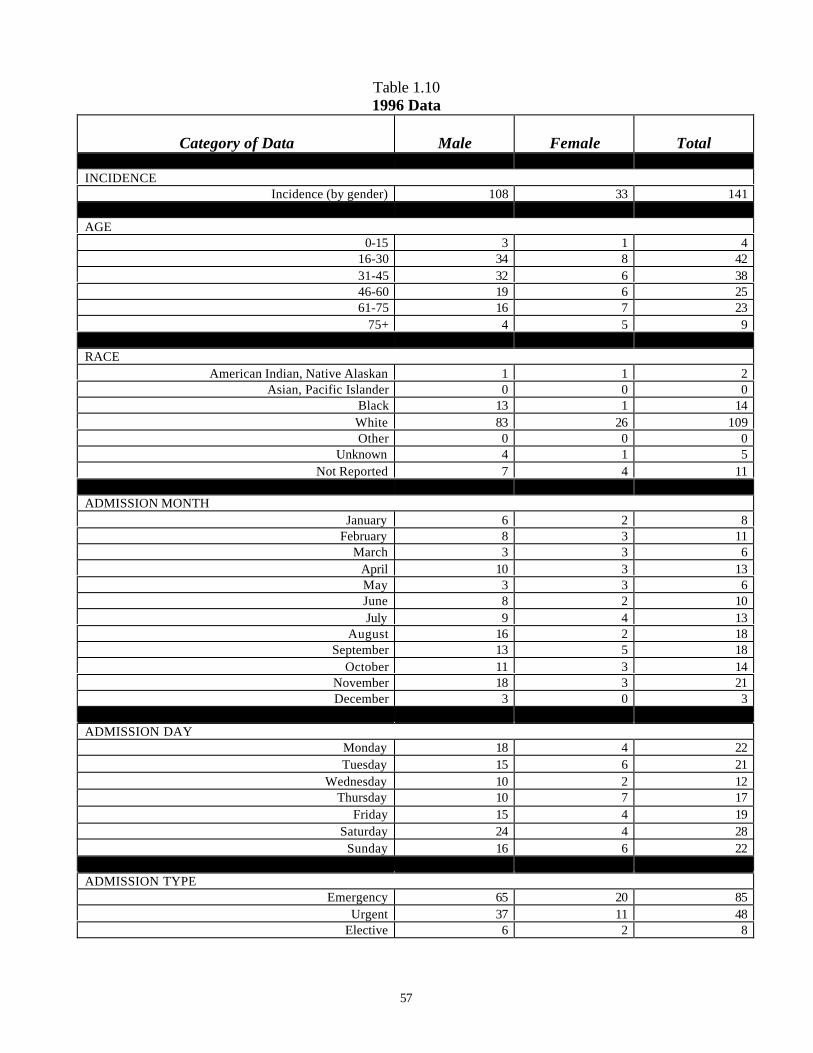
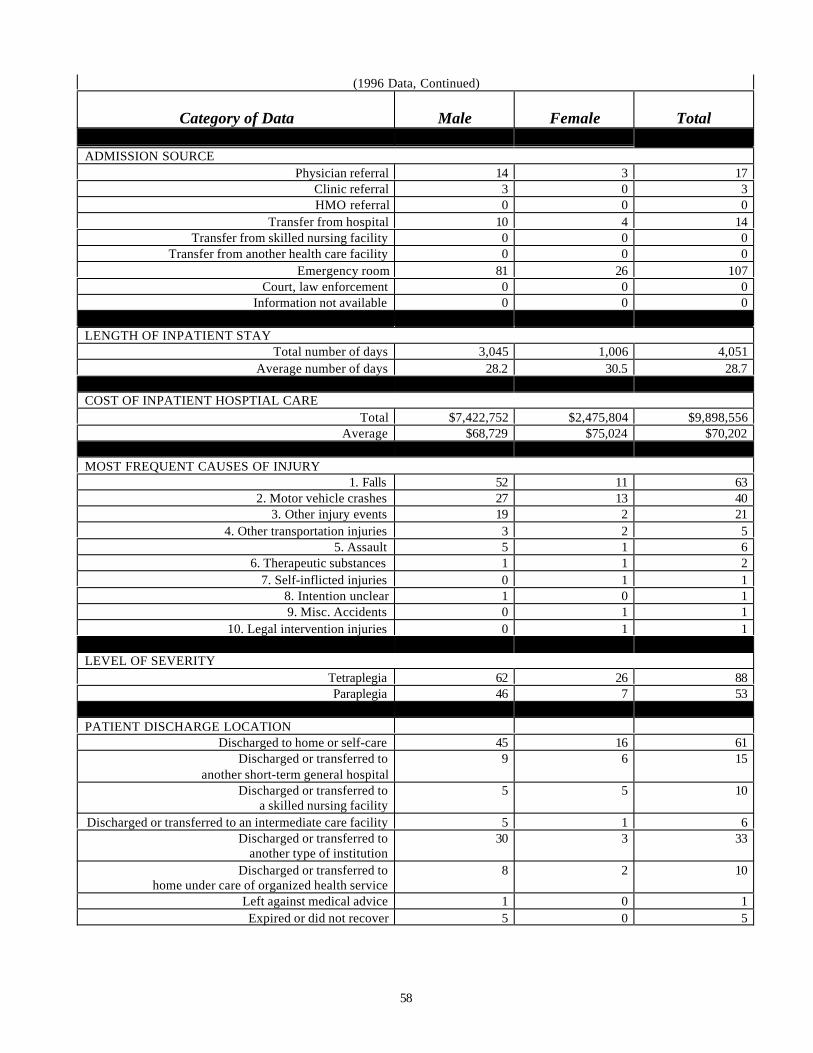
Table 1.10 1996 Data 57
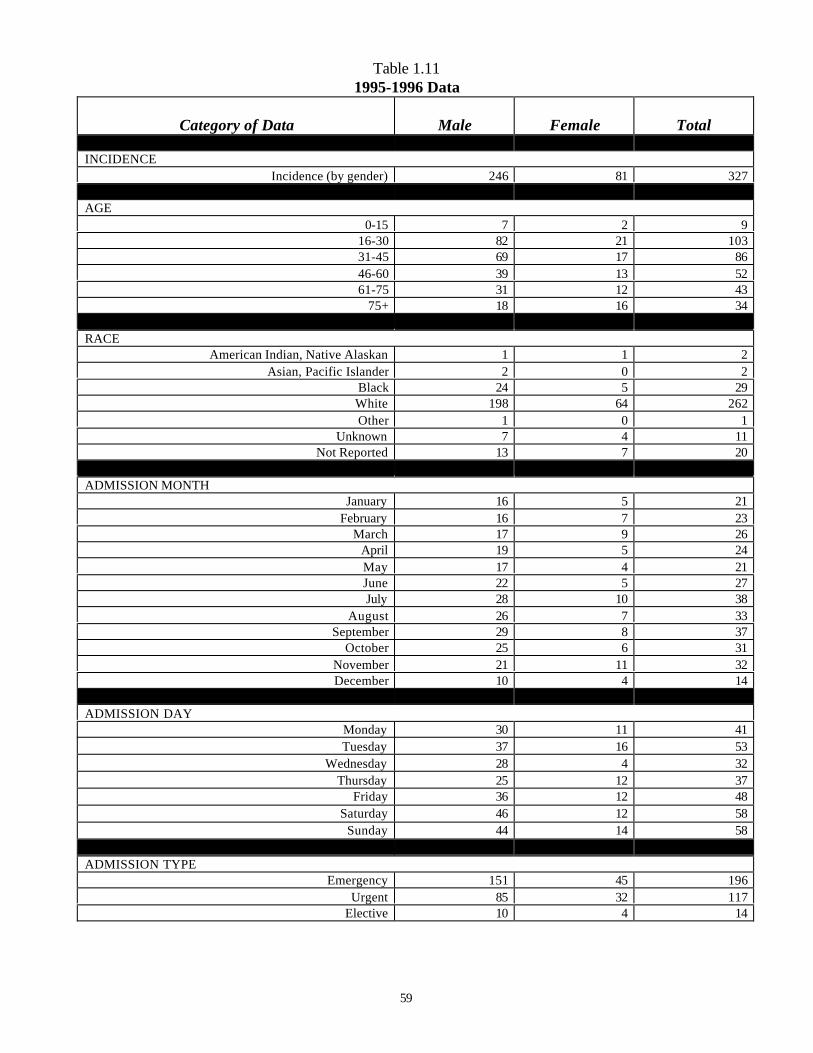
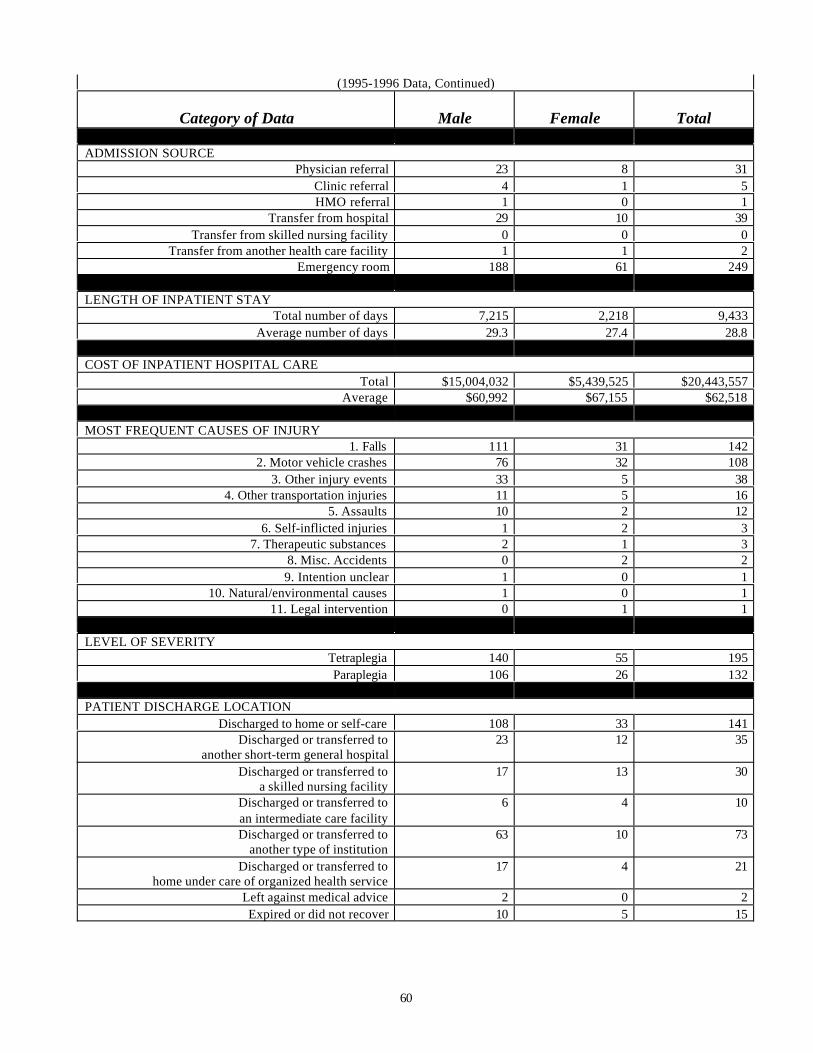
Table 1.11 1995-1996 Data 59
7
v
Introduction
Registry Background
Data Sources
Wisconsin's Population
Glossary of Terms
Introduction to Spinal Cord Injury
8
9
Introduction
The establishment of a statewide registry and surveillance program is necessary in orderto clearly identify factors and demographics associated with the population of individualsthat sustains spinal cord injuries (SCI). Accurate incidence, prevalence and economicinformation about disabilities caused by traumatic injuries have been lacking inWisconsin.
This Wisconsin Spinal Cord Injury Report represents a historical overview of spinal cordinjuries in Wisconsin from 1995 to 1996. The data presented in this report includeshospital discharge data related to spinal cord injuries with ICD-9-CM diagnostic codes806.00-806.99 (fracture of vertebral column with spinal cord injury) and 952.00-952.99(spinal cord injury without evidence of spinal bone injury). Within this data it is possiblethat the same person could be hospitalized more than once during a particular year. Inorder to avoid counting duplicate hospital visits, only the initial hospital visit data isincluded in the report, except for the “length of stay” and “cost of stay” data. Theseexceptions were figured from all hospital visits resulting from the original injury to givethe actual length of stay and cost of stay data for each injury. Spinal cord injury codeswere chosen based on Center for Disease Control and Prevention Guidelines. Thedischarge data presented here include all events occurring in Wisconsin during 1995-1996 to Wisconsin residents only. Non-residents of Wisconsin are not included.
Readers are encouraged to review the entire report and tables before drawing anyconclusions from one table or graph within the document. Please contact the Office forPersons with Physical Disabilities for further explanation of the data presented in thisreport or for additional copies.
Wisconsin Spinal Cord Injury SurveillanceOffice for Persons with Physical Disabilities
Bureau of Aging and Long Term Care ResourcesDivision of Supportive Living
Department of Health and Family ServicesP.O. Box 7851
Madison, Wisconsin 53707-7851
10
11
Registry Background
Background
The Wisconsin Council on Physical Disabilities state plan and Council on PhysicalDisabilities 1993-1995 Biennial Budget Initiatives identified the need for the systematiccollection and analysis of data. The high cost of treating disabilities, the savings inhuman suffering, and the cost-effectiveness of prevention are viable reasons forpromoting prevention programs.
Physical injury is costly. The National Safety Council (1989) estimated that in theUnited States:
drinking is indicated as a factor in at least half of the fatal motor vehicleaccidents;
in 40% of motorcycle fatalities, there was a detectable blood alcohol level.
the total lack of crash protection afforded by motorcycles places themotor-cyclist at an 80-90% risk of death or injury in any accident;
in six states where helmet laws were required, head injury in helmetedriders was reduced by at least 60%; and
trauma accidents involving the spinal cord have their highest incidenceamong adolescents.
Current Concerns
The Council identified the need for information about disability etiology, including spinalcord and brain injury, suggesting that a comprehensive program of public educationcould serve to educate people about specific precautions and thus reduce the incidence ofinjury. Specific measures such as driving practices, crash helmets, and seat belts andsubsequent public awareness programs that focus on youth could have significantinfluence on reducing such injuries. Knowledge about the etiology of injuries alsosuggests that a comprehensive public information program must be coordinated withother public and private agencies that also have a significant responsibility for disabilitiesprevention and related issues.
In 1994 the Wisconsin Council on Physical Disabilities received a planning grant fromthe Wisconsin Council on Developmental Disabilities to identify opportunities toestablish spinal cord injury and brain trauma surveillance. The Office for Persons withPhysical Disabilities staff worked with the Council to identify potential fundingopportunities.
12
Spinal Cord Injury Surveillance
In 1995 the Medical College of Wisconsin received a five-year grant from the NationalInstitute on Disability and Rehabilitation Research, Department of Education to become afederally designated Model Spinal Cord Injury Center. As an integral component of thegrant, the Department of Health and Family Services, Office for Persons with PhysicalDisabilities received a subcontract to establish spinal cord injury surveillance. Thissurveillance has begun to compile statewide data about persons who have sustainedspinal cord injuries. This data will enable other investigators to design and implementprevention projects and service projects, which will assist individuals with spinal cordinjuries to live at their maximum levels of independence in their communities.
The objectives of the Spinal Cord Injury Surveillance include:
contribute to and compare Wisconsin data with the national SCIdata base;
identify and track the incidence of spinal cord injury in Wisconsin;
provide data which will facilitate the development andimplementation of effective preventive programs;
provide data which will facilitate blending the prevention andservice aspects of health care for the population with SCI; and
identify and track the expenditure of treatment and service dollarsfor persons who are spinal cord injured.
13
Data Sources
Surveillance opportunities in Wisconsin for injuries, illnesses, and other conditions haveincreased since the creation of the Office of Health Care Information (OHCI) hospitaldischarge data system.
The 1987 Wisconsin Act 399 established an Office of Health Care Information. OHCI’sresponsibilities include collecting, analyzing, and disseminating information on healthcare from inpatient hospital medical records. Under the statute and administrative rules,hospitals are required to submit specific data to OHCI for the purpose of constructing aninpatient hospital database, using information currently being collected on the UniformBilling forms (UB-92). Along with a patient’s billing information, the diagnosis andtreatment of the patient are recorded using standard International Classification ofDisease-9th Revision-Clinical Modification (ICD-9-CM) codes. OHCI, at present,collects one principal diagnostic code and has the capability of collecting up to foursecondary codes.
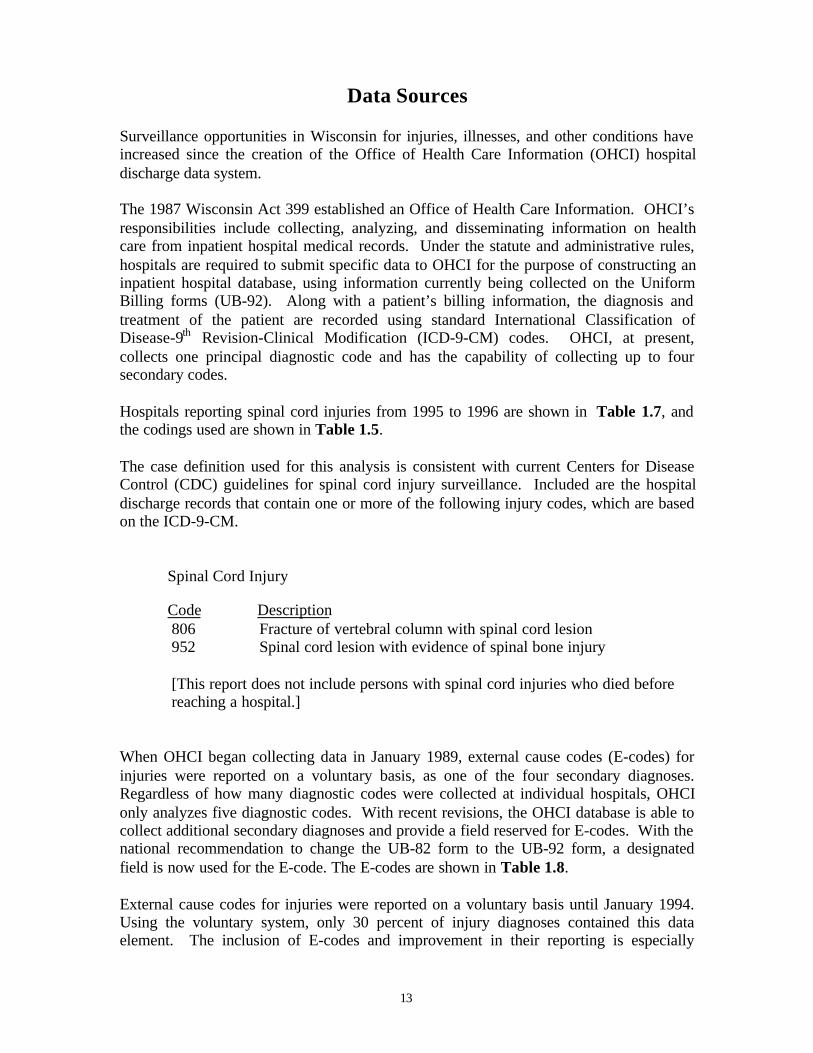
Hospitals reporting spinal cord injuries from 1995 to 1996 are shown in Table 1.7, andthe codings used are shown in Table 1.5.
The case definition used for this analysis is consistent with current Centers for DiseaseControl (CDC) guidelines for spinal cord injury surveillance. Included are the hospitaldischarge records that contain one or more of the following injury codes, which are basedon the ICD-9-CM.
Spinal Cord Injury
Code Description806 Fracture of vertebral column with spinal cord lesion952 Spinal cord lesion with evidence of spinal bone injury
[This report does not include persons with spinal cord injuries who died beforereaching a hospital.]
When OHCI began collecting data in January 1989, external cause codes (E-codes) forinjuries were reported on a voluntary basis, as one of the four secondary diagnoses.Regardless of how many diagnostic codes were collected at individual hospitals, OHCIonly analyzes five diagnostic codes. With recent revisions, the OHCI database is able tocollect additional secondary diagnoses and provide a field reserved for E-codes. With thenational recommendation to change the UB-82 form to the UB-92 form, a designatedfield is now used for the E-code. The E-codes are shown in Table 1.8.
External cause codes for injuries were reported on a voluntary basis until January 1994.Using the voluntary system, only 30 percent of injury diagnoses contained this dataelement. The inclusion of E-codes and improvement in their reporting is especially
14
important to the surveillance plan, as these codes classify causative agents and/oractivities for disabling injuries. The E-codes provide crucial information to guide,develop and evaluate interventions, as well as initiate preventative activities. EffectiveJanuary 1994, Wisconsin hospitals were required to report E-codes.
In the early years of hospital data collection, documentation and collection of race codeswas not mandatory, therefore the race of some patients from 1995-1996 is “unknown” ordocumented as “other”.
Data Security
The Spinal Cord Registry maintains confidential data on individuals. This data is onlyaccessible to the individual subject of the data and persons who work directly on theregistry. Measures to retain patient confidentiality are outlined in Wisconsin StatuesChapter 153.45 (Release of Data) and 153.50 (Protection of Patient Confidentiality).Only summary data are accessible to the public to protect individual identities.
All data is protected electronically through password measures, and copies of the data onbackup diskettes are kept under lock and key. Any additional information collected frompersons with spinal cord injuries (in the form of interviews, phone contact, etc.), for thepurposes of prevention and services, will be conducted by persons under the directsupervision of the Director of the Office for Persons with Physical Disabilities.
Other Security
In addition to data password protection, an automatic virus-checking program has beeninstalled on the registry computer in order to safeguard against the possibility of any formof virus infecting the data.
Data Quality
As stated in the introduction, while analyzing the data, questions arose relevant to thevalidity of coding by hospitals of actual spinal cord injuries resulting in permanentneurological deficit necessitating an inpatient rehabilitation stay. In a recent article in theAmerican Journal of Epidemiology, Vol. 146, pp 266-272, 1997, Johnson et al. raised theissue of accuracy in reporting of spinal cord injury to a statewide database in Colorado.They report a positive predictive value of 0.55, which implies that one can be only 55%certain that an identified case of spinal cord injury is, in fact, a spinal cord injuryresulting in permanent neurological deficit. This has obvious impact on the surveillanceaspects of any registry that is planning on recording only spinal cord injuries withpermanent neurological deficit. It is important to remember that the Center for DiseaseControl only requires a code of 806 or 952 for its registry. While full medical chartreview of all reported cases would not be feasible due to reasons of cost, time andconfidentiality, an attempt is underway to screen the data using the available codes byusing a process developed by the Medical College of Wisconsin Model Spinal Cord
15
Injury Center. Diagnoses critical to spinal cord injury including acute paraplegia ortetraplegia, bowel and bladder paralysis and systemic problems typically associated withspinal cord injury were reviewed. Also incorporated in the determination of acuity wasthe performance of surgery for decompression or stabilization of the spine, placement ofa halo, and transfer into a rehabilitation environment. Lengths of stay and outcome datawere also considered: if patient demonstrated transient quadriparesis, or was dischargedhome after one day of inpatient hospital care, it was clear that this was not a permanentneurological deficit. In addition there was the need to verify this process by comparingthe results with actual medical records. Several of the coding sheets were compared to themedical records of patients who had been discharged from Froedtert Hospital. Eighty-sixpercent of the determinations at Froedtert were found to be correct, thereby establishingthe validity of the coding by that hospital.
16
Wisconsin’s Population
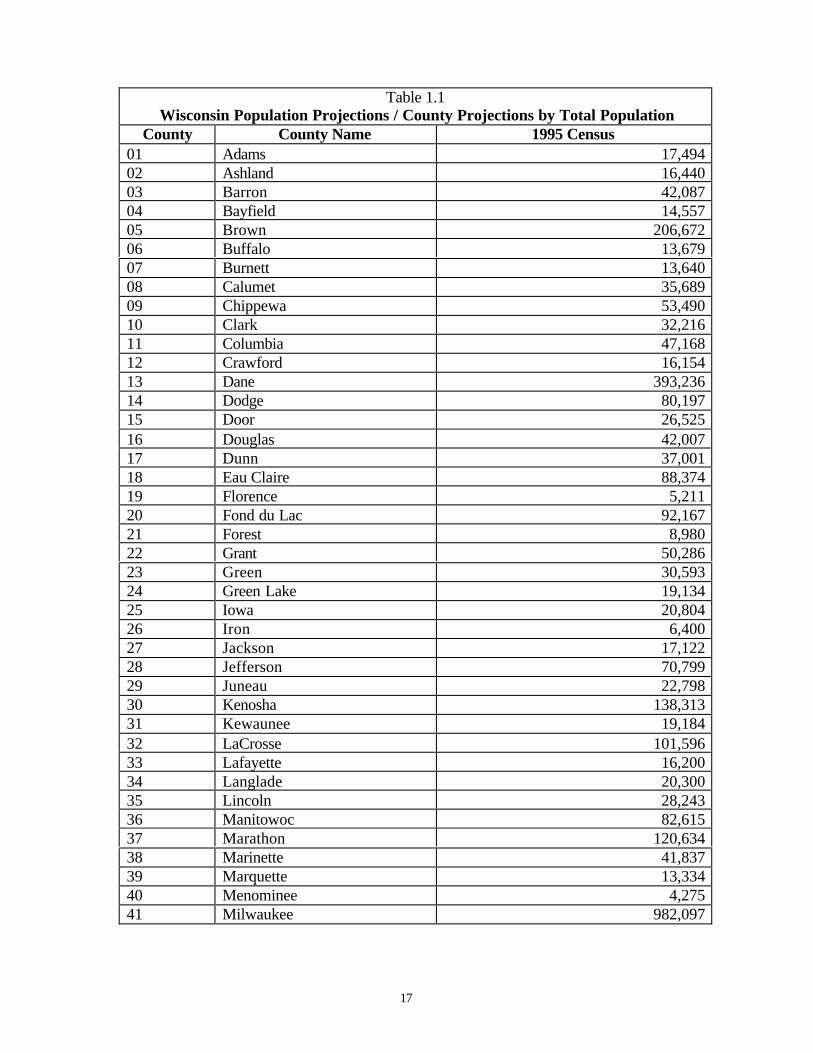
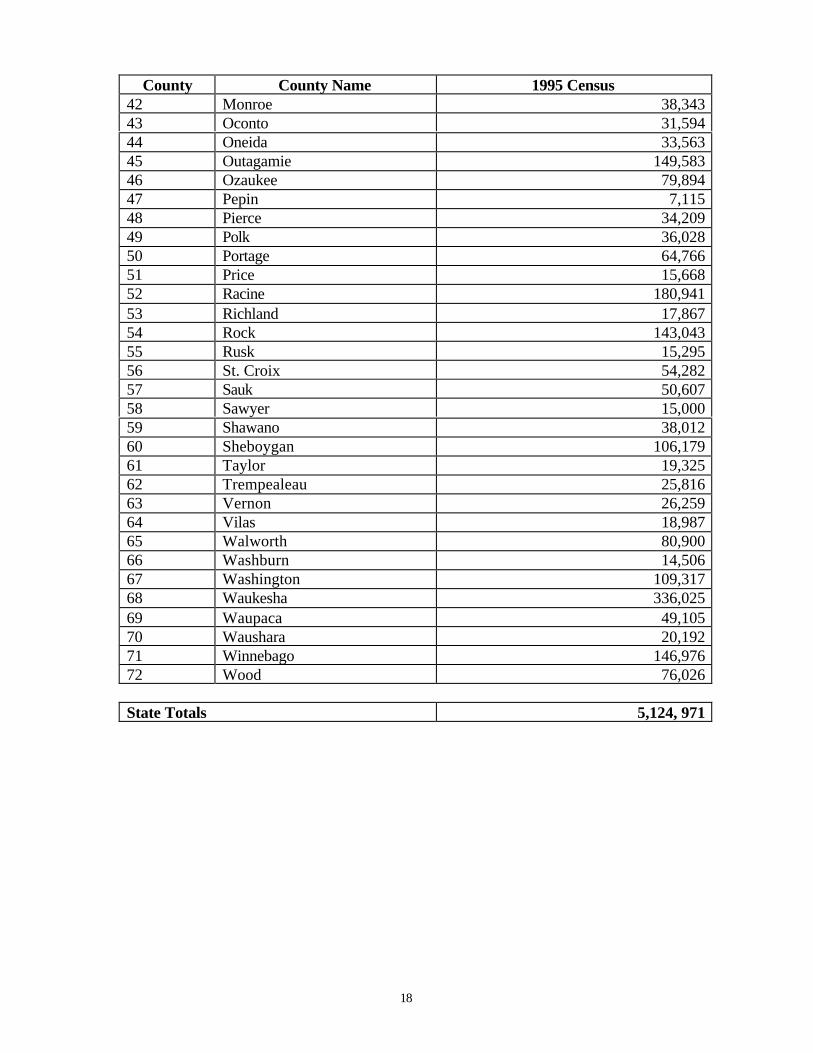
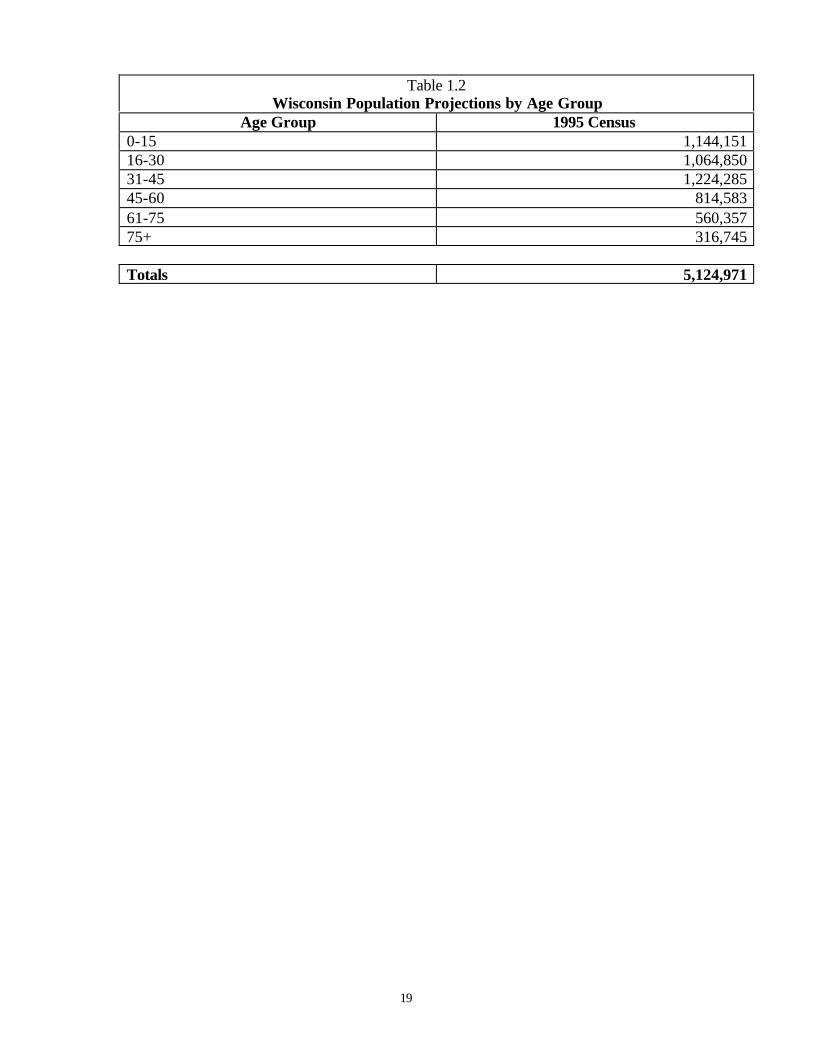
Tables 1.1 and 1.2 summarize Wisconsin's population by county of residence, age andgender. From the 1995 census data, Wisconsin's population was approximately 49percent male and 51 percent female. The largest population age groups for both malesand females was in the 31-45 age category, comprising 24% of the general population.Ages 0-15 (22%), 16-30 (21%), 46-60 (16%), and 61-75 (11%), followed. Those aged 75and older made up the smallest age group, comprising 6% of the general population(Wisconsin Department of Administration, 1998).
In terms of racial diversity in 1995, 92.3 percent of Wisconsin's population was white,5.4 percent black, 1.4 percent Asian or Pacific Islander, and 0.9 percent American Indian.In terms of the data used in this report, some of the identifying race information was notcollected when the patient was admitted to the hospital in 1995 and 1996.
17
Table 1.1Wisconsin Population Projections / County Projections by Total Population
County County Name 1995 Census01 Adams 17,49402 Ashland 16,44003 Barron 42,08704 Bayfield 14,55705 Brown 206,67206 Buffalo 13,67907 Burnett 13,64008 Calumet 35,68909 Chippewa 53,49010 Clark 32,21611 Columbia 47,16812 Crawford 16,15413 Dane 393,23614 Dodge 80,19715 Door 26,52516 Douglas 42,00717 Dunn 37,00118 Eau Claire 88,37419 Florence 5,21120 Fond du Lac 92,16721 Forest 8,98022 Grant 50,28623 Green 30,59324 Green Lake 19,13425 Iowa 20,80426 Iron 6,40027 Jackson 17,12228 Jefferson 70,79929 Juneau 22,79830 Kenosha 138,31331 Kewaunee 19,18432 LaCrosse 101,59633 Lafayette 16,20034 Langlade 20,30035 Lincoln 28,24336 Manitowoc 82,61537 Marathon 120,63438 Marinette 41,83739 Marquette 13,33440 Menominee 4,27541 Milwaukee 982,097
18
County County Name 1995 Census42 Monroe 38,34343 Oconto 31,59444 Oneida 33,56345 Outagamie 149,58346 Ozaukee 79,89447 Pepin 7,11548 Pierce 34,20949 Polk 36,02850 Portage 64,76651 Price 15,66852 Racine 180,94153 Richland 17,86754 Rock 143,04355 Rusk 15,29556 St. Croix 54,28257 Sauk 50,60758 Sawyer 15,00059 Shawano 38,01260 Sheboygan 106,17961 Taylor 19,32562 Trempealeau 25,81663 Vernon 26,25964 Vilas 18,98765 Walworth 80,90066 Washburn 14,50667 Washington 109,31768 Waukesha 336,02569 Waupaca 49,10570 Waushara 20,19271 Winnebago 146,97672 Wood 76,026
State Totals 5,124, 971
19
Table 1.2Wisconsin Population Projections by Age Group
Age Group 1995 Census0-15 1,144,15116-30 1,064,85031-45 1,224,28545-60 814,58361-75 560,35775+ 316,745
Totals 5,124,971
20
21
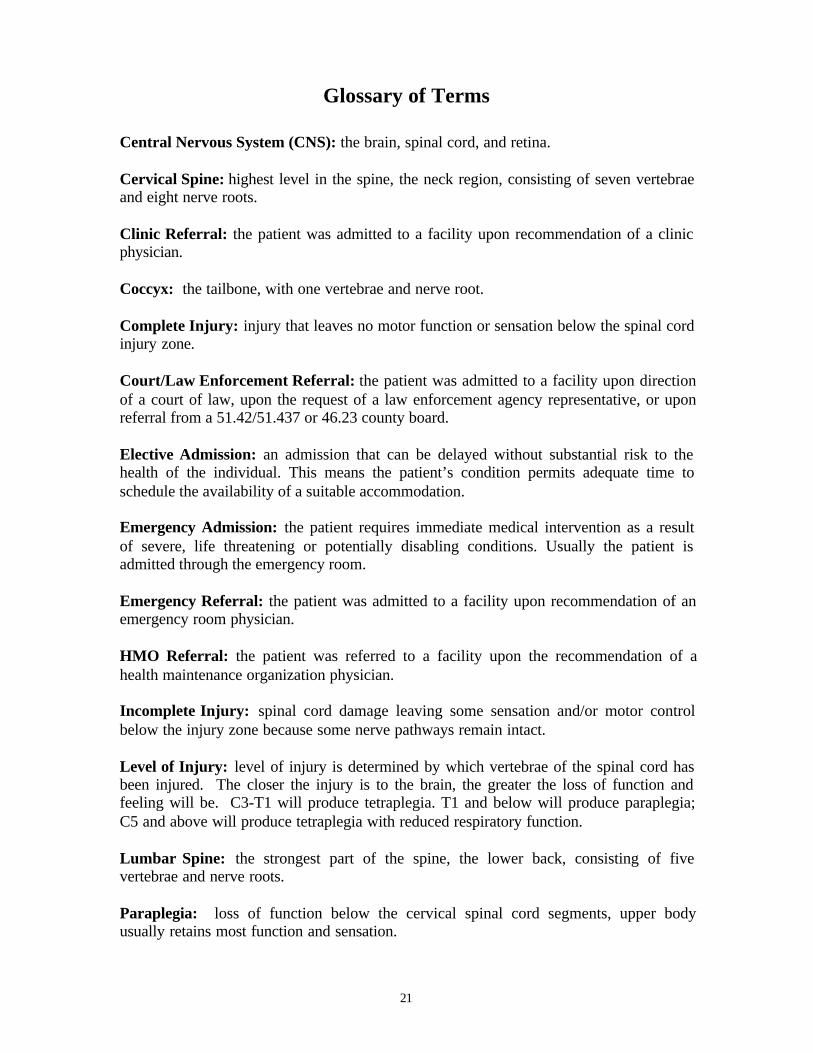
Glossary of Terms
Central Nervous System (CNS): the brain, spinal cord, and retina.
Cervical Spine: highest level in the spine, the neck region, consisting of seven vertebraeand eight nerve roots.
Clinic Referral: the patient was admitted to a facility upon recommendation of a clinicphysician.
Coccyx: the tailbone, with one vertebrae and nerve root.
Complete Injury: injury that leaves no motor function or sensation below the spinal cordinjury zone.
Court/Law Enforcement Referral: the patient was admitted to a facility upon directionof a court of law, upon the request of a law enforcement agency representative, or uponreferral from a 51.42/51.437 or 46.23 county board.
Elective Admission: an admission that can be delayed without substantial risk to thehealth of the individual. This means the patient’s condition permits adequate time toschedule the availability of a suitable accommodation.
Emergency Admission: the patient requires immediate medical intervention as a resultof severe, life threatening or potentially disabling conditions. Usually the patient isadmitted through the emergency room.
Emergency Referral: the patient was admitted to a facility upon recommendation of anemergency room physician.
HMO Referral: the patient was referred to a facility upon the recommendation of ahealth maintenance organization physician.
Incomplete Injury: spinal cord damage leaving some sensation and/or motor controlbelow the injury zone because some nerve pathways remain intact.
Level of Injury: level of injury is determined by which vertebrae of the spinal cord hasbeen injured. The closer the injury is to the brain, the greater the loss of function andfeeling will be. C3-T1 will produce tetraplegia. T1 and below will produce paraplegia;C5 and above will produce tetraplegia with reduced respiratory function.
Lumbar Spine: the strongest part of the spine, the lower back, consisting of fivevertebrae and nerve roots.
Paraplegia: loss of function below the cervical spinal cord segments, upper bodyusually retains most function and sensation.
22
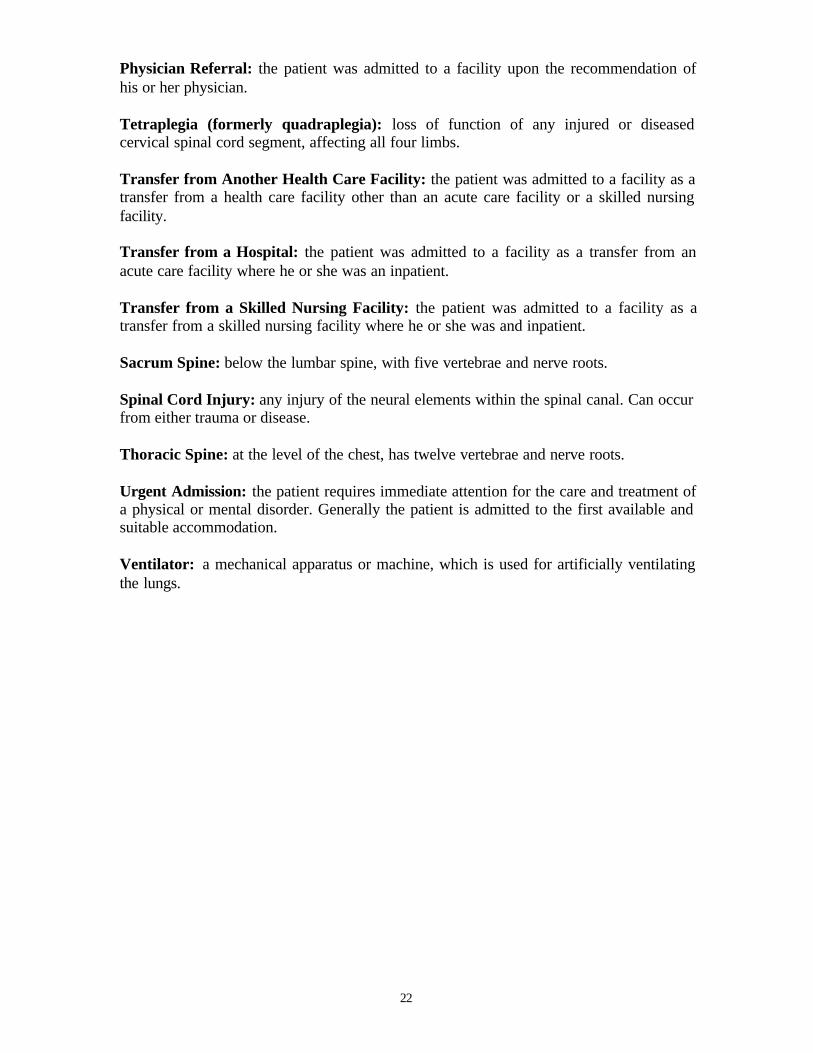
Physician Referral: the patient was admitted to a facility upon the recommendation ofhis or her physician.
Tetraplegia (formerly quadraplegia): loss of function of any injured or diseasedcervical spinal cord segment, affecting all four limbs.
Transfer from Another Health Care Facility: the patient was admitted to a facility as atransfer from a health care facility other than an acute care facility or a skilled nursingfacility.
Transfer from a Hospital: the patient was admitted to a facility as a transfer from anacute care facility where he or she was an inpatient.
Transfer from a Skilled Nursing Facility: the patient was admitted to a facility as atransfer from a skilled nursing facility where he or she was and inpatient.
Sacrum Spine: below the lumbar spine, with five vertebrae and nerve roots.
Spinal Cord Injury: any injury of the neural elements within the spinal canal. Can occurfrom either trauma or disease.
Thoracic Spine: at the level of the chest, has twelve vertebrae and nerve roots.
Urgent Admission: the patient requires immediate attention for the care and treatment ofa physical or mental disorder. Generally the patient is admitted to the first available andsuitable accommodation.
Ventilator: a mechanical apparatus or machine, which is used for artificially ventilatingthe lungs.
23
Introduction to Spinal Cord Injury
The spinal cord is part of the nervous system and is the largest nerve in the body. It isabout 18 inches long and extends from the base of the brain, down the middle of theback, to about the waist and is surrounded by protective rings of bone called the vertebralcolumn, or the spinal column. The 33 vertebrae of the spine can be divided into severalregions. At the highest level in the spine, the neck region is the cervical spine, consistingof seven vertebrae and eight nerve roots. They are smaller than the other vertebrae, whichallows a greater amount of movement. The thoracic spine, at the level of the chest, hastwelve vertebrae and nerve roots. The spinal canal in the thoracic region is relativelysmaller than the cervical or lumbar areas. This makes the thoracic spinal cord at greaterrisk if there is a fracture (Maddox, 1993).
Below the thoracic spine is the lumbar spine, the low back region, consisting of fivevertebrae and nerve roots and then the sacrum, which also has five fused vertebrae andnerve roots. The coccyx, or tailbone, has one vertebrae and nerve root. Vertebrae increasein size as they go down the column, with the cervical as the smallest and the lumbar thelargest.
The central nervous system consists of the brain and spinal cord. The nerves that liewithin the spinal cord are upper motor neurons and their function is to carry the messagesback and forth from the brain to the spinal nerves along the spinal tract. The peripheralnervous system consists of spinal nerves that branch out from the spinal cord to otherparts of the body that are called lower motor neurons. These spinal nerves exit and enterat each vertebral level and communicate with specific areas of the body. The sympatheticnervous system is a system of nerves that controls involuntary functions such as bloodpressure and temperature regulation.
The term spinal cord injury or SCI refers to any injury of the neural elements within thespinal column. SCI can occur from either trauma or disease to the vertebral column orthe spinal cord itself, though most spinal cord injuries are the result of trauma to thevertebral column. The spinal cord does not have to be severed in order for a loss offunctioning to occur. In fact, in most people with SCI, the spinal cord is intact, but thedamage to it results in loss of functioning due to bruising or loss of blood supply. Theseinjuries can affect the spinal cord's ability to send and receive messages from the brain tothe body systems that control the sensory, motor, and autonomic function below the levelof injury.
Typically, the nerves above the injury site continue to function as they always have andthe nerves below the site do not. A physician describes an individual as having a certain“level” injury by naming the region affected and the level that corresponds with thatregion. In general, the higher the level of injury, the greater the functional loss. Damageto the cervical region (C1-C8) usually results in a loss of function in the arms and legs,resulting in tetraplegia. Injury to the thoracic region (T1-T12) usually affects the chestand legs and results in paraplegia. Nationally, the most common types of injury are at themid-to-low cervical vertebrae (C5-C6), followed by the thoracolumbar junction (T2-L1).Both spots are the spine’s areas of greatest flexibility and vulnerability.
24
Mortality rates are significantly higher during the first year after injury than duringsubsequent years. The average life expectancy for a person with spinal cord injurycontinues to increase due to improved technology, but is still somewhat below normal.Spinal cord injuries have profound effects on the public health system because of theyoung age of those injured, the high cost of acute and rehabilitative care, and the long-term disability.
25
v
Executive Summary
Incidence of Spinal Cord Injury
Hospitalization and Cost Information
Circumstances of Spinal Cord Injury
Status at Time of Discharge
Spinal Cord Injury Rates by County of Residence
26
27
Executive Summary
From 1995 to 1996, there were 327 spinal cord injury events in Wisconsin with thepredominant causes of hospitalizations being motor vehicle crashes, falls, and otherinjury events. Males disproportionately represented 75% of spinal cord injuries. InWisconsin, the average age at time of injury was 42.8 (males 40.6 and females 49.5),with the most frequent age at 16 (males 16 and 21 and females 16 and 79). Males aged16-30 represented the overall largest group of injury with 82, followed by men in the 31-45 age group with 69. Females aged 16-30 represented the largest group for women with21injuries, followed by women aged 31-45 with 17 injuries. Overall, 31% of all injuries(both men and women) occurred between the ages of 16-30.
The majority of individuals admitted for spinal cord injuries during 1995-1996 werewhite (262 or 80%), followed by 29 (or 9%) being black. Although whites sustain themajority of spinal cord injuries, members of minority groups sustain a disproportionatepercentage relative to their numbers.
The warmest months (July through November) had the highest number of spinal cordinjury events, with July and September being the leading months. Saturday and Sundayhad the highest incidence of spinal cord injuries. It is important to remember thatSaturday and Sunday would include any incidences that occurred the "night" before (aftermidnight). For example, Saturday injuries would include any incidence that occurredafter midnight on Friday.
The average length of an inpatient hospital stay from 1995-1996 ranged from 28.9 daysin 1995 to 28.7 days in 1996. During the five years, over 9,433 days – the equivalent of26 years – were spent in acute care hospitals by Wisconsin’s 327 spinal cord injurysurvivors. From 1995-1996, acute care hospital charges for treatment for spinal cordinjuries totaled more than $9 million per year. The average charge for a non-fatal spinalcord injury was $62,518 per year.
Spinal cord injuries have profound effects on the public health system because of theyoung age of those injured, the high cost of acute and rehabilitative care, and the long-term disability. Thus, the findings of this and future registries will identify the cost andcause of spinal cord injury, leading to strategies to prevent the injuries from occurring inthe first place.
28
29
Spinal Cord Injury Events: 1995—1996
The Incidence of Spinal Cord Injury
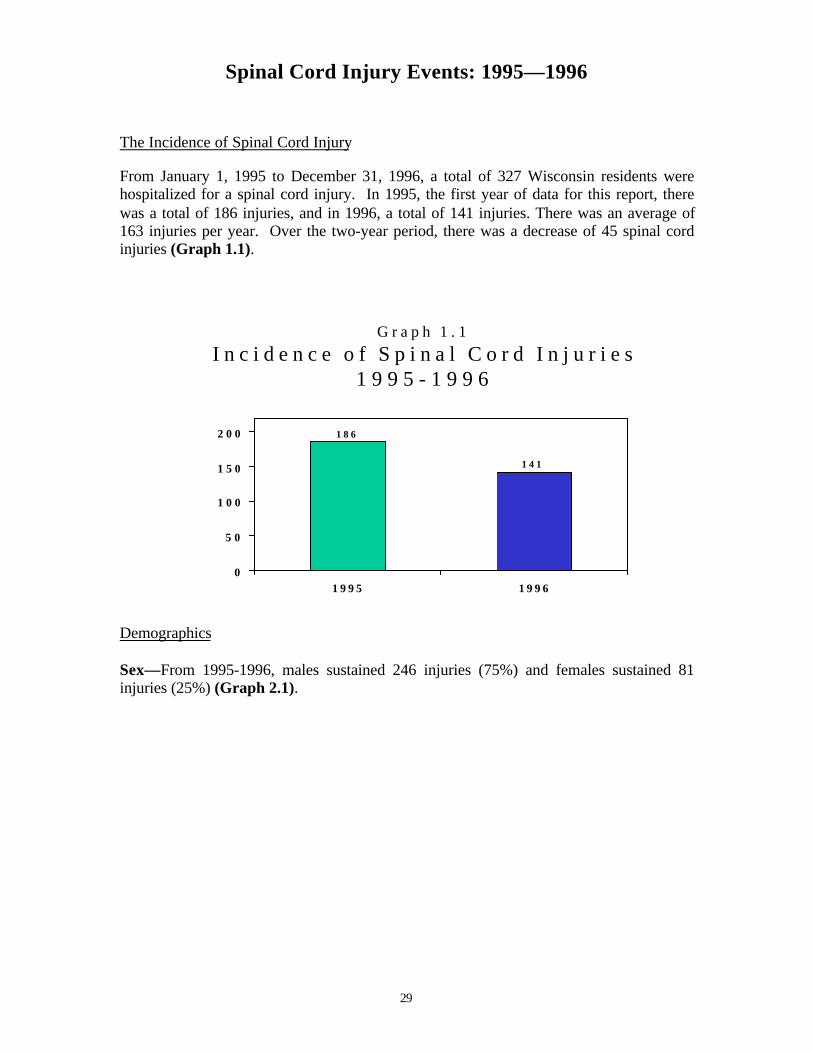
From January 1, 1995 to December 31, 1996, a total of 327 Wisconsin residents werehospitalized for a spinal cord injury. In 1995, the first year of data for this report, therewas a total of 186 injuries, and in 1996, a total of 141 injuries. There was an average of163 injuries per year. Over the two-year period, there was a decrease of 45 spinal cordinjuries (Graph 1.1).
G r a p h 1 . 1I n c i d e n c e o f S p i n a l C o r d I n j u r i e s
G r a p h 1 . 2I n j u r i e s b y G e n d e r a n d Y e a r
1 9 9 5 - 1 9 9 6
1 3 8
4 8
1 0 8
3 3
0
2 04 06 0
8 01 0 0
1 2 01 4 01 6 0
1 9 9 5 1 9 9 6
M a l e s F e m a l e s
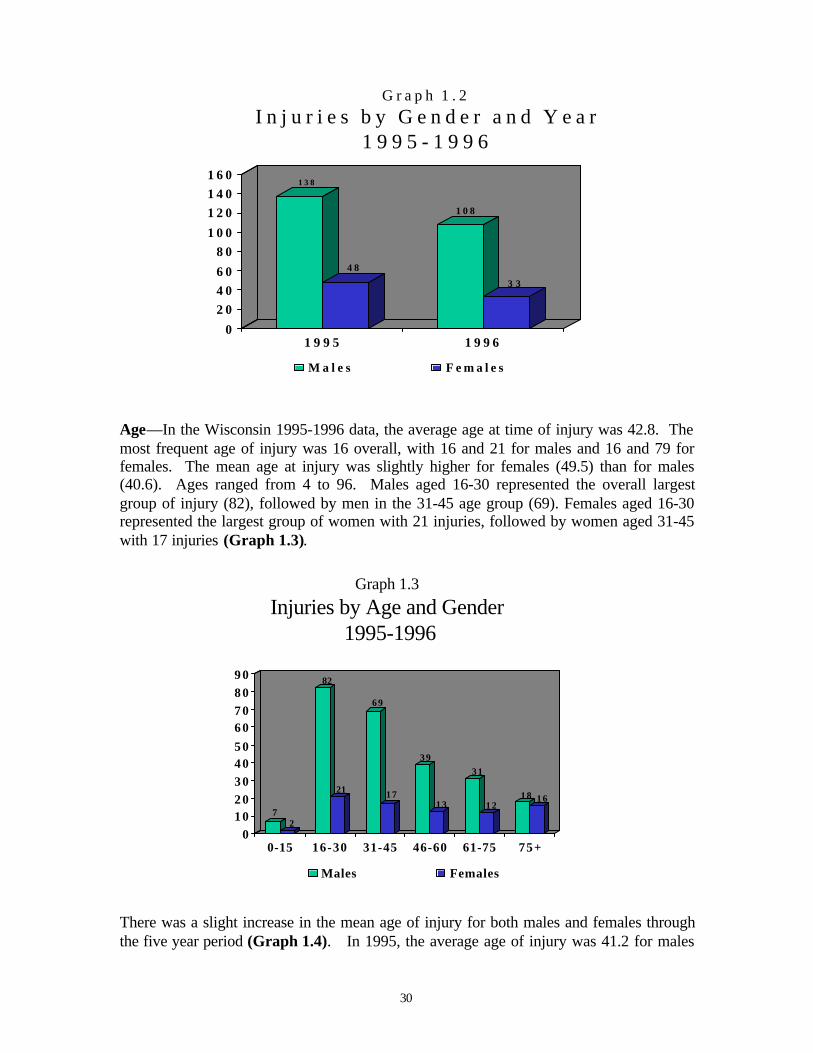
Age—In the Wisconsin 1995-1996 data, the average age at time of injury was 42.8. Themost frequent age of injury was 16 overall, with 16 and 21 for males and 16 and 79 forfemales. The mean age at injury was slightly higher for females (49.5) than for males(40.6). Ages ranged from 4 to 96. Males aged 16-30 represented the overall largestgroup of injury (82), followed by men in the 31-45 age group (69). Females aged 16-30represented the largest group of women with 21 injuries, followed by women aged 31-45with 17 injuries (Graph 1.3).
Graph 1.3
Injuries by Age and Gender 1995-1996
72
82
21
69
17
39
13
31
1218 16
01 02 03 04 05 06 07 08 09 0
0-15 16-30 31-45 46-60 61-75 75+
Males Females
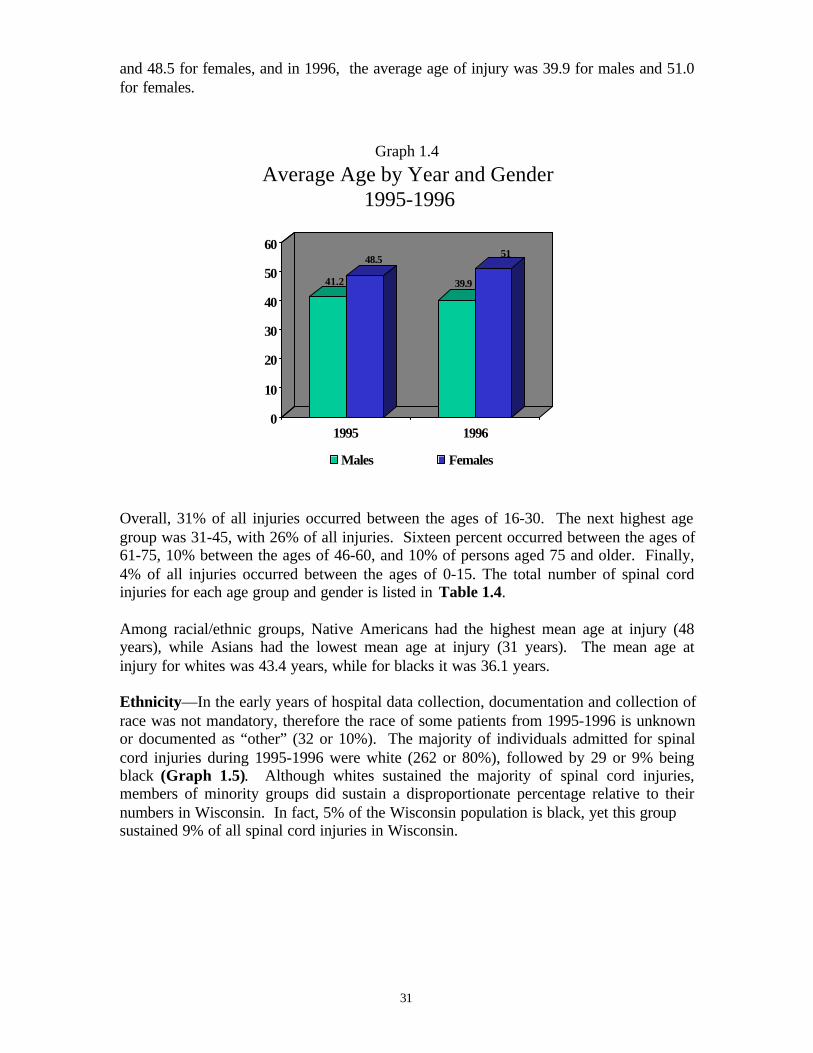
There was a slight increase in the mean age of injury for both males and females throughthe five year period (Graph 1.4). In 1995, the average age of injury was 41.2 for males
31
and 48.5 for females, and in 1996, the average age of injury was 39.9 for males and 51.0for females.
Graph 1.4
Average Age by Year and Gender 1995-1996
41.2
48.5
39.9
51
0
10
20
30
40
50
60
1995 1996
Males Females
Overall, 31% of all injuries occurred between the ages of 16-30. The next highest agegroup was 31-45, with 26% of all injuries. Sixteen percent occurred between the ages of61-75, 10% between the ages of 46-60, and 10% of persons aged 75 and older. Finally,4% of all injuries occurred between the ages of 0-15. The total number of spinal cordinjuries for each age group and gender is listed in Table 1.4.
Among racial/ethnic groups, Native Americans had the highest mean age at injury (48years), while Asians had the lowest mean age at injury (31 years). The mean age atinjury for whites was 43.4 years, while for blacks it was 36.1 years.
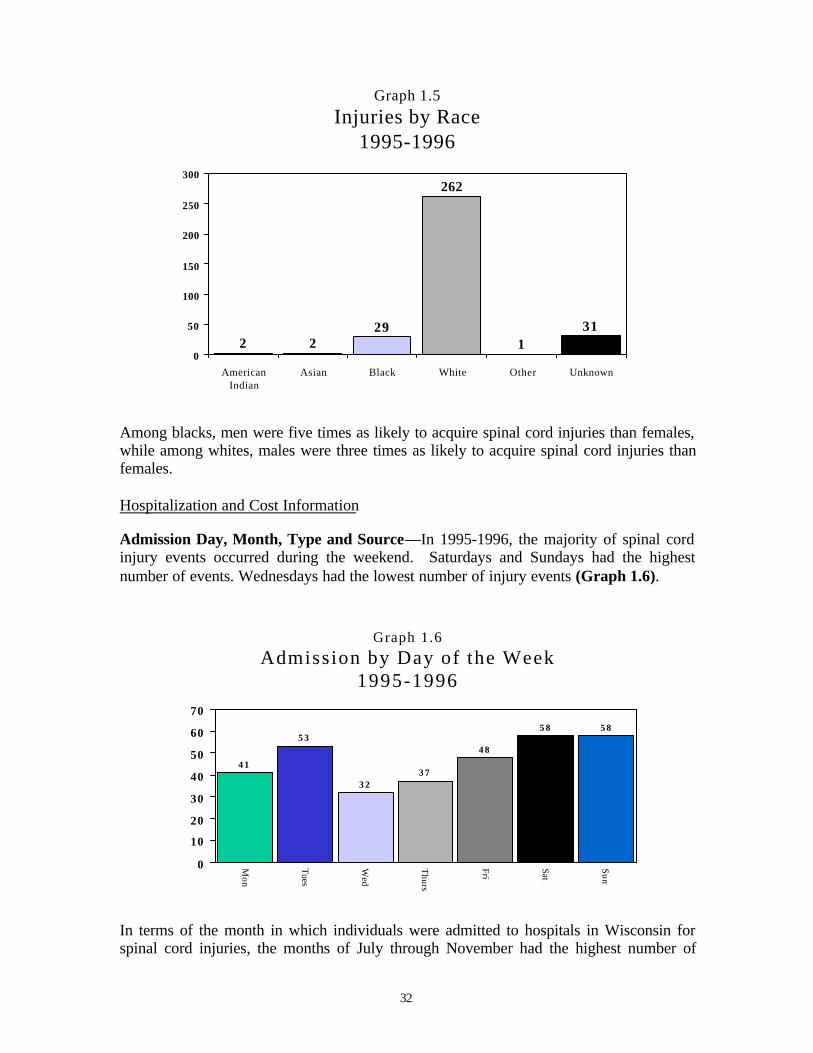
Ethnicity—In the early years of hospital data collection, documentation and collection ofrace was not mandatory, therefore the race of some patients from 1995-1996 is unknownor documented as “other” (32 or 10%). The majority of individuals admitted for spinalcord injuries during 1995-1996 were white (262 or 80%), followed by 29 or 9% beingblack (Graph 1.5). Although whites sustained the majority of spinal cord injuries,members of minority groups did sustain a disproportionate percentage relative to theirnumbers in Wisconsin. In fact, 5% of the Wisconsin population is black, yet this groupsustained 9% of all spinal cord injuries in Wisconsin.
32
Graph 1.5Injuries by Race
1995-1996
2 229
262
131
0
50
100
150
200
250
300
AmericanIndian
Asian Black White Other Unknown
Among blacks, men were five times as likely to acquire spinal cord injuries than females,while among whites, males were three times as likely to acquire spinal cord injuries thanfemales.
Hospitalization and Cost Information
Admission Day, Month, Type and Source—In 1995-1996, the majority of spinal cordinjury events occurred during the weekend. Saturdays and Sundays had the highestnumber of events. Wednesdays had the lowest number of injury events (Graph 1.6).
Graph 1.6Admission by Day of the Week
1995-1996
4 1
5 3
3 23 7
4 8
5 8 5 8
0
10
20
30
40
50
60
70
Mon
Tues
Wed
Thurs
Fri
Sat
Sun
In terms of the month in which individuals were admitted to hospitals in Wisconsin forspinal cord injuries, the months of July through November had the highest number of
33
injuries. Overall, July had the highest number of admissions with 38, followed bySeptember with 37. December had the lowest amount with 14 (Graph 1.7). If racebecomes a variable, blacks had the highest incidence of injury in January, April and July.
Graph 1.7
Admission by Month1995-1996
2123
2624
21
27
38
33
37
31 32
14
0
5
10
15
20
25
30
35
40
Jan Feb Mar Apr May June July Aug Sept Oct Nov Dec
Both the largest type and source of admission to hospitals involving residents with spinalcord injuries occurred during emergency situations, where the patient required immediatemedical intervention as a result of severe, life threatening or potentially disablingconditions (Graph 1.8).
Graph 1.8
Type of Admission1995-1996
196
117
14
0
50
100
150
200
250
Emergency (60%) Urgent (36%) Elective (4%)
Length of Inpatient Stay—The average length of hospital stay from 1995-1996 rangedfrom 28.9 days in 1995, to 28.7 days in 1996 (Graph 1.9). During the two years, over9,433 days—the equivalent of 26 years—were spent in acute care hospitals by
34
Wisconsin’s 327 spinal cord injury survivors. During the time period, acute initialhospital stays ranged from 1 to 149 days. The average length of stay for men was 29.3days, for women 27.4 days. The level and severity of the injury, as well as other injuries,complications and surgical interventions contributed to this variation. For instance, theaverage length of stay for a tetraplegia injury was 21.1 days and for a paraplegia injury,20.4 days. Above all factors, respiratory complications, including ventilator dependency,were responsible for lengthy hospital stays.
Graph 1.9
Average Length of Inpatient Stay1995-1996
18.1
24.4
0
5
10
15
20
25
30
1995 1996
Cost of Inpatient Hospital Care—From 1995-1996, acute care hospital charges fortreatment of spinal cord injury totaled more than $9 million a year. In relation to the timespent in the hospital, the total costs for those stays fluctuated between 1995 and 1996. In1995, the average cost for a hospital stay was $56,693. In 1996 the average was $70,202(Graph 1.10). This was an increase of 24%. In terms of gender differences, the cost ofhospitalization was greater for females than males during the two years. Femalesaveraged $67,155 per year, males averaged $60,992 per year. In the two-year period,females tended to sustain more severe injuries. Sixty-eight percent of all injuries tofemales resulted in tetraplegia, while just 57% of injuries to males resulted in atetraplegia diagnosis. It is important to remember that these costs do not reflect the totalcost for a spinal cord injury, since medical equipment, ongoing medical care, home andvehicle modifications, and attendant care greatly add to the overall costs of spinal cordinjuries.
35
Graph 1.10
Average Cost of Inpatient Hospital Care1995-1996
56,693
70,202
0
10,000
20,000
30,000
40,000
50,000
60,000
70,000
80,000
1995 1996
Payer Type—From 1995-1996, the majority of initial inpatient stays (168 or 51.5%)were paid for by fee-for service insurance. Seventy-two (22%) initial inpatient stayswere paid for by an Alternative Health Care Insurance Plan (HMO, PPO, PPA, etc.).Other payment types included worker's compensation (27 or 8%), general relief (8 or2.5%), other government agency or program (6 or 2%), self-pay (19 or 6%), and other (4or 1%). For twenty-three (7%) inpatient stays, the exact type of payment, either fee-for-service or HMO was unable to be determined (Graph 1.11).
G r a p h 1 . 1 1
P a y e r T y p e1 9 9 5 - 1 9 9 6
5 2 %
2 2 %
8 %3 % 2 %
6 %1 %
7 %
0 %
1 0 %
2 0 %
3 0 %
4 0 %
5 0 %
6 0 %
Fee
for
Serv
ice
(168
)
HM
Os,
PPO
s
(72)
Wor
ker's
Com
pens
atio
n
(27)
Gen
eral
Rel
ief
(8)
Gov
ernm
ent
Prog
ram
(6)
Self
-pay
(19
)
Oth
er (
4)
Unk
now
n (2
3)
36
Primary and Secondary Payer— Medicare was the primary payer for 63 initialinpatient stays; Medicaid for 25 stays. Medicare was the secondary payer for 9 initialhospital stays; Medicaid for 14.
Circumstances of Spinal Cord Injury
Causes of Injury—The leading cause of spinal cord injury during 1995-1996 wasaccidental falls (142), followed by motor vehicle crashes (108), and then other injuryevents (38) (Graph 1.12). Causes of spinal cord injury can vary by race. Falls were theleading cause among whites (119), followed by motor vehicle crashes (89). Falls werethe leading cause of spinal cord injury among blacks (11), followed by intentionalinjuries (assault and self-inflicted) with (10).
Graph 1.12Causes of Injury 1995-1996
108
142
38
1 2 1 312
3 1
16
0
20
40
60
80
100
120
140
160
MV
C
OT
I
Falls
OIE
NE
C
MA LI
TS
Ass
aults SI
I
IU
Motor Vehicle Crashes (MVC) Other Transport Injuries (OTI)Falls Other Injury Events (OIE)Natural/Environmental Causes (NEC) Misc. Accidents (MA)Legal Intervention (LI) Therapeautic Substances (TS)Assaults Self-inflicted Injuries (SII)IU
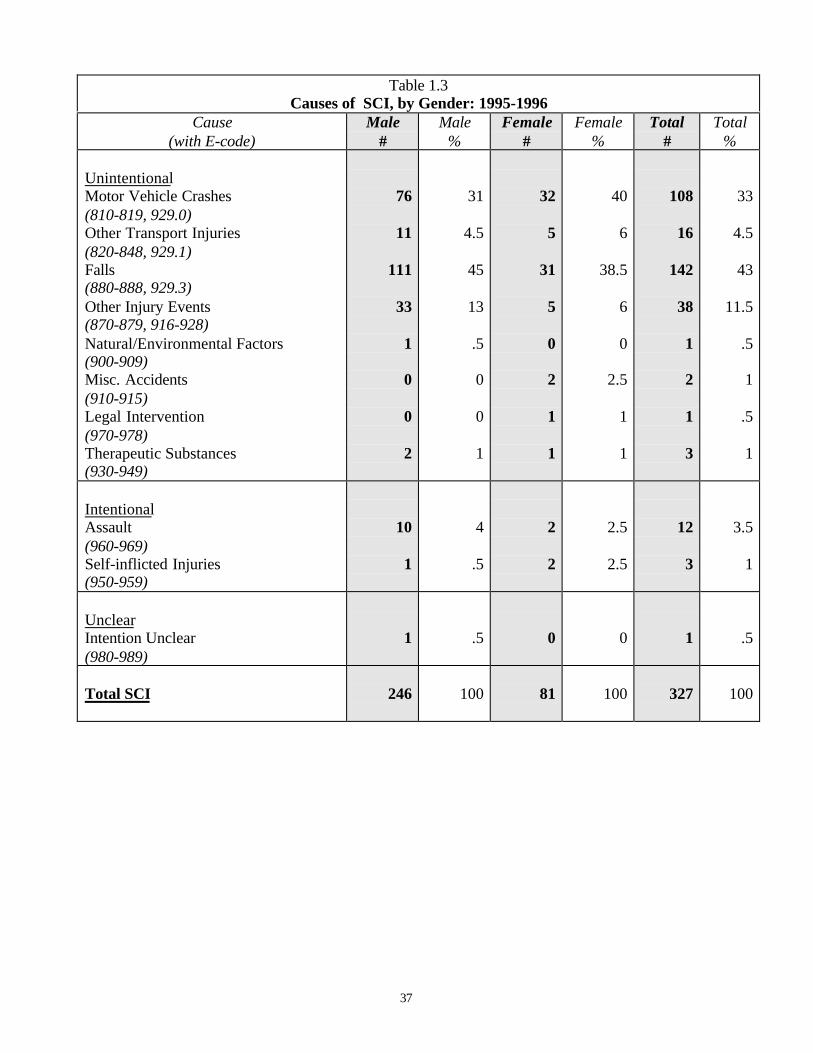
The leading causes of injuries of spinal cord injuries for 1995 and 1996 are listed inTable 1.3.
Table 1.4Causes of SCI by Selected Age Groups: 1995-1996
Male Female TotalAge Groups & Causes Number of
SCI Events %Number ofSCI Events %
Number ofSCI Events %
0-15 Total All Causes
Motor Vehicle Crashes Other Transport Injuries
Falls Other Injury Events
Natural/Environmental FactorsMisc. Accidents
Legal Intervention Therapeutic Substances
Assaults Self-inflicted Injuries
Intention Unclear
7 20
1 3 00
0 0100
100290
14430000
1400
2 00
11
0 0 0 0000
10000
50500000000
9 2 0 2 4 00
0 0100
10022.5
022.5
440000
1100
16-30 Total All Causes
Motor Vehicle Crashes Other Transport Injuries
Falls Other Injury Events
Natural /Environmental FactorsMisc. Accidents
Legal Intervention Therapeutic Substances
Assaults Self-inflicted Injuries
Intention Unclear
82 34
3 25 12
1 0 0 0511
10041.5
430.5
151000611
2114
02
2 0 0 0 0210
100670
9.59.5
0000
9.54.5
0
10348 3
27 14
10
0 0721
100473
26130000721
31-45 Total All Causes
Motor Vehicle Crashes Other Transport Injuries
Falls Other Injury Events
Natural/Environmental FactorsMisc. Accidents
Legal Intervention Therapeutic Substances
Assaults Self-inflicted Injuries
Intention Unclear
6921 3
31 8 00
02400
100304
45120003600
17843
0 0 0 10010
10047231800060060
86 29
7 34
80 0 12410
100348
4090012510
39
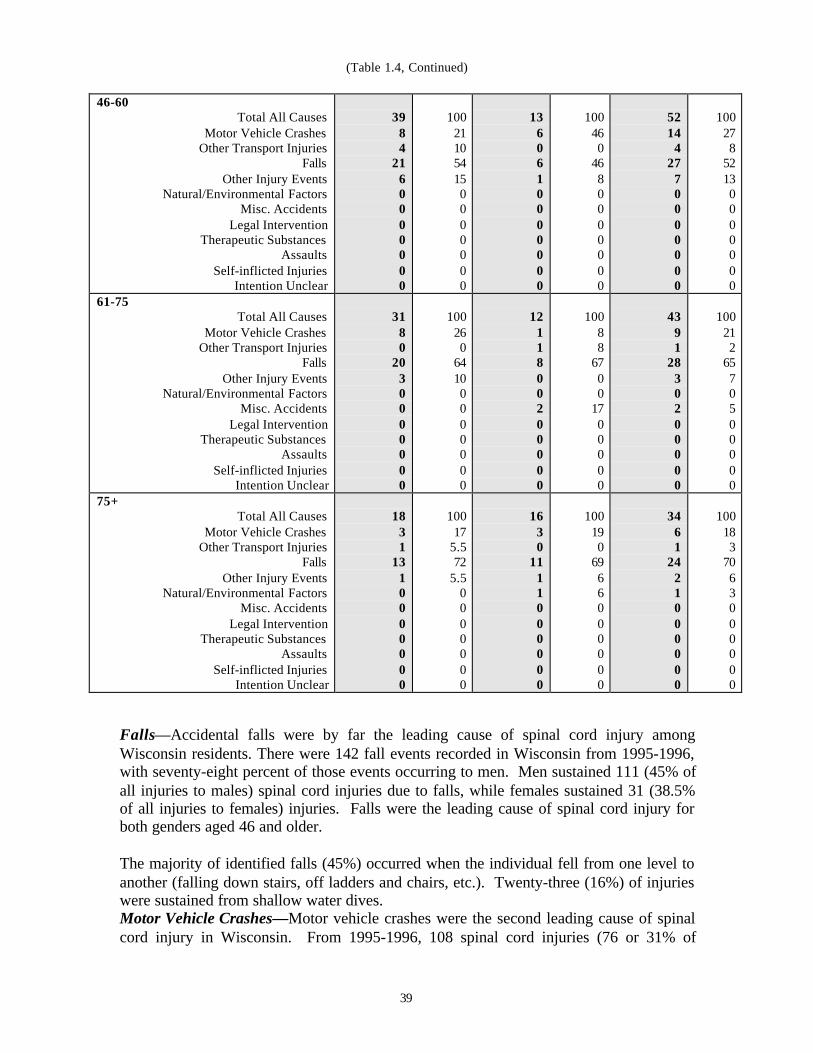
(Table 1.4, Continued)
46-60 Total All Causes
Motor Vehicle Crashes Other Transport Injuries
Falls Other Injury Events
Natural/Environmental FactorsMisc. Accidents
Legal Intervention Therapeutic Substances
Assaults Self-inflicted Injuries
Intention Unclear
39 8 4 21
6 00
0 0000
100211054150000000
13 6 0 6 1 0 0 0 0000
100460
4680000000
52 14 4 27 70
0 0 0000
100278
52130000000
61-75 Total All Causes
Motor Vehicle Crashes Other Transport Injuries
Falls Other Injury Events
Natural/Environmental FactorsMisc. Accidents
Legal Intervention Therapeutic Substances
Assaults Self-inflicted Injuries
Intention Unclear
318
0 20
3 0 0 0 0000
100260
64100000000
121
18
0 0 2 0 0000
10088
6700
1700000
43 91
28 3 02
0 0
000
100212
6570500000
75+ Total All Causes
Motor Vehicle Crashes Other Transport Injuries
Falls Other Injury Events
Natural/Environmental FactorsMisc. Accidents
Legal Intervention Therapeutic Substances
Assaults Self-inflicted Injuries
Intention Unclear
18 3 1
131
0 0 0 0000
10017
5.572
5.50000000
163
011 1 1 0 0 0000
100190
6966000000
34 6
1 24 2 1 0 0 0
000
100183
7063000000
Falls—Accidental falls were by far the leading cause of spinal cord injury amongWisconsin residents. There were 142 fall events recorded in Wisconsin from 1995-1996,with seventy-eight percent of those events occurring to men. Men sustained 111 (45% ofall injuries to males) spinal cord injuries due to falls, while females sustained 31 (38.5%of all injuries to females) injuries. Falls were the leading cause of spinal cord injury forboth genders aged 46 and older.
The majority of identified falls (45%) occurred when the individual fell from one level toanother (falling down stairs, off ladders and chairs, etc.). Twenty-three (16%) of injurieswere sustained from shallow water dives.Motor Vehicle Crashes—Motor vehicle crashes were the second leading cause of spinalcord injury in Wisconsin. From 1995-1996, 108 spinal cord injuries (76 or 31% of
40
injuries to males and 31 or 40% of injuries to females) were sustained in a motor vehiclecrash. Overall, males sustained approximately 2.5 times as many spinal cord injuryevents in motor vehicle crashes as did females. Motor vehicle crashes were the leadingcause of spinal cord injury for males age 16-45 and females age 0-30, and the secondleading cause of injury for persons aged 46 and older.
In the majority of motor vehicle crashes (62%), the driver was the individual to sustainthe spinal cord injury. Six percent of motor vehicle injuries occurred to individuals whileoperating a motorcycle.
Other Injury Events—This was the third leading cause of injury, not related to transportvehicles; including machine injuries, sport injuries, and injuries incurred during medicalprocedures. There were 38 injuries sustained in 1995-1996 due to these events. Malessustained 33 (87%) of these injuries.
Other Transport Injuries—From 1995-1996, other transport injuries were the fourthleading cause of spinal cord injury, with 16 injuries reported. Other transport injuriesinclude injuries from snowmobiles, watercraft, and aircraft, among others. Malessustained 11 (69%) of these other transport-related events.
Intentional Injuries—Intentional injuries were the fifth leading cause of spinal cordinjury. From 1995-1996, there were 15 intentional events resulting in spinal cord injury.Men sustained 11 (73%) of these intentional events. This total includes self-inflictedinjury as well as those inflicted by other persons.
The question of intention is often considered relevant to causation. An injury iscategorized as “intention unknown” when it is unspecified or it cannot be determinedwhether the injuries are accidental (unintentional), suicide (attempted), or assault.
Whether ruled accidental, intentional, or intention unknown, firearms were a recurringcause of spinal cord injury, especially among males. Sixteen firearm injury events werereported, fourteen (87.5%) of these to males.
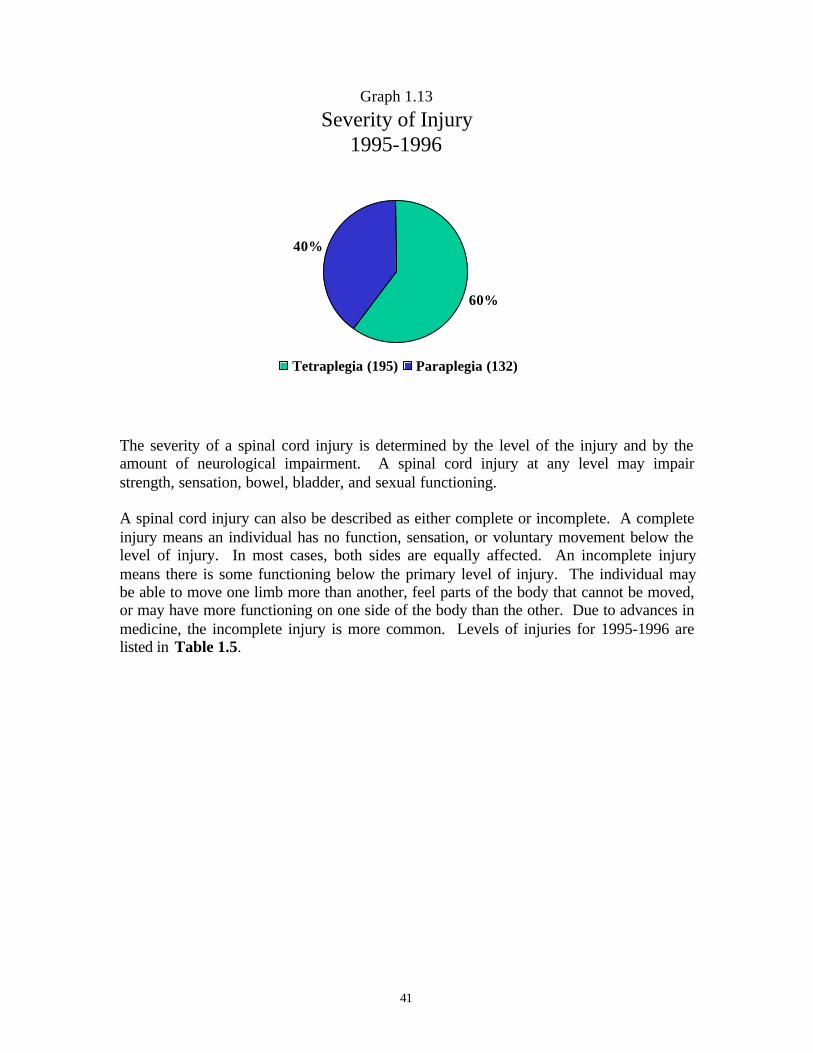
Level and Severity of Injury—There are two categories of spinal cord injuries:paraplegia and tetraplegia. A person is said to have paraplegia when there is a loss offeeling in the lower portion of the body. Tetraplegia is described as loss of movement inboth the upper and lower portions of the body (Maddox, 1993). In the 1995 through 1996data, 60% of the individuals sustained spinal cord injuries resulting in tetraplegia, and40% in paraplegia (Graph 1.13). Men sustained 140 injuries (57%) resulting intetraplegia and 106 injuries (43%) resulting in paraplegia. Women sustained 55 injuries(68%) resulting in tetraplegia and 26 injuries (32%) resulting in paraplegia.
41
Graph 1.13
Severity of Injury1995-1996
60%
40%
Tetraplegia (195) Paraplegia (132)
The severity of a spinal cord injury is determined by the level of the injury and by theamount of neurological impairment. A spinal cord injury at any level may impairstrength, sensation, bowel, bladder, and sexual functioning.
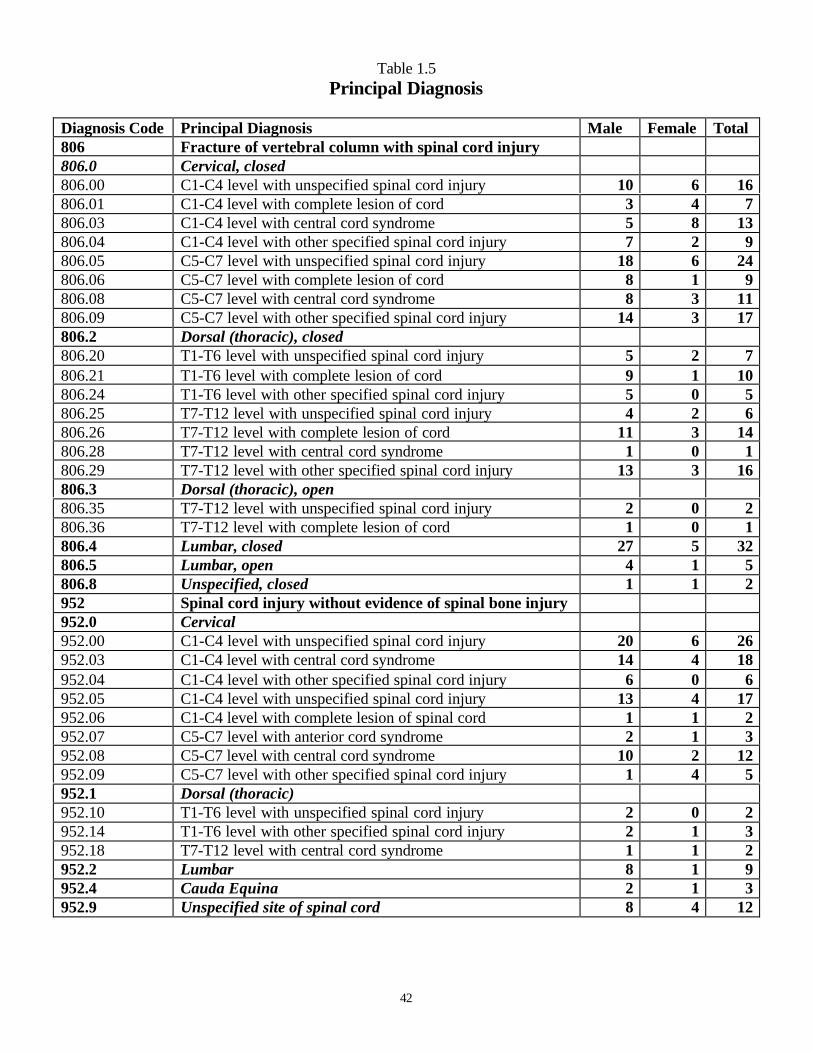
A spinal cord injury can also be described as either complete or incomplete. A completeinjury means an individual has no function, sensation, or voluntary movement below thelevel of injury. In most cases, both sides are equally affected. An incomplete injurymeans there is some functioning below the primary level of injury. The individual maybe able to move one limb more than another, feel parts of the body that cannot be moved,or may have more functioning on one side of the body than the other. Due to advances inmedicine, the incomplete injury is more common. Levels of injuries for 1995-1996 arelisted in Table 1.5.
42
Table 1.5Principal Diagnosis
Diagnosis Code Principal Diagnosis Male Female Total806 Fracture of vertebral column with spinal cord injury806.0 Cervical, closed806.00 C1-C4 level with unspecified spinal cord injury 10 6 16806.01 C1-C4 level with complete lesion of cord 3 4 7806.03 C1-C4 level with central cord syndrome 5 8 13806.04 C1-C4 level with other specified spinal cord injury 7 2 9806.05 C5-C7 level with unspecified spinal cord injury 18 6 24806.06 C5-C7 level with complete lesion of cord 8 1 9806.08 C5-C7 level with central cord syndrome 8 3 11806.09 C5-C7 level with other specified spinal cord injury 14 3 17806.2 Dorsal (thoracic), closed806.20 T1-T6 level with unspecified spinal cord injury 5 2 7806.21 T1-T6 level with complete lesion of cord 9 1 10806.24 T1-T6 level with other specified spinal cord injury 5 0 5806.25 T7-T12 level with unspecified spinal cord injury 4 2 6806.26 T7-T12 level with complete lesion of cord 11 3 14806.28 T7-T12 level with central cord syndrome 1 0 1806.29 T7-T12 level with other specified spinal cord injury 13 3 16806.3 Dorsal (thoracic), open806.35 T7-T12 level with unspecified spinal cord injury 2 0 2806.36 T7-T12 level with complete lesion of cord 1 0 1806.4 Lumbar, closed 27 5 32806.5 Lumbar, open 4 1 5806.8 Unspecified, closed 1 1 2952 Spinal cord injury without evidence of spinal bone injury952.0 Cervical952.00 C1-C4 level with unspecified spinal cord injury 20 6 26952.03 C1-C4 level with central cord syndrome 14 4 18952.04 C1-C4 level with other specified spinal cord injury 6 0 6952.05 C1-C4 level with unspecified spinal cord injury 13 4 17952.06 C1-C4 level with complete lesion of spinal cord 1 1 2952.07 C5-C7 level with anterior cord syndrome 2 1 3952.08 C5-C7 level with central cord syndrome 10 2 12952.09 C5-C7 level with other specified spinal cord injury 1 4 5952.1 Dorsal (thoracic)952.10 T1-T6 level with unspecified spinal cord injury 2 0 2952.14 T1-T6 level with other specified spinal cord injury 2 1 3952.18 T7-T12 level with central cord syndrome 1 1 2952.2 Lumbar 8 1 9952.4 Cauda Equina 2 1 3952.9 Unspecified site of spinal cord 8 4 12
43
Discharge Location
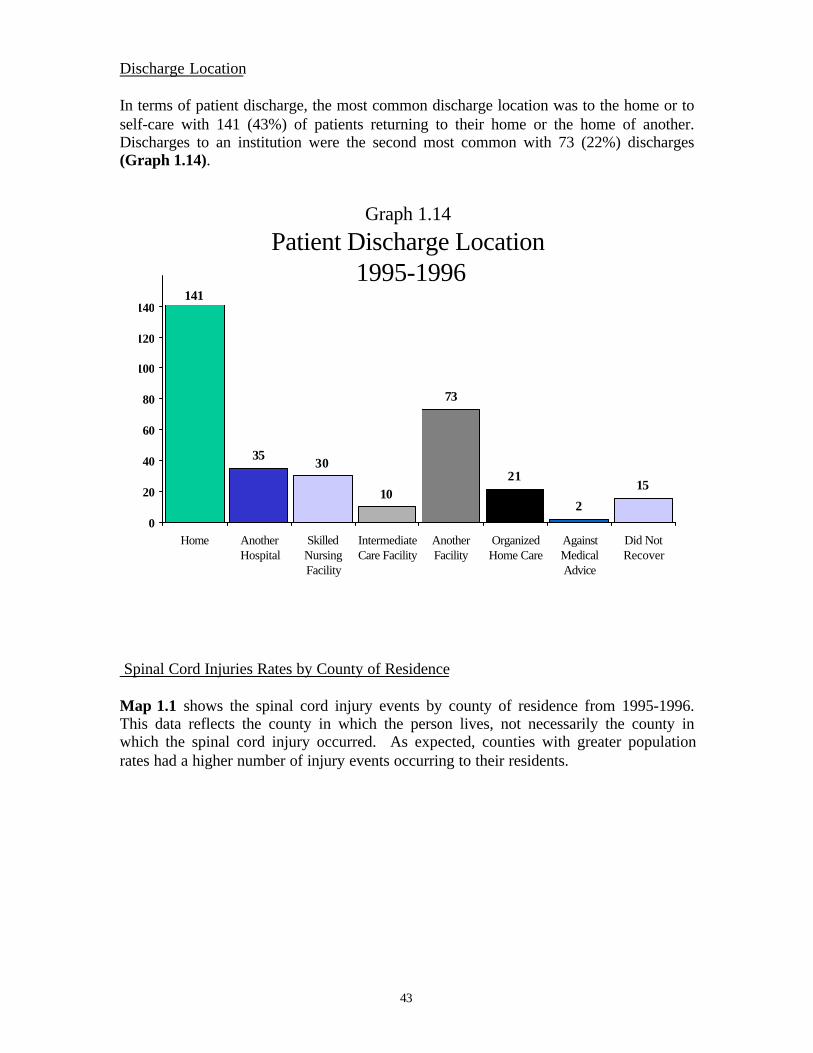
In terms of patient discharge, the most common discharge location was to the home or toself-care with 141 (43%) of patients returning to their home or the home of another.Discharges to an institution were the second most common with 73 (22%) discharges(Graph 1.14).
Graph 1.14
Patient Discharge Location 1995-1996
3530
10
73
21
2
15
141
0
20
40
60
80
100
120
140
Home AnotherHospital
SkilledNursingFacility
IntermediateCare Facility
AnotherFacility
OrganizedHome Care
AgainstMedicalAdvice
Did NotRecover
Spinal Cord Injuries Rates by County of Residence
Map 1.1 shows the spinal cord injury events by county of residence from 1995-1996.This data reflects the county in which the person lives, not necessarily the county inwhich the spinal cord injury occurred. As expected, counties with greater populationrates had a higher number of injury events occurring to their residents.
44
!
$
Washburn
Burnett
DouglasBayfield
Sawyer
AshlandIron
Vilas
OneidaPrice
Polk Barron Rusk
ChippewaSt. Croix Dunn
Taylor
LincolnLanglade
Forest Florence
Marinette
Oconto
ClarkMarathon
Shawano
Wood Portage Waupaca
Menominee
Door
Kewaunee
Brown
Pierce
Pepin
Buffalo Tremp-ealeau
Eau Claire
La Crosse
MonroeJuneau
Adams
Waushara
Outagamie
Manitowoc
Sheboygan
SaukVernon
CrawfordRichland
Grant
Iowa
LafayetteGreen Rock Walworth
Kenosha
Racine
Washington
Ozaukee
Columbia
DaneJefferson
Dodge
Waukesha Milwaukee
Fond du LacMarquette
Green-Lake
Winnebago Calu-met
Jackson
1 1
0
03 0
0 5
3
1
09
2
02
1
7
2
10
2
2
2
21 5
6
18
5 9 9
0
0
4 7
1
11
8
2 4
0
3
6
7
9
0
2
4
22
0
6
3
6
21
33
2
3
0 0
0
0
1
5
62
1
1 3 106
20
7
Map 1.1Spinal Cord Injuries by
County of Residence, 1995-1996
45
Table 1.6Injuries by Year and County of Residence for 1995-1996 County 1995 1996 Totals
01 Adams 3 302 Ashland 003 Barron 3 2 504 Bayfield 1 105 Brown 4 7 1106 Buffalo 007 Burnett 008 Calumet 1 0 109 Chippewa 2 1 310 Clark 1 1 211 Columbia 6 3 912 Crawford 1 1 213 Dane 11 10 2114 Dodge 7 2 915 Door 2 2 416 Douglas 1 117 Dunn 1 118 Eau Claire 5 4 919 Florence 020 Fond Du Lac 3 1 421 Forest 3 322 Grant 1 123 Green 1 2 324 Green Lake 025 Iowa 1 1 226 Iron 027 Jackson 1 128 Jefferson 1 4 529 Juneau 030 Kenosha 4 3 731 Kewaunee 1 1 232 LaCrosse 5 2 733 Lafayette 1 134 Langlade 2 235 Lincoln 2 1 336 Manitowoc 037 Marathon 4 2 638 Marinette 3 3 639 Marquette 040 Menominee 1 1 241 Milwaukee 39 23 6242 Monroe 1 1
HOSPITAL CITY COUNTYLanglade Memorial Hospital Antigo LangladeAppleton Medical Center Appleton OutagamieSt. Elizabeth Hospital Appleton OutagamieMemorial Medical Center Ashland AshlandBeaver Dam Community Hospitals, Inc. Beaver Dam DodgeSt. Joseph’s Hospital Chippewa Falls ChippewaLuther Hospital Eau Claire Eau ClaireSacred Heart Hospital Eau Claire Eau ClaireSt. Agnes Hospital Fond Du Lac Fond Du LacBellin Memorial Hospital Green Bay BrownSt. Vincent Hospital Green Bay BrownMercy Health System Corporation Janesville RockKenosha Hospital and Medical Center Kenosha KenoshaSt. Catherine’s Hospital, Inc. Kenosha KenoshaLutheran Hospital – La Crosse La Crosse La CrosseMeriter Hospital, Inc. Madison DaneSt. Mary’s Hospital Medical Center Madison DaneUniversity of Wisconsin Hospital and Clinics Madison DaneSaint Joseph’s Hospital Marshfield WoodCommunity Memorial Hospital Menomonee Falls WaukeshaChildren’s Hospital of Wisconsin Milwaukee MilwaukeeColumbia Hospital, Inc. Milwaukee MilwaukeeFroedtert Memorial Lutheran Hospital Milwaukee MilwaukeeSacred Heart Rehabilitation Institute Milwaukee MilwaukeeSt. Francis Hospital Milwaukee MilwaukeeSt. Joseph’s Hospital – Milwaukee Milwaukee MilwaukeeSt. Luke’s Medical Center Milwaukee MilwaukeeSt . Michael Hospital Milwaukee MilwaukeeTheda Clark Medical Center Neenah WinnebagoMercy Medical Center Oshkosh WinnebagoSaint Mary’s Medical Center Racine RacineSpooner Community Memorial Hospital, Inc Spooner WashburnSt. Mary’s Hospital of Superior Superior DouglasWaukesha Memorial Hospital, Inc. Waukesha WaukeshaWausau Hospital Wausau MarathonJohn L. Doyle Hospital Wauwatosa MilwaukeeWest Allis Memorial Hospital West Allis MilwaukeeSt. Joseph’s Community Hospital West Bend WashingtonSinai Samaritan Medical Center Milwaukee MilwaukeeMidwest Rehabilitation Hospital Waterford Racine
50
Table 1.8
E-Codes
E-code Description Male Female Total8120 Traffic accidents with motor vehicle, driver 19 7 268121 Traffic accidents with motor vehicle, passenger 5 3 88122 Traffic accidents with motor vehicle, motorcyclist 1 0 18129 Traffic accidents with motor vehicle, unspecified person 1 0 18130 Motor vehicle with other vehicle, driver 0 1 18136 Motor vehicle with other vehicle, pedal cyclist 1 0 18147 Motor vehicle collision with pedestrian, pedestrian 1 1 28150 Collision on highway accident, driver 2 0 28151 Collision on highway accident, passenger 2 1 38160 Motor vehicle-loss of control, driver 18 10 288161 Motor vehicle-loss of control, passenger 9 5 148162 Motor vehicle-loss of control, motorcyclist 3 0 38163 Motor vehicle-loss of control, passenger on motorcycle 1 0 18169 Motor vehicle-loss of control, unspecified person 1 0 18170 Non-collision motor vehicle, while boarding 1 0 18180 Non-collision motor vehicle, driver 1 1 28181 Non-collision motor vehicle, passenger 3 0 38190 Unspecified motor vehicle accident, driver 2 0 28191 Unspecified motor vehicle accident, passenger 3 1 48192 Unspecified motor vehicle accident, motorcyclist 1 0 18197 Unspecified motor vehicle accident, pedestrian 0 1 18199 Unspecified motor vehicle accident, unspecified person 1 1 28200 Non-traffic accident (snow vehicle), driver 2 0 28210 Off-road motor vehicle, driver 1 0 18211 Off-road motor vehicle, passenger 1 0 18212 Off-road motor vehicle, motorcyclist 1 0 18232 Collision with stationary object, passenger 1 0 18259 Unspecified motor vehicle, unspecified person 3 0 38273 Animal-drawn vehicle accident, passenger 0 1 18282 Animal being driven, rider of animal 1 2 38321 Submersion or drowning in water transport, occupant of
small boat1 0 1
8354 Unspecified fall in water transport, water skier 0 1 18449 Other air transport accidents, other person 0 1 18784 Surgical Ops & Procedures, restorative surgery 1 0 18788 Surgical Ops & Procedures, other specified 1 1 28809 Fall from stairs or steps, other stairs or steps 9 5 148810 Fall from ladder 13 0 138811 Fall from scaffolding 3 0 3882 Fall from or out of building 8 1 98830 Accident from diving or jumping into water 19 4 238839 Fall into other hole or other opening in surface 1 0 1
51
8841 Fall from cliff 1 0 18842 Fall from chair 6 0 68844 Fall from bed 2 0 28849 Fall from one level to another 18 0 18885 Fall from same level, slip, trip, or stumble 17 10 278860 Fall on same level, collision, pushing, or shoving, in
sports1 1 2
888 Other & unspecified fall 13 10 239068 Other injury caused by animals 1 0 1912 Inhalation and ingestion of other object 0 1 1915 Foreign body accidentally entering other orifice 0 1 1916 Struck by falling object 7 0 79170 Struck by objects or persons – in sports 6 0 69179 Struck by objects or persons – other 5 1 69190 Machinery accident, agricultural machine 1 0 19192 Machinery accident, lifting machine & appliances 2 0 29220 Accident caused by firearm, handgun 1 0 19229 Accident caused by firearm, unspecified firearm 4 0 4927 Overexertion and strenuous movements 2 2 49289 Environmental & accident causes, unspecified accident 3 1 49342 Agents primarily affecting blood constituents,
anticoagulants1 0 1
9352 Analgesics, antipyretics, and antirheurmatics, otheropiates and related narcotics
0 1 1
9379 Sedatives & hypnotics , unspecified 1 0 19571 Suicide/self-inflicted injury, jumping from high place,
other man-made structure1 1 2
9572 Suicide/self-inflicted injury, jumping from high place,natural site
0 1 1
9600 Fight/ brawl/ rape, unarmed fight or brawl 2 1 39650 Assault by firearms, handgun 1 1 29654 Assault by firearms, other & unspecified firearms 7 0 7970 Injury due to legal intervention, by firearm 0 1 19850 Intention unknown accident, handgun 1 0 1
52
53
v
Appendix 1.2:Spinal Cord Injuries by Year, 1995—1996
LEVEL OF SEVERITYTetraplegia 140 55 195Paraplegia 106 26 132
PATIENT DISCHARGE LOCATIONDischarged to home or self-care 108 33 141
Discharged or transferred toanother short-term general hospital
23 12 35
Discharged or transferred toa skilled nursing facility
17 13 30
Discharged or transferred toan intermediate care facility
6 4 10
Discharged or transferred toanother type of institution
63 10 73
Discharged or transferred tohome under care of organized health service
17 4 21
Left against medical advice 2 0 2Expired or did not recover 10 5 15
61
Conclusions
The establishment of this statewide registry and surveillance program was necessary todocument factors and demographics associated with the population of individuals thatsustains spinal cord injuries. We believe that the data presented in this second historicalreport clearly indicates the major etiologies of injury, the disproportionate injuriessustained by certain race, age and gender groups, and the cost of these injuries. In thefuture, we hope to explore the data further to identify the location of injury, the time andthe factors surrounding the injuries, and other determinants that are crucial for injuryprevention.
62
63
References
Maddox, S. (1993). Spinal network (2nd ed.). Boulder, CO: Library of CongressCataloging in Publication Data.
National Safety Council (1989). Accident facts: 1988 Edition.
National Spinal Cord Injury Statistical Center (1998). Spinal cord injury: Facts andfigures at a glance. Birmingham, AL: The University of Alabama at Birmingham.
Johnson, R.L., Gabella, B.A., Gerhart, K.A., McCray, J., Menconi, J.C., & Whiteneck,G.G. (1997). “Evaluating sources of traumatic spinal cord injury surveillance datain Colorado.” American Journal of Epidemiology, 146(3), 266-272.
All population estimates
Wisconsin Department of Administration (1998). Madison, WI: Demographic ServicesCenter.