Tunable diode laser absorption spectroscopy (TD-LAS) is a recognized monitoring technique for atmo-spheric tracer and active species, because of itsspecificity, sensitivity, and the wide range of constit-uents that can be measured. Several instruments us-ing diode lasers have been developed for thatpurpose: onboard balloons,1–4 aircraft,5–7 and rock-ets.8 For most molecular species exhibiting line ab-sorption spectra, the concentration is obtainedthrough direct absorption or through frequency mod-ulation. The amplitude of the absorption signal isdependent on the concentration, the line strength,and the optical path according to the Beer–Lambertlaw. The most abundant absorbing species in the at-mosphere �H2O, O3, CH4, N2O) can be measured with
a short absorption path of several meters, requiringno multipass cell (or at least a short one). To detectless abundant species (CO, NO, NO2, HCl, HNO3),absorption paths of several tens of meters are neces-sary; hence the use of multipass cells. To reach stilllower concentration species �COF2, H2O2, HOCl,CH3Cl, C2H6, SO2, ClO, H2CO, OCS, OH, HO2, etc.),an absorption path of several hundred meters is re-quired. An example of instrument design for multi-species monitoring, with several hundred meters ofabsorption path, is the optical setup of the balloon-borne Balloonborne Laser In Situ Sensor (BLISS)instrument,3 in which a number of laser beams arereflected by a cube corner suspended several hundredmeters below the instrument. The advantage in thisinstrumental design is that, in addition to a fairlystrong absorption, there is a limited influence of gon-dola degassing, although at the expense of verticalresolution.
SPIRALE (a French acronym for infrared absorp-tion spectroscopy by tunable diode lasers) is designedas a stratospheric balloonborne in situ instrument,which aims to monitor several species simulta-neously, with high spatial and temporal resolutions.The scientific objectives assigned to SPIRALE coverthe measurement of the tracers �CH4, N2O, CO,COF2, etc.) and the chemistry of ozone and active andreservoir species (NO, NO2, HNO3, HCl, H2O2, etc.),especially in the lower stratosphere, where some sci-
G. Moreau, C. Robert, V. Catoire ([email protected]),M. Chartier, N. Huret, M. Pirre, L. Pomathiod, and G. Chalumeauare with the Laboratoire de Physique et Chimie de l’Environnement(LPCE), Unité Mixte Recherche 6115, CNRS-Université d’Orléans,3A Avenue de la Recherche Scientifique, 45071 Orléans Cedex 2,France. C. Camy-Peyret is with the Laboratoire de PhysiqueMoléculaire pour l’Atmosphere et l’Astrophysique (LPMAA), Uni-versité Pierre et Marie Curie, 75252 Paris Cedex 05, France.
Received 2 November 2004; revised manuscript received 7March 2005; accepted 7 March 2005.
entific questions are still open. The partitioningwithin the different families �NOy, Cly, HOx) can thenbe established for constraining photochemical mod-els. New insights are expected concerning fine verti-cal structures in the stratosphere, which have not yetreceived much attention, particularly when severalactive species are measured simultaneously, as canbe done with SPIRALE.
Several experimental characteristics were speci-fied to reach the scientific objectives assigned toSPIRALE: (i) A long absorption path ��300 m� asso-ciated with a multipass cell. (ii) A spectral domaincovering wavelengths greater than 2 �m, where linestrengths of most of the species are the strongest.Practically, the use of available lead salt diode lasersat a liquid-nitrogen temperature limits the wave-length coverage from 3 to 12 �m. (iii) A good mechan-ical and thermal stability. Since the stability of thelaser beam position is a key parameter for the signal-to-noise ratio, in the strongly changing environmen-tal conditions of a balloon flight (air temperature andpressure, thermal radiation), the laser beam steeringoptics must be mounted on a mechanical structurethat is as stable as possible. With the present state-of-the-art techniques, the use of carbon fibers for themechanical structure is a suitable solution, with highstiffness and a low thermal expansion coefficient. (iv)A direct absorption technique that can reach the bestsensitivity. Laboratory measurements reach absorp-tion detection limits of the order of 10�5 using 16-bitanalog–digital converters with 1 s integration time.Spectra are obtained by averaging a few hundredspectra scanned during this period. A lower absorp-tion limit in the range of 10�6 can be reached by usingfrequency modulation, but shot noise may increasethis value for low-power lasers. In most experimentswith TDLAS, and particularly in field experiments,interference fringes resulting from the coherent char-acter of the laser radiation cause deterioration in thedetection limit.9 Direct absorption is chosen in SPI-RALE, because of the complexity of the frequencymodulation techniques in harsh environments. (v) Ameasurement rate of 1 Hz to characterize small ver-tical scale structures in the atmosphere. Noise reduc-tion is possible to reach a lower detection limitthrough the averaging of several 1 s spectra, but atthe expense of vertical resolution, except in slowlyvarying balloon altitude conditions; (vi) A low degas-sing of the gondola that otherwise may bias the mea-sured concentrations. Since the absorption volume inSPIRALE is largely open thanks to a deployablemast, it should be possible to reduce potential con-tamination effects so that SPIRALE can work any-time (daytime and nighttime) at low or at highaltitudes.
In this paper instrumental and technical aspects ofthe balloonborne SPIRALE instrument are reported.After the description of the experimental method inSection 2, details of the SPIRALE optics, mechanics,and electronics are given in Section 3. Then the signalprocessing and the concentration retrieval method
are presented in Section 4. Some of the results of thefirst three successful flights of the SPIRALE areshown and the SPIRALE performances are demon-strated in Section 5. These flights took place in Gap(France) on 20 June 2001; Aire-sur-l’Adour (France)on 2 October 2002, and Kiruna (Sweden) on 21 Jan-uary 2003.
2. Experimental Method
A. Absorption Spectroscopy
In tunable laser spectroscopy, a quasi-monochromaticlaser beam scans a small spectral region, also knownas a microwindow, containing the absorption line ofinterest. In the application of the Beer–Lambert lawfor monochromatic light, the transmitted light inten-sity of the laser beam at a given wavenumber � pass-ing through a cell containing the gas is
I��� � I0���exp������nL�, (1)
where I0��� and I��� are the incident and transmittedintensities, respectively, L is the absorption pathlength (in cm), n is the number density (in moleculescm�3) of the absorbing species, and ���� is the wave-number-dependent absorption cross section of thespecies �in cm�2 molecule�1�. The diode laser wavenumber � is set by adjusting the diode laser temper-ature Td and injection current i0. The analyzed spec-tral domain is then scanned by sweeping the injectioncurrent around i0 with an amplitude �i in an asym-metric sawtooth pattern consisting of a long positiveslope ramp followed by a shorter negative one. As aresult the instantaneous wavenumber of the laseremission evolves according to the drive current. Inexisting tunable diode spectroscopy instruments, thesweep or ramp frequency fr spans from �1 Hz toseveral hundred hertz. In SPIRALE, fr is set to�200 Hz, a compromise between effective filtering oflow-frequency noise and a fairly linear wavenumbervariation versus time. Linearity on the spectral scaleis not absolutely required, but a strong nonlinearityis an additional source of error. Signal scans are co-added during approximately 1 s. To ensure that thespectral domain does not drift while averaging over1 s, the laser temperature is stabilized at the 10�4 Klevel over this typical time scale. A part of the laserbeam is diverted onto a reference cell, which providesreference lines.
The absorption cross section ���� for a given linecentered at �0 is expressed as
���� � ST��0� � gVoigt��� with
gVoigt��� � gL��� � gD���, (2)
where the symbol R represents a convolution prod-uct. In these expressions gVoigt��� is the Voigt profileinvolving the standard Doppler and Lorentz line pro-files and gD��� is the Doppler profile, depending ontemperature only and given by the normalized
where D � 3.581 � 10�7 �0�T�M is the Doppler half-width at half-maximum (HWHM) with T the temper-ature (in K) and M the molar mass (in g).
gL��� is the Lorentz profile due to molecular colli-sions and involves the pressure-broadening coeffi-cient, a function of both pressure and temperature.The normalized Lorentz profile is given by
gL��� �L
1
��� � �0�2 � L2�
, (4)
where L � air�P�P0��Tref�T�NL is the Lorentz HWHM,with air defined as the pressure-broadening coeffi-cient of air at Tref � 296 K and P0 � 1 atm; P and Tare the effective atmospheric pressure and tempera-ture, respectively. Kinetic theory gives NL � 0.5, buteffective observational values of NL range from 0.5 toapproximately 1, depending on the constituent andon the buffer gas (air in the present case).
ST is the line strength (or integrated absorptioncoefficient), a function of temperature, as it includesthe partition function and the Boltzmann factor:
ST � STref
QTref
QTexp � �E�
k �1T �
1Tref
� , (5)
where QT and QTrefare the partition functions for
temperatures T and Tref, respectively, E� is the energyof the lower level of the transition; k is the Boltzmannconstant, and STref
is the line strength at temperatureTref. For most of the constituents, the ratio of thepartition functions reduces to the ratio of therotational partition functions, with QT
rot�QTref
rot
� �T�Tref�1 for linear molecules and QTrot�QTref
rot
� �T�Tref�3�2 for nonlinear molecules. The vibrationalpartition function has a smaller impact in general. Ithas been used only in the case of the lowest vibrationwavenumber ��460 cm�1� of HNO3.
In addition the absorption spectrum is convolutedwith the laser emission profile according to
I��� � I0���exp������nL� � gl���, (6)
where gl��� represents the normalized profile of thelaser, which can be described by either Gaussian orLorentzian profiles.
The HITRAN database10 provides information onthe spectroscopic parameters needed for calculatingsynthetic spectra: STref
, NL, air, and E�. All these pa-rameters do not always have the required reliabilityfor high-precision measurements in the range ofpressure and temperature that are encountered inthe stratosphere. This lack of reliability points outthe difficulty of calculating synthetic spectra and the
need to adjust some of the spectroscopic parametersin the concentration retrieval process.
Six measurement channels are installed onboardthe present configuration of the SPIRALE instru-ment. Each channel is composed of the same opticalelements. Figure 1 represents the optical path for onechannel. The only element common to all six channelsis the multipass cell. For the first flight of the SPI-RALE reported in this paper, only three channelswere installed; the instrument was fully equipped forthe subsequent flights. The instrument is operatingwith the available channels functioning simulta-neously in the multispecies operational mode.
B. Laser Emission and Line Selection
Several aspects must be taken into account to selectabsorption lines. The first aspect is related to thematching of diode laser modes with molecular lines.Commercially available diode lasers usually emitmultimodes in the middle infrared (from 3 �m andbeyond). A dispersive element consisting of a gratingand a detector acting as a selection slit is then re-quired to separate the specified mode, keeping inmind that the power of the mode must be fairly high(�50 �W) and the laser noise must be as low as pos-sible. Mode selection is realized by adjusting the di-ode laser temperature Td and injection current i0 soas to minimize diode laser noise and diode laser fre-quency bandwidth and to maximize beam intensity.The second aspect deals with the molecular lines.Since the absorption multipass cell is common to alllaser beams, with the same path length, absorptionmust not lead to saturation for high-concentrationspecies such as CO2, O3, or H2O, and at the same timelead to strong enough lines for low-concentration spe-cies such as NO, NO2, HNO3, or H2O2. Lines of weakabsorption bands must be selected for the former,whereas lines of the strong absorption bands of thelatter should be chosen, covering mixing ratios from afew parts per trillion in volume (pptv) to a few hun-dreds parts per million in volume (ppmv), i.e., a rangeof eight decades. Moreover, the temperature depen-dence of the absorption cross sections must be smallto minimize uncertainties as the temperature maychange from �80 °C to �10 °C in the stratosphere.
Experimental microwindows have a width rangingfrom 0.4 to 0.6 cm�1 to cover several well-resolvedabsorption lines at low pressure. In some cases thiswidth is not large enough to cover the full line shape
Fig. 1. Schematics of optics for one channel. Only the Herriottmultipass cell is common to the six channels, with the same ab-sorption length for all beams.
at the lower levels ��250 hPa, below 10 km altitude).Diode lasers are specifically purchased for the detec-tion of selected species. However, a careful examina-tion of the possible microwindows is necessary tochoose the best mode for a single species and alsomakes possible the measurement of several species inthe same microwindow. For diode lasers coveringspectral regions where many species are absorbing,several modes can be considered. This is the case forthe region 1230–1320 cm�1, where N2O, CH4, HNO3,COF2, HOCl, H2O2, CO2, and H2O can be detected bythe available diode laser 3. Table 1 lists the centralwavenumber �0 and the spectral ranges �� selectedfor each diode laser in the three flights. Most of themicrowindows are able to detect at least two species,except for diode laser 2 (HCl alone). For flight oper-ations, laser settings are adjusted just before launchfor the whole ascent. When the instrument arrives atfloat, some laser settings can be changed according toscientific objectives. The change of the central wave-number and of the spectral width is coupled to agrating rotation of the appropriate angle. Laser set-ting changes are not performed often during flight,because the time necessary for the precise adjust-ment of a diode laser may take several minutes, re-sulting in a loss of data.
C. Detection and Acquisition
Reference beams and measurement beams are de-tected with liquid-nitrogen-cooled detectors, whichproduce electric signals in the photovoltaic mode.Detectors are made of InSb for wavenumbersgreater than 1800 cm�1 �5.5 �m�, and HgCdTe forwavenumbers lower than 1800 cm�1. The detector-sensitive area is circular �500 �m diameter). Possi-ble detector nonlinearity is avoided by thefollowing: (i) a judicious choice of detectors, (ii) asuitable laser power, and (iii) a small defocusing toenlarge somewhat the laser spot while keeping upthe laser mode separation, since the 500 �m diam-eter detector behaves as a monochromator exit slit.The signal is first amplified, with a gain adjusted(but fixed) on the ground prior to flight, and ampli-fied in a second step with an automatically self-adjusted gain. To use the whole range of the 16-bitconverter for detecting a minimum signal of 1�216,i.e., �1.5 � 10�5 in absorption, and to prevent slowdrifts of the signal during the flight, its amplitude ismonitored and the gain is automatically adjusted.Since the signal-to-noise ratio is mostly dependenton the laser noise, great care has been taken toreduce the other sources of noise: detectors, ampli-fiers, and analog–digital converters (ADC). Theparasitic effect of the diode laser driving currentonto the detected signals has been reduced to anegligible value, mainly through proper grounding.Detected signals have components from continuousto 200 kHz (the ADC frequency), and include detec-tor dark current (more appropriately, zero offset orbackground when no laser is present). Contributionfrom the dark current must be removed before the
concentration retrieval, and therefore must be mea-sured. This removal is performed by switching offthe diode laser for �1 ms, a time short enough toreduce the impact on the diode laser temperature.Dark current is subtracted from the signal duringdata processing. It is observed that dark currentevolves slowly with time, in relation to the gondolainner temperature, which affects the thermal radi-ation on the detectors. Amplifier offsets also con-tribute to these drifts. Figure 2 presents theschematics of the detection chain. The diode lasercurrent frequency, or ramp frequency, is set to fr
� 200 Hz. Measurement and reference sweeps areprocessed sequentially onboard. Since the most in-teresting information lies in the atmospheric sig-nal, 198 spectra are converted and averaged,followed by averaging a smaller number (10) of ref-erence spectra. It takes exactly 1.100 s for dataprocessing plus the time necessary to format andtransmit them to the ground. Each transmittedpacket is composed of 1024 data points. All data arerecorded onboard for redundancy. There is no aver-aging in the step of dark current monitoring (every8 s). Only the atmospheric and reference spectra aretransmitted for the cycle when the diode laser isswitched off. However, it should be noted that rampfrequencies for the different diodes are close, butnot equal to fr � 200 Hz. This is a deliberate choiceto minimize interchannel cross talk whatever theirorigin, i.e., optical (stray light) or electronic (com-mon mode). This precaution proved to be unneces-sary, since stray light from channel to channel isnot observed, and since the only negligible elec-tronic cross talk occurs at the turnaround of thediode laser current, i.e., during the time of the neg-ative slope.
Fig. 2. Schematics of the detection principle of SPIRALE. Thediode laser beam is split into a reference beam and a measurementbeam. In normal operation, the measurement signal and referencesignal are sequentially recorded. While the diode laser ramp fre-quency is set to �200 Hz, the measurement signal is the averageof 198 successive signal sweeps, followed by the reference signal,which is the average of 10 successive signal sweeps, giving a spe-cies sampling period of 1.1 s. The resulting reference and measure-ment signal sweeps are recorded onboard and transmitted bytelemetry. Every eight periods, the diode laser current is set to zeroat the end of the first ramp during �1 ms to monitor the signalbackground continuous component, namely, the detector dark cur-rent. Then only the first sweep of each beam is recorded withoutfurther processing onboard.
The signals (average in a 1.1 s cycle) are displayedon computer screens in real time. By checking oper-ational data (noise level, absorption, line center drift,and signal intensity change), new instrumental set-tings can be programmed and transmitted to the gon-dola through a telecommand (TC). Instrument timeconstants are, however, of several minutes, whichleaves a long enough time to set a new command andobtain a response (about 10 s). Real-time manage-ment of the instrument settings requires prompt in-tervention, especially during ascent, when thethermal balance of the gondola is changing drasti-cally whether it is daytime or nighttime.
In practice, line absorption as small as 10�4 can bevisualized every second, but averaging several cyclestaken over a longer period of time can allow visual-ization of even lower values, down to 10�5 in the bestcase.
D. Optical Fringe Amplitude Reduction
As mentioned previously, fringes are often presentin the spectra, especially for highly coherent lasers.They are usually due to interferences between thediode laser and the scattered light from the mirrorsor windows nearest to the laser head. A relativefringe amplitude of 10�4 or more is often observed,which may be acceptable when absorption is high,but is unacceptable when absorption is weak andthe fringe spacing is of the order of the molecularlinewidth. Methods to remove fringes fall into fourcategories11: (i) dithering of fringe spacing, (ii) suit-able electronic modulation schemes, (iii) back-ground subtraction, and (iv) postdetection signalprocessing. In SPIRALE, fringe suppression usingmethods (i) and (iv) can be applied. First we haveimplemented a proven method12 on SPIRALE thatconsists of translating (with a mechanical modula-tion) the flat mirror nearest to the laser head whileaveraging signal sweeps simultaneously. Althoughthis method can be efficient (a 20-fold decrease infringe amplitude), this reduction is never complete.The postdetection method involves Fourier trans-form or numerical filtering through z transforms. Inaddition, simpler solutions are possible, which con-sist of adding the signal to the signal itself shiftedby half of a period.11 This numerical method is typ-ically a convolution. We have adapted this numer-ical scheme to SPIRALE, with the symmetricnormalized function shown in Fig. 3, whose widthor spacing is p (in point numbers). The effect on thesignal is straightforward; the sinuslike fringes ofperiod or spacing p, p�3, p�5, . . . , are completelyeliminated. The main advantage of this filteringmethod is that it can cope with the changing am-plitude of the fringes and with a small change of thefringe spacing along the spectral scan. As the resultof the convolution, the amplitude of the absorptionpeaks is reduced and their width is increased, but inthe case of SPIRALE, the advantages of the methodcompensate for its drawbacks.
3. SPIRALE Instrument and Payload
A. SPIRALE Payload
A picture of the gondola is shown in Fig. 4. The SPI-RALE instrument is protected in a mechanical framewith 12 metal-wire shock absorbers. The shock ab-sorbers prevent the strains on the frame from beingtransmitted to the instrument and avoid distortionsthat would alter the optical alignment. At landing,they also act as secondary shock absorbers; the mainshock absorbers being flat metal ribbons at the baseof the payload. During flight the lower mirror of theHerriott cell is deployed down to a predefined posi-tion, allowing a given absorption path length (seeSubsection 3.B). Because of their shape, thermal andchemical disturbances due to the lower shock absorb-ers can be considered negligible.
Two temperature probes made of resistive plati-num wire are deployed during the flight at the ex-tremities of two 2.5 m long masts. The two probes arelocated at the opposite sides of the principal axis ofthe sampling volume, since with this geometric con-figuration, at least one probe is thermally undis-turbed by the wake of the gondola, while the secondmay be in the wake most of the time. The differentialwind shear between the balloon and the gondolaflushes air efficiently within the sampling volume.The accuracy of the air temperature is estimated tobe �0.5 °C, i.e., quite high compared to the intrinsicprecision of the probe itself, �0.05 °C. This is due to
Fig. 3. Effect on the signal of sinuslike fringe reduction (fullcurve) and second derivative (dashed curve). The resulting atten-uation is in dB versus the period in point numbers. The respectiveconvolution functions are sketched above with widths p and m.Efficient fringe reduction takes place for periods p, p�3, p�5, p�7,etc., while the second derivative removes periods m�2, m�3, m�4,etc. Function widths p and m are set to 30 and 60, respectively, forillustration.
the difficulty in accounting for the thermal influenceof the wire holder and of radiative effects.
The gondola is equipped with one global position-ing system (GPS) providing absolute altitude. Theaccuracy of the altitude is about 30 m. However, finevertical movements are deduced from two pressuregauges recording air pressure at �1 s intervals. Ahigh-precision gauge (Sensotec) for the 0–1034 hPa�0–15 psi� range is used at low altitude, whereas aCrouzet barometer for the 0–100 hPa range is used at
high altitude. Before each flight, each pressure gaugeis calibrated in a vacuum chamber fitted with tworeference pressure gauges (MKS high-accuracy bara-tron). During the flight, they are temperature regu-lated (about 35 °C) to allow for operating in the sameconditions as those of calibration, avoiding potentialdrift. The precision of the pressure is �0.003 hPa, avariation equivalent to 3.6 m elevation at 35 km al-titude and 0.35 m at 20 km. The pressure accuracy issomewhat larger, i.e., about 0.5 hPa at 200 hPa and0.1 hPa at 5 hPa.
The telemetry (TM) and the telecommand (TC)modules are located inside the instrument. The TMrate is 409.6 kbits�s and the TC is at 9600 bauds.Receiving and transmitting antennas are visible atthe bottom of the payload in Fig. 4. Figure 5 is avertical cross section of the instrument, displayingthe location and function of the different elements:mechanical frame, Dewars and beam steering optics,electronics, Herriott multipass cell, deployable lowermirror, and batteries.
B. Multipass Absorption Cell and Optical Design
The optical layout of SPIRALE is presented in Fig. 6with a ray traced for one of the six laser beams. Eachlead salt diode laser is mounted inside a Dewar on asmall mechanical support with insulating materialon one side and connected to a liquid-nitrogen tankwith copper strips on the other side. The number of
Fig. 4. Photograph of the gondola. The instrument forms the coreof the gondola bolted to the outer mechanical frame thanks to 12metal-wire shock absorbers. The two mirrors of the Herriott mul-tipass cell are contained in two boxes in the bottom, in the re-tracted position. The lower mirror is at the extremity of the mastwhose upper part and the lifting motor appear at the top of thegondola. Two temperature probes at the extremities of masts (onlyone is visible) monitor the temperature on the opposite side of thegondola, leaving at least one probe thermally unspoiled by thewake of the gondola. Landing is expected to occur without damage,distorting only the metal ribbons. The white vertical rods at thebottom are the antennas. The white sun protective coat makes aneffective thermal insulation. Size: height, 4 m; width, 1.7 m.
Fig. 5. Sketch of the instrument SPIRALE (vertical cross section)showing the location of the different parts. Four hexagonal carbonfiber boards tightly bolted with carbon fiber spacers form a rigidstructure that fulfills the requirement of optical stability. Whendeployed, the telescopic mast, made of two beams engaged one intothe other, lies on the second board. Otherwise, it lies on the fourthboard through the flat rope. A rotating cam adjusts the position ofthe remote lower mirror. The optics are located mainly on the thirdboard and near the vertical axis of the instrument, surrounded byelectronics and batteries.
copper strips is adapted to the diode operation tem-perature to minimize electrical heating hence to in-crease operation time. The divergent beam iscollected by a parabolic mirror (PMI) of 50.8 mm (2in.) focal length, adjusted and tightly bolted onto theDewar frame. This emission module, which is com-posed of a diode laser support and a parabolic mirror,a critical component for the alignment from the laserhead up to the detectors, is revealed to be very stableand has required no further readjustment, even afterthe severe shock on landing. The laser beams provideoptical power of several hundred microwatts, and aregenerally multimodes. Therefore, a grating must beinserted to separate the different modes spectrally.However, inserting a grating somewhat complicatesthe optical setup, because this requires (i) a largebeam �50.8 mm� to achieve the best separation of thedifferent modes and (ii) additional mirrors. After re-flection by flat mirror FM1, and diffraction by thegrating, the collimated beam is reduced to a width of�18 mm diameter (1�3 factor) by parabolic mirrorPM2 and spherical mirror SM1. A beam splitter (BS)diverts a part of the beam toward the reference cell,after reflection on flat mirror FM2. Two other flatmirrors direct the reference beam to a lens that fo-
cuses it onto the detector. The main beam is directedto the entrance hole of the upper mirror of the mul-tipass Herriott cell by a spherical mirror SM2. Aftercirculating inside the multipass cell with a number Nof passes, the beam exits through the same injectionhole and reflects on spherical mirror SM2. The num-ber N is determined by the curvature radius of thetwo identical mirrors whose diameter is 350 mm, andby the distance between mirrors. Given the curvatureradius R � 5.735 m and the distance between mirrorsd � 3.50 m, the number N is obtained from13
cos � � 1 � d�R, (7)
� � 2k�N, (8)
where k is an integer (k and N�2 have no commondivisor except 1). When choosing N � 86 reflections,the optical path length is L � 300.31 m and the dis-tance is d � 3.492 m. The closest geometric configu-ration producing a longer optical path �N � 156reflections for L � 544.12 m) is obtained when thedistance d is reduced by 5 mm at d � 3.487 m. Thesetwo optical configurations are distinct from otherones having higher N values, by the size �14 mm� ofthe injection hole drilled in the upper mirror of theHerriott cell. However, a spurious configuration �d� 3.489 m, N � 242, and L � 845.55 m) can beobserved if the injection beam is near the rim of theinjection hole and if the distance d has driftedby � 3 mm. Great care has been taken to control andadjust the distance d so as to be certain of the right Nvalue (see Subsection 3.C).
The optical configuration of the multipass Herriottcell has already been described.14 The Herriott cell isequivalent to a divergent spherical mirror coincidentwith the upper mirror surface. The stability of thismirror is therefore critical for laser beams since itamplifies by a factor of 2 the angular fluctuations ofthe exit beam with respect to those of the injectionbeam. This is not the case for the lower mirror, whichcan undergo some angular change without influenc-ing the direction of the emerging beam (at least in thefirst order). That makes the choice of a Herriott cellquite appropriate for our balloon experiment. We ob-served good optical stability even at low altitudewhen high-amplitude oscillations of the gondola areobserved, and this is true even with the higher Nvalue �N � 156�. The proof that the optical configu-ration is unique and stable is given by the very lownoise on the vertical profiles of the measured species.
The configurations for N � 86 reflections (pathlength L � 300.31 m) and N � 156 reflections �L� 544.12 m� result from a compromise between sev-eral constraining geometric parameters: (i) The dis-tance between Herriott mirrors is set to �3.5 m tomatch the feasibility of an easily deployable systemand permit an absorption length of several hundredmeters. (ii) The Herriott mirrors have a reasonablediameter of 350 mm, not too heavy but large enough sothat reflection spots are small near the injection hole,
Fig. 6. Optical path of the beam for one given diode laser. Right:The optical path including the multipass cell. The upper mirror ofthe multipass cell is adjusted and fixed. The lower mirror is at theextremity of the telescopic mast, which is deployed before speciesmonitoring. There is tolerance on the lower mirror orientation (anangle of a few minutes) and off position �10 mm) in the Herriottcell. Optical elements are inserted on three carbon fiber boards.Left: The upper part of the instrument exhibiting an optical pathwith optical elements. PM, parabolic mirror; FM, flat mirror; SM,spherical mirror; BS, beam splitter; L, lens. Identical mirrors arelabeled with increasing numbers, from laser to detectors. See thetext for more details.
allowing a high number of reflections. Moreover, abeam diameter on SM2 smaller than the present sizeof 18 mm would render the adjustment of the sphericalmirror SM1 more critical. (iii) Six laser beams can thentake place on the circle formed by mirrors SM2. Thecalculated reflection spots on Herriott mirrors areshown in Fig. 7 for a configuration with N � 86 reflec-tions. As can be seen, the diameter of the spots isevolving as a sine function on ellipses of different ec-centricities. (iv) The curvature radius is fixed to R� 5.735 m, which complies with the requirement thatthe angle between input and output beams of the Her-riott cell is maximum, for better separation.
Calculation of the beam trajectory shows that theoverall optical setup is rather critical, in relation tothe admissible angular fluctuations of the mirrors. Ifall mirrors fluctuate independently, the angular tol-erance is 25.4 cm (10 in.) for each of them. The firstflights have shown a reasonable stability of the mir-rors, but not optimal stability. An improvement wasbrought on the steering of the laser beam by activelyrotating two optical reflectors: the grating, with itsrotation axis parallel to the grooves, and mirror SM1with a rotation axis perpendicular to that of the grat-ing. Rotation angles along these two axes are adjustedindependently by a telecommand, to maximize the sig-nal on the detector. Moreover, a rotation of the gratingallows for changing the operating wavenumber, follow-ing a new diode laser setting for monitoring differentspecies.
C. SPIRALE Mechanics
The mechanics of SPIRALE consist of four main me-chanical subsystems: the multipass absorption cell,the carbon fiber frame, the mirror holders, and theDewars. The optical axis of the cell is set vertically,with the upper (entrance) mirror fixed on the instru-ment frame, while the lower (or back) mirror is low-ered down to its normal operation position �3.5 mbelow, thanks to a mechanism consisting of a deploy-able mast and actuator. The deployable mast is com-
posed of two 2.35 m long carbon fiber beams slidingone into the other under gravity with the help of arope ruled on a pulley driven by an electric motorlocated on the top of the instrument. The two beamshave a triangular cross section. The lower mirror lieson a carbon fiber board fixed horizontally to the bot-tom of the inner beam. In the retracted position, thetwo beams are withdrawn inside the instrument andthe Herriott mirrors are protected against dust orshocks. In the deployed position, the top of the upperbeam lies on the same level as the second horizontalboard of the instrument.
In the first flight a slow change in the number ofoptical passes in the Herriott cell from from N � 86reflections to N � 156 reflections, with a temporarymixture of N � 242 reflections and N � 156 reflec-tions was observed. This change was due to varia-tions of the mirror curvature radius R. Whereas themirrors are made of Ule (a material with a negligibleexpansion coefficient), their supports are made of In-var, which has a very low but nonnegligible expan-sion coefficient. These supports are stuck on themirror backs, which lead to the bending of the mir-rors with the influence of temperature. This has beenchecked after the first flight in laboratory tests, inwhich variations of the mirror curvature radius withtemperature were quantitatively reproduced. More-over, during the second flight, two red lasers directedto position detectors through mirrors fixed on carbonboards were used, and no variation of the mast lengthwas observed, confirming the only influence of themirrors. The masts indeed consist of honeycombs in-corporated between four bidirectional carbon fiberplies regularly crossed to avoid expansion in theirlength.
From the second flight on, the distance between themirrors was actively controlled using a system thatenabled a fine correction of distance d. The lowermirror can be translated by a cam, activated by atelecommand to compensate for a change of radius ofcurvature. A translation of 2–3 mm is necessary tomaintain the multipass cell output beam at the opti-mum position. A maximum translation of 8 mm isavailable by construction, which also permits thechange of the number of reflections during flights. Innormal operation, the adjustments on d are per-formed mainly at the beginning of the flight, whenthe temperatures of the Herriott mirrors and carbonmasts decrease rapidly, and when the laser beamsinside the instrument are still aligned properly. Ad-justments on d are possible in increments of 0.25 mmand the optimum position is estimated from the de-tector signal observed in real time through telemetry.
The architecture of the instrument is presented inFig. 5. The structure is composed of four horizontalhexagonal-shaped carbon fiber boards separated bycarbon fiber spacers at their corners. There are sixtriangular-shaped spacers between boards 1 and 2and 2 and 3, whereas there are six cylindrical-shapedspacers between boards 3 and 4. Spacers are locatednear the corners of the boards to secure space formirror mounts and laser beams near the axis. Boards
Fig. 7. Calculated positions of the six laser beams’ reflection spotson mirrors disposed on separate ellipses. Left: upper mirror (orentrance mirror) viewed backward with the hole drilled through.Right: lower mirror (or back mirror) facing. The first reflections arevisualized by dots in the center of spots and are far from the lastreflections visualized by the cross�circle in the center of the spots.Diameter, 350 mm; number of reflections, 86; distance betweenmirrors, 3.492 m; total path length, 300 m.
and spacers are strongly tightened together so thatthe structure is as stiff as possible. The deployablemast may distort the carbon structure when it movesfrom the retracted to deployed positions (or con-versely), but this has been minimized by proper de-sign. In the retracted position, the deployable mastlies on the fourth board, on which there is no optics,and in the deployed position, it lies on the edge of thesecond board on a place that is strongly reinforced.Around the structure, other carbon fiber panels serveas protection against shocks, and also as thermalinsulators. Thermal insulation is increased by a mul-tilayered coat set on the carbon fiber panels, with anouter white layer for higher albedo.
D. Electronics
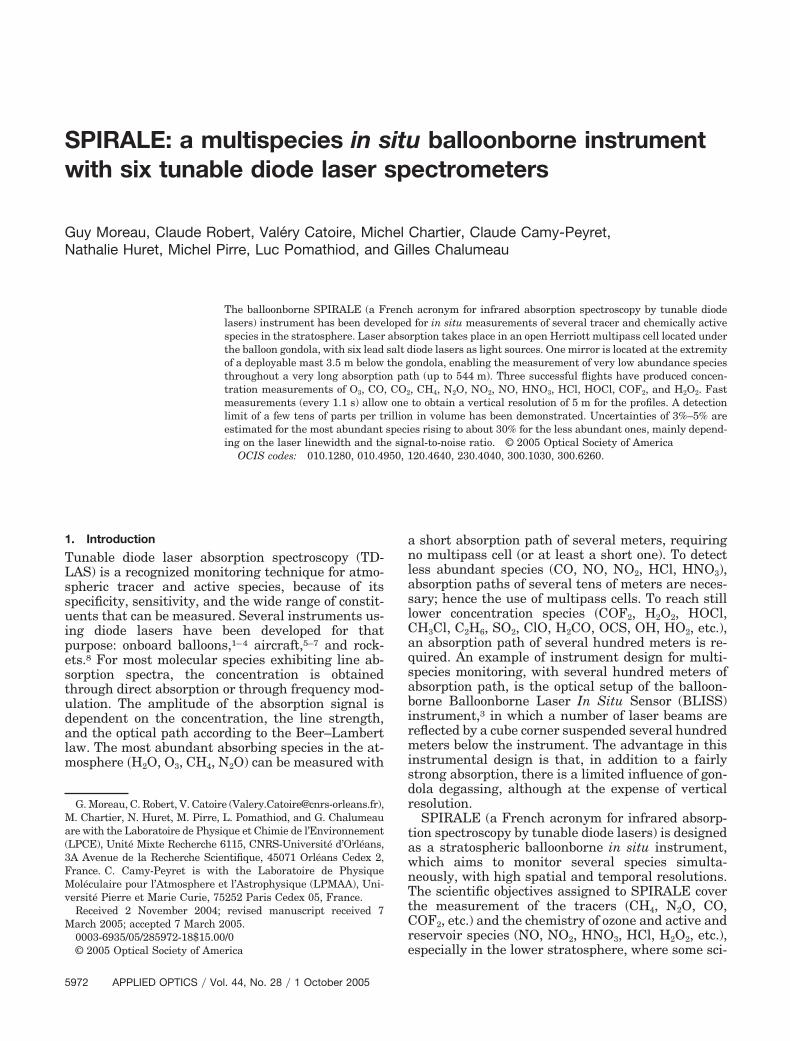
The main parts of the SPIRALE electronic system(see Fig. 8) are the instrument control module (ICM),the diode laser emission module (DLM), the data pro-cessing module (DPM), the mirrors and the gratingmotor driving module (motor command module orMCM), the preamplifiers, and the power supply,which are all physical entities or racks. The DLMcontains several submodules. Temperature and cur-rent controls are installed on separate electroniccards, two for each diode laser. Each laser is assignedto a particular frequency sweep, near 200 Hz butslightly different for all channels, and triggered bythe DPM. Temperature and current settings are pro-vided by a digital-to-analog converter card. A micro-controller is used to adjust the drive current of thevarious laser diodes and receives commands from theICM through an RS-232 interface. HgCdTe or InSbcooled detectors are chosen depending on the diodelaser wavelengths. Each channel has its own elec-
tronic box for signal preamplification. The gains areset on the ground so as to obtain a maximum signalof about 2 V for both signals and for each channel ordiode laser: the measurement signal corresponding toatmospheric absorption and the reference signal forspectra calibration. The signals are passed to theDPM and amplified again with commendable gains tomaximize the signal and benefit from the whole rangeof the analog-to-digital converter �16 bit resolutionfor both signals). Only gains of 1, 2, 4, and 8 can becommanded. Each scan consists of 1024 data points.Spectra are processed by sequential averaging: 198successive sweeps of the atmospheric signal are ac-cumulated, followed by only 10 successive sweeps ofthe reference signal for limiting calculation delay.The reference signal noise does not need to be as lowas the atmospheric signal noise because absorptionon the reference channel is much higher. The mostsignificant 16 bits of accumulated data are trans-ferred at the end of the averaging process through aparallel bus to the ICM, at exactly 1.1 s intervals, atime step that is imposed by the ICM. Once datatransfer from the six channels to the ICM is complete,a frame is sent by TM with the same period of 1.1 s.The TM frame contains, in addition, measurementsof pressure and air temperature, housekeeping data,and TC acknowledgement.
The ICM is a PC-like computer. It dispatches com-mands received by TC to other modules and formatsdata to be transferred by TM. Data are also recordedonboard on a hard disk. The ICM includes severalcards devoted to specific tasks: air temperature mea-surement, pressure, interfaces, and housekeeping.Many parameters are measured to control the instru-ment during flight, especially inside and outside tem-peratures. There is still room in the ICM for morespecific measurements (aerosol counter, light flux,etc.).
The mirrors and gratings driving module set theposition of the mirrors SM1 and the gratings up to thenext command, since the motors are locked in theirlast commanded position. The controls and com-mands of the motors occur one at a time. Motors arefed with continuous current and loop control isachieved with optical encoders. Other actuators re-quire motors: the two arms for the air temperaturesensors stand vertically along the gondola frame be-fore takeoff for protection and for gondola clearance.They are deployed at the beginning of ascent andreturned to their initial position just before cut down.A retractable shutter protects the lower Herriott mir-ror during release of ballast. Lithium batteries pro-vide power to the instrument and are used becausethey are light, except for driving subsystems thatneed high currents; in that case, they are replaced byCd�Ni batteries. The overall electric power consump-tion reaches 150 W.
4. Signal Processing and Retrieval
The purpose of the signal processing and retrievalalgorithms is to fit experimental and calculated spec-tra in order to derive the concentration of species. To
Fig. 8. Schematic diagram of SPIRALE electronics, which con-sists of several functional and physical subsystems. From top tobottom: the diode laser emission module (DLM); the signal pream-plifier (SA); the data processing module (DPM) including the AOC;the instrument control module (ICM); the motor command module(MCM); the power supply; the telecommand (TC); and the telem-etry (TM).
achieve this goal, several steps are needed in theconcentration retrieval algorithm.
A. Time to Wavenumber Conversion
Signals are sampled as a function of time. The pro-cess of linearization has to convert the sweeps as afunction of time into spectra as a function of thewavenumber, provided that the time–wavenumbertransformation is well characterized. This informa-tion can come from the line positions of the gas mix-ture in the reference cells, monitored during theentire flight. However, the number of reference linesis not always high enough to derive a precise spectralscale, especially if only two lines (the minimum) arepresent. An alternative would consist of recordingfringes in real time, enabling a better knowledge ofthe transformation. This has been performed in somerocketborne instruments.8 On SPIRALE, fringes arerecorded in the few hours preceding the flight, whenthe diode laser emission characteristics are quite sta-ble in the integration hall environment.
In these conditions, fringe sweeps are recordedwith a germanium etalon of 300 MHz free spectralrange (FSR) inserted in the reference beam for theselected microwindows �0.4–0.6 cm�1 wide) of thevarious laser diodes. Figure 9 shows fringes obtainedwith a narrow bandwidth laser. The useful part of thesweep (after turnaround) is fitted very well by a com-bination of polynomial, exponential, and sinusoidalfunctions. In the linearization process, the originalamplitude as a function of time signal is convertedinto an oversampled amplitude as a function of thespectral variable signal of 2000–3500 point numbers.In this spectral domain, the samples are evenlyspaced by about 5 MHz. The line positions observedwith the reference cell are used for absolute spectralcalibration. For some, but not all the species, theiractual positions may differ from those given in theHITRAN database,10 given the high � 1 MHz� exper-imental spectral sensitivity. Because of unavoidablepressure shifts (in the lower troposphere) and instru-mental shifts (throughout the flight) the wavenum-ber or frequency scale has to be correctedcontinuously. The observed shifts are less than15 MHz and absolute references are not known pre-cisely (because the FSR is hanging with ambientpressure and temperature). The observed variationsare of the order of 0.2% (for the step size) and 30 MHzfor the absolute value.
B. Line Fitting with Second Derivative Technique
Background variation of several origins (fluctuationsfrom diode laser emission, vignetting of the laserbeams, residual fringes, beam wandering on the de-tector surface, etc.) complicate retrievals with thestandard line-fitting method, because the zero ab-sorption signal is difficult to reconstruct. An alterna-tive method adopted for SPIRALE consists ofapplying a numerical derivative that efficiently re-moves the continuous component of the signal. Thesecond derivative is preferred, because it transforms
absorption lines into symmetrical signatures, whichare easier to handle. The convolution function pre-sented in Fig. 3 of width m has the effect of a variablestep second derivative. It removes the continuum orbackground and attenuates the harmonics of periodsm�2, m�3, etc. If the fringe period is a divisor of m,the second derivative is also effective in fringe reduc-tion. Practically, the second derivative methodproved to be very useful for very weak lines. Exam-ples of concentration retrieval through the secondderivative method are shown in Subsection 4.C. Thenumerical second derivative retrieval method has aphysical link with the high-frequency modulationtechnique, which is equivalent to a second derivativein the case of small-amplitude frequency modula-tion.15
C. Concentration Retrieval
Figure 10 presents an example of a calculation per-formed on a microwindow of around 2099 cm�1,
Fig. 9. Upper panel: Fringes obtained with a germanium etalon of300 MHz free spectral range (or 0.01 cm�1); a long usablefrequency-increasing period follows a short nonusable frequency-decreasing period. Middle panel: A fit of fringe positions with acombination of polynomial, exponential, and sinusoidal functionswithin the usable part of the sweep (85% of total sweep). Lowerpanel: the residual showing a very low standard deviation, equiv-alent to �8 MHz.
where several lines of CO and O3 strongly absorb(channel 1). Fitting is achieved either on direct signalor after second derivative processing. In both cases,calculated and experimental spectra are initially pro-cessed in the same manner: smoothing for rejection ofhigh-frequency components and convolution forfringe suppression. The upper panel plots the signalas a function of wavenumber. In the first method, COand O3 concentrations are estimated and the baselineis reconstructed from the fitting of the normalizedexperimental transmission by the simulated trans-mission (middle panel). This process is performedthrough a Levenberg–Marquardt nonlinear algo-rithm16 by minimizing the difference between the de-rived experimental transmission and the calculatedtransmission. In the second method, concentrationsof CO and O3 are retrieved by using the second de-rivative technique. The normalized experimental sig-nal derivative (the ratio of the experimental signalderivative to the signal without the absorption ob-tained previously) is fitted to the calculated secondderivative spectrum. The lower panel shows bothcurves and residuals.
In both fits the residuals exhibit some waves aroundthe lines. This is related to the difficulty in reproducingprecisely the absorption spectra. To obtain a satisfac-tory fit one has to know precisely several spectroscopicand atmospheric parameters: the laser linewidth andemission profile, the pressure-broadening parametersair and NL, and temperature and pressure. Concern-ing the laser, a satisfying emission profile is obtained
by mixing a Gaussian (narrower) and a Lorentzian(broader) shape and fitting absorption lines at lowpressure (above 30 km) where Doppler broadening islarger than pressure broadening. The laser profile isfirst obtained on the ground, and then adjusted on theflight data, because the laser characteristics areslightly modified by small changes of diode laser tem-perature and current. Although pressure-broadeningparameters air and NL are from the HITRAN data-base, they may need adjustments to fit our data. Thisis needed when fitting spectra at high pressure, wherepressure broadening is larger than Doppler broaden-ing. When needed, air has been modified while main-taining the value of NL(only one parameter wasvaried). Pressure-broadening coefficients of HITRANhave been modified only by a few percent for stronglines, but changes of 50% were needed in case of theweakest lines.
Both fits (direct absorption and second derivative)give nearly the same concentrations when the signalis not perturbed, i.e., with no fringes. However, in thepresence of fringes and ill-defined spectral struc-tures, the difficulty in retrieving the background ex-plains why the second derivative method producesbetter results: statistical noise is smaller due to theassociated filtering. In the presence of strong noiseand�or fringe features, the second derivative tech-nique helps in extracting weak molecular features,provided the width m is a multiple of the fringe pe-riod. A striking example is the detection of COF2, andH2O2 faint lines near 1250 cm�1 (Fig. 11, channel 3),with very low peak absorption � 10�5 typically).
Other fitting examples are displayed in Fig. 12�N2O and CH4, channel 3) and Fig. 13 �NO2, channel5), which allow the inference of atmospheric profiles(see Subsection 5.A). Figure 14 �HNO3, channel 6)shows an example where the great number of atmo-spheric lines does not hinder a good fitting by a sim-ulated spectrum. Figure 15 (NO, channel 4) is anexample of a faint doublet on a highly perturbed base-line. When absorption is below 10�4, or when theatmospheric signal is lower than the nonremovablesignal fluctuations, several successive scans are av-eraged to increase the signal-to-noise ratio.
5. Results and Performances
A. Vertical Profiles
We present a few results obtained from the threesuccessful flights of SPIRALE. The measured speciesare listed in Table 1. To illustrate the capability of theinstrument SPIRALE, several vertical concentrationprofiles are displayed: an abundant species O3 (Fig.16, channel 1), a low-abundance species COF2 (Fig.17, channel 3), and a species like NO2 spanning alarge range of volume mixing ratio (Fig. 18, channel5). The change of absorption path from 300 to 544 mimproves greatly the quality of the signal, especiallyfor lines with peak absorbances around 10�4. Figure19 presents the correlation between the tracers N2Oand CH4, which can be exploited to test atmosphericphotochemistry and dynamics.17,18
Fig. 10. Concentration retrieval of O3 and CO near 2099 cm�1.The signal is frequency linearized with 5.03 MHz evenly spacedpoint numbers. The frequency is given relative to an arbitraryfrequency. Upper panel: signal, solid curve; reconstructed curvewithout absorption, dashed curve. Middle panel: absorbed signalwith a synthetic spectrum and residual (�10). Lower panel: secondderivative with a synthetic spectrum and residual (�10). CO andO3 absolute concentrations are in molecules cm�3; the optical pathlength: 544 m.
Fig. 11. Simultaneous retrieval of COF2, H2O2, and HOCl near1250 cm�1 (channel 3 and laser mode 2). Example of faint linesappearing more clearly with the second derivative (lower panel)than from direct absorption (middle panel). The signal is the av-erage of 30 consecutive spectra. The optical path length is 544 m.
Fig. 12. Simultaneous retrieval of CH4 and N2O near 1262 cm�1
(channel 3 and laser mode 1). Example of strong lines at highpressure appearing clearly on the signal (upper panel) and withthe second derivative (lower panel). The optical path length is300 m.
Fig. 13. Retrieval of NO2 near 1600 cm�1 (channel 5 and lasermode 1). Example of a faint doublet. From top to bottom: (i) Signalwith spectral characteristics of absorbing species; (ii) the zoomedpart of the signal centered on the NO2 doublet; (iii) the absorptionsignal with the retrieval of the baseline; and (iv) the second deriv-ative signal. In both latter plots, the signal is filtered to removefringes. The optical path length is 300 m.
Fig. 14. Retrieval of HNO3 near 1701.6 cm�1 (channel 6). Exam-ple of species with numerous closed lines shown in logarithmicscale in the range 1–100 (upper panel). Signal (upper panel) andsecond derivative (lower panel). The optical path length is 300 m.
In situ measurements are usually perturbed by thegondola, but this influence can be reduced by appro-priate design and choice of materials. The main prob-lem lies in the degassing of various parts of the
gondola: thermal insulators, electronic boards, car-bon fiber elements, etc. To completely avoid contam-ination from the gondola, the proper choice should beto maintain all instrument subsystems in sealedmetal boxes. This is not feasible for SPIRALE. How-ever, to reduce gondola contamination we have cho-sen a highly asymmetric deployable system with anabsorption zone between the mirrors of the Herriottcell that is well separated from the rest of the pay-load. This geometry provides a large open volumeundisturbed by the wake of the deployable mast. Thenatural flushing of the absorption zone is maximizedexcept when the mast is upstream of the relativewind. This is clearly demonstrated in Fig. 20, where
Fig. 15. Retrieval of NO near 1861 cm�1 (channel 4). Anotherexample of a faint doublet on a highly perturbed baseline. From topto bottom: (i) Full amplitude signal exhibiting H2O line; (ii) zoomedpart of the signal centered on the NO doublet; (iii) second deriva-tive signal. The optical path length is 544 m.
Fig. 16. Ozone and temperature vertical profile measured duringascent and descent during midlatitude daytime. The vertical resolutionis 5 m. The optical path length is 300 m. Three error bars (with emptycircles) are positioned at low, middle, and high altitudes.
Fig. 17. COF2 and temperature vertical profiles, surrounded byprofiles of constant absorptions of 10�4 and 10�5. The dotted curveis a remote measured concentration profile (Ref. 20). The verticalresolution is 100 m. The optical path length is 544 m. Three errorbars (with empty circles) are positioned at low, middle, and highaltitudes.
Fig. 18. NO2 and temperature vertical profiles measured duringascent and descent during midlatitude daytime. At low altitudes,concentrations are not plotted when curves cannot be retrievedfrom the signal. The vertical resolutions are 5 m (high altitude)and 30 m (low altitude). The optical path is length 300 m. Threeerror bars (with empty circles) are positioned at low, middle, andhigh altitudes.
the evolution at the float of ozone concentration, as afunction of time, exhibits negative peaks related tospecific wind directions, while the gondola slowlyspins around the vertical axis. When a concentrationpeak occurs, the temperature probe T2 is unaffectedby the wake, while at the same time, temperatureprobe T1 (located on the opposite side) is lying withinthe wake of the gondola. Conversely, rotation by 180°leaves T1 unspoiled, while T2 lies in the wake.
These observations allow us to discern the concen-tration values affected by contamination, providedthe mast is the only perturbing source. During day-time, the perturbation of the different species is ei-ther negative �O3, N2O) or positive (CO, NO2, H2O)under contamination. In addition to these perturba-tions, a more diffuse contamination exists for H2O
whether it is nighttime or daytime. This is not sur-prising due to the ability of water to be adsorbed onthe various surfaces. The same is true for CO butduring daytime only. It may be concluded that CO inexcess is formed on the outside surface of the mast orgondola multilayer insulation (MLI) blanket underthe action of UV radiation through heterogeneousreactions. Concentration values corresponding tocontaminated periods are eliminated, except whenthey are within the estimated uncertainty.
Water presents a particular behavior since degas-sing from the gondola occurs at higher flow ratesduring daytime than during nighttime, in relation tothe MLI temperature. For species other than O3 andCO, no degassing effect is observed. During night-time, water is the only species still affected by gon-dola environment.
C. Accuracy and Detection Limit
1. PrecisionRandom errors have an instrumental origin (noise, P,T fluctuations), or may come from the concentrationretrieval process itself. We first consider retrieval er-rors. In Subsection 5.B, several parameters affectingthe species concentration have been discussed. Toevaluate the retrieval errors, sensitivity calculationswere performed using the fitting program. Adjustableparameters are incremented within error bars andnew concentrations are derived. Table 2 shows theresults of this sensitivity calculation for several vari-ations or errors of the parameters: temperature (T),pressure (P), pressure-broadening coefficient �air),and laser linewidth ��vl). Calculations are performedconsidering two regimes, a high-pressure condition(about 200 hPa) and a low-pressure condition (about8 hPa), with a laser linewidth that is either narrow��vl � 10 MHz) or broad ��vl � 70 MHz). It appearsfrom Table 2 that the uncertainty on the laser line-width is the main source of error at low pressure,while the pressure-broadening error is dominant athigh pressure. The final precision is calculated as thesquare root of the quadratic sum of concentrationvariations calculated for the following variations: 0.5K (T), 0.1 hPa (at low P) or 0.5 hPa (at high P), 0.5%�air), 10% ��vl) is indicated. The error on the spectralcalibration can be neglected, since the presence ofseveral lines in the reference or atmospheric signalenables an efficient determination of the spectralsampling step (better than 0.2%).
Beside errors on air pressure and temperature, in-strumental errors derive mostly from noise and fluc-tuations in this signal. Random noise contributes tothe error proportionally to the signal-to-noise ratio(SNR). For weakly absorbing species, low SNR is themajor source of error. Adjustment of the laser line-width is still feasible after averaging 10–100 succes-sive sweeps, provided that the centers of the lines arecarefully aligned. Fringes or fluctuating signals areconsidered to contribute to random errors, when theyare still present after second derivative calculationand fringe filtering. For the most abundant species
Fig. 19. Methane–nitrous oxide plot for two locations: high lati-tude (Kiruna, Sweden, 21 January 2003) and mid-latitude (Aire-sur-l’Adour, France, 2 October, 2002). The fine vertical resolution(� 30 m) allows for the observation of structures related to identi-fied layers. At high latitude, the low N2O mixing ratio is due tomesospheric air subsidence.
Fig. 20. Time evolution of ozone exhibiting negative peaks, cor-related with the absorption zone passing in the wake of the tele-scopic mast. The gondola is slowly spinning loose with the balloon(full curve). The unperturbed experimental ozone closely matchesthe constant ozone mixing ratio in a large pressure range (dashedcurve). The two optical path lengths are 300 and 544 m.
�N2O, CH4, O3, particularly), vertical concentrationprofiles present fluctuations of smaller than 1% (0.5%with CH4). Bearing in mind that a 1.1 s samplingperiod provides a 4–6 m vertical resolution, thesefluctuations are still instrumental, because naturalfluctuations of concentration are smoother. Becausethese fluctuations are smaller than the calculatedprecision indicates that errors are evolving with timescales longer than the sampling period. This confirmsthe above analysis of errors, which states that theymostly originate from the concentration retrievaland�or are due to fringes and low-frequency perturb-ing signals all evolving slowly with time.
2. AccuracyBesides random errors, systematic errors may con-tribute significantly to the uncertainty. The most im-portant ones are line strength errors that are not verywell quantified for some of the species. The need forhighly accurate spectroscopic data is exemplifiedagain. To a lesser extent, inaccurate broadening co-efficient temperature dependencies may generatesome systematic errors. Another source of systematicerror lies in the nonlinearity of the detectors. Actu-ally, the signal linearity is better than 1% and onecan therefore consider that most of the systematicerror originates only from inaccurate spectroscopicdata. Except for this latter source of error, the overalluncertainty �1� for a Gaussian distribution) can beestimated from all random uncertainties (see Table3). Three sources of errors are taken into account, allconsidered to be produced by random fluctuationsresulting from the following: (i) the concentration re-trieval process itself, (ii) the noise in the signal, and(iii) the change in the shape in the laser emission.Three uncertainty estimations are made for three
SNR values: 100, 10, and 1. These values can berelated to absorption values of, respectively, 10�2,10�3, and 10�4. In the most favorable case (abundantspecies with SNR � 100), uncertainties are clearlyless than 3%, whereas in the worst case (low-abundance species with SNR � 1), no measurementis possible because of the poor signal quality. Theoverall uncertainty domain is calculated for the use-ful pressure (and altitude) range. Table 4 summa-rizes the estimated uncertainties for the threeSPIRALE flights.
3. Detection LimitPure shot-noise-limited detection is not achievedwith SPIRALE, nor can it be achieved with equiva-lent airborne tunable diode laser absorption spec-trometers. In some laboratory experimentsemploying high-frequency modulation techniques, adetection limit of 10�7 (in a 1 Hz bandwidth) hasapparently been reached.19 Averaging several succes-sive sweeps improves the SNR by reducing the noise,but only in the case when no residual spectral featureis present. As an example of the performance of SPI-RALE, with a high-quality diode laser not affected bythese spectral features, a detection limit of 10�5 isobtained, as shown in Fig. 17, where the verticalprofile of COF2 is plotted (refer to Fig. 11 for thecorresponding microwindow). In Fig. 17 we have plot-ted (shown as dashed curves) the COF2 profiles cor-responding to peak absorptions of 10�4 and 10�5,respectively. We have compared the SPIRALE in situCOF2 profile with previous measurements fromATMOS for this species,20 which agree fairly wellwith our own measurements (within �20%). For thisspecies, the detection limit in the volume mixing ratio
Table 2. Sensitivity Calculations on Concentration for Variations of Temperature T, Pressure P, Pressure-Broadening Coefficient �air, and LaserLinewidth �vl at Low and High Pressures, Considering Two Laser Linewidths During a Concentration Retrieval (Concentration Variation
High P Narrow (10 MHz) 0.75 0.8 1.6 0.1 2.0Broad (70 MHz) 0.75 0.8 1.6 1.0 2.2
Note: The resulting precision on c (total retrieval error) is the square root of the quadratic sum of concentration variations (P � 0.1hPa at low P or 0.5 hPa at high P).
Table 3. Estimated Uncertainties (1� of Gaussian Distribution) for Three SNR values (100, 10, and 1), Related to Absorption (Respectively,10�2, 10�3, and 10�4), Considering the Random Sources of Errors
is estimated to be about 30 pptv at 18 km. For NO2,which plays an important role in the time-varyingphotochemistry of the atmosphere in the lowerstratosphere, a typical detection limit of �20 pptv isachieved at approximately 15 km (see Fig. 18). Athigher altitude, the detection limit is somewhatlower, because in the case of a narrow linewidth, theinfluence of signal fringes or sidelobes is more effi-ciently reduced.
6. Conclusion and Perspectives
The balloonborne SPIRALE instrument has been de-veloped for in situ measurements of several tracerand chemically active species in the stratosphere. La-ser absorption takes place in an open Herriott mul-tipass cell located under the balloon gondola, with sixlead salt diode lasers acting as light sources. Onemirror is located at the extremity of a telescopic mast3.5 m below the gondola, enabling the measurementof very low-abundance species over a very long ab-sorption path (up to 544 m). Three successful flightshave produced concentration profiles of O3, CO, CO2,CH4, N2O, NO2, NO, HNO3, HCl, HOCl, COF2, andH2O2. Fast measurements (every 1.1 s) result in avertical resolution of 5 m. A detection limit of a fewtens of pptv has been demonstrated. Uncertainties of3%–5% are estimated for the most abundant speciesincreasing to about 30% for the less abundant ones,mainly depending on the laser linewidth and SNR.Degassing the gondola and its effect on species con-centration has been assessed. It limits the quantita-tive measurements of H2O (as expected) and of COduring daytime.
The high number of species simultaneously detectedwith very good precision and low detection limits, com-bined with the very high vertical resolution, makes SPI-RALE a powerful instrument to use to obtain detailedstudies of the stratosphere. This instrument has beenselected to perform validation of vertical profiles of spe-cies measured by the European Space Agency satellite(ENVISAT) launched in 2002. Tropical and polar valida-tion campaigns are occurring, respectively, in June 2005from Teresina �5° S, Brazil) and in January 2006 from
Kiruna (68° N, Sweden). Beside these validation cam-paigns, SPIRALE will contribute to the study of thechemical, physical, and dynamic processes of thestratosphere, and the tropical upper troposphere. Si-multaneous measurements of key species of the NOy
and Cly families (NO, NO2, HNO3, HCl), ozone, andtracers �N2O, CH4, CO�, will provide strong con-straints in model calculations of the ozone layer pho-tochemistry. The low-detection limit for speciesmeasured in situ is very favorable to address somedifficult questions such as the possible residual con-centration of NO2 in the polar vortex21 and the HClmixing ratio in the tropical upper troposphere andlower stratosphere. This mixing ratio is expected tobe very low compared to other stratospheric regions.Nevertheless it is needed to confirm this low level andachieve a better accuracy.22
Furthermore, correlations of the tracer abun-dances have been shown to be a very powerful tool tostudy the origin of the air masses in the stratosphereand to quantify their mixing across the dynamic bar-riers (tropopause, subtropical barrier, and polar vor-tex). SPIRALE will contribute to such studies. To thisend, correlations between N2O and CH4,17,18,23 HCland O3,22 and CO and O3 (Ref. 24) will be particularlyuseful.
The authors thank CNES and INSU/CNRS forfunding the SPIRALE instrument. Significant contri-butions to the SPIRALE design, fabrication, and test-ing were provided by T. Lemaire, J. LeBihan, J.-C.Rimbault, T. Vincent, G. Jannet, B. Couté, and P.Badets. Special thanks are given to F. Retailleau andB. Letenneur for their work on diode laser spectros-copy and the associated software. The efficiency of theCNES balloon operation team is acknowledged forcarrying out successful flights and for safe recovery ofthe SPIRALE payload.
References1. D. R. Hastie and M. D. Miller, “Balloon-borne tunable diode
laser absorption spectrometer for multispecies trace gas mea-surements in the stratosphere,” Appl. Opt. 24, 3694–3701(1985).
Table 4. Estimated Uncertainty (1�) for SPIRALE Species Retrieval
2. C. R. Webster and R. D. May, “Simultaneous in situ measure-ments and diurnal variations of NO, NO2, O3, NO2, CH4, H2O,and CO2 in the 40- to 26-km region using an open path tunablediode laser spectrometer,” J. Geophys. Res. 92, 11931–11950(1987).
3. C. R. Webster, R. D. May, R. Toumi, and J. A. Pyle, “Activenitrogen partitioning and the nighttime formation of N2O5 inthe stratosphere: Simultaneous in situ measurements of NO,NO2, O3, and N2O using the BLISS diode laser spectrometer,”J. Geophys. Res. 95, 13851–13866 (1990).
4. G. Durry and G. Mégie, “Atmospheric CH4 and H2O monitor-ing with near-infrared InGaAs laser diodes by the SDLA, aballoonborne spectrometer for tropospheric and stratosphericin situ measurements,” Appl. Opt. 38, 7342–7354 (1999).
5. G. Toci, P. Mazzinghi, and M. Vanini, “A diode laser spectrom-eter for the in situ measurement of the HNO3 content of polarstratospheric clouds,” J. Atmos. Oceanic Technol. 16, 1295–1302 (1999).
6. C. R. Webster, R. D. May, C. A. Trimble, R. G. Chave, and J.Kendall, “Aircraft (ER-2) laser infrared absorption spectrom-eter (ALIAS) for in-situ stratospheric measurements of HCl,N2O, CH4, NO2, and HNO3,” Appl. Opt. 33, 454–472 (1994).
7. D. C. Scott, R. L. Herman, C. R. Webster, R. D. May, G. J.Flesch, and E. J. Moyer, “Airborne Laser Infrared AbsorptionSpectrometer (ALIAS II) for in situ atmospheric measure-ments of N2O, CH4, CO, HCl, and NO2 from balloon or re-motely piloted aircraft platforms,” Appl. Opt. 38, 4609–4622(1999).
8. F.-J. Lübken, F. Dingler, H. von Lucke, J. Anders, W. J. Riedel,and H. Wolf, “MASERATI: a rocketborne tunable diode laserabsorption spectrometer,” Appl. Opt. 38, 5338–5349 (1999).
9. H. I. Schiff, G. I. Mackay, and J. Bechara, “The use of tunablediode laser absorption spectroscopy for atmospheric measure-ments,” in Air Monitoring by Spectroscopic Techniques, Vol.127 of Chemical Analysis, H. W. Sigrist, ed. (Wiley, New York,1994).
10. L. S. Rothman, A. Barbe, D. Chris Benner, L. R. Brown, C.Camy-Peyret, M. R. Carleer, K. Chance, C. Clerbaux, V. Dana,V. M. Devi, A. Fayt, J.-M. Flaud, R. R. Gamache, A. Goldman,D. Jacquemart, K. W. Jucks, W. J. Lafferty, J.-Y. Mandin, S. T.Massie, V. Nemtchinov, D. A. Newnham, A. Perrin, C. P. Rins-land, J. Schroeder, K. M. Smith, M. A. H. Smith, K. Tang,R. A. Toth, J. Vander Auwera, P. Varanasi, and K. Yoshino,“The HITRAN molecular spectroscopic database: Edition of2000 including updates through 2001,” J. Quant. Spectrosc.Radiat. Transfer 82, 5–44 (2003).
11. D. J. Brassington, “Tunable diode laser absorption spectros-copy for the measurement of atmospheric species,” in Spectros-copy in Environmental Science Vol. 24 of Advances inSpectroscopy, R. J. H. Clark and R. E. Hester, eds. (Wiley,London, 1995).
12. C. R. Webster, “Brewster plate spoiler: a novel method for
reducing the amplitude of fringes that limit tunable-laser ab-sorption sensitivities,” J. Opt. Soc. Am. B 2, 1464– 1470 (1985).
13. D. Herriott, H. Kogelnik, and R. Kompfner, “Off-axis paths inspherical mirror interferometers,” Appl. Opt. 3, 523–526(1964).
14. G. Moreau and C. Robert, “Etude des variations d’un faisceaulumineux dans une cellule à passages multiples,” J. Opt.(Paris) 16, 177–183 (1985).
15. D. E. Cooper and R. E. Warren, “Two-tone optical heterodynespectroscopy with diode lasers: theory of line shapes and ex-perimental results,” J. Opt. Soc. Am. B 4, 470–480 (1987).
16. P. R. Bevington, “Least-Squares Fit to an Arbitrary Function,”in Data Reduction and Error Analysis for the Physical Sciences(McGraw-Hill, New York, 1969), Chap. 11.
17. H. A. Michelsen, G. L. Manney, M. R. Gunson, C. P. Rinsland,and R. Zander, “Correlations of stratospheric abundances ofCH4 and N2O derived from ATMOS measurements,” Geophys.Res. Lett. 25, 2777–2780 (1998).
18. R. L. Herman, D. C. Scott, C. R. Webster, R. D. May, E. J.Moyer, R. J. Salawitch, Y. L. Yung, G. C. Toon, B. Sen, J. J.Margitan, K. H. Rosenlof, H. A. Michelsen, and J. W. Elkins,“Tropical entrainment time scales inferred from stratosphericN2O and CH4 observations,” Geophys. Res. Lett. 25, 2781–2784 (1998).
19. C. B. Carlisle, D. E. Cooper, and H. Preier, “Quantum noise-limited FM spectroscopy with a lead-salt diode laser,” Appl.Opt. 28, 2567–2575 (1989).
20. F. W. Irion, M. R. Gunson, G. C. Toon, A. Y. Chang, A. Elder-ing, E. Mahieu, G. L. Manney, H. A. Michelsen, E. J. Moyer,M. J. Newchurch, G. B. Osterman, C. P. Rinsland, R. J. Sala-witch, B. Sen, Y. L. Yung, and R. Zander, “Atmospheric TraceMolecule Spectroscopy (ATMOS) Experiment version 3 dataretrievals,” Appl. Opt. 41, 6968–6979 (2002).
21. E. D. Rivière, M. Pirre, G. Berthet, J. B. Renard, F. G. Taupin,N. Huret, and B. Knudsen, “On the interaction between nitro-gen and halogen species in the arctic polar vortex during THE-SEO and THESEO 2000,” J. Geophys. Res. 107, 8311 (2002).
22. T. P. Marcy, D. W. Fahey, R. S. Gao, P. J. Popp, E. C. Richard,T. L. Thompson, K. H. Rosenlof, E. A. Ray, R. J. Salawitch,C. S. Atherton, D. J. Bergmann, B. A. Ridley, A. J. Weinhei-mer, M. Loewenstein, E. M. Weinstock, and M. J. Mahoney,“Quantifying stratospheric ozone in the upper tropospherewith in situ measurements of HCl,” Science 304, 261–265(2004).
23. H. A. Michelsen, G. L. Manney, M. R. Gunson, and R. Zander,“Correlations of stratospheric abundances of NOy, O3, N2O andCH4 derived from ATMOS measurements,” J. Geophys. Res.103, 28347–28359 (1998).
24. P. Hoor, H. Fischer, L. Lange, J. Lelieveld, and D. Brunner,“Seasonal variations of a mixing layer in the lowermost strato-sphere as identified by the CO-O3 correlation from in situmeasurements,” J. Geophys. Res. 107, 40446 (2002).