88
Splunk 5.0.1 Splunk Tutorial Generated: 1/09/2013 10:13 am Copyright © 2013 Splunk, Inc. All Rights Reserved
| Date post: | 02-Dec-2015 |
| Category: |
Documents |
| Upload: | zakhir-mohamed |
| View: | 75 times |
| Download: | 3 times |

Splunk 5.0.1
Splunk Tutorial
Generated: 1/09/2013 10:13 am
Copyright © 2013 Splunk, Inc. All Rights Reserved

Table of ContentsIntroduction..........................................................................................................1
Welcome to the Splunk Tutorial!...............................................................1 An overview of Splunk...............................................................................2
Before you start the tutorial................................................................................5 What you need for this tutorial..................................................................5 Download and install Splunk.....................................................................6 Start Splunk and launch Splunk Web........................................................8
Get data into Splunk..........................................................................................12 About getting data in...............................................................................12 Get the sample data into Splunk.............................................................13
Search and search language............................................................................18 About this chapter...................................................................................18 The search app.......................................................................................18 Start searching........................................................................................23 Use the timeline......................................................................................28 Change the time range............................................................................31 Use fields to search.................................................................................34 Use the search language........................................................................42 Save a search.........................................................................................48 Use a subsearch.....................................................................................50 Use field lookups.....................................................................................53 More search examples............................................................................61
Create reports and dashboards........................................................................67 About reports and dashboards................................................................67 Reporting examples................................................................................67 Dashboard examples..............................................................................76 View and print dashboards......................................................................83
More Splunk!......................................................................................................86 What happens next?...............................................................................86
i
Introduction
Welcome to the Splunk Tutorial!
What is Splunk?
Splunk is software that indexes IT data from any application, server or networkdevice that makes up your IT infrastructure. It's a powerful and versatile searchand analysis engine that lets you investigate, troubleshoot, monitor, alert, andreport on everything that's happening in your entire IT infrastructure from onelocation in real time.
Who uses Splunk?
Splunk is versatile and thus has many uses and many different types of users.System administrators, network engineers, security analysts, developers, servicedesk, and support staff -- even Managers, VPs, and CIOs -- use Splunk to dotheir jobs better and faster.
Application support staff use Splunk for end-to-end investigation andremediation across the application environment and to create alerts anddashboards that proactively monitor performance, availability, andbusiness metrics across an entire service. They use roles to segregatedata access along lines of duties and give application developers and TierOne support access to the information they need from production logswithout compromising security.
•
System administrators and IT staff use Splunk to investigate serverproblems, understand their configurations, and monitor user activity. Then,they turn the searches into proactive alerts for performance thresholds,critical system errors, and load.
•
Senior network engineers use Splunk to troubleshoot escalated problems,identify events and patterns that are indicators of routine problems, suchas misconfigured routers and neighbor changes, and turn searches forthese events into proactive alerts.
•
Security analysts and incident response teams use Splunk to investigateactivity for flagged users and access to sensitive data, automaticallymonitor for known bad events, and use sophisticated correlation viasearch to find known risk patterns such as brute force attacks, dataleakage, and even application-level fraud.
•
Managers in all solution areas use Splunk to build reports and dashboards•
1

to monitor and summarize the health, performance, activity, and capacityof their IT infrastructure and businesses.
What's in this tutorial?
If you're new to Splunk, this tutorial will teach you what you need to know to startusing Splunk, from a first-time download to creating rich, interactive dashboards.
Make a PDF
If you'd like a PDF version of this manual, click the red Download the SplunkTutorial as PDF link below the table of contents on the left side of this page. APDF version of the manual is generated on the fly for you, and you can save it orprint it out to read later.
An overview of Splunk
Splunk is powerful and versatile IT search software that takes the pain out oftracking and utilizing the information in your data center. If you have Splunk, youwon't need complicated databases, connectors, custom parsers or controls--allthat's required is a web browser and your imagination. Splunk handles the rest.
Use Splunk to:
Continually index all of your IT data in real time.• Automatically discover useful information embedded in your data, so youdon't have to identify it yourself.
•
Search your physical and virtual IT infrastructure for literally anything ofinterest and get results in seconds.
•
Save searches and tag useful information, to make your system smarter.• Set up alerts to automate the monitoring of your system for specificrecurring events.
•
Generate analytical reports with interactive charts, graphs, and tables andshare them with others.
•
Share saved searches and reports with fellow Splunk users, and distributetheir results to team members and project stakeholders via email.
•
Proactively review your IT systems to head off server downtimes andsecurity incidents before they arise.
•
Design specialized, information-rich views and dashboards that fit thewide-ranging needs of your enterprise.
•
2

Index new data
Splunk offers a variety of flexible data input methods to index everything in yourIT infrastructure in real time, including live log files, configurations, traps andalerts, messages, scripts, performance data, and statistics from all of yourapplications, servers, and network devices. Monitor file systems for script andconfiguration changes. Enable change monitoring on your file system orWindows registry. Capture archive files and SNMP trap data. Find and tail liveapplication server stack traces and database audit tables. Connect to networkports to receive syslog and other network-based instrumentation.
No matter how you get the data, or what format it's in, Splunk indexes it the sameway--without any specific parsers or adapters to write or maintain. It stores boththe raw data and the rich index in an efficient, compressed, filesystem-baseddatastore--with optional data signing and auditing if you need to prove dataintegrity.
Search and investigate
Now you've got all that data in your system...what do you want to do with it? Startby using Splunk's powerful search functionality to look for anything, not just ahandful of predetermined fields. Combine time and term searches. Find errorsacross every tier of your IT infrastructure and track down configuration changesin the seconds before a system failure occurs. Splunk identifies fields from yourrecords as you search, providing flexibility unparalleled by solutions that requiresetup of rigid field mapping rulesets ahead of time. Even if your system containsterrabytes of data, Splunk enables you to search across it with precision.
Capture knowledge
Freeform searching on raw data is just the start. Enrich that data and improve thefocus of your searches by adding your own knowledge about fields, events, andtransactions. Tag high-priority assets, and annotate events according to theirbusiness function or audit requirement. Give a set of related server errors asingle tag, and then devise searches that use that tag to isolate and report onevents involving that set of errors. Save and share frequently-run searches.Splunk surpasses traditional approaches to log management by mappingknowledge to data at search time, rather than normalizing the data up front. Itenables you to share searches, reports, and dashboards across the range ofSplunk apps being used in your organization.
3

Automate monitoring
Any search can be run on a schedule, and scheduled searches can be set up totrigger notifications or when specific conditions occur. This automated alertingfunctionality works across the wide range of components and technologiesthroughout your IT infrastructure--from applications to firewalls to accesscontrols. Have Splunk send notifications via email or SNMP to othermanagement consoles. Arrange for alerting actions to trigger scripts that performactivities such as restarting an application, server, or network device, or openinga trouble ticket. Set up alerts for known bad events and use sophisticatedcorrelation via search to find known risk patterns such as brute force attacks,data leakage, and even application-level fraud.
Analyze and report
Splunk's ability to quickly analyze massive amounts of data enables you tosummarize any set of search results in the form of interactive charts, graphs, andtables. Generate reports on-the-fly that use statistical commands to trend metricsover time, compare top values, and report on the most and least frequent typesof conditions. Visualize report results as interactive line, bar, column, pie,scatterplot and heat-map charts.
Splunk offers a variety of ways to share reports with team members and projectstakeholders. You can schedule reports to run at regular intervals and haveSplunk send each report to interested parties via email, print reports, save themto community collections of commonly-run reports, and add reports to specializeddashboards for quick reference.
4

Before you start the tutorial
What you need for this tutorial
Before you can begin to use Splunk, you need to download, install, and start up aSplunk instance. Hey, no worries -- this only takes about 5 minutes!
If you already have access to a running Splunk server, skip down to "Add data toSplunk" and start there.
System requirements
Splunk runs on most computing platforms, but this tutorial will focus specificallyon the Windows and Mac OS X versions of Splunk. Of course, whatever platformyou choose to run it on, it's still Splunk, and you should be able to follow alongfrom Start Splunk onwards.
While Splunk is software that you install on your local machine, you accessSplunk through a Web browser. Splunk supports the latest versions of Firefox,Chrome, and Safari, and Internet Explorer 6, 7, 8, and 9.
Splunk is a high-performance application, but for this tutorial, you really onlyneed an individual Windows or Mac machine that meets at least the followingspecifications:
Platform Minimum supported hardware capacityNon-Windows platforms 1x1.4 GHz CPU, 1 GB RAM
Windows platforms Pentium 4 or equivalent at 2Ghz, 2GB RAM
For the complete list of specifications, see the "System Requirements" topic inthe Installation manual.
Splunk licenses, briefly
Splunk runs with either an Enterprise license or a Free license. When youdownload Splunk for the first time, you get an Enterprise trial license that expiresafter 60 days. This trial license enables 500 MB/day indexing and all of theEnterprise features.
Once you install Splunk, you can run with the Enterprise trial license until itexpires, switch to the perpetual Free license (it's included!), or purchase an
5

Enterprise license.
Read more about "Types of Splunk Licenses" in the Admin Manual.
Download and install Splunk
Splunk supports installation on Unix, Windows, and Mac OS X operatingsystems. For the complete list of supported OSes, refer to the "SystemRequirements" topic in the Installation manual.
This topic briefly walks through how to download Splunk and install it on Linux,Windows, and Mac OS X. For all other supported OSes, refer to the"Step-by-step installation instructions" in the Installation manual.
Download Splunk
Splunk provides three install options for Linux: an RPM download for RedHat, aDEB package for Debian Linux, and a tar file install option. There are graphicalinstallers for the Windows and Mac OS X platforms. The Windows installer is anMSI file. There are two Mac OS X installers; for this tutorial, you'll use the DMGpackage.
Download the latest version of Splunk from the download page.
Note: If you're not logged into Splunk.com, clicking the download package willredirect you to a registration form. If you don't already have a Splunk.comaccount, sign up for one.
Install on Linux
Use the command line interface (CLI) to install Splunk on Linux operatingsystems. For information on how to access the CLI, see "About the CLI" in theAdmin manual.
By default, Splunk installs into the /opt/splunk directory on Linux.
To install the Splunk RPM, type the following into the CLI. Use the optional--prefix flag if you want to install Splunk into a different directory.
rpm -i --prefix=/opt/new_directory splunk_package_name.rpm
6

To install the Splunk DEB package, type the following into the CLI. You can onlyinstall the Splunk DEB into the default /opt/splunk directory.
dpkg -i splunk_package_name.deb
To install Splunk using the compressed tar file, expand the file into theappropriate directory using the tar command. The default install directory is/splunk in the current working directory. To install into a specific directory, suchas /opt/splunk, use the -C option:
tar xvzf splunk_package_name.tgz -C /opt
For more detailed instructions for installing Splunk on Linux, refer to theStep-by-step Linux installation instructions in the Installation manual.
Install on Windows
1. To start the installer, double-click the splunk.msi file.
2. In the Welcome panel, click Next.
3. Read the licensing agreement and check the box next to "I accept the terms inthe license agreement". Click Next to continue installing.
4. In the Customer Information, enter the requested details and click Next.
5. In the Destination Folder panel, click Change... to specify a different locationto install Splunk, or click Next to accept the default value.
Splunk is installed by default into the \Program Files\Splunk directory.
The Logon Information panel is displayed.
6. In the Logon Information panel, select Local system user and click Next.
If you want to learn about the other user option, refer to the detailed instructionsfor installing Splunk on Windows.
7. After you specify a user, the pre-installation summary panel is displayed. ClickInstall to proceed.
8. In the Installation Complete panel, check the boxes to Launch browser withSplunk and Create Start Menu Shortcut now.
7

9. Click Finish.
The installation completes, Splunk starts, and Splunk Web launches in asupported browser.
Install on Mac OS X
1. Double-click on the DMG file.
2. In the Finder window, double-click on splunk.pkg.
The Splunk installer opens and displays the Introduction.
3. Click Continue.
4. In the Select a Destination window, choose a location to install Splunk.
To install in the default directory, /Applications/splunk, click on theharddrive icon.
•
To select a different location, click Choose Folder...•
5. Click Continue.
The pre-installation summary displays. If you need to make changes,
Click Change Install Location to choose a new folder, or• Click Back to go back a step.•
6. Click Install.
The installation will begin. It may take a few minutes.
7. When your install completes, click Finish.
The installation completes, and now you're ready to start Splunk.
Start Splunk and launch Splunk Web
When you start Splunk, you're starting up two processes on your host, splunkdand splunkweb:
8

splunkd is a distributed C/C++ server that accesses, processes andindexes streaming machine data and handles search requests.
•
splunkweb is a Python-based application server that provides the SplunkWeb interface that you use to search and navigate your machine data andmanage your Splunk deployment.
•
Start Splunk on Windows
To start Splunk on Windows, you have three options:
Start Splunk from the Start menu.• Use the Windows Services Manager to start and stop splunkd andsplunkweb.
•
Open a cmd window and go to \Program Files\Splunk\bin and type•
> splunk start
Start Splunk on Unix and Mac OS X
Use the command line interface (CLI):
$SPLUNK_HOME/bin/splunk start
$SPLUNK_HOME is the directory where Splunk was installed. On Unix, that might be/opt/splunk; on Mac OS X that might be /Applications/splunk/bin/:
If you have administrator or root privileges you can simplify CLI usage by settinga Splunk environment variable. For more information about how to do this, referto"About the CLI" in the Admin manual.
Accept the Splunk license
After you run the start command, Splunk displays the license agreement andprompts you to accept the license before the startup continues.
After you accept the license, the startup sequence displays. At the very end,Splunk tells you where to access Splunk Web:
The Splunk Web interface is at http://localhost:8000
If you run into any problems starting up Splunk, see "Start Splunk for the firsttime" in the Installation manual.
9

Other commands you might need
If you need to stop, restart, or check the status of your Splunk server, use theseCLI commands:
$ splunk stop$ splunk restart$ splunk status
Launch Splunk Web
Splunk's interface runs as a Web server and after starting up, Splunk tells youwhere the Splunk Web interface is. Open a browser and navigate to that location.
Splunk Web runs by default on port 8000 of the host on which it's installed. If youare using Splunk on your local machine, the URL to access Splunk Web ishttp://localhost:8000.
If you are using an Enterprise license, launching Splunk for the first time takesyou to this login screen. Follow the message to authenticate with the defaultcredentials:
If you are using a Free license, you do not need to authenticate to use Splunk. Inthis case, when you start up Splunk you won't see this login screen. Instead, youwill be taken directly to Splunk Home or whatever is set as the default app foryour account.
When you sign in with your default password, Splunk asks you to create a newpassword.
10
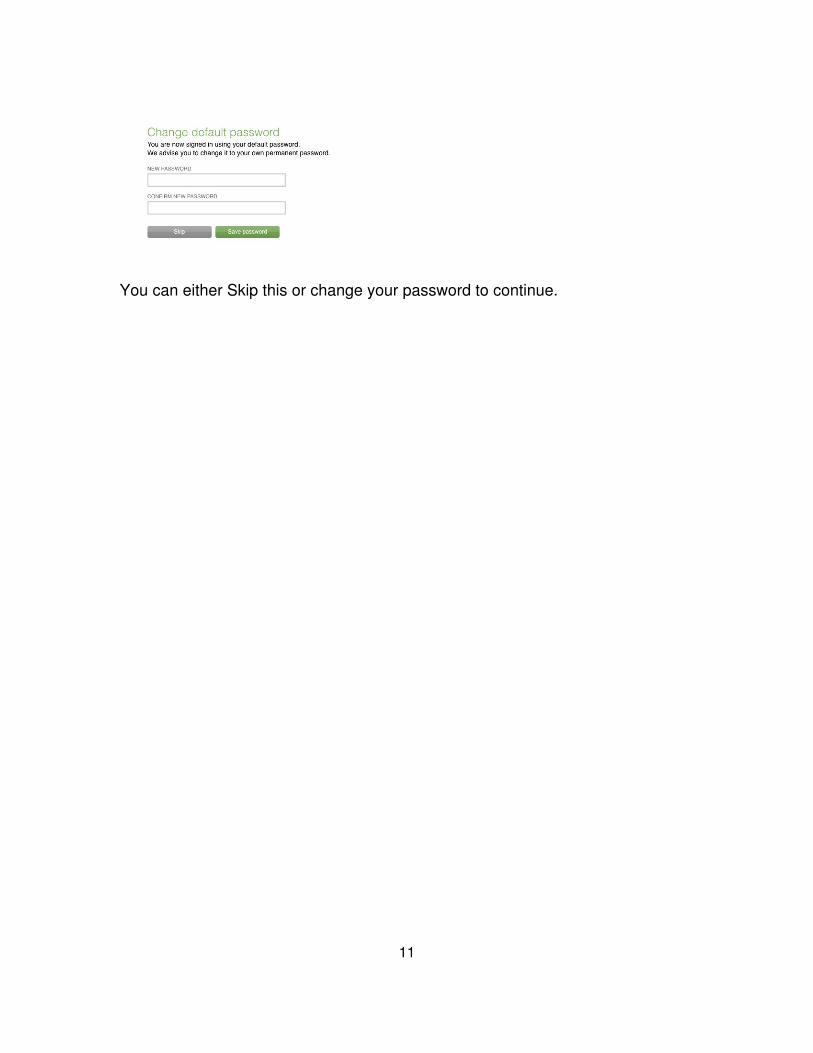
You can either Skip this or change your password to continue.
11
Get data into Splunk
About getting data in
When you use Splunk, you are working with data in a Splunk index.
Read on to:
Learn about the types of data Splunk indexes.• Add the sample data to your Splunk index.•
What types of data does Splunk index
Splunk can index any machine data from any source in real time. Point yourservers or network devices' syslog at Splunk, set up WMI polling, monitor anyapplication's logfiles, enable change monitoring on your filesystem or theWindows registry, schedule a script to grab system metrics, and more. No matterhow you get the data, or what format it's in, Splunk will index it the same way —without any specific parsers or adapters to write or maintain. It stores both theraw data and the rich index in an efficient, compressed, filesystem-baseddatastore — with optional data signing and auditing if you need to prove dataintegrity.
This tutorial only discusses one type of input, uploading a local file, which is allyou need to run through the tutorial. For information about all other type of datainputs Splunk can handle and how to add them, refer to the Getting Data Inmanual beginning with the topic, "What Splunk can index".
Ways to get data into Splunk
When adding data to Splunk, you have a variety of flexible input methods tochoose from: Splunk Web, Splunk's CLI, and the inputs.conf configuration file.
You can add most data sources using Splunk Web. If you have access to theconfiguration files, you can use inputs.conf, which has more extensiveconfiguration options. Any changes you make using Splunk Web or the SplunkCLI are written to inputs.conf.
The "Add the sample data to your Splunk index" topic briefly outlines the generalprocedure for using Splunk Web to add new data. For more specific information
12

about configuring inputs, see the "What Splunk can index" chapter in the GettingData In manual.
Where does Splunk store the data
You'll notice that we use the term "index" to refer to a couple of different things.First and foremost, when Splunk indexes new data, it processes the raw data tomake it searchable. Second, when we talk about Splunk indexes, we mean thedata store where Splunk stores all or parts of the data. So, when you index newdata, Splunk stores the data in indexes. Additionally, when you search, you'rematching against data in one or multiple indexes.
Apps and inputs
When you add an input to Splunk, that input gets added relative to the app you'rein. Some apps write input data to their specific index (for example, the SplunkApp for Unix and Linux uses the 'os' index). If you're not finding data that you'recertain is in Splunk, be sure that you're searching the right index.
For the Splunk user, this is all you need to know before you begin searching andlearning more about your data. If you want to read more about managing thedata in your indexes, see the "Indexing overview" chapter in the ManagingIndexers and Clusters manual.
Get the sample data into Splunk
This topic assumes that you have already downloaded, installed, and started aSplunk server. If you haven't yet, go back to the previous topic for instructions todo that.
Once you've started and logged into Splunk, you need to give it data that you cansearch. This topic walks you through downloading the sample dataset andadding it into Splunk.
Download the sample data file
This tutorial uses sample data from an fictitious online store, the Flower & Giftshop, to teach you about using Splunk. The sample data includes:
Apache web server logs• mySQL database logs•
13
You can feed Splunk data from files and directories, network ports, and customscripts, but for this tutorial, you will upload a compressed file directly to Splunk.Also, this tutorial is designed to be completed in a matter of hours. But, if youwant to spread it out over a few days, just download a new sample data file andadd it!
To proceed with this tutorial, download (but do not uncompress) the sampledata from here: sampledata.zip This sample data file is updated daily.
Add the sample data into Splunk
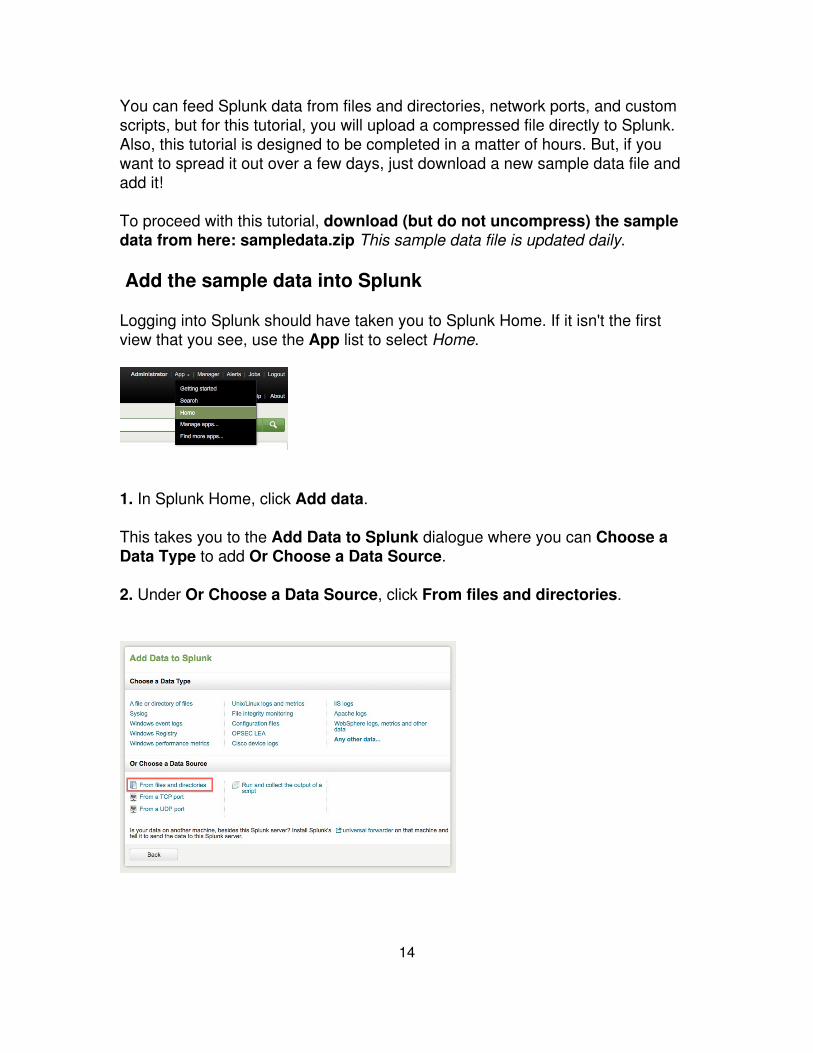
Logging into Splunk should have taken you to Splunk Home. If it isn't the firstview that you see, use the App list to select Home.
1. In Splunk Home, click Add data.
This takes you to the Add Data to Splunk dialogue where you can Choose aData Type to add Or Choose a Data Source.
2. Under Or Choose a Data Source, click From files and directories.
14
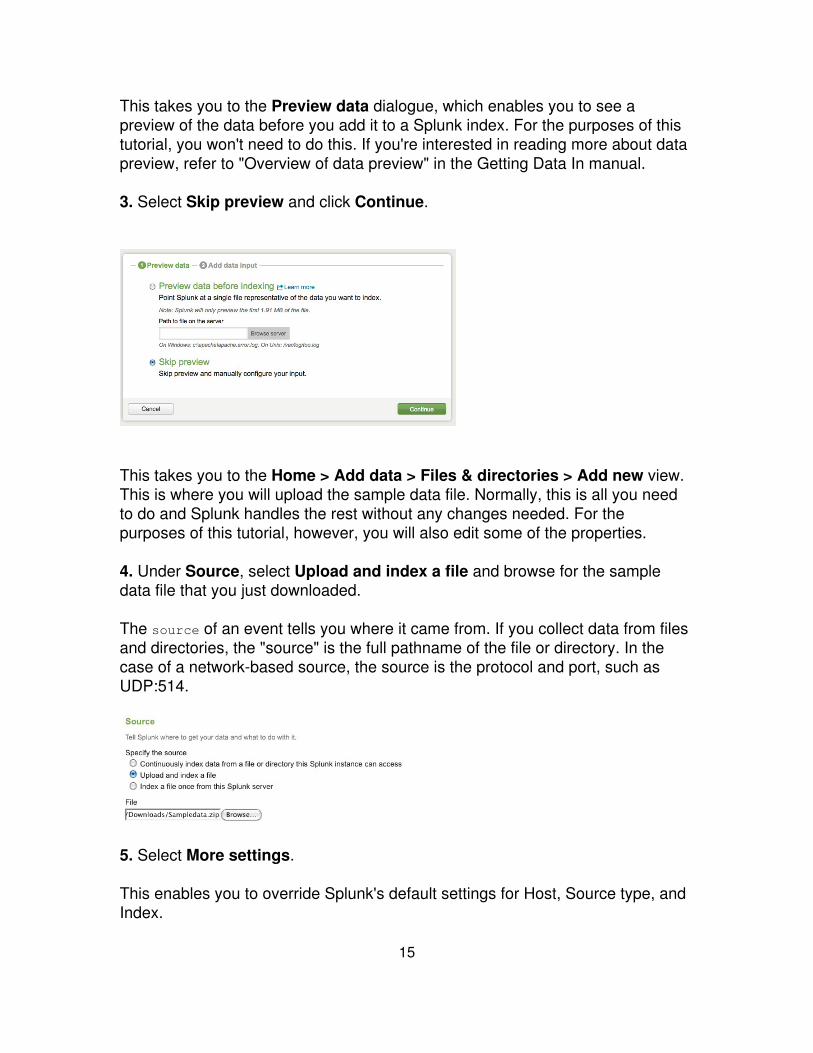
This takes you to the Preview data dialogue, which enables you to see apreview of the data before you add it to a Splunk index. For the purposes of thistutorial, you won't need to do this. If you're interested in reading more about datapreview, refer to "Overview of data preview" in the Getting Data In manual.
3. Select Skip preview and click Continue.
This takes you to the Home > Add data > Files & directories > Add new view.This is where you will upload the sample data file. Normally, this is all you needto do and Splunk handles the rest without any changes needed. For thepurposes of this tutorial, however, you will also edit some of the properties.
4. Under Source, select Upload and index a file and browse for the sampledata file that you just downloaded.
The source of an event tells you where it came from. If you collect data from filesand directories, the "source" is the full pathname of the file or directory. In thecase of a network-based source, the source is the protocol and port, such asUDP:514.
5. Select More settings.
This enables you to override Splunk's default settings for Host, Source type, andIndex.
15
An event's host value is typically the hostname, IP address, or fully qualifieddomain name of the network host from which the event originated. If you take alook at the Sampledata.zip file, it contains four directories (folders): three of thefolders are named for Apache web servers and one is a MySQL server.
The source type of an event tells you what kind of data it is, usually based onhow it's formatted. Examples of source types are access_combined orcisco_syslog. This classification lets you search for the same type of data acrossmultiple sources and hosts. For more information about how Splunk source typesyour data, read "Why source types matter" in the Getting Data In manual.
The index setting tells Splunk where to put the data. By default, it's stored inmain, but you might want to consider partitioning your data into different indexesif you have many types. For more information about creating custom indexes,read "Set up multiple indexes" in the Managing Indexers and Clusters manual.
For this tutorial, you're just going to change the Host setting.
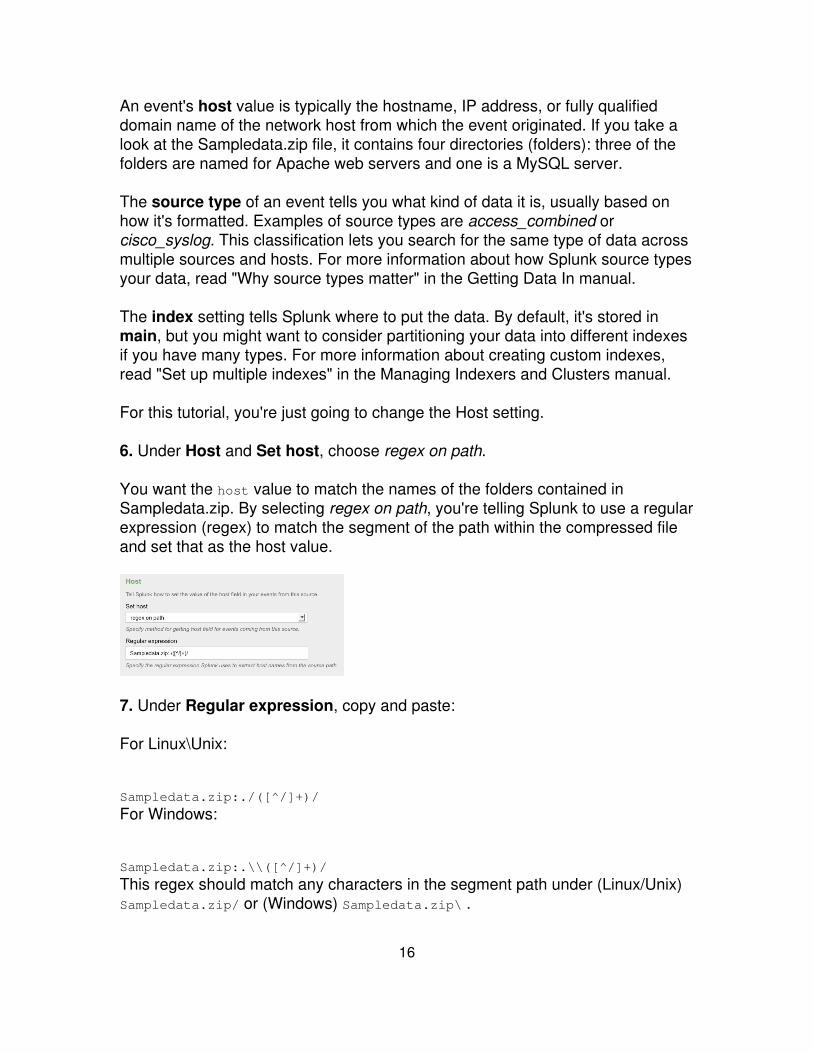
6. Under Host and Set host, choose regex on path.
You want the host value to match the names of the folders contained inSampledata.zip. By selecting regex on path, you're telling Splunk to use a regularexpression (regex) to match the segment of the path within the compressed fileand set that as the host value.
7. Under Regular expression, copy and paste:
For Linux\Unix:
Sampledata.zip:./([^/]+)/
For Windows:
Sampledata.zip:.\\([^/]+)/
This regex should match any characters in the segment path under (Linux/Unix)Sampledata.zip/ or (Windows) Sampledata.zip\ .
16

8. Click Save.
When it's finished, Splunk displays a message saying the upload was successful.
Next steps
Click Start searching and proceed to the next topic in this tutorial to look at yourdata in the Search app.
17

Search and search language
About this chapter
Now that you added the sample data into Splunk, you're ready to start searchingthat data.
This chapter of the Splunk Tutorial:
Introduces the Search app.• Walks you through searching in Splunk, beginning with keywords andphrases, before moving on to specifying time ranges, fields, and using thesearch language.
•
Discusses how to save a search and access it again.• Provides more search examples, including how to write a subsearch,enrich events with events with field lookups, etc.
•
First, let's learn about the Search app.
The search app
This topic assumes you've just added the sample data for the online Flower &Gift shop. If you haven't, go back to the add data tutorial to get it beforeproceeding.
Once you have the sample data in Splunk, you're ready to start searching. Thistopic introduces you to the Search app, which is Splunk's default interface forsearching and analyzing data. If you're already familiar with the search interface,you can skip ahead and start searching.
Find the Search app
Access the Search app from anywhere in Splunk from the App list in the systemnavigation bar located at the upper right corner.
18
If the App list is not available, click the << Back to Home link at the top leftcorner of the page:
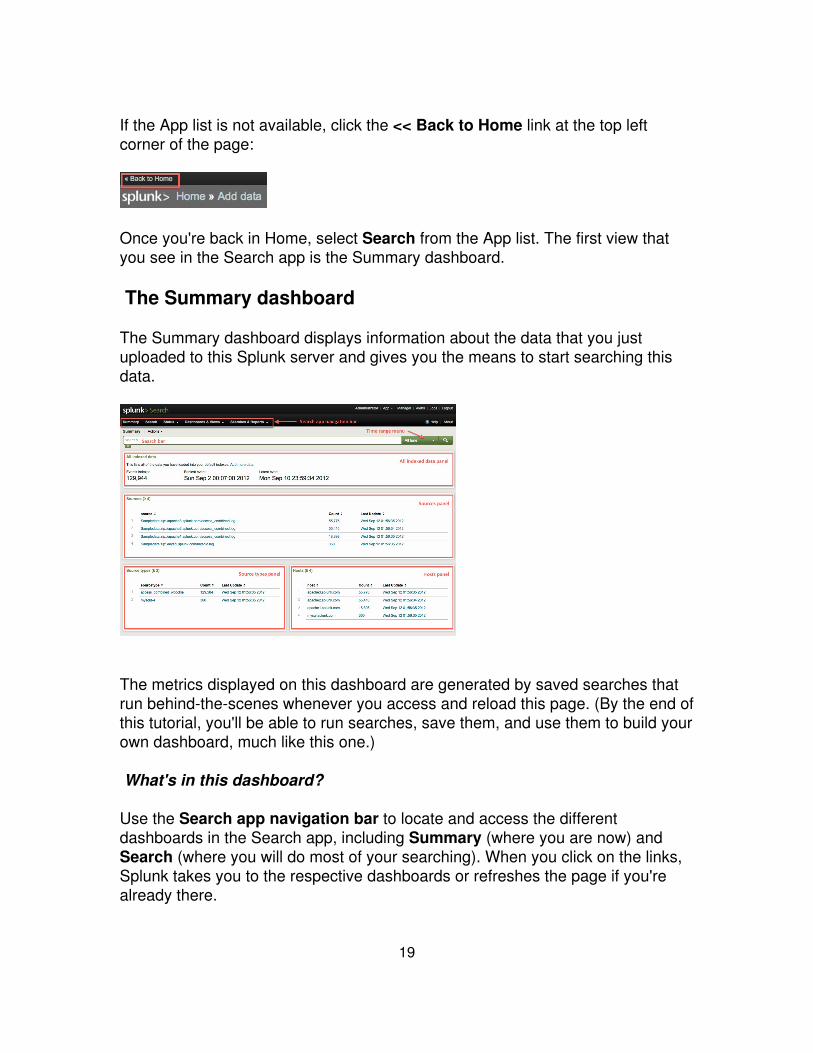
Once you're back in Home, select Search from the App list. The first view thatyou see in the Search app is the Summary dashboard.
The Summary dashboard
The Summary dashboard displays information about the data that you justuploaded to this Splunk server and gives you the means to start searching thisdata.
The metrics displayed on this dashboard are generated by saved searches thatrun behind-the-scenes whenever you access and reload this page. (By the end ofthis tutorial, you'll be able to run searches, save them, and use them to build yourown dashboard, much like this one.)
What's in this dashboard?
Use the Search app navigation bar to locate and access the differentdashboards in the Search app, including Summary (where you are now) andSearch (where you will do most of your searching). When you click on the links,Splunk takes you to the respective dashboards or refreshes the page if you'realready there.
19

Menu items in the navigation bar:
Status: Use this menu to access dashboards that monitor the status ofindex and server activities on your Splunk instance.
•
Dashboards & Views: Use this menu to access other dashboards in theSearch app.
•
Searches & Reports: Use this menu to access and manage all of yoursaved searches and reports.
•
Other items in the dashboard:
Search bar Use the search bar to type in your search string.• Time range selector: Select a time range over which to retrieve events.• All indexed data panel: Displays metrics about your indexed event data.which include the total number of events you have in your Splunkindex(es) and the timestamps of the earliest and latest indexed event. Italso tells you when this data was last refreshed (or when you last reloadedthis dashboard).
•
Sources panel: Displays the top sources from the data on your Splunkserver.
•
Sourcetypes panel: Displays the top source types from your Splunkserver's data.
•
Hosts: Displays the top hosts from your Splunk server's data.•
Kick off a search
If you're using a freshly installed Splunk server for this tutorial, you'll only see thesample data files that you just uploaded. Because it's a one-time upload of a file,this data will not change. When you add more data, there will be moreinformation on this dashboard. If you add data inputs that point to sources thatare not static (such as log files that are being written to by applications), thenumbers on the Summary page will change as more data comes in from yoursource(s).
If you're using a shared or pre-installed Splunk server that is deployed in anenterprise environment, you'll probably see much more information on thisdashboard.
1. Take a closer look at the Summary dashboard.
In the Sources panel, you should see three Apache Web server logs and amySQL database log for the online Flower & Gift shop data that you justuploaded. If you're familiar with Apache Web server logs, you might recognize
20
the access_combined_wcookie Source type as one of the log formatsassociated with Web access logs. All the data for this source type should giveyou information about people who access the Flower & Gift shop website.
Searching in Splunk is very interactive. Although you have a search bar in theSummary dashboard, you don't need to type anything into it just yet. Each of thesources, sourcetypes, and hosts listed in the Summary dashboard is a link thatwill kick off a search when you click on them.
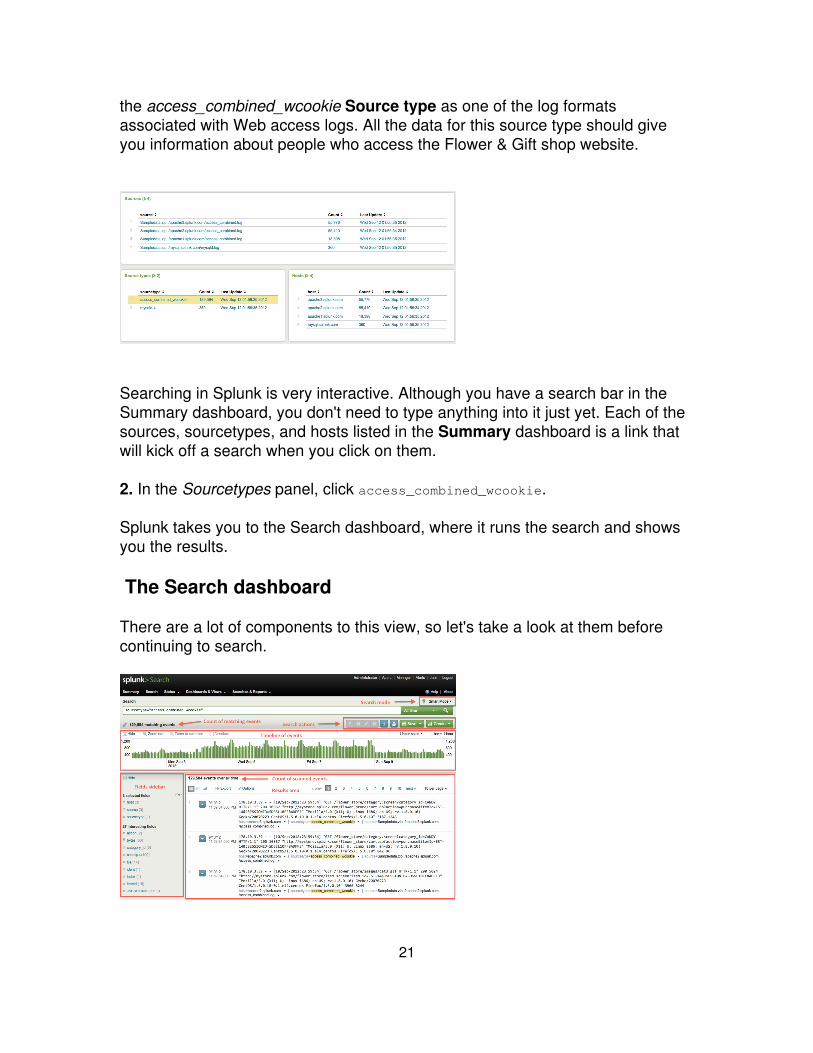
2. In the Sourcetypes panel, click access_combined_wcookie.
Splunk takes you to the Search dashboard, where it runs the search and showsyou the results.
The Search dashboard
There are a lot of components to this view, so let's take a look at them beforecontinuing to search.
21

What's in this Search dashboard?
The search bar and time range picker should be familiar to you -- it was also inthe Summary dashboard. But, now you also see a count of events, the timeline,the fields menu, and the list of retrieved events or search results.
Search mode: Use Search mode to control the search experience. Youcan set it to speed up searches by cutting down on the event data itreturns (Fast mode), or you can set it to return as much event informationas possible (Verbose mode). In Smart mode (the default setting) itautomatically toggles search behavior based on the type of search you'rerunning. See "Set search mode to adjust your search experience" in theSearch Manual for more information.
•
Search actions: Use these buttons to control the search job before thesearch completes, or perform actions on the results after the searchcompletes. If the button is not available, it will be inactive and greyed out.
If you're running a search that takes a long time to complete, youmight want to: Send to background, Pause, Finalize, Cancel, orInspect.
♦
After the search completes you can Print the results.♦ Use the Save menu to access save options for the search andsearch results.
♦
Use the Create menu to create dashboards, alerts, reports, etc.♦
•
Count of matching and scanned events: As the search runs, Splunkdisplays two running counts of the events as it retrieves them: one is amatching event count and the other is the count of events scanned. Whenthe search completes, the count that appears above the timeline displaysthe total number of matching events. The count that appears below thetimeline and above the events list, tells you the number of events duringthe time range that you selected. As we'll see later, this number changeswhen you drill down into your investigations.
•
Timeline of events: The timeline is a visual representation of the numberof events that occur at each point in time. As the timeline updates withyour search results, you might notice clusters or patterns of bars. Theheight of each bar indicates the count of events. Peaks or valleys in thetimeline can indicate spikes in activity or server downtime. Thus, thetimeline is useful for highlighting patterns of events or investigating peaksand lows in event activity. The timeline options are located above thetimeline. You can zoom in, zoom out, and change the scale of the chart.
•
Fields sidebar: When you index data, Splunk by default automaticallyrecognizes and extracts information from your data that is formatted asname and value pairs, which we call fields. When you run a search,Splunk lists all of the fields it recognizes in the fields sidebar next to your
•
22
search results. You can select other fields to show in your events. Also,you can hide this sidebar and maximize the results area.
selected fields are fields that are set to be visible in your searchresults. By default, host, source, and sourcetype are shown.
♦
interesting fields are other fields that Splunk has extracted fromyour search results.
♦
Results area: The results area, located below the timeline, displays theevents that Splunk retrieves to match your search.
By default, the results are displayed as a list of events, orderedfrom most recent. You can use the icons at the upper left of thepanel to view the results as a table (click on the Table icon) or chart(click on the Chart icon).
♦
If you want to export the search results, use the Export button. Youcan specify the output format as CSV, raw events, XML, or JSON.
♦
Select Options to change how the events display in the resultsarea, for example: wrap results, show or hide row numbers, etc.
♦
•
Start searching
This topic walks you through simple searches using the Search interface. Ifyou're not familiar with the search interface, go back to the search app tutorialbefore proceeding.
The Backstory: You are a member of the Customer Support team for the onlineFlower & Gift shop. This is your first day on the job. You want to learn some moreabout the shop. Some questions you want answered are:
What does the store sell? How much does each item cost?• How many people visited the site? How many bought something today?• What is the most popular item that is purchased each day?•
It's your first day of work with the Customer Support team for the online Flower &Gift shop. You're just starting to dig into the Web access logs for the shop, whenyou receive a call from a customer who complains about trouble buying a gift forhis girlfriend--he keeps hitting a server error when he tries to complete apurchase. He gives you his IP address, 10.2.1.44.
Keyword searches
Everything in Splunk is searchable. You don't have to be familiar with theinformation in your data because searching in Splunk is free-form and as simple
23

as typing keywords into the search bar and hitting Enter (or clicking that greenarrow at the end of the search bar).
Type ahead, or Search assistant
In the previous topic, you ran a search from the Summary dashboard by clickingon the Web access source type (access_combined_wcookie). Use that samesearch to find this customer's recent access history at the online Flower & Giftshop.
1. Type the customer's IP address into the search bar:
sourcetype="access_combined_wcookie" 10.2.1.44
As you type into the search bar, Splunk's search assistant opens.
Search assistant shows you typeahead, or contextual matches and completionsfor each keyword as you type it into the search bar. These contextual matchesare based on what's in your data. The entries under matching terms update asyou continue to type because the possible completions for your term change aswell.
Search assistant also displays the number of matches for the search term. Thisnumber gives you an idea of how many search results Splunk will return. If aterm or phrase doesn't exist in your data, you won't see it listed in searchassistant.
For now, ignore everything on the right panel next to the contextual help. Searchassistant has more uses once you start learning the search language, as you'llsee later. And, if you don't want search assistant to open, click "turn offauto-open" and close the window using the green arrow below the search bar.
24

More keyword searches
2. If you didn't already, run the search for the IP address. (Hit Enter.)
Splunk retrieves the customer's access history for the online Flower & Gift shop.The timeline also updates, but we'll get to that later. For now, let's just take alook at the search results.
Each time you run a search, Splunk highlights in the search results what youtyped into the search bar.
3. Skim through the search results.
You should recognize words and phrases in the events that relate to the onlineshop (flower, product, purchase, etc.).
The customer mentioned that he was in the middle of purchasing a gift, so let'ssee what we find by searching for "purchase".
4. Type purchase into the search bar and run the search:
sourcetype="access_combined_wcookie" 10.2.1.44 purchase
When you search for keywords, your search is not case-sensitive and Splunkretrieves the events that contain those keywords anywhere in the raw text of theevent's data.
25

Among the results that Splunk retrieves are events that show each time thecustomer tried to buy something from the online store. Looks like he's been busy!
Use Boolean operators
If you're familiar with Apache server logs, in this case the access_combinedformat, you'll notice that most of these events have an HTTP status of 200, orSuccessful. These events are not interesting for you right now, because thecustomer is reporting a problem.
Splunk supports the Boolean operators: AND, OR, and NOT. When youinclude Boolean expressions in your search, the operators have to be capitalized.
5. Use the Boolean NOT operator to quickly remove all of these Successful pagerequests. Type in:
sourcetype="access_combined_wcookie" 10.2.1.44 purchase NOT 200
The AND operator is always implied between search terms. So the search inStep 5 is the same as:
sourcetype="access_combined_wcookie" AND 10.2.1.44 AND purchase NOT 200
You notice that the customer is getting HTTP server (503) and client (404) errors.But, he specifically mentioned a server error, so let's quickly remove events thatare irrelevant.
Another way to add Boolean clauses quickly and interactively to your search is touse your search results. Splunk lets you highlight and select any segment from
26

within your search results to add, remove, and exclude them quickly andinteractively using your keyboard and mouse:
To add more search terms, highlight and click the word or phrase youwant from your search results. (This is demonstrated in Step 6.)
•
To remove a term from your search, click a highlighted instance of thatword or phrase in your search results.
•
To exclude events from your search results, alt-click on the term you don'twant Splunk to match.
•
6. Mouse-over an instance of "404" in your search results and alt-click.
This updates your search string with "NOT 404" and filters out all the events thatcontain the term.
From these results, you see each time that the customer attempted to complete apurchase and received the server error. Now that you have confirmed what thecustomer reported, you can continue to drill down to find the root cause.
Read more about searching
When you run a search, you're implicitly using the search command to retrieveevents from a Splunk index(es). The search command enables you to usekeywords, phrases, fields, boolean expressions, and comparison expressions tospecify exactly which events you want to retrieve. This topic discussed searchingwith keywords and boolean expressions. Later topics in the tutorial will go overusing time, fields, and the search language.
What's not discussed in this tutorial is using comparison expressions andoperators for exact phrase matching, TERM() and CASE(). Read more aboutthese methods in "Use the search command" in the Retrieve events chapter ofthe Search Manual.
27

Next steps
When you're ready to proceed, go to the next topic to learn how to investigateand troubleshoot interactively using the timeline in Splunk.
Use the timeline
This topic assumes that you're comfortable running simple searches to retrieveevents. If you're not sure, go back to the last topic where you searched withkeywords, wildcards, and Booleans to pinpoint an error.
About timeline options
The timeline is located below the search bar and time range selector. At the topof the timeline are options which you can use to
Hide the timeline.• Zoom out to see more events in the timeline (this changes the time rangedisplayed in the timeline).
•
Zoom to selection if you selected a subset of the events (this alsochanges the time range displayed in the timeline).
•
Change the scale of the timeline from the default Linear scale to Logscale.
•
Next to the timeline scale is a legend that tells you the span of each bardisplayed on the timeline. The span will depend on the time range of the search;for example, if you searched over 24 hours, the span might be 1 bar = 1 hour.And then, if you Zoom out, time timeline displays more events, with a span of 1bar = 1 day.
Investigate with the timeline
Back at the Flower & Gift shop, let's continue with the customer (10.2.1.44) youwere assisting. He reported an error while purchasing a gift for his girlfriend. Youconfirmed his error, and now you want to find the cause of it.
Continue with the last search, which showed you the customer's failed purchaseattempts.
1. Search for:
28
sourcetype="access_combined_wcookie" 10.2.1.44 purchase NOT 200 NOT 404
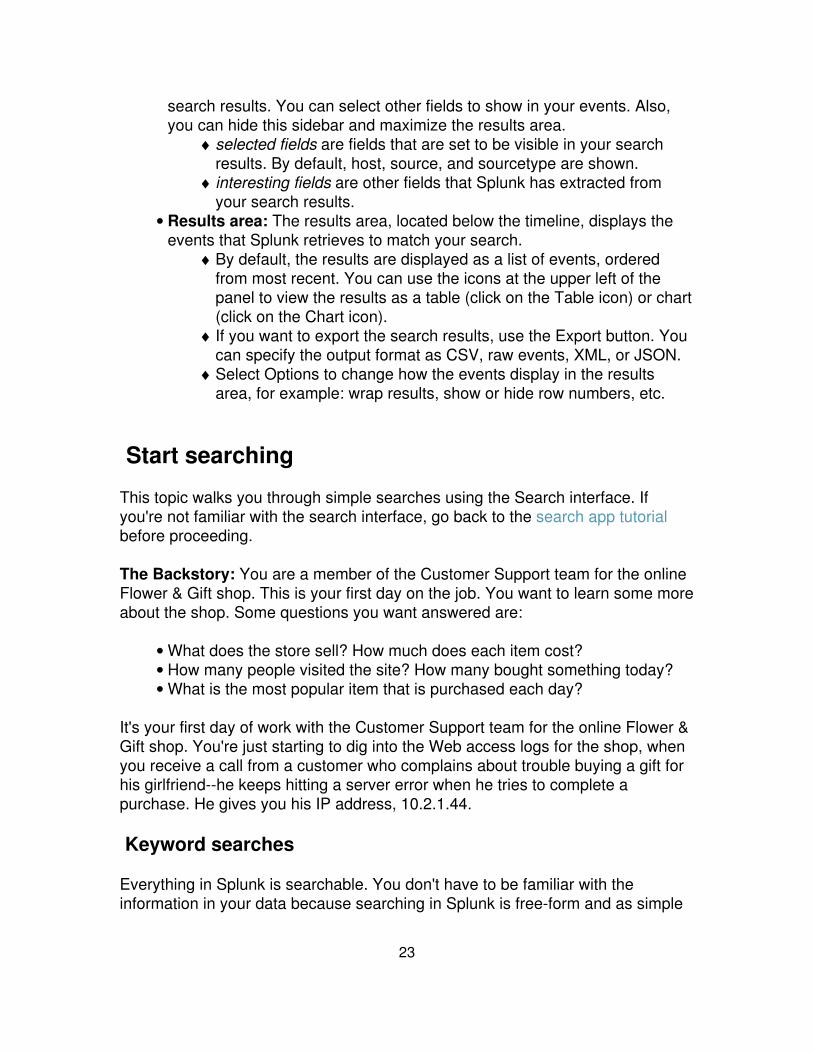
In the last topic, you really just focused on the search results listed in the eventsviewer area of this dashboard. Now, let's take a look at the timeline.
The location of each bar on the timeline corresponds to an instance when theevents that match your search occurred. If there are no bars at a time period, noevents were found then.
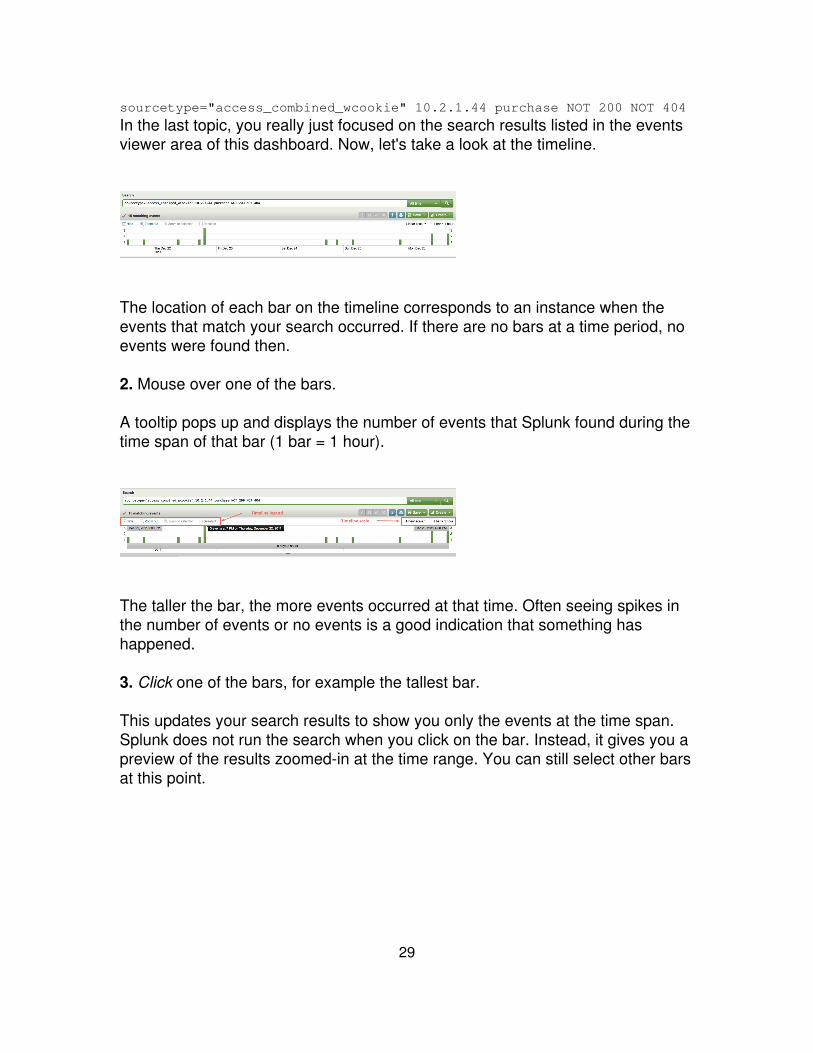
2. Mouse over one of the bars.
A tooltip pops up and displays the number of events that Splunk found during thetime span of that bar (1 bar = 1 hour).
The taller the bar, the more events occurred at that time. Often seeing spikes inthe number of events or no events is a good indication that something hashappened.
3. Click one of the bars, for example the tallest bar.
This updates your search results to show you only the events at the time span.Splunk does not run the search when you click on the bar. Instead, it gives you apreview of the results zoomed-in at the time range. You can still select other barsat this point.
29

One hour is still a wide time period to search, so let's narrow the search downmore.
4. Double-click on the same bar.
Splunk runs the search again and retrieves only events during that one hourspan you selected.
You should see the same search results in the Event viewer, but, notice that thesearch overrides the time range picker and it now shows "Custom time". (You'llsee more of the time range picker later.) Also, each bar now represents oneminute of time (1 bar = 1 min).
5. Double-click another bar.
Once again, this updates your search to now retrieve events during that oneminute span of time. Each bar represents the number of events for one second oftime.
30

Now, you want to expand your search to see everything else, if anything, thathappened during this second.
6. Without changing the time range, replace your previous search in the searchbar with:
*
Splunk supports using the asterisk (*) wildcard to search for "all" or to retrieveevents based on parts of a keyword. Up to now, you've just searched for Webaccess logs. This search tells Splunk that you want to see everything thatoccurred at this time range:
This search returns events from all the logs on your server. You expect to seeother user's Web activity--perhaps from different hosts. But instead you see acluster of mySQL database errors. These errors were causing your customer'spurchases to fail. Now, you can report this issue to someone in the IT Operationsteam.
Next steps
When you're ready, proceed to the next topic to learn about searching overdifferent time ranges.
Change the time range
This topic assumes that you're familiar with running ad hoc searches and usingthe timeline. If you're not sure, review the previous topics on searching and usingthe timeline.
31
This topic shows you how to narrow the scope of your investigative searchingover any past time range. Out-of-the box, Splunk searches across all of yourdata; that is, the default time range for a search is across "All time". If you have alot of data, searching on this time range when you're investigating an event thatoccurred 15 minutes ago, last night, or the previous week just means that Splunkwill take a long time to retrieve the results that you want to see. If you have someknowledge about when an event occurred, use it to target your search to thattime period for faster results.
Select a time range
Back at Customer Support for the online Flower & Gift shop, it's the start of a newday. Before you make yourself a cappuccino, run a quick search to see if therewere any recent issues you should be aware of.
1. Return to the Search dashboard and type in the following search over all time:
error OR failed OR severe OR (sourcetype=access_* (404 OR 500 OR 503))
Notice a few changes to the way this search is written:
It uses parentheses to group together expressions for more complicatedsearches. When evaluating Boolean expressions, Splunk performs theoperations within the innermost parentheses first, followed by the next pairout. When all operations within parentheses are completed, Splunkevaluates OR clauses, then, AND or NOT clauses.
•
Also, it uses the wildcarded shortcut, "access_*", to match the Webaccess logs. If you have different source types for your Apache serverlogs, such as access_common and access_combined, this will match themall.
•
This searches for general errors in your event data over "All time" (which, in thecase of this sample data is over the course of the last week). Instead of matchingjust one type of log, this searches across all the logs in your index. It matchesany occurrence of the words "error", "failed", or "severe" in your event data.Additionally, if the log is a Web access log, it looks for HTTP error codes, "404","500", or "503".
32
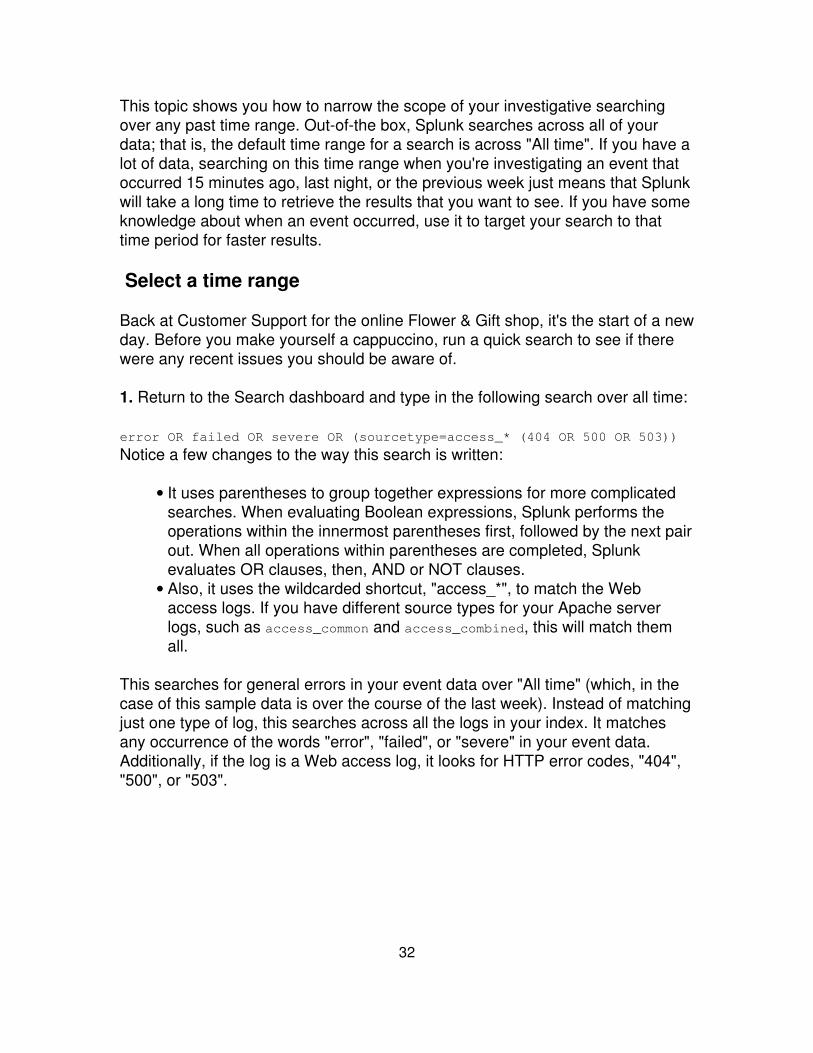
This search returns a significant amount of errors. You're not interested inknowing what happened over All time, even if it's just the course of a week. Youjust got into work, so you want to know about more recent activity, such asovernight or the last hour. But, because of the limitations of this dataset, let's lookat Yesterday's errors.
2. Click on the Time range menu and select Other > Yesterday.
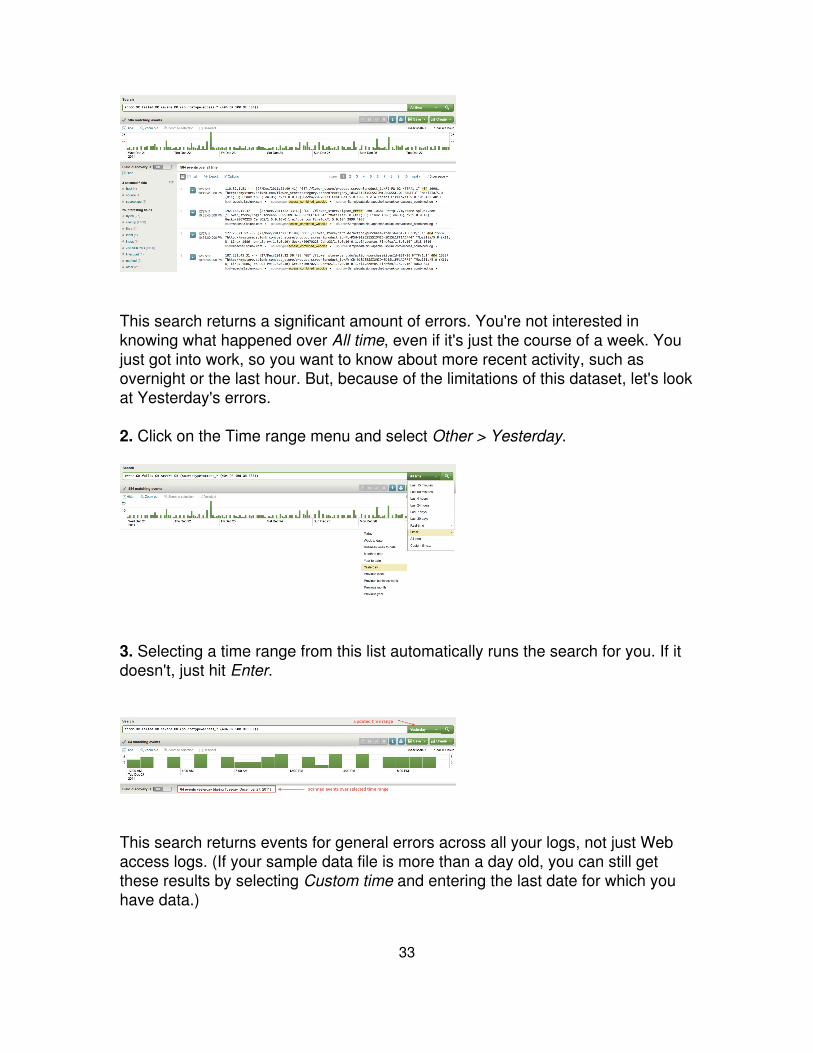
3. Selecting a time range from this list automatically runs the search for you. If itdoesn't, just hit Enter.
This search returns events for general errors across all your logs, not just Webaccess logs. (If your sample data file is more than a day old, you can still getthese results by selecting Custom time and entering the last date for which youhave data.)
33
Scroll through the search results. There are more mySQL database errors andsome 404 errors. Now... ask the intern to bring you a cup of coffee while youcontact the web team about the 404 errors and the IT Operations team about therecurring server errors.
More time range options
Splunk provides options for users to define a custom time range to search orselect to search a continuous stream of incoming events.
Real-time enables searching forward in time against a continuous streamof live incoming event data. Because the sample data is a one-timeupload, running a real-time search will not give us any results right now.We will explore this option later. For more information about real-timesearches and how to run them, read "About real-time searches andreports" in the Search Manual.
•
Custom time... pops up a new window and enables you to define yourown time ranges based on specific dates, relative dates, real-timewindows, or using the search language. For more information about howto define custom time ranges, read "Specify time modifiers in your search"in the Search Manual.
•
Next steps
Up to now, you've run simple searches that matched the raw text in your events.You've only scratched the surface of what you can do in Splunk. When you'reready to proceed, go on to the next topic to learn about fields and how to searchwith fields.
Use fields to search
This topic assumes you know how to run simple searches and use the timerange picker and timeline. If you're not sure, review the previous topics,beginning with Start searching.
You can learn a lot about your data from just running ad hoc searches, usingnothing more than keywords and the time range. But you can't take fulladvantage of Splunk's more advanced searching and reporting features withoutunderstanding what fields are and how to use them. This part of the tutorial willfamiliarize you with:
34
default fields and other fields that Splunk automatically extracts• using the fields sidebar and Fields dialog to find helpful fields• searching with fields•
Let's return to the happenings at the online Flower and Gift shop. You spent themorning investigating some general issues and reporting the problems you foundto other teams. You feel pretty good about what you've learned about the onlineshop and its customers, but you want to capture this and share it with your team.
The best way to do this is to use fields.
Briefly, about fields
What are fields
Fields exist in machine data in many forms. Often, a field is a value (with a fixed,delimited position on the line) or a name and value pair, where there is a singlevalue to each field name. A field can also be multivalued; that is, it appears morethan once in an event and has a different value for each appearance.
In Splunk, fields are searchable name/value pairings that distinguish one eventfrom another because not all events will have the same fields and field values.Fields enable you to write more tailored searches to retrieve the specific eventsthat you want. Fields also enable you to take advantage of the search language,create charts, and build reports.
Some examples of fields are clientip for IP addresses accessing your Webserver, _time for the timestamp of an event, and host for domain name of aserver. One of the more common examples of multivalue fields is email addressfields. While the "From" field will contain only a single email address, the "To"and "Cc" fields may have one or more email addresses associated with them.
For more information (and there's a lot more), read About fields in the KnowledgeManager manual.
Extracted fields
Splunk extracts fields from event data twice. It extracts default and other indexedfields during event processing when that data is indexed. And it extracts adifferent set of fields at search time, when you run a search. Read more about"Index time versus search time" in the Managing Indexers and Clusters manual.
35

At index time, Splunk automatically finds and extracts default fields for eachevent it processes. These fields include host, source, and sourcetype (which youshould already be familiar with). For a complete list of the default fields, see "Usedefault fields" in the Knowledge Manager Manual.
Splunk also extracts certain fields at search time--when you run a search. You'llsee some examples of these searches later. For more information, read the"Overview of search-time field extractions" in the Knowledge Manager manual.
The fields sidebar and dialog
1. Go back to the Search dashboard and search for web access activity. SelectOther > Yesterday from the time range picker:
sourcetype="access_*"
You were actually using fields all along! Each time you searched forsourcetype=access_*, you told Splunk to only retrieve events from your webaccess logs and nothing else.
To search for a particular field, specify the field name and value:fieldname="fieldvalue"
sourcetype is a field name and access_combined_wcookie is a field value. Here,the wildcarded value is used to match all field values beginning with access_(which would include access_common, access_combined, andaccess_combined_wcookie) .
Note: Field names are case sensitive, but field values are not!
2. Scroll through the search results.
If you're familiar with the access_combined format of Apache logs, you willrecognize some of the information in each event, such as:
IP addresses for the users accessing the website.• URIs and URLs for the page request and referring page.• HTTP status codes for each page request.• Page request methods.•
36

As Splunk retrieves these events, the Fields sidebar updates with selected fieldsand interesting fields. These are the fields that Splunk extracted from your data.
Notice that default fields host, source, and sourcetype are selected fields and aredisplayed in your search results:
3. Scroll through interesting fields to see what else Splunk extracted.
You should recognize the field names that apply to the Web access logs. Forexample, there's clientip, method, and status. These are not default fields;they have (most likely) been extracted at search time.
4. Click the Edit link in the fields sidebar.
The Fields dialogue opens and displays all the fields that Splunk extracted.
Available Fields are the fields that Splunk identified from the events inyour current search (some of these fields were listed under interestingfields).
•
Selected Fields are the fields you picked (from the available fields) toshow in your search results (by default, host, source, and sourcetypeare selected).
•
5. Scroll through the list of Available Fields.
37
You're already familiar with the fields that Splunk extracted from the Web accesslogs based on your search. You should also see other default fields that Splunkdefined--some of these fields are based on each event's timestamp (everythingbeginning with date_*), punctuation (punct), and location (index).
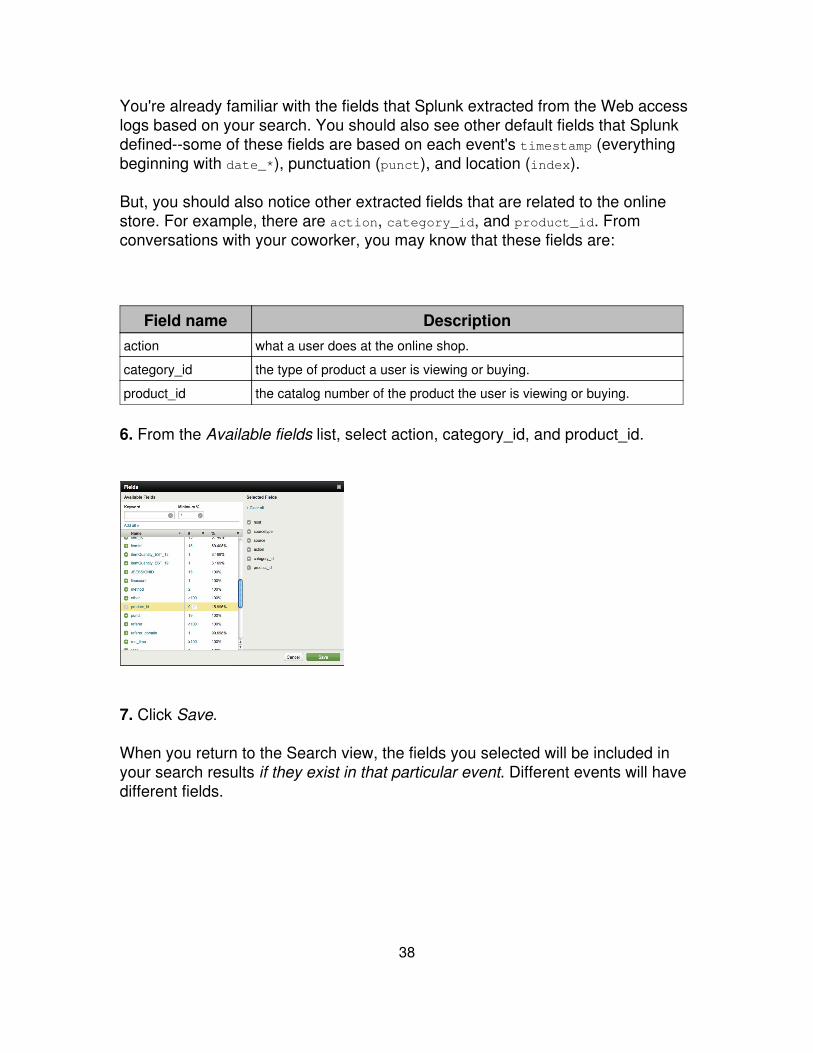
But, you should also notice other extracted fields that are related to the onlinestore. For example, there are action, category_id, and product_id. Fromconversations with your coworker, you may know that these fields are:
Field name Descriptionaction what a user does at the online shop.
category_id the type of product a user is viewing or buying.
product_id the catalog number of the product the user is viewing or buying.
6. From the Available fields list, select action, category_id, and product_id.
7. Click Save.
When you return to the Search view, the fields you selected will be included inyour search results if they exist in that particular event. Different events will havedifferent fields.
38
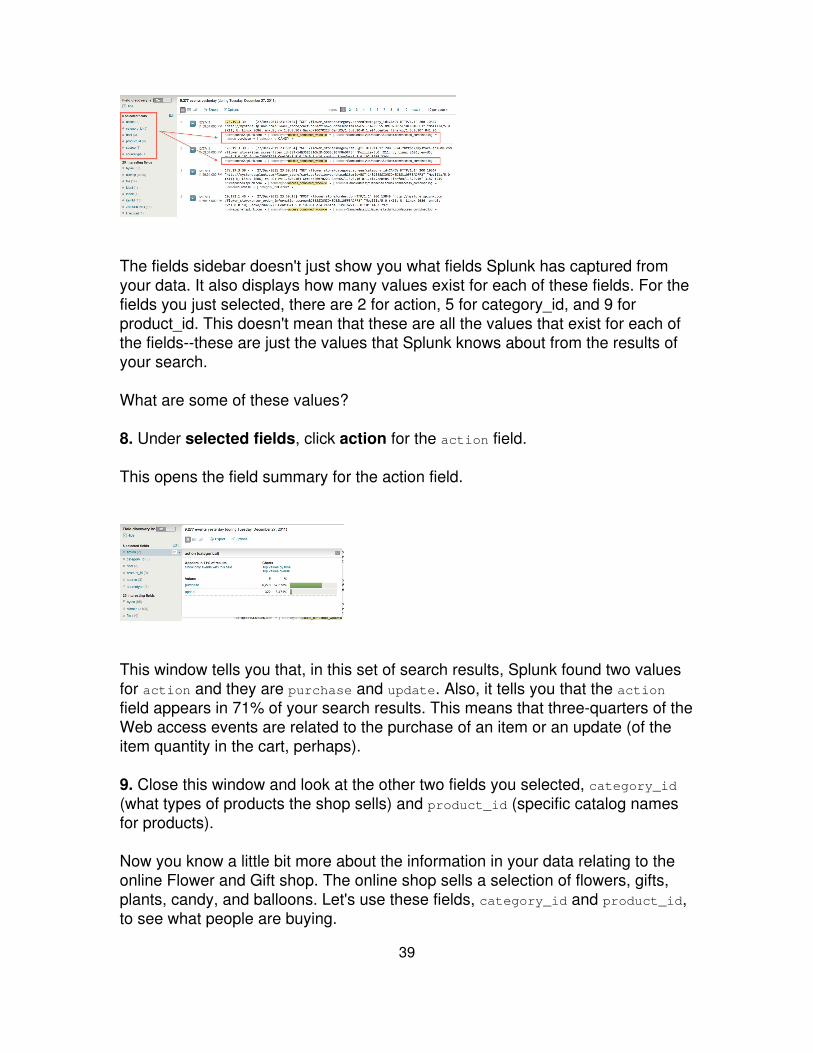
The fields sidebar doesn't just show you what fields Splunk has captured fromyour data. It also displays how many values exist for each of these fields. For thefields you just selected, there are 2 for action, 5 for category_id, and 9 forproduct_id. This doesn't mean that these are all the values that exist for each ofthe fields--these are just the values that Splunk knows about from the results ofyour search.
What are some of these values?
8. Under selected fields, click action for the action field.
This opens the field summary for the action field.
This window tells you that, in this set of search results, Splunk found two valuesfor action and they are purchase and update. Also, it tells you that the actionfield appears in 71% of your search results. This means that three-quarters of theWeb access events are related to the purchase of an item or an update (of theitem quantity in the cart, perhaps).
9. Close this window and look at the other two fields you selected, category_id(what types of products the shop sells) and product_id (specific catalog namesfor products).
Now you know a little bit more about the information in your data relating to theonline Flower and Gift shop. The online shop sells a selection of flowers, gifts,plants, candy, and balloons. Let's use these fields, category_id and product_id,to see what people are buying.
39

Use fields to run more targeted searches
These next two examples compares the results when searching with and withoutfields.
Example 1
Return to the search you ran to check for errors in your data. Select Other >Yesterday from the time range picker:
error OR failed OR severe OR (sourcetype=access_* (404 OR 500 OR 503))
Run this search again, but this time, use fields in your search.
The HTTP error codes are values of the status field. Now your search looks likethis:
error OR failed OR severe OR (sourcetype=access_* (status=404 OR
status=500 OR status=503))
Notice the difference in the count of events between the two searches--becauseit's a more targeted search, the second search returns fewer events.
When you run simple searches based on arbitrary keywords, Splunk matches theraw text of your data. When you add fields to your search, Splunk looks forevents that have those specific field/value pairs.
40

Example 2
Before you learned about the fields in your data, you might have run this searchto see how many times flowers were purchased from the online shop:
sourcetype=access_* purchase flower*
As you typed in "flower", search assistant shows you both "flower" and "flowers'in the typeahead. Since you don't know which is the one you want, you use thewildcard to match both.
If you scroll through the (many) search results, you'll see that some of the eventshave action=update and category_id that have a value other than flowers.These are not events that you wanted!
Run this search instead. Select Other > Yesterday from the time range picker:
sourcetype=access_* action=purchase category_id=flower*
For the second search, even though you still used the wildcarded word "flower*",there is only one value of category_id that it matches (FLOWERS).
Notice the difference in the number of events that Splunk retrieved for eachsearch; the second search returns significantly fewer events. Searches with fieldsare more targeted and retrieves more exact matches against your data.
41
Next steps
Now that you know how to use fields, you can start using the search language tofilter, modify, reorder, and group your search results. When you're ready,proceed to the next topic and learn how to use the search language.
Use the search language
This topic assumes that you are familiar with running simple searches usingkeywords and field/value pairs. If you're not sure, go back and read "Use fields tosearch".
Back at the online Flower & Gift shop Customer Support office, the searchesyou've run to this point have only retrieved matching events from your Splunkindex. For example, in a previous topic, you ran this search for to see thepurchases of flowers:
sourcetype=access_* action=purchase category_id=flowers
The search results told you approximately how many flowers were bought. But,this doesn't help you answer questions, such as:
What items were purchased most at the online shop?• How many customers bought flowers? How many flowers did eachcustomer buy?
•
To answer these questions, you need to use Splunk's search language, whichincludes an extensive library of commands, arguments, and functions thatenables you to filter, modify, reorder, and group your search results. For thistutorial you'll only use a few of them.
Construct a search with search assistant
Example 1. What items were purchased most at the online shop?
1. Return to the search dashboard and restrict your search to purchases overYesterday:
sourcetype=access_* action=purchase
As you type in the search bar, search assistant opens with syntax and usageinformation for the search command (on the right side). If search assistantdoesn't open, click the green arrow under the left side of the search bar.
42

You've seen before that search assistant displays typeahead for keywords thatyou type into the search bar. It also explains briefly how to search. We've alreadygone through retrieving events. Now, let's start using the search commands.
2. Type a pipe character, " | ", into the search bar.
The pipe indicates to Splunk that you're about to use a command, and that youwant to use the results of the search to the left of the pipe as the input to thiscommand. You can pass the results of one command into another command in aseries, or pipeline, of search commands.
You want Splunk to give you the most popular items bought at the onlinestore--from this list, the top command looks promising.
3. Under common next commands, click top.
Splunk appends the top command to your search string.
According to search assistant's description and usage examples, the topcommand "displays the most common values of a field"--exactly what youwanted.
43

You wanted to know what types of items were being bought at the online shop,not just flowers. It also shows you interesting fields that you can click on to addto the search.
4. Either click the category_id field in the list or type it into the search bar tocomplete your search:
sourcetype=access_* action=purchase | top category_id
This gives you a table of the top or most common values of category_id. Bydefault, the top command returns ten values, but you only have five differenttypes of items. So, you should see all five, sorted in descending order by thecount of each type:
The top command also returns two new fields: count is the number of times eachvalue of the field occurs, and percent is how large that count is compared to thetotal count. Read more about the top command in the Search reference manual.
Drill down into search results
The last search returned a table that showed you what items the online shopsells and how many of those items were purchased. But, you want to know moreabout an individual item, for example, flowers.
Example 2: How many flowers were bought?
1. Click the row in the result table for Flowers.
This kicks off a new search. Splunk updates your search, to include the filter forthe field/value pair category=flowers, which was the row item you clicked in theresult table from the search in Example 2.
44

Splunk's drilldown actions enable you to delve deeper into the details of theinformation presented to you in the tables and charts that result from yoursearch. Read more about drilldown actions in the Splunk Data VisualizationsManual.
The number of events returned tells you how many times flowers werepurchased.
Example 3: How many different customers purchased the flowers?
1. You're looking specifically for the purchase of flowers, so continue with thesearch from the previous example:
sourcetype=access_* action=purchase category_id=flowers
The customers who access the Flower & Gift shop are distinguished by their IPaddresses, which are values of the clientip field.
2. Use the stats command and the distinct_count() or dc() function:
sourcetype=access_* action=purchase category_id=flowers | stats
dc(clientip)
You piped the search results into the stats command and used thedistinct_count() function to count the number of unique clientip values that itfinds in those events. This returns a single value:
45
This tells you that there were approximately 300 different people who boughtflowers from the online shop.
Example 4a: How many flowers that each customer buy?
In the last example, you calculated how many different customers boughtflowers. Let's build on that search.
1. Use the stats command:
sourcetype=access_* action=purchase category_id=flowers | stats count
The count() function returns a single value, the count of your events. (Thisshould match your result from Example 2.)
Now, break this count down to see how many flowers each customer bought.
2. Add a by clause to the stats command:
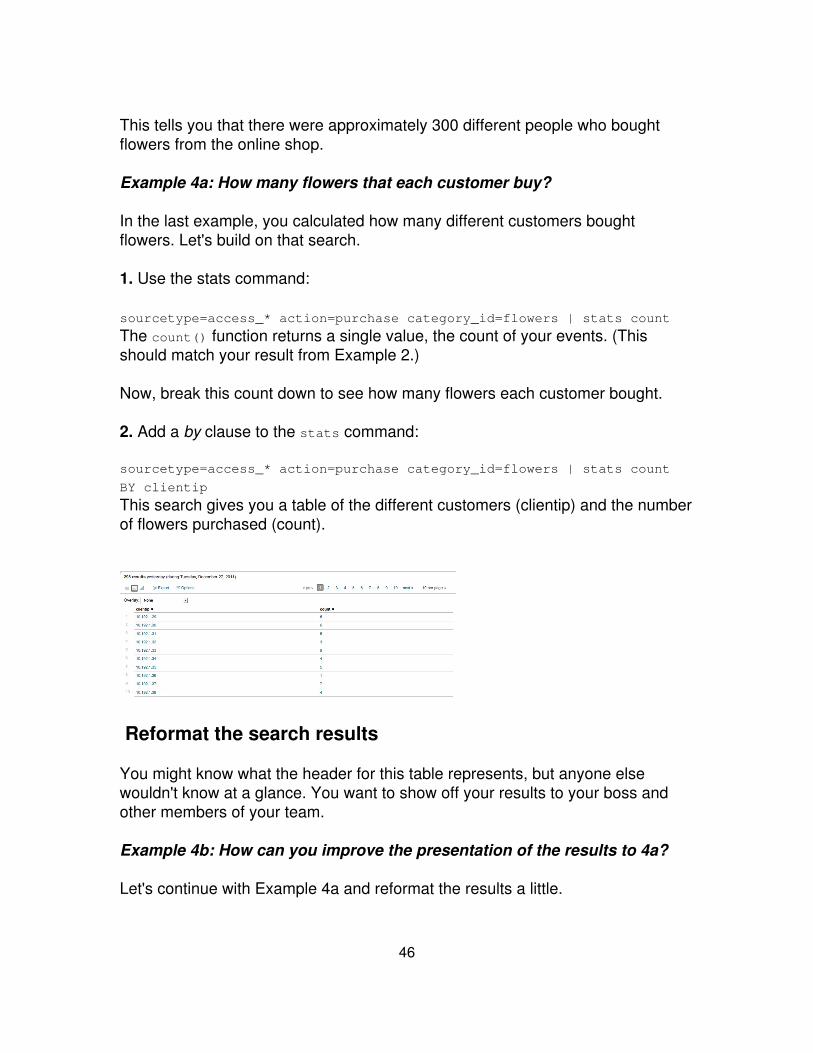
sourcetype=access_* action=purchase category_id=flowers | stats count
BY clientip
This search gives you a table of the different customers (clientip) and the numberof flowers purchased (count).
Reformat the search results
You might know what the header for this table represents, but anyone elsewouldn't know at a glance. You want to show off your results to your boss andother members of your team.
Example 4b: How can you improve the presentation of the results to 4a?
Let's continue with Example 4a and reformat the results a little.
46
1. First, let's rename the count field:
sourcetype=access_* action=purchase category_id=flowers | stats count
AS "# Flowers Purchased" by clientip
The syntax for the stats command enables you to rename the field inline usingan "AS" clause. If your new field name is a phrase, use double quotes. Thesyntax for the stats command doesn't allow field renaming in the "by" clause.For that, you'll have to use another command.
For more information about the stats command and its usage, arguments, andfunctions, see the stats command in the Search reference manual and the list ofstats functions.
2. Use the rename command to change the clientip name:
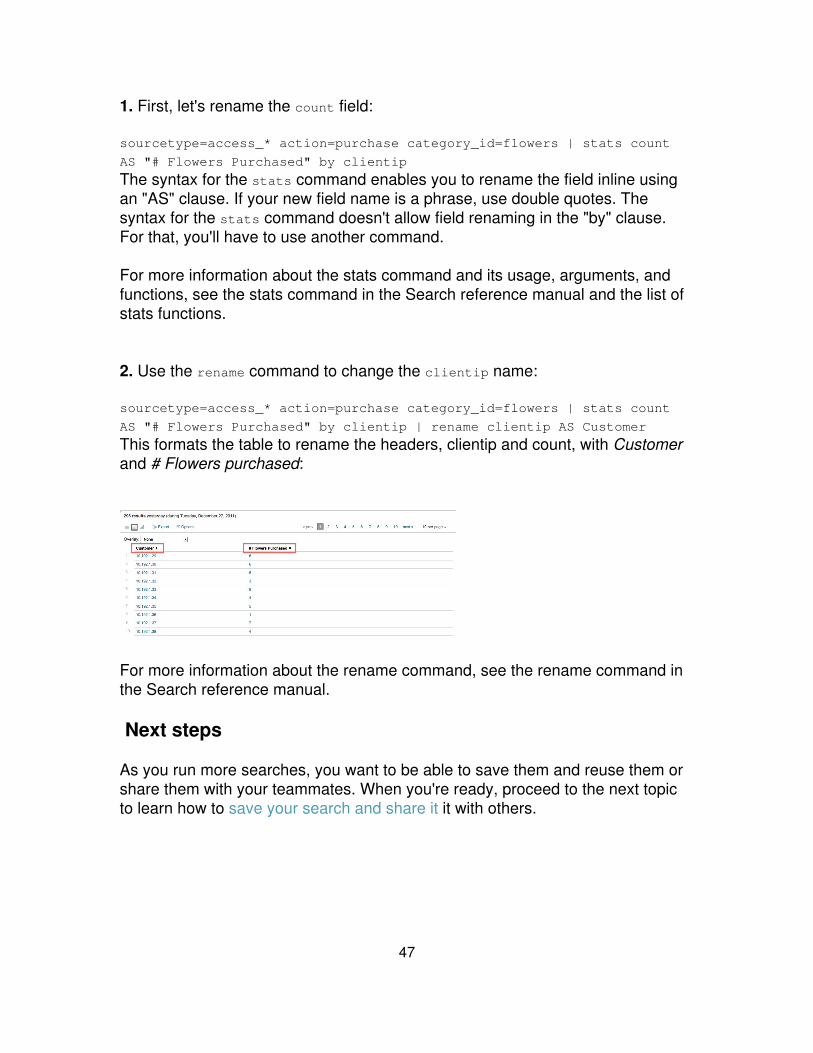
sourcetype=access_* action=purchase category_id=flowers | stats count
AS "# Flowers Purchased" by clientip | rename clientip AS Customer
This formats the table to rename the headers, clientip and count, with Customerand # Flowers purchased:
For more information about the rename command, see the rename command inthe Search reference manual.
Next steps
As you run more searches, you want to be able to save them and reuse them orshare them with your teammates. When you're ready, proceed to the next topicto learn how to save your search and share it it with others.
47
Save a search
This topic assumes you're comfortable running searches with fields. If you're not,go back to the previous topic and review how to "Use fields to search".
About saving a search
Splunk provides a variety of options for saving your search or search resultsusing the Save menu. You can save a search while it is running or after it'scompleted or finalized. This topic briefly discusses the Save options before itwalks you through the basics of manually saving a search using Splunk Web andaccessing that search again later.
Save options include:
Save search...: Saves the search, so you can easily run the search againwithout having to retype the search string. For more information, see"Save searches and share search results" in the Knowledge ManagerManual.
•
Save results: Saves the results of the search and enables you to retrievethem from the Jobs manager.
•
Save & share results: Saves the results of the search and provides a urlthat enables you to share the results. For more information, see "Savesearches and share search results".
•
Save a search tutorial
Back at the Flower & Gift shop, you just ran a search to see if there were anyerrors yesterday. This is a search you will run every morning. Rather than type itin manually every day, you decide to save this search.
Example 1. Run the search for all errors seen yesterday:
error OR failed OR severe OR (sourcetype=access_* (status=404 OR
status=500 OR status=503))
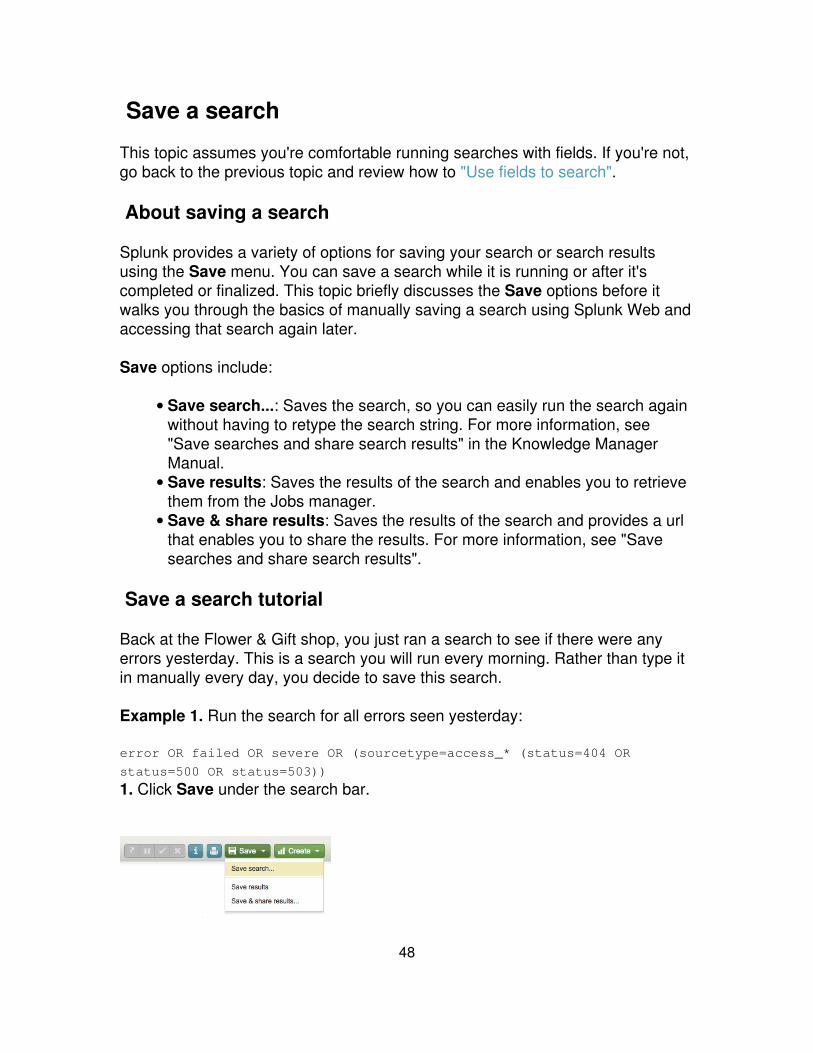
1. Click Save under the search bar.
48
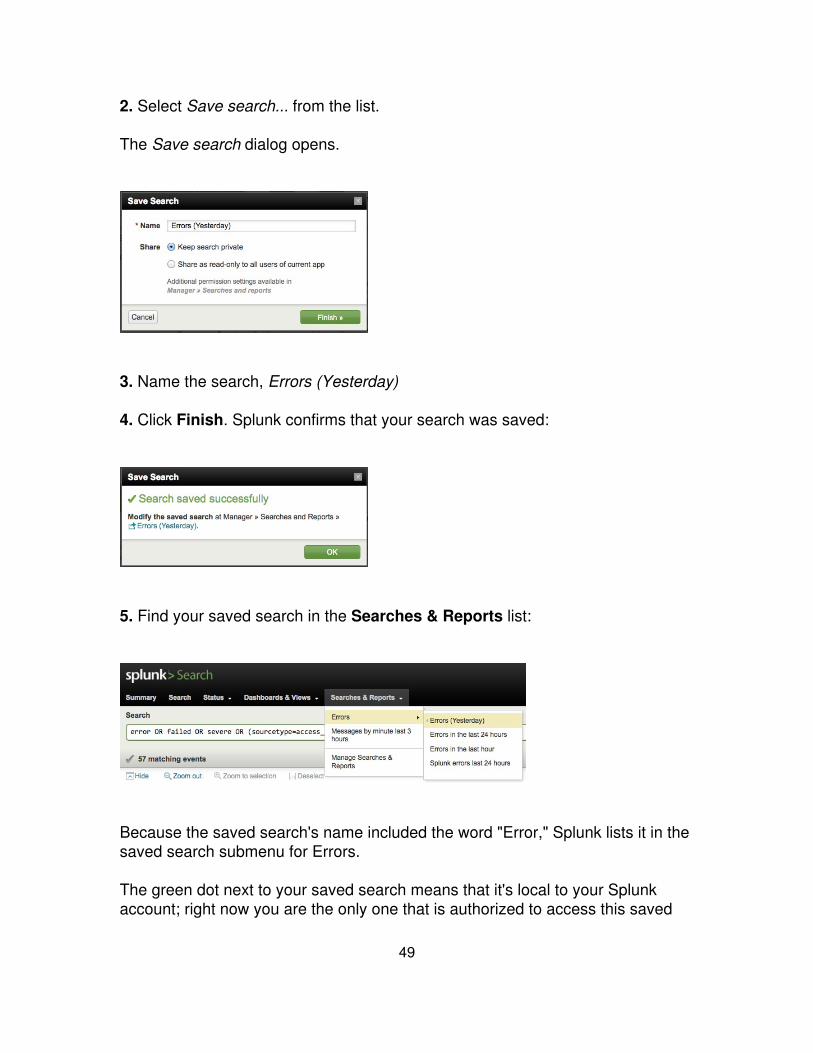
2. Select Save search... from the list.
The Save search dialog opens.
3. Name the search, Errors (Yesterday)
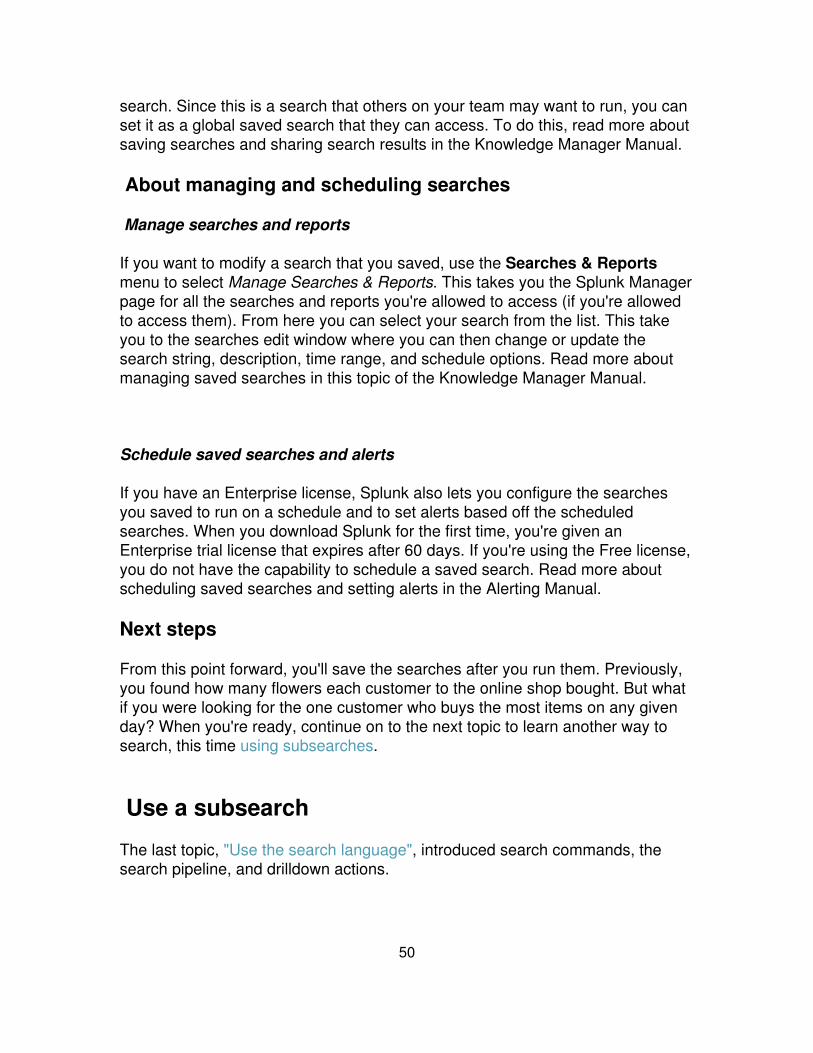
4. Click Finish. Splunk confirms that your search was saved:
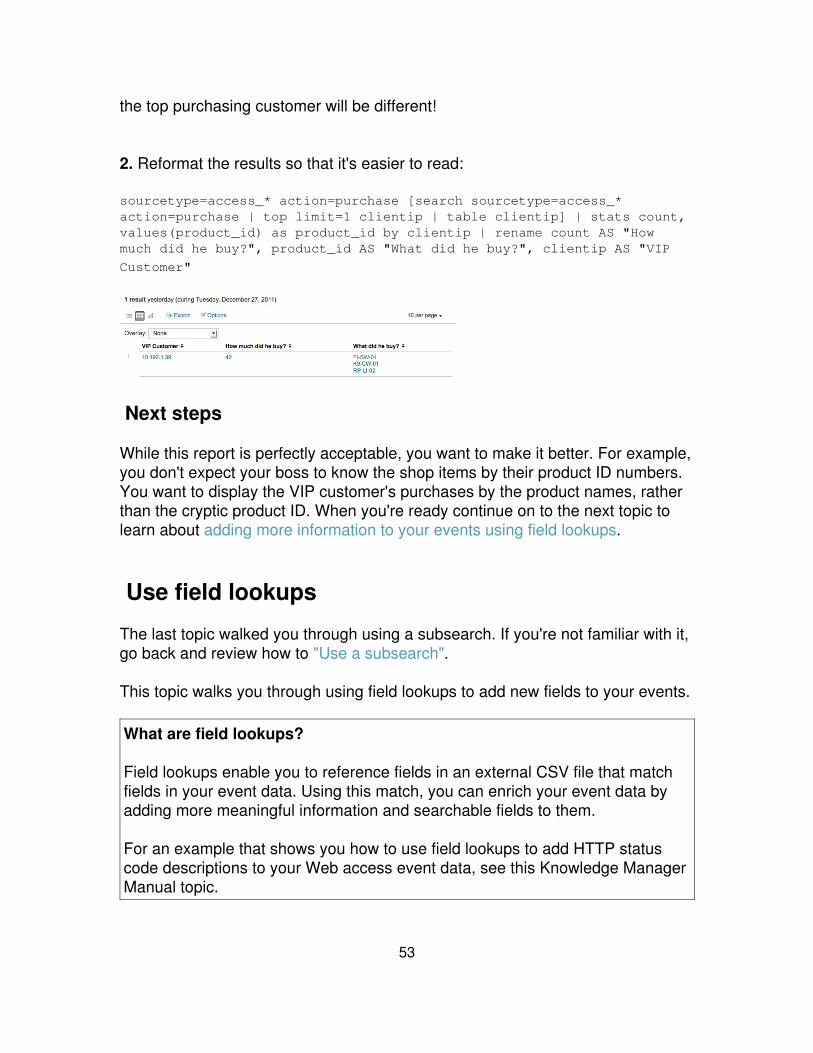
5. Find your saved search in the Searches & Reports list:
Because the saved search's name included the word "Error," Splunk lists it in thesaved search submenu for Errors.
The green dot next to your saved search means that it's local to your Splunkaccount; right now you are the only one that is authorized to access this saved
49
search. Since this is a search that others on your team may want to run, you canset it as a global saved search that they can access. To do this, read more aboutsaving searches and sharing search results in the Knowledge Manager Manual.
About managing and scheduling searches
Manage searches and reports
If you want to modify a search that you saved, use the Searches & Reportsmenu to select Manage Searches & Reports. This takes you the Splunk Managerpage for all the searches and reports you're allowed to access (if you're allowedto access them). From here you can select your search from the list. This takeyou to the searches edit window where you can then change or update thesearch string, description, time range, and schedule options. Read more aboutmanaging saved searches in this topic of the Knowledge Manager Manual.
Schedule saved searches and alerts
If you have an Enterprise license, Splunk also lets you configure the searchesyou saved to run on a schedule and to set alerts based off the scheduledsearches. When you download Splunk for the first time, you're given anEnterprise trial license that expires after 60 days. If you're using the Free license,you do not have the capability to schedule a saved search. Read more aboutscheduling saved searches and setting alerts in the Alerting Manual.
Next steps
From this point forward, you'll save the searches after you run them. Previously,you found how many flowers each customer to the online shop bought. But whatif you were looking for the one customer who buys the most items on any givenday? When you're ready, continue on to the next topic to learn another way tosearch, this time using subsearches.
Use a subsearch
The last topic, "Use the search language", introduced search commands, thesearch pipeline, and drilldown actions.
50

This topic walks you through a search to find the most frequent shopper and hispurchases. It shows you two approaches to getting the results that you want:without a subsearch and with a subsearch.
A subsearch is a search with a search pipeline as an argument. Subsearches arecontained in square brackets and evaluated first. The result of the subsearch isthen used as an argument to the primary, or outer, search. Read more about howsubsearches work in the Search manual.
Example 1: Without a subsearch
Back at the Flower & Gift shop, your boss asks you to put together a report thatshows the customer who bought the most items yesterday and what he or shebought. It's not easy to get this result with just a straightforward search--Let'sbreak it down.
First, search for the customer who accessed the online shop the most yesterday.
1. Use the top command and limit the search to Yesterday:
sourcetype=access_* action=purchase | top limit=1 clientip
Limit the top command to return only one result for the clientip. If you wantedto see more than one "top purchasing customer", change this limit value. Formore information about usage and syntax, refer to the "top" command's page inthe Search Reference Manual.
This search returns one clientip value, which we'll use to identify our VIPcustomer.
2. Use the stats command to count this VIP customer's purchases:
sourcetype=access_* action=purchase clientip=10.192.1.39 | stats count
by clientip
51

This search used the count() function which only returns the count of purchasesfor the clientip. You also want to know what he bought, so let's use another statsfunction.
3. One way to do this is to use the values() function:
sourcetype=access_* action=purchase clientip=10.192.1.39 | stats count,
values(product_id) by clientip
This adds a column to the table that lists what he bought by product ID.
The drawback to this approach is that you have to run two searches each timeyou want to build this table. The top purchaser is not likely to be the same personat any given time range.
For more information about usage and syntax, refer to the "stats" command'spage in the Search Reference Manual. Also, for the list of other stats functions,refer to the "List of stats functions" in the Search Reference Manual.
Example 2: With a subsearch
1. Use a subsearch to run the searches from Part 1 inline. Type or copy/paste in:
sourcetype=access_* action=purchase [search sourcetype=access_*action=purchase | top limit=1 clientip | table clientip] | stats count,
values(product_id) by clientip
Because the top command returns count and percent fields as well, you use thetable command to keep only the clientip value.
These results should match the previous result, if you run it on the same timerange. But, if you change the time range, you might see different results because
52
the top purchasing customer will be different!
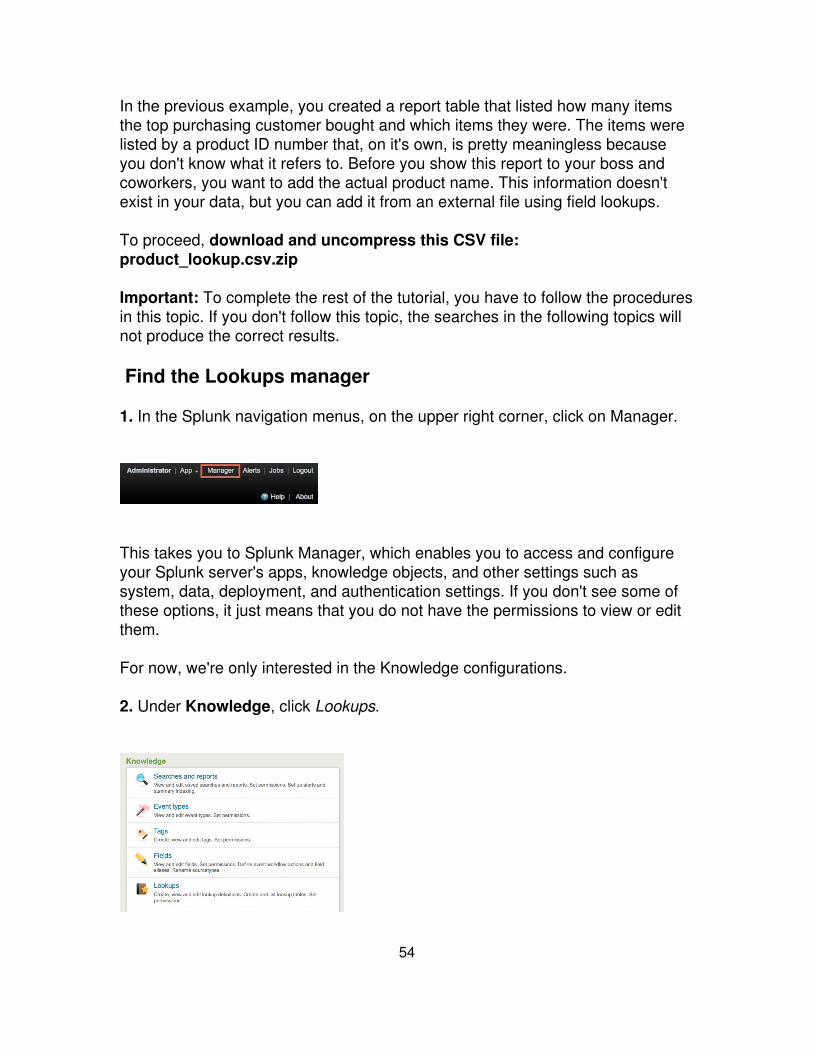
2. Reformat the results so that it's easier to read:
sourcetype=access_* action=purchase [search sourcetype=access_*action=purchase | top limit=1 clientip | table clientip] | stats count,values(product_id) as product_id by clientip | rename count AS "Howmuch did he buy?", product_id AS "What did he buy?", clientip AS "VIP
Customer"
Next steps
While this report is perfectly acceptable, you want to make it better. For example,you don't expect your boss to know the shop items by their product ID numbers.You want to display the VIP customer's purchases by the product names, ratherthan the cryptic product ID. When you're ready continue on to the next topic tolearn about adding more information to your events using field lookups.
Use field lookups
The last topic walked you through using a subsearch. If you're not familiar with it,go back and review how to "Use a subsearch".
This topic walks you through using field lookups to add new fields to your events.
What are field lookups?
Field lookups enable you to reference fields in an external CSV file that matchfields in your event data. Using this match, you can enrich your event data byadding more meaningful information and searchable fields to them.
For an example that shows you how to use field lookups to add HTTP statuscode descriptions to your Web access event data, see this Knowledge ManagerManual topic.
53
In the previous example, you created a report table that listed how many itemsthe top purchasing customer bought and which items they were. The items werelisted by a product ID number that, on it's own, is pretty meaningless becauseyou don't know what it refers to. Before you show this report to your boss andcoworkers, you want to add the actual product name. This information doesn'texist in your data, but you can add it from an external file using field lookups.
To proceed, download and uncompress this CSV file:product_lookup.csv.zip
Important: To complete the rest of the tutorial, you have to follow the proceduresin this topic. If you don't follow this topic, the searches in the following topics willnot produce the correct results.
Find the Lookups manager
1. In the Splunk navigation menus, on the upper right corner, click on Manager.
This takes you to Splunk Manager, which enables you to access and configureyour Splunk server's apps, knowledge objects, and other settings such assystem, data, deployment, and authentication settings. If you don't see some ofthese options, it just means that you do not have the permissions to view or editthem.
For now, we're only interested in the Knowledge configurations.
2. Under Knowledge, click Lookups.
54
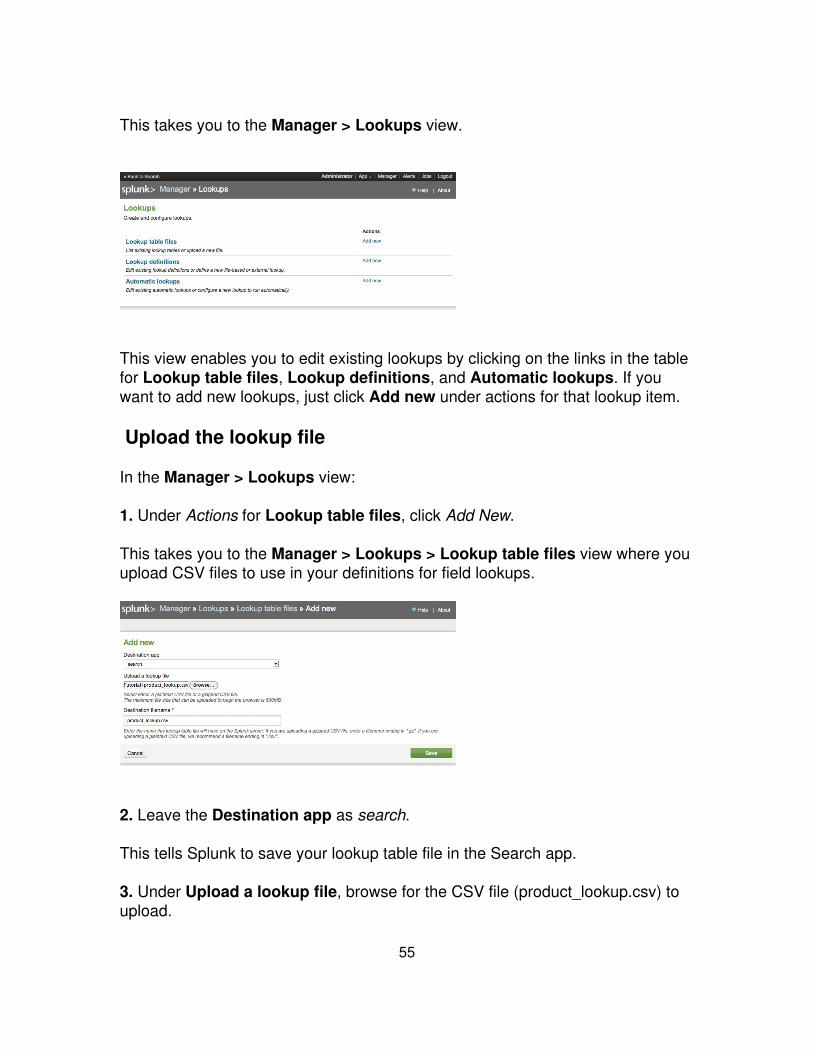
This takes you to the Manager > Lookups view.
This view enables you to edit existing lookups by clicking on the links in the tablefor Lookup table files, Lookup definitions, and Automatic lookups. If youwant to add new lookups, just click Add new under actions for that lookup item.
Upload the lookup file
In the Manager > Lookups view:
1. Under Actions for Lookup table files, click Add New.
This takes you to the Manager > Lookups > Lookup table files view where youupload CSV files to use in your definitions for field lookups.
2. Leave the Destination app as search.
This tells Splunk to save your lookup table file in the Search app.
3. Under Upload a lookup file, browse for the CSV file (product_lookup.csv) toupload.
55

4. Under Destination filename, name the file product_lookup.csv.
This will be the name you use to refer to the file in a lookup definition.
5. Click Save.
This uploads your lookup file to Splunk to the Search app, but now you need todefine the type of lookup you want to set up.
Note: Splunk does not recognize or cannot upload the file, check that it wasuncompressed before you attempt to upload it again.
6. Return to Manager > Lookups by clicking the breadcrumb:
Define the field lookup
In the Manager > Lookups view:
1. Under Actions for Lookup definitions, click Add New.
This takes you to the Manager > Lookups > Lookup definitions view whereyou define your field lookup.
56

2. Leave the Destination app as search.
3. Name your lookup product_lookup.
4. Under Type, select File-based.
5. Under Lookup file, select product_lookup (the name of your lookup table).
6. Leave Configure time-based lookup and Advanced options unchecked.
7. Click Save.
Now Splunk knows that product_lookup is a file-based lookup.
Make the lookup automatic
In the Manager > Lookups view:
1. Under Actions for Automatic lookups, click Add New.
This takes you to the Manager > Lookups > Automatic lookups >> Add Newview where you configure the lookup to run automatically.
57

2. Leave the Destination app as search.
3. Name your automatic lookup product_lookup.
4. Under Lookup table, select product_lookup.
5. Under Apply to and named, select sourcetype and type inaccess_combined_wcookie.
6. Under Lookup input fields type in:
The input field is the field in your event data that you are using to match the fieldin the lookup table.
7. Under Lookup output fields, type in the following. Use the Add another fieldlink to add more fields after the first one:
58

The output fields are the field(s) in the lookup table that you want to add to yourevent data based on the input field matching. Here, you are adding the fields:price, which contains the price for each product_id, and product_name, whichcontains the descriptive name for each product_id.
8. Leave Overwrite field values unchecked.
If you check this box, Splunk will overwrite any fields that exist in your event datawith values from the corresponding field that you map to it from the lookup table.Since you are adding two new fields, you don't need to worry about this option.
9. Click Save.
Return to the Search dashboard (click << Back to Search) and run the searchfor Web access activity over the time range, Yesterday:
sourcetype=access_*
When you scroll through the fields sidebar or Fields dialog, you should see thenew fields that you added.
Search with the new lookup fields
Now you can run the previous subsearch example to see what the VIP customerbought. This time, replace the product_id field with the more readableproduct_name:
59
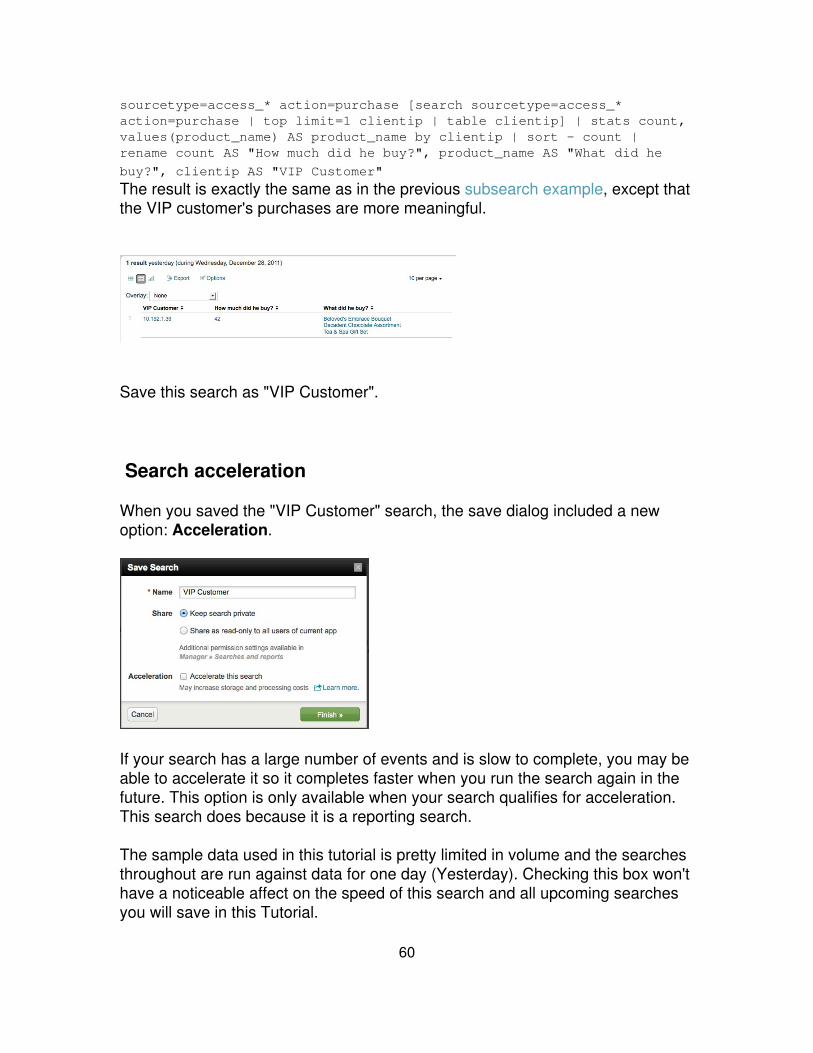
sourcetype=access_* action=purchase [search sourcetype=access_*action=purchase | top limit=1 clientip | table clientip] | stats count,values(product_name) AS product_name by clientip | sort - count |rename count AS "How much did he buy?", product_name AS "What did he
buy?", clientip AS "VIP Customer"
The result is exactly the same as in the previous subsearch example, except thatthe VIP customer's purchases are more meaningful.
Save this search as "VIP Customer".
Search acceleration
When you saved the "VIP Customer" search, the save dialog included a newoption: Acceleration.
If your search has a large number of events and is slow to complete, you may beable to accelerate it so it completes faster when you run the search again in thefuture. This option is only available when your search qualifies for acceleration.This search does because it is a reporting search.
The sample data used in this tutorial is pretty limited in volume and the searchesthroughout are run against data for one day (Yesterday). Checking this box won'thave a noticeable affect on the speed of this search and all upcoming searchesyou will save in this Tutorial.
60

Read more search acceleration and the searches that qualify in the "Savesearches and share search results" topic in the Knowledge Manager manual.
Next steps
When you're ready, proceed to the next topic where you will run more searches.
More search examples
In the last topic, you added two new fields to the online shop event data using alookup table. If you didn't add those fields, go back and review how to use fieldlookups and follow the procedure to add the fields. Without them, the searchesbelow will not return the correct results.
Back at the Flower & Gift shop, you're asked to gather information to build areport for your boss about yesterday's purchase records:
How many page views were requested?• What was the difference between page views and purchases made?• What was purchased and how much was made?• How many purchase attempts failed?•
This topic uses what you learned from previous topics to write the searches toanswers these questions.
The search reference manual
These examples use only a handful of the search commands and functionsavailable to you. For complete syntax and descriptions of usage of all the searchcommands, see the Search reference manual.
The complete list of search commands• The list of functions for the eval command• The list of functions for the stats command•
Example 1 - How many page views were requested?
How many times did someone view a page on the website, yesterday?
1. Start with a search for all page views. Select the time range, Other >Yesterday:
61
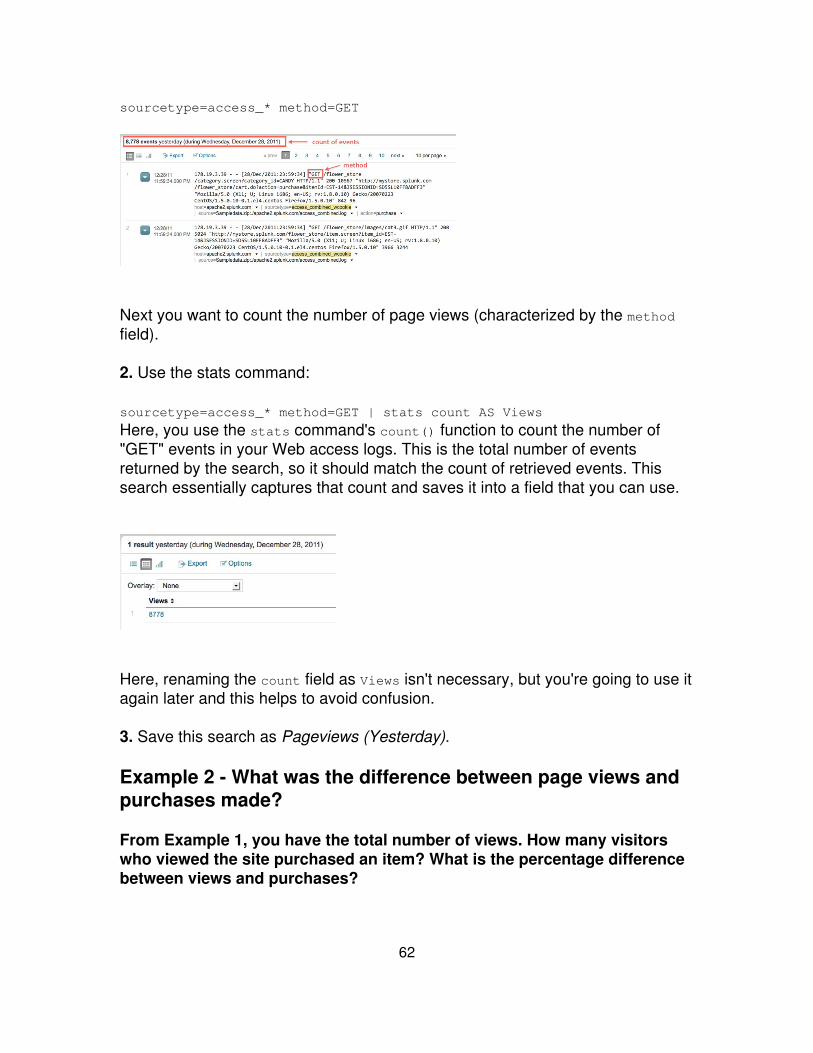
sourcetype=access_* method=GET
Next you want to count the number of page views (characterized by the methodfield).
2. Use the stats command:
sourcetype=access_* method=GET | stats count AS Views
Here, you use the stats command's count() function to count the number of"GET" events in your Web access logs. This is the total number of eventsreturned by the search, so it should match the count of retrieved events. Thissearch essentially captures that count and saves it into a field that you can use.
Here, renaming the count field as Views isn't necessary, but you're going to use itagain later and this helps to avoid confusion.
3. Save this search as Pageviews (Yesterday).
Example 2 - What was the difference between page views andpurchases made?
From Example 1, you have the total number of views. How many visitorswho viewed the site purchased an item? What is the percentage differencebetween views and purchases?
62
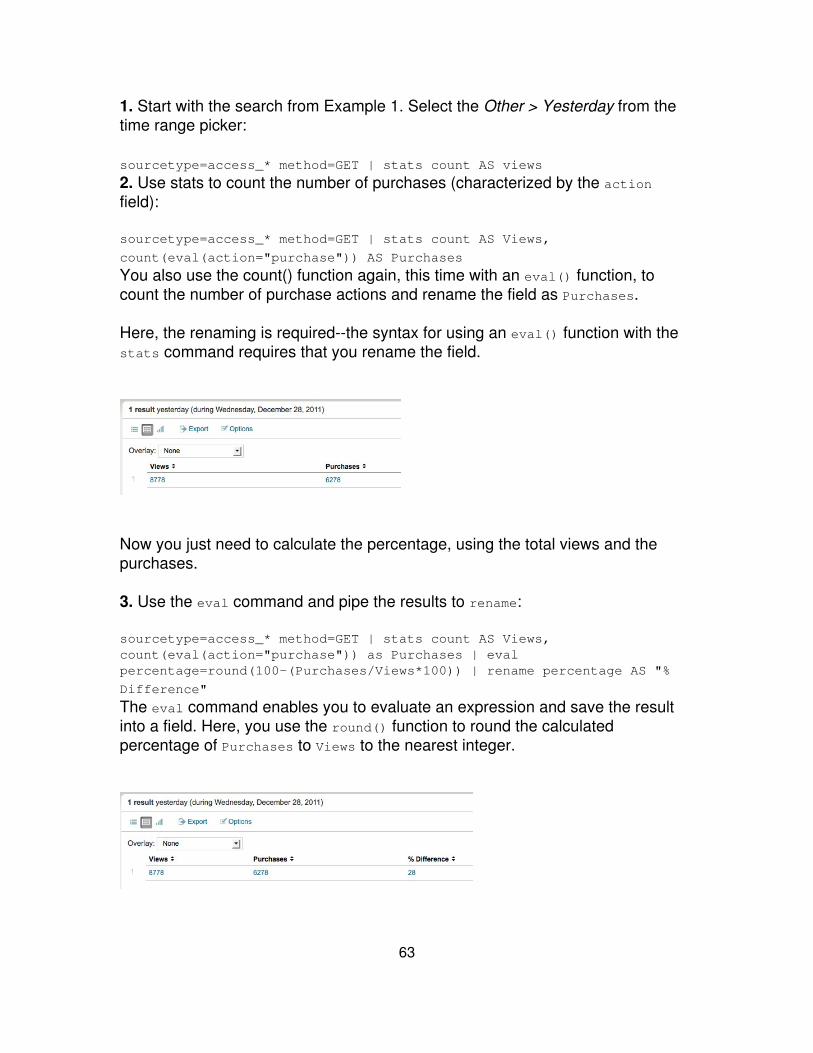
1. Start with the search from Example 1. Select the Other > Yesterday from thetime range picker:
sourcetype=access_* method=GET | stats count AS views
2. Use stats to count the number of purchases (characterized by the actionfield):
sourcetype=access_* method=GET | stats count AS Views,
count(eval(action="purchase")) AS Purchases
You also use the count() function again, this time with an eval() function, tocount the number of purchase actions and rename the field as Purchases.
Here, the renaming is required--the syntax for using an eval() function with thestats command requires that you rename the field.
Now you just need to calculate the percentage, using the total views and thepurchases.
3. Use the eval command and pipe the results to rename:
sourcetype=access_* method=GET | stats count AS Views,count(eval(action="purchase")) as Purchases | evalpercentage=round(100-(Purchases/Views*100)) | rename percentage AS "%
Difference"
The eval command enables you to evaluate an expression and save the resultinto a field. Here, you use the round() function to round the calculatedpercentage of Purchases to Views to the nearest integer.
63
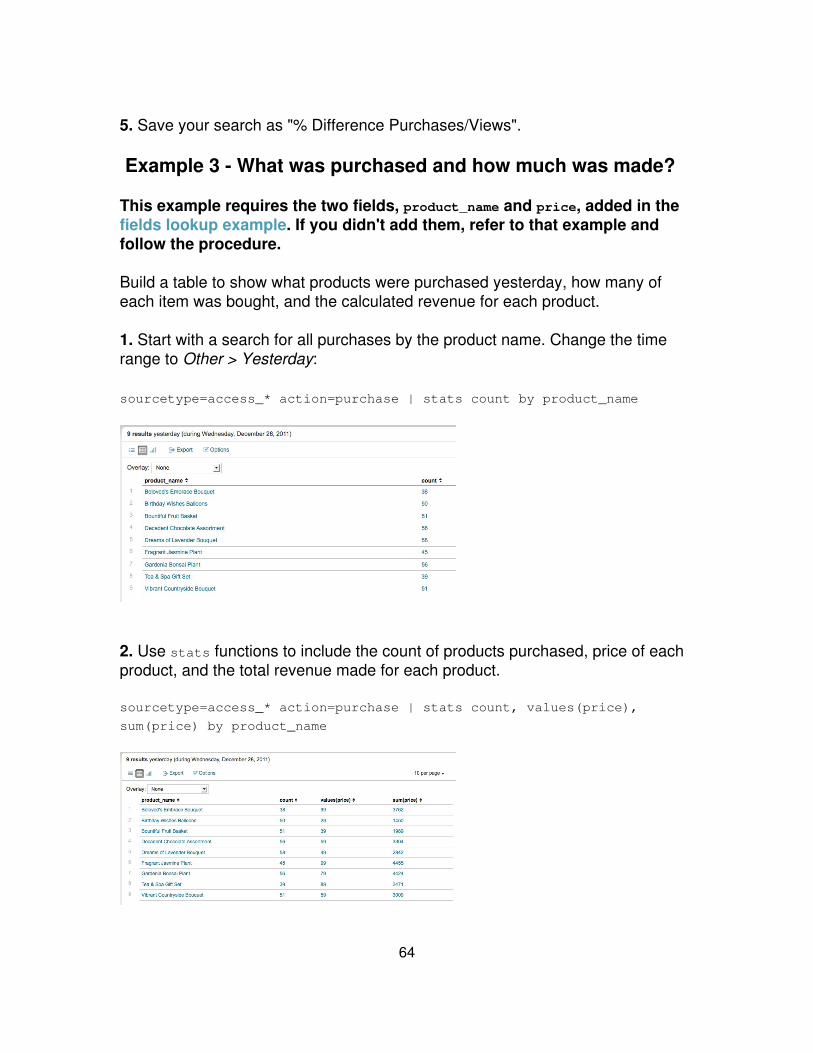
5. Save your search as "% Difference Purchases/Views".
Example 3 - What was purchased and how much was made?
This example requires the two fields, product_name and price, added in thefields lookup example. If you didn't add them, refer to that example andfollow the procedure.
Build a table to show what products were purchased yesterday, how many ofeach item was bought, and the calculated revenue for each product.
1. Start with a search for all purchases by the product name. Change the timerange to Other > Yesterday:
sourcetype=access_* action=purchase | stats count by product_name
2. Use stats functions to include the count of products purchased, price of eachproduct, and the total revenue made for each product.
sourcetype=access_* action=purchase | stats count, values(price),
sum(price) by product_name
64
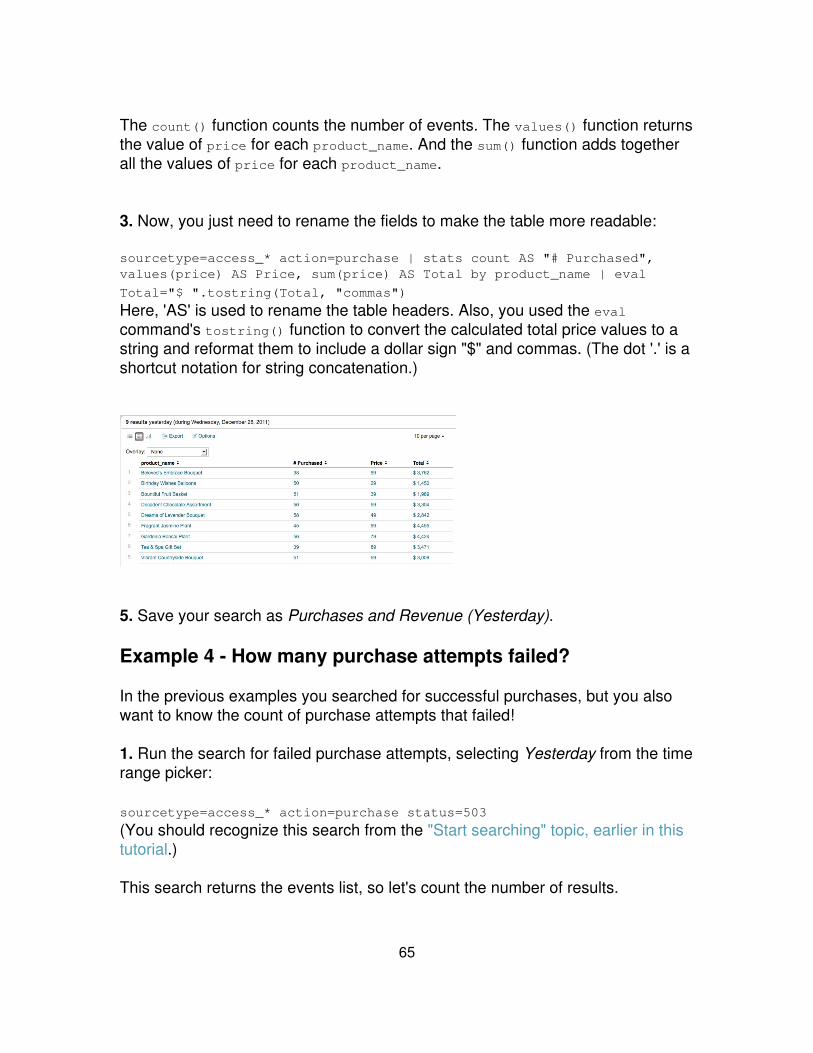
The count() function counts the number of events. The values() function returnsthe value of price for each product_name. And the sum() function adds togetherall the values of price for each product_name.
3. Now, you just need to rename the fields to make the table more readable:
sourcetype=access_* action=purchase | stats count AS "# Purchased",values(price) AS Price, sum(price) AS Total by product_name | eval
Total="$ ".tostring(Total, "commas")
Here, 'AS' is used to rename the table headers. Also, you used the evalcommand's tostring() function to convert the calculated total price values to astring and reformat them to include a dollar sign "$" and commas. (The dot '.' is ashortcut notation for string concatenation.)
5. Save your search as Purchases and Revenue (Yesterday).
Example 4 - How many purchase attempts failed?
In the previous examples you searched for successful purchases, but you alsowant to know the count of purchase attempts that failed!
1. Run the search for failed purchase attempts, selecting Yesterday from the timerange picker:
sourcetype=access_* action=purchase status=503
(You should recognize this search from the "Start searching" topic, earlier in thistutorial.)
This search returns the events list, so let's count the number of results.
65
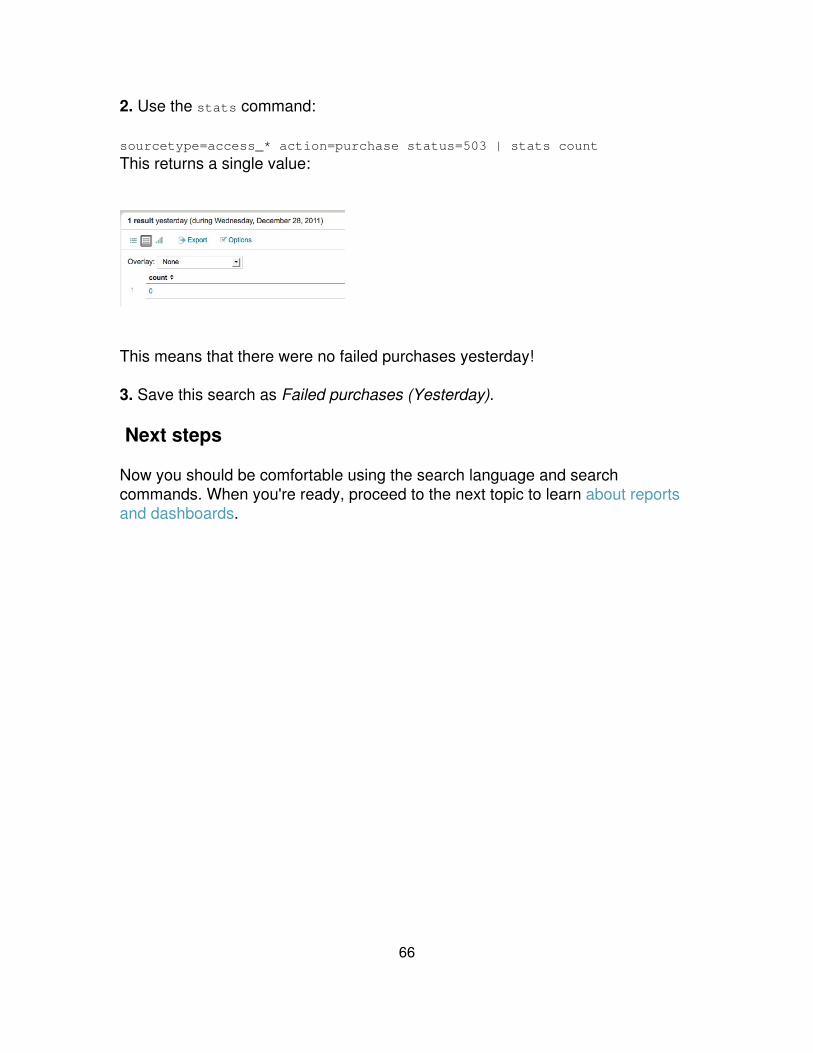
2. Use the stats command:
sourcetype=access_* action=purchase status=503 | stats count
This returns a single value:
This means that there were no failed purchases yesterday!
3. Save this search as Failed purchases (Yesterday).
Next steps
Now you should be comfortable using the search language and searchcommands. When you're ready, proceed to the next topic to learn about reportsand dashboards.
66

Create reports and dashboards
About reports and dashboards
This chapter walks you through using Splunk Web to create reports anddashboards from the searches you saved throughout this tutorial.
The Splunk Report Builder makes it easy to generate sophisticated reports usingthe results from any completed or finalized search. It offers a wide range ofreporting options, both in terms of reporting parameters and chart types.
Splunk makes it just as easy to create and edit simple dashboards using SplunkWeb. You can add a search you've just run to a new or existing dashboard, oruse the Dashboard Editor to create dashboards and populate them withdashboard panels.
When you're ready, continue to the next topic to run reporting searches.
Reporting examples
This topic builds on the searches that you ran and saved in the previous searchexamples to walk you through creating charts and building reports.
Back at the Flower & Gift shop, you're still building your reports. The previoussearches you ran returned either a single value (for example, a count of failederrors) or a table of results (a table of products that were purchased). Now, youwant to also add some visualizations to your reports of yesterday's activities:
The count of purchases and views for each product category• The count of products purchased over time• A trend of the count of products purchased over time•
Using Report builder
Splunk can dynamically update generated charts as it gathers search results.When you initiate a search, you can start building your report before the searchcompletes. You can use the fields menu to quickly build simple pre-definedreports or use the Report Builder, which lets you define, generate, and fine-tunethe format of your report, from the type of chart you want to create to the
67

contents you want to display on this chart.
If you're dealing with a long search and don't want to wait until the searchcompletes to start defining a report based on it, click Create and selectReport... to launch the Report Builder. The search continues runningafter the Report Builder is launched, and the finished report covers the fullrange of the event data returned.
•
If your search string includes reporting commands, you access the ReportBuilder by clicking Show report. Splunk will jump you directly to theformatting stage of the report-building process, since your reportingcommands have already defined the report.
•
You don't need to have a strong understanding of reporting commands to use theReport Builder, but if you do have this knowledge the range of things you can dowith the Report builder is increased.
To learn more about using the report builder to define basic report parameters,format charts, and export or print finished reports, see "Define reports andgenerate charts" in this manual.
Chart of purchases and views for each product
In this example, chart the number of views and number of purchases for eachtype of product. Recall that you saved a similar search in a previous topic.
Let's modify it a little.
1. Run this search over the time range, Yesterday:
sourcetype=access_* method=GET | chart count AS views,count(eval(action="purchase")) AS purchases by category_id | rename
views AS "Views", purchases AS "Purchases", category_id AS "Category"
Here, you use the chart command instead of the stats command. The chartcommand enables you to create charts and specify the x-axis with the by clause.
68

2. Click on Create, and select Report... from the list.
Because you use the chart command and have already defined your report, thisopens the Format report page of the Report Builder.
If you see something different in this window, for example a different chart type,it's probably because you're not looking at the default settings. You don't need toworry about this though.
3. Under Formatting options:
Leave the chart type set to column.• Name the chart, Purchases and Views by Product Type.•
69
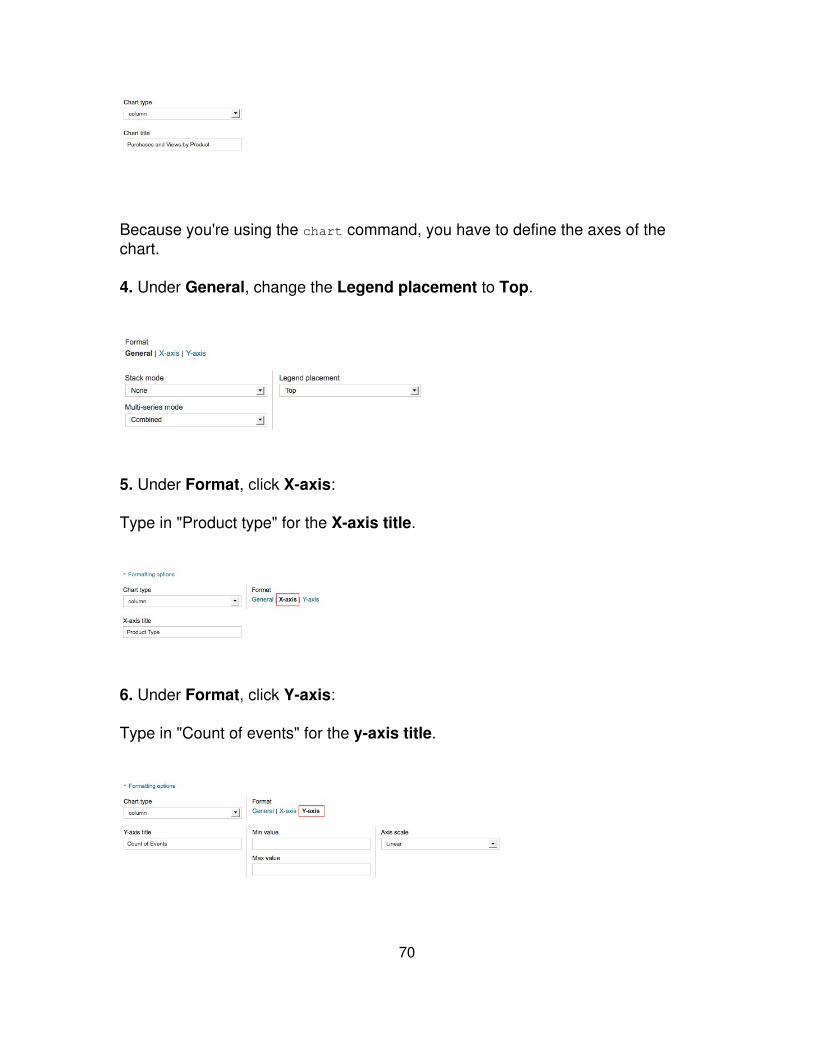
Because you're using the chart command, you have to define the axes of thechart.
4. Under General, change the Legend placement to Top.
5. Under Format, click X-axis:
Type in "Product type" for the X-axis title.
6. Under Format, click Y-axis:
Type in "Count of events" for the y-axis title.
70
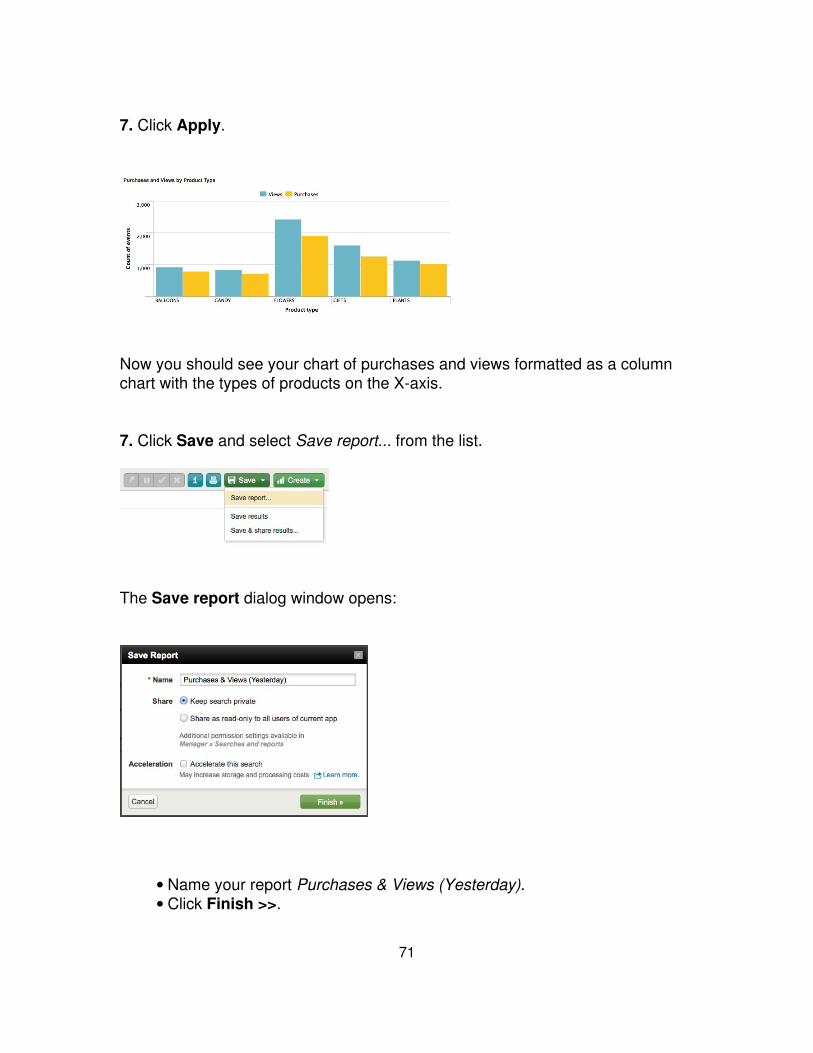
7. Click Apply.
Now you should see your chart of purchases and views formatted as a columnchart with the types of products on the X-axis.
7. Click Save and select Save report... from the list.
The Save report dialog window opens:
Name your report Purchases & Views (Yesterday).• Click Finish >>.•
71
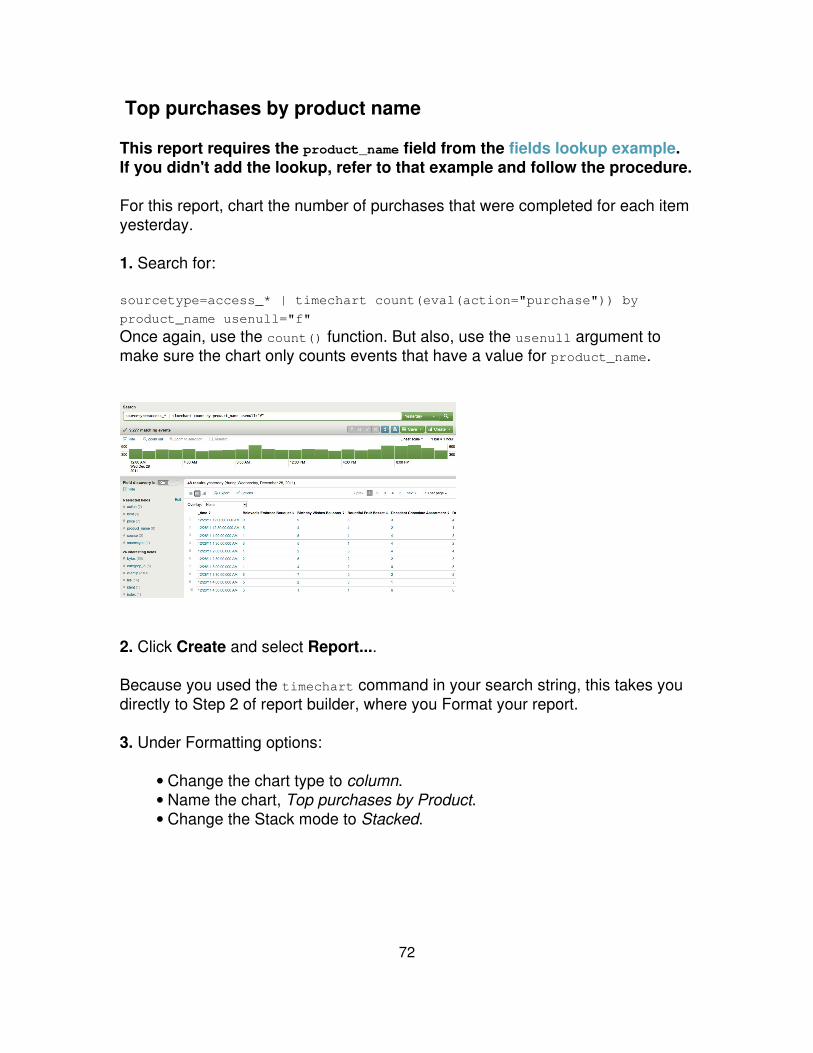
Top purchases by product name
This report requires the product_name field from the fields lookup example.If you didn't add the lookup, refer to that example and follow the procedure.
For this report, chart the number of purchases that were completed for each itemyesterday.
1. Search for:
sourcetype=access_* | timechart count(eval(action="purchase")) by
product_name usenull="f"
Once again, use the count() function. But also, use the usenull argument tomake sure the chart only counts events that have a value for product_name.
2. Click Create and select Report....
Because you used the timechart command in your search string, this takes youdirectly to Step 2 of report builder, where you Format your report.
3. Under Formatting options:
Change the chart type to column.• Name the chart, Top purchases by Product.• Change the Stack mode to Stacked.•
72

Because you used the timechart command, the axes are already named: thex-axis is time and the y-axis is count of events. Rename the axes to "Time" and"Count of purchases"
4. Click Apply.
Each of the columns represents the different products bought in that half-hourperiod.
5. Click Save and select Save report...
Name your report Products Purchased (Yesterday).• Click Finish >>.•
Top purchases trend
For stats and chart searches, you can add sparklines to their results tables.Sparklines are inline charts that appear within the search results table and aredesigned to display time-based trends associated with the primary key of eachrow. For more information, read "Add sparklines to your search results" in theSearch Manual.
This example uses sparklines to trend the count of purchases made yesterday.
This example requires the product_name field from the fields lookupexample. If you didn't add the lookup, refer to that example and follow the
73

procedure.
Run this search over the time range "Yesterday":
sourcetype=access_* | chart sparkline(count(eval(action="purchase")))
AS "Purchases Trend (Yesterday)" by product_name
This search is similar to the last two searches you just ran to build reports. It usesthe chart command to count the number of purchases,count(eval(action="purchase")), made for each product, product_name. Thedifference here is that the count of purchases is now an argument of thesparkline() function. (Also, the results are renamed to "Purchases Trend(Yesterday)" to indicate that you are trending the count of purchases madethroughout the day, yesterday.)
Let's add this to a report to display, not only the total purchases made yesterday,but a trend of the purchases throughout the day:
sourcetype=access_* | chart sparkline(count(eval(action="purchase")))AS "Purchases Trend (Yesterday)" count(eval(action="purchase")) AS
Total by product_name | rename product_name AS "Product Name"
Save this search as, Top Purchases Trend (Yesterday).
74
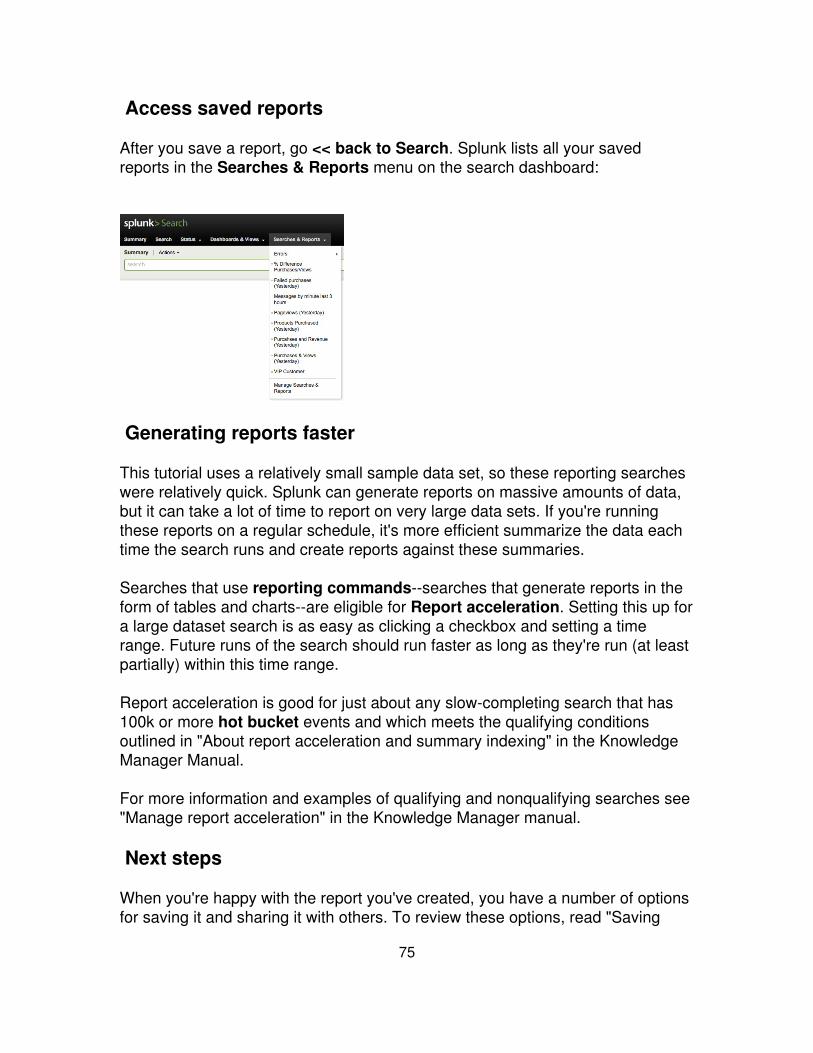
Access saved reports
After you save a report, go << back to Search. Splunk lists all your savedreports in the Searches & Reports menu on the search dashboard:
Generating reports faster
This tutorial uses a relatively small sample data set, so these reporting searcheswere relatively quick. Splunk can generate reports on massive amounts of data,but it can take a lot of time to report on very large data sets. If you're runningthese reports on a regular schedule, it's more efficient summarize the data eachtime the search runs and create reports against these summaries.
Searches that use reporting commands--searches that generate reports in theform of tables and charts--are eligible for Report acceleration. Setting this up fora large dataset search is as easy as clicking a checkbox and setting a timerange. Future runs of the search should run faster as long as they're run (at leastpartially) within this time range.
Report acceleration is good for just about any slow-completing search that has100k or more hot bucket events and which meets the qualifying conditionsoutlined in "About report acceleration and summary indexing" in the KnowledgeManager Manual.
For more information and examples of qualifying and nonqualifying searches see"Manage report acceleration" in the Knowledge Manager manual.
Next steps
When you're happy with the report you've created, you have a number of optionsfor saving it and sharing it with others. To review these options, read "Saving
75

searches and sharing search results"
You can also create dashboards from your searches and reports. Dashboardscan be made up of multiple panels that each display charts, lists, and other datathat are generated by hidden, predefined searches.
When you're ready, proceed to the next topic which walks you through creatingdashboard panels.
Dashboard examples
Before you proceed with this topic you should review Reporting on field values,where you have already built and saved a few reports. This topic walks youthrough creating simple dashboards that use the same searches and reports thatyou saved in the previous topics.
Back at the Flower & Gift Shop, your boss asks you to put together a dashboardto show metrics about the products sold at the online shop. You also decide tobuild yourself a dashboard to help you or another member of the IT team find andtroubleshoot problems with the online shop.
Creating dashboard panels
All dashboard panels are based on searches. To generate a dashboard panelbased on your search and add it to a new or existing dashboard, click Createand select Dashboard panel... from the menu. Then, use the CreateDashboard Panel dialog to create a new panel for a new or preexistingdashboard, Splunk automatically saves the search that powers the panel as well.
Learn more about dashboards in "Create and edit dashboards via the UI" in theSplunk Data Visualizations Manual.
Dashboard 1: Flower & Gift Shop Products
The first dashboard will show metrics related to the day-to-day purchase ofdifferent products at the Flower & Gift shop. For this dashboard, you'll use thesaved searches:
Products Purchased (Yesterday)• Products & Revenue (Yesterday)• Purchases & Views (Yesterday)•
76
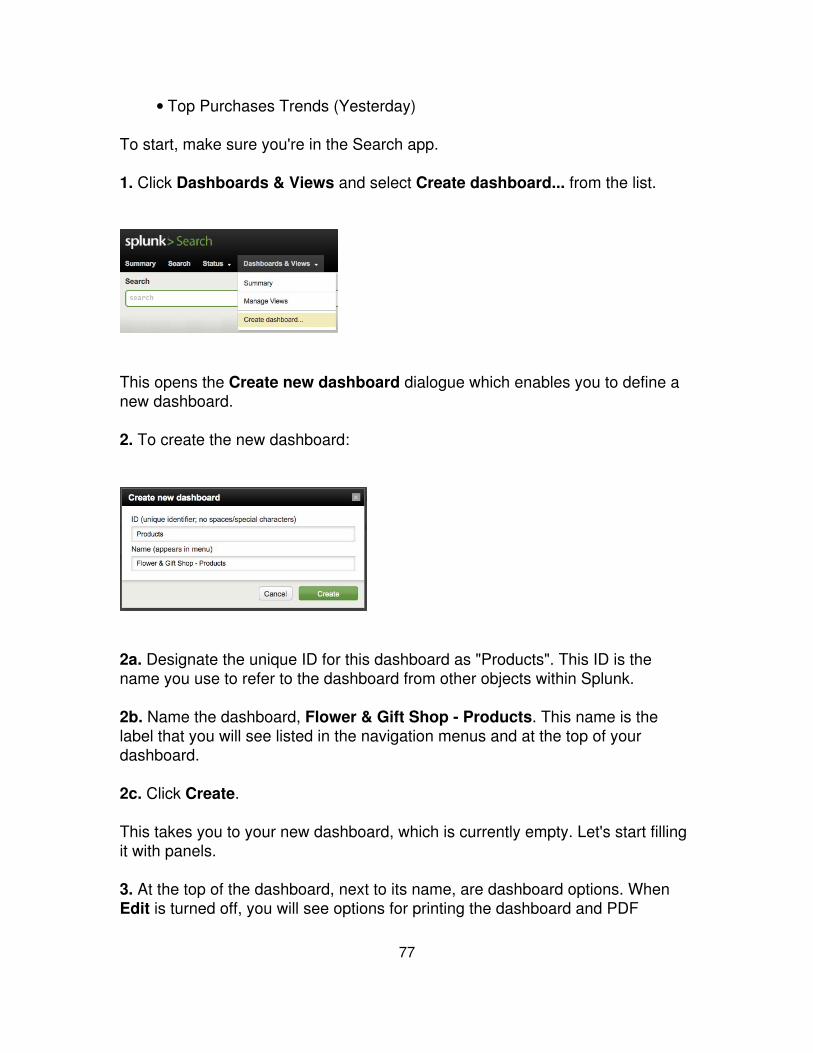
Top Purchases Trends (Yesterday)•
To start, make sure you're in the Search app.
1. Click Dashboards & Views and select Create dashboard... from the list.
This opens the Create new dashboard dialogue which enables you to define anew dashboard.
2. To create the new dashboard:
2a. Designate the unique ID for this dashboard as "Products". This ID is thename you use to refer to the dashboard from other objects within Splunk.
2b. Name the dashboard, Flower & Gift Shop - Products. This name is thelabel that you will see listed in the navigation menus and at the top of yourdashboard.
2c. Click Create.
This takes you to your new dashboard, which is currently empty. Let's start fillingit with panels.
3. At the top of the dashboard, next to its name, are dashboard options. WhenEdit is turned off, you will see options for printing the dashboard and PDF
77

delivery.
Let's not worry about these options right now. You can read more about themlater
3a. To start editing the dashboard, toggle the Edit switch to ON.
When Edit is turned ON, you will see three options:
New panel enables you to add panels to the dashboard.• Edit XML enables you to edit the XML code for the dashboard.• Edit permissions enables you to control who has access to thedashboard.
•
3b. To add a panel to the dashboard, click New panel.
This opens the New panel dialogue which enables you to define properties forthe panel.
4. To add a new panel to the dashboard, give it a name and specify the search toassociate with it:
4a. Under Title, name the panel "Products Purchased (Yesterday)". This is thelabel for the panel.
4b. Under Search command, select "Saved search".
78
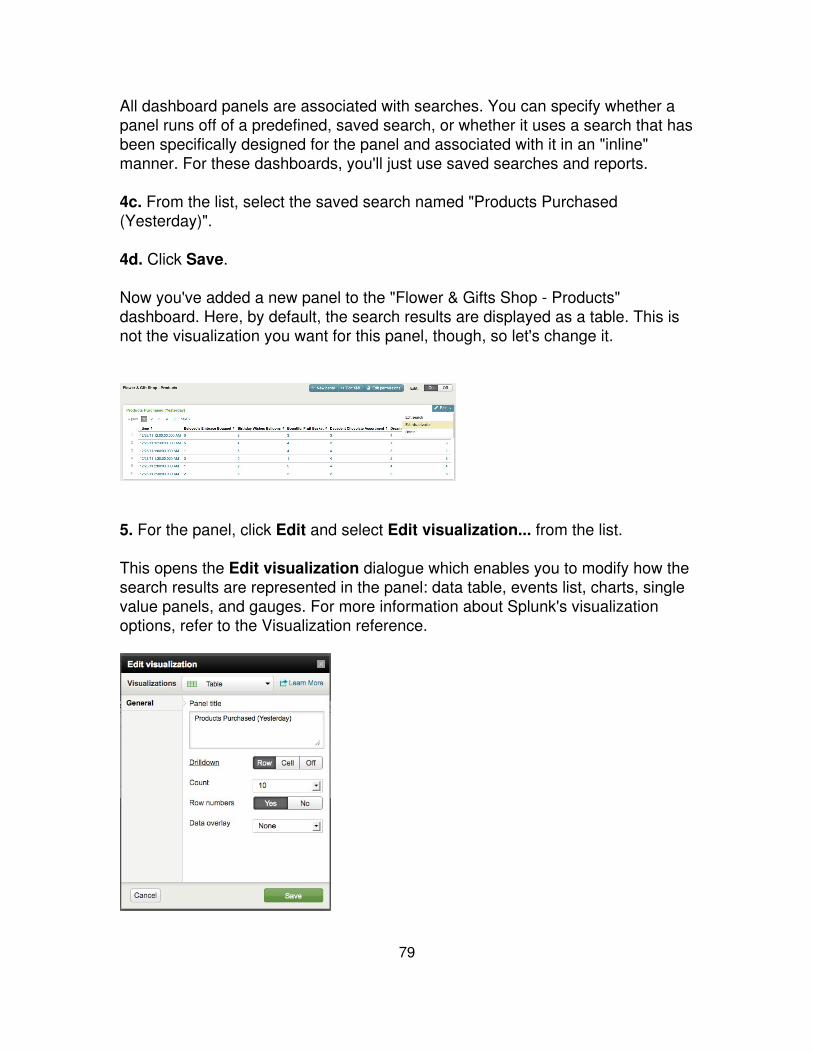
All dashboard panels are associated with searches. You can specify whether apanel runs off of a predefined, saved search, or whether it uses a search that hasbeen specifically designed for the panel and associated with it in an "inline"manner. For these dashboards, you'll just use saved searches and reports.
4c. From the list, select the saved search named "Products Purchased(Yesterday)".
4d. Click Save.
Now you've added a new panel to the "Flower & Gifts Shop - Products"dashboard. Here, by default, the search results are displayed as a table. This isnot the visualization you want for this panel, though, so let's change it.
5. For the panel, click Edit and select Edit visualization... from the list.
This opens the Edit visualization dialogue which enables you to modify how thesearch results are represented in the panel: data table, events list, charts, singlevalue panels, and gauges. For more information about Splunk's visualizationoptions, refer to the Visualization reference.
79

6. From the list of "Visualizations", select Column to display your results in astacked column chart.
7. Click Save.
Now, the panel should look like this:
8. Add two more new panels to the dashboard:
8a. Add panel named Purchases & Views (Yesterday) for the count ofpurchases and views made yesterday (# Purchases & Views). Edit thevisualization type to display a column chart.
8b. Add panel named Products & Revenue (Yesterday) to list the products thatwere sold yesterday and the revenue made from the sales (Purchases andRevenue (Yesterday). Edit the visualization type to display a data table.
8c. Add panel named Top Purchases Trends (Yesterday) to list the productsthat were sold yesterday with sparklines to show the purchasing trend throughout
80

the day. Edit the visualization type to display a data table.
8d. Once you've added the new panels, drag the panels to rearrange them sothat they display like this:
This is your products dashboard. Now let's follow the same steps to create anoperations dashboard.
Dashboard 2: Flower & Gift Shop Operations
The second dashboard includes simple reports that you can view at the start ofyour day to give you some information about recent web access activity. For thisdashboard, you'll use the saved searches:
Total views (Yesterday)• Failed purchases (Yesterday)• Errors (Yesterday)•
To start, return to the Search app.
1. Click Dashboards & Views and select Create dashboard... from the list anddefine a new dashboard for Flower & Gift Shop - Operations.
81
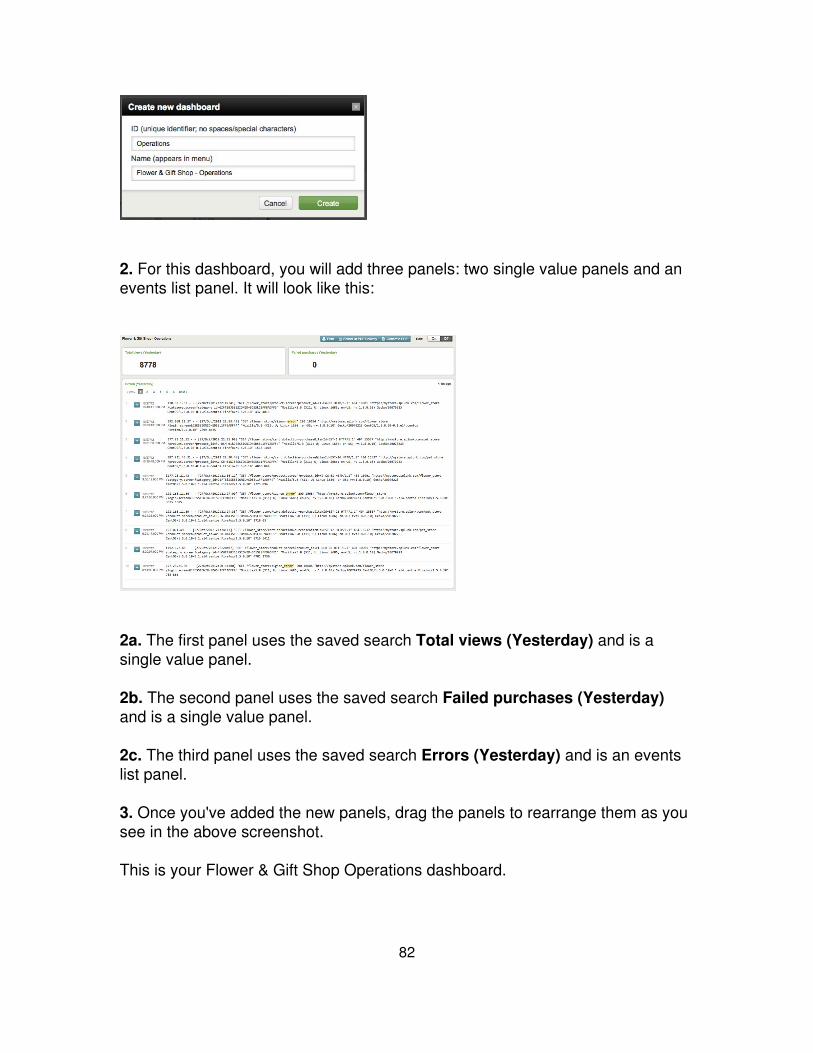
2. For this dashboard, you will add three panels: two single value panels and anevents list panel. It will look like this:
2a. The first panel uses the saved search Total views (Yesterday) and is asingle value panel.
2b. The second panel uses the saved search Failed purchases (Yesterday)and is a single value panel.
2c. The third panel uses the saved search Errors (Yesterday) and is an eventslist panel.
3. Once you've added the new panels, drag the panels to rearrange them as yousee in the above screenshot.
This is your Flower & Gift Shop Operations dashboard.
82
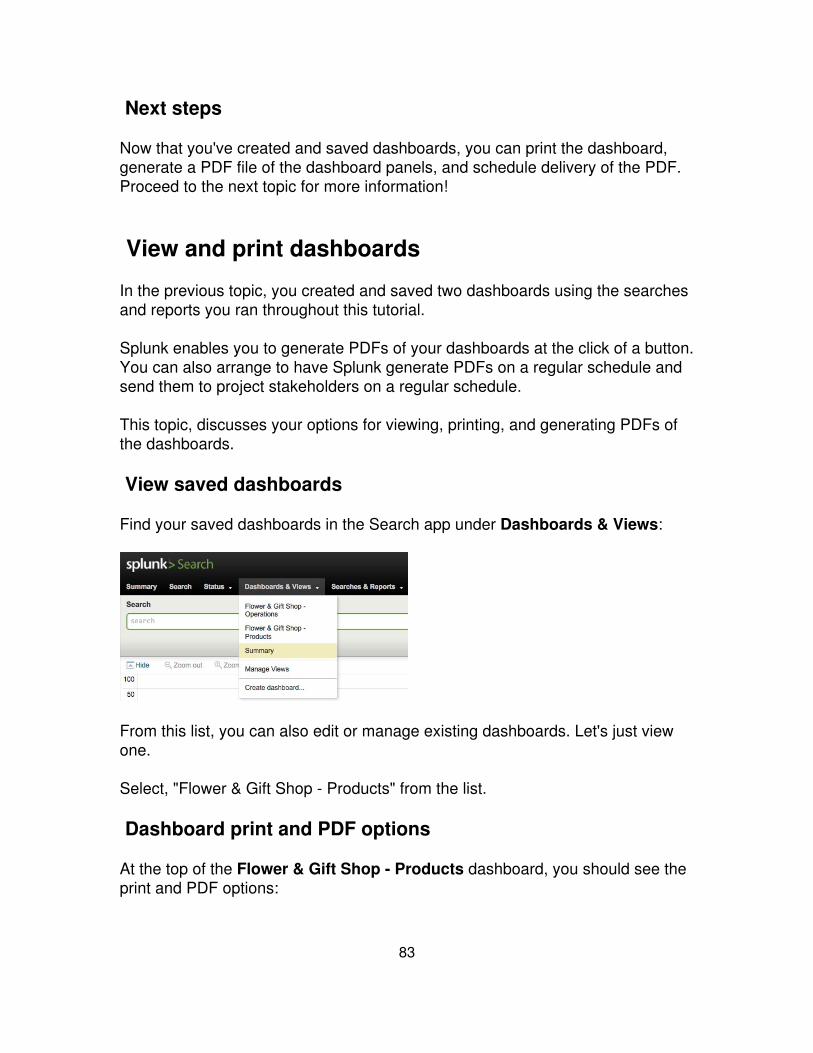
Next steps
Now that you've created and saved dashboards, you can print the dashboard,generate a PDF file of the dashboard panels, and schedule delivery of the PDF.Proceed to the next topic for more information!
View and print dashboards
In the previous topic, you created and saved two dashboards using the searchesand reports you ran throughout this tutorial.
Splunk enables you to generate PDFs of your dashboards at the click of a button.You can also arrange to have Splunk generate PDFs on a regular schedule andsend them to project stakeholders on a regular schedule.
This topic, discusses your options for viewing, printing, and generating PDFs ofthe dashboards.
View saved dashboards
Find your saved dashboards in the Search app under Dashboards & Views:
From this list, you can also edit or manage existing dashboards. Let's just viewone.
Select, "Flower & Gift Shop - Products" from the list.
Dashboard print and PDF options
At the top of the Flower & Gift Shop - Products dashboard, you should see theprint and PDF options:
83
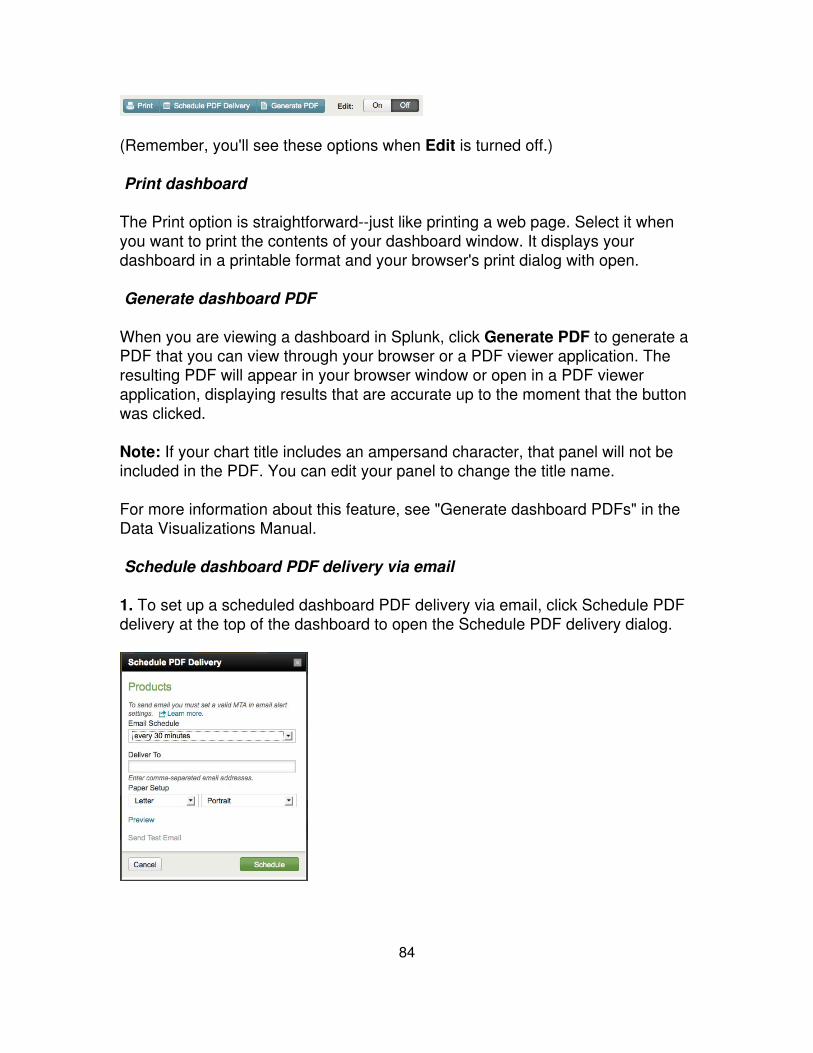
(Remember, you'll see these options when Edit is turned off.)
Print dashboard
The Print option is straightforward--just like printing a web page. Select it whenyou want to print the contents of your dashboard window. It displays yourdashboard in a printable format and your browser's print dialog with open.
Generate dashboard PDF
When you are viewing a dashboard in Splunk, click Generate PDF to generate aPDF that you can view through your browser or a PDF viewer application. Theresulting PDF will appear in your browser window or open in a PDF viewerapplication, displaying results that are accurate up to the moment that the buttonwas clicked.
Note: If your chart title includes an ampersand character, that panel will not beincluded in the PDF. You can edit your panel to change the title name.
For more information about this feature, see "Generate dashboard PDFs" in theData Visualizations Manual.
Schedule dashboard PDF delivery via email
1. To set up a scheduled dashboard PDF delivery via email, click Schedule PDFdelivery at the top of the dashboard to open the Schedule PDF delivery dialog.
84

2. Select a predefined email delivery schedule from the Email Schedule list, ordefine one of your own using standard cron notation. When you select the Cron...option from the list, a field appears in which you can enter the cron schedule.
3. Under Deliver To, enter one or more email addresses, separated by comas,and under Paper Setup choose the paper size and orientation for the PDF thatSplunk will generate.
4. You can test your settings. Click Preview to see a preview of the PDF as yourrecipients will see it. Click Send Test Email to verify that the email settings workcorrectly.
5. When everything is filled out, click Schedule.
When the email is sent, each dashboard PDF will display results that are correctfor the moment that the dashboard was generated.
For more information about this feature, see "Generate dashboard PDFs" in theData Visualizations Manual.
More about integrated PDF generation
PDF functionality in Splunk Web no longer requires you to install the (nowdeprecated) PDF Report Server App. In addition, non-UI PDF reportingfunctionality uses this new integrated PDF generation.
There are exceptions involving forms, dashboards that are built with advancedXML, and simple XML dashboards that have panels that are rendered in Flashrather than JavaScript. For more information about requirements for this feature,review "Upgrade PDF printing for Splunk Web" in the Installation manual.
Next steps
Now that you've completed the tutorial, you're ready for More Splunk!
85
More Splunk!
What happens next?
This tutorial introduced you to some key Splunk capabilties: searching, reporting,and creating dashboards. But, it barely scratched the surface of Splunk featuresand functionalities.
These are other manuals in the Splunk core documentation set:
Admin. This manual is one of several books with important informationand procedures for the Splunk administrator.
•
Knowledge Manager. This manual describes how to manage Splunkknowledge objects, such as event types, tags, lookups, field extractions,workflow actions, saved searches, and views.
•
Alerting. This manual describes Splunk's alerting and monitoringfunctionality.
•
Data Visualizations. This manual describes the range of visualizationsthat Splunk provides.
•
Search. This manual tells you how to search and how to use the Splunksearch language.
•
Search Reference. This reference contains a detailed catalog of theSplunk search commands.
•
Developing Views and Apps for Splunk Web. This manual explainshow to develop views and apps using advanced XML. It also containsother developer topics, such as custom scripts and extending Splunk.
•
REST API Reference. This manual provides information on all publiclyaccessible REST API endpoints.
•
Release Notes. Look here for information about new features, knownissues, and fixed problems.
•
Happy Splunking!
86


