30
Spokane Region Competitiveness Graham Stone Lu Zhai Albaraa Sultan Shaykhah Almahri BADM 585 Strategy, Competitiveness and Economic Development March 17, 2014

Spokane Region Competitiveness
Graham Stone
Lu Zhai
Albaraa Sultan
Shaykhah Almahri
BADM 585
Strategy, Competitiveness and Economic Development
March 17, 2014

2
Table of Contents
1. Executive Summary ............................................................................................................................... 3
2. Introduction ............................................................................................................................................ 4
2.1 Purpose of the Study .................................................................................................................. 4
2.2 Scope of the Study ..................................................................................................................... 4
3. Literature Review ................................................................................................................................... 5
3.1 Harvard Business School 2012 Competitiveness Survey........................................................... 5
3.2 INSEAD EU Competitiveness Survey ....................................................................................... 7
4. Methodology .......................................................................................................................................... 9
4.1 Overview of Survey ................................................................................................................... 9
4.2 Survey Questionnaire ............................................................................................................... 11
4.3 Sample Design ......................................................................................................................... 11
5. Data Findings ....................................................................................................................................... 12
5.1 The Spokane Region Business Environment ........................................................................... 12
5.2 Actions by Business to Enhance Spokane Region Competitiveness ........................................ 16
5.3 Business Actions Patterns ........................................................................................................ 18
5.4 A Willingness to Do More ....................................................................................................... 19
6. Recommendations ................................................................................................................................ 21
7. Limitation ............................................................................................................................................. 22
8. References ............................................................................................................................................ 23
9. Appendix .............................................................................................................................................. 24
List of Figures
Figure 1: U.S. Competitiveness in Three Years, All Business Leaders in 2…………………..…………......6
Figure 2: Current U.S. Position Compared To Other Advanced Economies, 2011-2012 Movement…….....6
Figure 3: Assessment of Policy Proposals, All Business Leaders………………………………….………...7
Figure 4: European Competitiveness in Three Years, 2013………………………………………….……....8
Figure 5: U.S. and European Business Environments………………………………………………………..8
Figure 6: Position and Trajectory of Elements of Spokane Region Business Environment…………..........12
Figure 7: Elements of The National Business Environment………………………………………….….....13
Figure 8: Comparing Spokane Region Vs. U.S. on Elements of Business Environment…………….....….14
Figure 9: Competitiveness in Three Years………………………………………………………….…..…..15
Figure 10: Portion of Business Leaders Whose Firms Take Specific
Actions in Their Spokane Region Operations……………………………………………….……………...17
Figure 11: Comparing Spokane Region Vs. U.S. on Actions Firms Are Taking
To Affect Business Environment…………………………………………………………………………...17
Figure 12: Portion of Firms Would Be Interested in Each
Action………………………………………………………………………………………………...…….19
Figure 13: Comparing Spokane Region Vs. U.S. on Actions Firms Would Like To
Take……………………………………………………………………………………………..……….…20
List of Tables
Table 1: Metropolitan Areas……………………………………………………..……………………...….9
Table 2: Business Actions That May Enhance Competitiveness……………………………….………....16
Table 3: Correlations Across Business Actions ………………………………………………….…...…..18

3
1. Executive Summary
Competitiveness refers to the ability of firms to compete globally and achieve benefits
from their labor. Harvard Business School ("HBS") conducted a survey on U.S
competitiveness to understand and improve the competitiveness of the United States.
The HBS survey was adapted by the European Competitiveness Initiative to improve
global competitiveness of European-based businesses. This paper discusses adaptation of
the HBS competitiveness survey into an instrument which measures the perceptions of
those in the Spokane region business community regarding the competitiveness of the
Spokane region economy and business environment.
The survey on the Spokane Region competitiveness provides an updated view of Spokane
Region business environment. But it also examines specific actions that business leaders
can take to improve the Spokane Region competitiveness. The survey findings reflect the
perspectives of Eastern Washington University (“EWU”) alumni from different sectors
and members of Greater Spokane Incorporated (“GSI”).
In this survey, most of business leaders in the Spokane Region hold relatively neutral
perceptions on the Spokane business environment, which is different from our
assumption and slightly more positive than perceptions of U.S. competitiveness as a
whole, at least judging from the respondents of this survey. Moreover, even though firms
of the Spokane Region haven’t engaged that much in the business actions to enhance
local competitiveness, they show great interest in taking actions to improve the business
environment.
This paper also discusses some possible conclusions and recommendation that might be
drawn from the data. In particular, it identifies a disconnect between positive perceptions
of higher education and the comparatively low perceptions of skilled labor,
entrepreneurship, and innovation. The authors speculate this may be due to a “brain drain”
caused by Spokane lacking an attractive cultural atmosphere. Other negative perceptions
such as logistical infrastructure and the local political landscape are also briefly discussed.
Finally, the limitations of this survey process are discussed. In particular the potential
impact of the small number of participants and their possible unrepresentative selections
are pointed out as limitations.

4
2. Introduction
Regional competitiveness plays an important role in economic performance. This paper
focuses on understanding the perceptions of Spokane Region firms’ abilities to compete
in the U.S. marketplace. Therefore, the Harvard Business School Competitiveness Survey
was adapted into an instrument to investigate local business leaders’ perceptions of the
Spokane Region business environment and actions firms could take to enhance regional
competitiveness. For the purpose of the survey, the Spokane Region is defined as
Spokane, Spokane Valley, Coeur d’Alene, and adjacent cities and towns. This paper also
compares seventeen dimensions of the Spokane Region’s business environment with
those same dimensions in other similar sized regions, larger sized regions and smaller
sized regions in order to analyze the relative position of Spokane Region in the U.S.
marketplace and come up with data which can be used to make recommendations for
improving the region.
Core sections discuss a literature review which will examine what has already been found
regarding U.S. and European competitiveness. The methodology section will include an
overview of the survey questionnaire and sample design. Then, the findings of the data
will be discussed to draw conclusion regarding the findings found in the study.
Limitations and recommendations for future research will also be included in this study.
Finally, the survey questionnaire is appended at the end of the document.
2.1 Purpose of the Study
The purpose of this project was to adapt HBS competitiveness survey into an instrument
which measured the perceptions of those in the Spokane Region business community
regarding the competitiveness of the Spokane Region economy and business environment
so that recommendations can be made to the local government and business community.
2.2 Scope of the Study
The study compiled responses of business professionals who operate in the Spokane
business environment. These responses contain valuable information on the extent to
which respondents feel that issues such as local education opportunities, work conditions,
the legal system, and labor compensation contribute to shaping the economic landscape
of the Spokane Region.

5
3. Literature Review
The survey instrument used in this research was adapted from Harvard Business School
to better understand and improve the Spokane Region's competitiveness. Since this
questionnaire has been tested and conducted by HBS as well as INSEAD, the reliability
and validity is credible. Moreover, for the purpose of comparing the results of the
Spokane Region with the whole U.S. and even European Union, it was necessary to have
an overview of U.S. and European competitiveness. HBS conducted a U.S.
competitiveness survey on their alumni in 2011 and 2012 respectively. In 2013, INSEAD,
inspired by HBS competitiveness research, also launched the EU competitiveness survey.
3.1 Harvard Business School 2012 Competitiveness Survey
The HBS 2012 competiveness survey aimed at finding the perspectives of business
leaders and the general public regarding the competitiveness of the U.S. compared with
other advanced economies.
The HBS survey participants include 70,000 alumni, some of which also took part in a
similar survey in 2011, and 1,025 members of the general public. Questions about the
U.S. business environment have been asked of some participants twice; once in October
2011 and again in September 2012, allowing a longitudinal perspective about U.S.
competitiveness. The different opinions from the two results reflect the changing
impressions of the alumni on U.S. competitiveness over time. But one thing should be
kept in mind: that respondents can be easily influenced by the political climate of the
time. The 2011 survey was administered in October 2011, soon after the July-August
congressional standoff over the federal debt ceiling and Standard & Poor’s downgrading
of the federal government’s credit rating. The 2012 survey was administered in
September 2012, as the U.S. presidential election campaign approached its climax and
after a year of anxiety about the potential breakup of the Euro zone (Porter, Rivkin, and
Kanter, R., 2013).
The HBS 2012 survey focused on three parts of competitiveness topics: the U.S. business
environment, federal policy priorities, and business actions which may enhance U.S.
competitiveness (Porter, Rivkin, and Kanter, R., 2013).
The result showed that business leaders were not positive about the U.S. business
environment, even though they were less pessimistic in 2012 than the previous year.
Figure 1 shows that fifty-eight percent of business leaders thought that U.S.
competitiveness was getting worse; firms would be less competitive in the global market
and less able to pay high wages. Meanwhile, only twenty-five percent held a positive
perspective of increased U.S. competitiveness and increasing wages.

6
FIGURE 1: U.S. COMPETITIVENESS IN THREE YEARS, ALL BUSINESS LEADERS IN 2012
Will firms in the U.S. be more or less able to compete in the global economy?
LESS
NEITHER
LESS NOR
MORE MORE
LESS 28% 17% 7%
NEITHER
LESS NOR
MORE 5% 17% 7%
MORE 1% 5% 14%
Percentages in boxes may not sum to total because of rounding. Source: Harvard Business School Survey on U.S. Competitiveness.
As shown in figure 2, business leaders perceived modest improvement in most elements
of the U.S. business environment between 2011 and 2012. However, perceptions of the
tax code, the K–12 education system, regulation, and the availability of skilled labor
remained stubbornly negative (Porter, Rivkin, and Kanter, R., 2013).
FIGURE 2: CURRENT U.S. POSITION COMPARED TO OTHER ADVANCED ECONOMIES,
2011-2012 MOVEMENT
Source: Harvard Business School Survey on U.S. Competitiveness.
The last part of HBS survey investigated the actions firms could take or did take to
improve business competitiveness. The general actions consisted of internal training
programs, regional initiatives, research collaboration, business-wide lobbying, startup
Will firms in the U.S. be more
or less able to pay high wages
and benefits?
Red, or falling
competitiveness: 58%
in total
Green, or rising
competitiveness: 25%
in total

7
incubation, apprenticeships, local sourcing and cluster initiatives. More than 30% of
respondents stated that their firms took those actions in their U.S. operations to improve
business competitiveness. Figure 3 displays the specific portion of business leaders
whose firms take specific actions in their U.S. operations.
FIGURE 3: ASSESSMENT OF POLICY PROPOSALS, ALL BUSINESS LEADERS
Source: Harvard Business School Survey on U.S. Competitiveness.
The results also showed that the manufacturing sector made the most contributions to U.S.
competitiveness, followed by education and healthcare sectors. Financial services and
construction & real estate took fewer actions to benefit U.S. competitiveness.
3.2 INSEAD EU Competitiveness Survey
INSEAD is one of the leading business schools in the world and has three campuses in
France, Singapore, and Abu Dhabi. The INSEAD European Competitiveness Initiative
(IECI) was inspired by Harvard Business School (HBS) and its U.S. Competitiveness
Project. The main goal of this project is “to impact on improving global competitiveness
of Europe-based businesses” (Gimeno, 2013, p. 3). The alumni survey was one of the
most important activities done by the INSEAD European Competitiveness Initiative in
2013 because it sought to track the evolution of competitiveness. They essentially
focused on Europe; the 27 countries of the European Union (EU 27) and the European
Free Trade Association (EFTA 4) which includes Iceland, Liechtenstein, Norway and
Switzerland as well as micro-states.
The findings were the result of an analysis of the responses to the main two questions: 1)
In three years, will firms in Europe be more or less able to compete in the global
economy? 2) In three years, will firms be more or less able to pay high wages and
benefits?
As shown in Figure 4, the study found that the majority of business leaders, seventy-five
percent, expected European competitiveness to deteriorate, with firms less able to
compete, less able to pay well, or both. Another eleven percent were neutral, anticipating

8
no change on either dimension. Only fourteen percent were optimistic, expecting one or
both dimensions of European competitiveness to improve and neither to decline.
FIGURE 4: EUROPEAN COMPETITIVENESS IN THREE YEARS, 2013
Will firms in Europe be more or less able to compete in the global economy?
LESS
NEITHER
LESS NOR
MORE MORE
LESS 44% 17% 8%
NEITHER
LESS NOR
MORE 5% 11% 4%
MORE 1% 3% 7%
Percentages in boxes may not sum to total because of rounding. Source: INSEAD European Competitiveness Survey: Implementation and Findings.
In addition, Figure 5 shows that twenty-one percent of European business leaders believe
that the current European position is better compared to the business environment of
other advanced economies, whereas sixty-four percent of U.S. business leaders responded
that the current U.S. position is better when compared to the business environment of
other advanced economies (Gimeno, 2013).
FIGURE 5: U.S. AND EUROPEAN BUSINESS ENVIRONMENTS
Source: INSEAD European Competitiveness Survey: Implementation and Findings.
Will firms in Europe be more
or less able to pay high wages
and benefits?
Red, or falling
competitiveness: 75%
in total
Green, or rising
competitiveness: 14%
in total

9
4. Methodology
The methodology section will provide a brief overview of the survey and will discuss the
core sections; the survey questionnaire and the sample design.
4.1 Overview of Survey
Because perception of competitiveness is by its nature a comparison, a scope of
comparison was determined. One possibility was to have participants rate the
competitiveness of Spokane versus that of the world at large, including such advanced
economies as Western Europe, Japan, and the United States. While this comparison
could be made, the scale of comparison between Spokane and such large entities made
the comparison less meaningful. The possibility of limiting the comparison to similar
sized economies in the rest of the world was considered, but that would add another layer
of unnecessary conjecture on the part of the participants, who may not be familiar with
other similar sized economies around the world. It is also taken into consideration that
the previous studies already drew comparisons to the world at large.
Since the Spokane Region is itself made up not only of the City of Spokane, but also
Coeur d'Alene, Post Falls, and Airway Heights, a more meaningful comparison could be
drawn with other metropolitan areas that are similar in population. Because the previous
studies already offered perceptions of the U.S. versus the rest of the world, a study that
focused on the perceptions of Spokane versus other similar sized U.S. metropolitan areas
could then be used to extrapolate perceptions of Spokane vis-a-vis the world. For this
reason, the comparison was focused on other similar sized metropolitan areas. Other
metropolitan areas which would be useful as a comparison to the size of the Spokane
Region were determined by using the Metropolitan Statistical Areas (“MSA”) established
by the U.S. census, which ranked them according to size. Areas such as Salt Lake City
(UT), Colorado Springs (CO), Reno (NV), Jackson (MS), and Des Moines (IA) were
found to be similar to, though somewhat varied from, the Spokane region.
TABLE 1: METROPOLITAN AREAS
MSA Population Median Income GDP Export ( USD)
New York–Northern New Jersey 21,199,865 $57,799 $1,358,416 $102,298,029,869
Seattle–Tacoma–Bellevue, Washington 3,554,760 50,733 258,819 50,301,690,645
Salt Lake City–Ogden, Utah 1,333,914 48,594 72,072 15,989,999,420
Spokane, Washington 417,939 19,233 20,352 873,470,610
Colorado Springs ,Colorado 516,929 46,844 28,029 1,044,574,535
Boise City, Idaho 432,345 20,280 27,455 4,088,209,242
Jackson, Mississippi 440,801 38,887 5,318 942,848,736
Des Moines, Iowa 456,022 46,651 42,129 1,183,201,634
Yakima, Washington 339,486 45,815 20,400 2,018,999,123
Santa Crus, California 264,298 67,769 9,451 838,042,424
Reno ,Nevada 222,581 34,828 8,108 1,181,158,276
Waco, Texas 213,517 33,560 9,691 398,046,200
Bellingham, Washington 166,814 40,005 9,888 1,642,712,278

10
Table 1 shows the variability of prosperity indicators of similar sized metropolitan areas
such as median income, exports, and GDP. The table includes thirteen MSAs with
population figures which can be divided into three categories based on population: high
population (above 1 million), moderate population (between 300,000 and 1,000,000), and
low population (less than 300,000). As illustrated by table1, the Spokane Region is
ranked seventh among the selected MSAs in population but ranked ninth in terms of
export volume and median income. However, the goal of this project is to measure the
perceptions of business leaders regarding the competitiveness of the Spokane Region,
rather than compare actual indicators. These figures are provided only as a reference for
the reader.
The perceptions of Spokane Region competitiveness were measured in a way as close to
the original survey as possible in order to decrease the possibility that differing results
were due to differences in the underlying instrument. In adapting the survey, minimal
changes were made to existing survey questions. The only questions which were removed
were those which could not be adapted since they inquired about topics that would be
irrelevant to the scope of comparison.
In particular, references to perceptions of the U.S. were changed to perceptions of the
Spokane Region, which was defined in the introduction of the survey instrument. In
addition to that, comparisons to major world economies were changed to comparisons to
similar-sized U.S. metropolitan areas and some examples of similar regions were
included. For example, a section that previously read "For each element, please rate the
U.S. compared to other advanced economies like Western Europe, Japan, and Canada.",
would now read as "For each element, please rate the Spokane area compared to other
similar sized regions in the U.S." These changes customized the scope of the instrument
to the needs of this study; competitiveness of the Spokane compared to that of other
similar size regions in the U.S.
The end result of the adaptation review is a streamlined yet very similar survey
instrument. The only question added was to inquire about the size of the firm the
participant represents. This instrument retains the strengths of the original and can be
used as a parallel study to the previous studies which each have a larger scope of
comparison.

11
4.2 Survey Questionnaire
National competitiveness is “The ability of firms operating in the U.S. to compete
successfully in the global economy while supporting high and rising living standards for
Americans” (Porter, Rivkin, and Kanter, R., 2013, p.1 ). In this study, this concept was
applied to investigate the perceptions of managers of local firms regarding the local
business environment and its ability to support high wages.
This survey consists of four sections including business environment, firm performance,
actions firms do or could take to improve the business environment, and basic
information about the firm. The first set of questions concern the state and trajectory of
seventeen elements that affect how well firms in the Spokane region can compete in the
U.S. market. The second section asks whether firms operating in the Spokane region can
support rising wages and benefits. The third section asks business managers about steps
that their own firm is taking or might take to improve local competitiveness. Finally, the
last section asks basic information about respondents’ firms such as number of employees
and area of business.
4.3 Sample Design
The Spokane Region Competitiveness Survey was designed to include EWU alumni with
known email addresses and members of Greater Spokane Incorporated (GSI). Its design
excludes alumni without email addresses. Alumni with invalid email addresses were also
excluded. GSI and alumni with an email address were considered to be eligible for the
survey.
Each respondent can only respond once to the survey; this requirement exists throughout
the study. Potential participants will receive an introduction email inviting them to
participate in the survey, and a link to the survey itself. The survey was placed online
such that participants could click on their responses for each section before moving on to
the next. Once completed, the website compiled the responses in a form that made
analysis of each question easier.
The survey was sent to 134 business leaders as well as GSI through EWU faculty. The
response rate was 35% for the direct emails to the 134 businesses, plus 12 more responses
from GSI participants with an unknown response rate. Seven respondents started but did
not complete the survey. The respondents are part of organizations of a variety of sizes.
Most of the respondents were employed by private sector, for profit organizations. The
job titles held by respondents were President, CEO, Owner, Financial Specialist,
Financial Analyst and Director of Finance. The main sectors that respondents work in
were professional, financial services, other manufacturing, utilities and other services.
These primary data were collected and analyzed to draw final conclusions of the findings
compared to the previous results of HBS and INSEAD studies.
12
5. Data Findings
5.1 The Spokane Region Business Environment
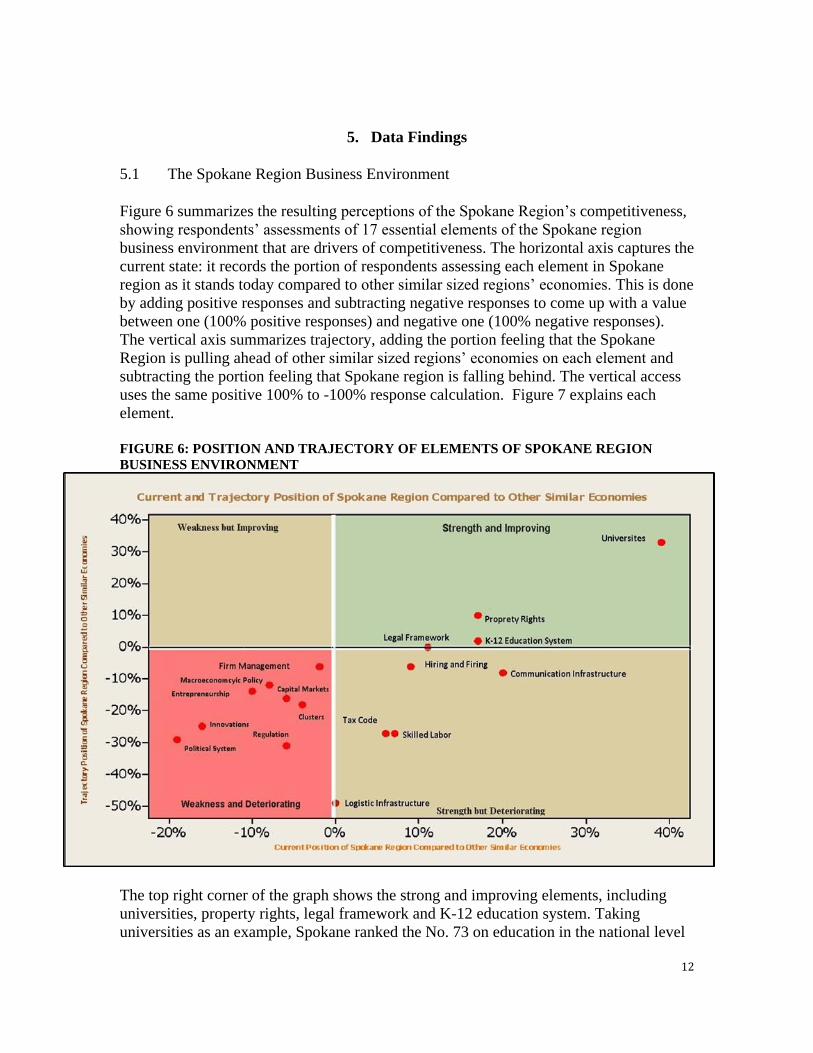
Figure 6 summarizes the resulting perceptions of the Spokane Region’s competitiveness,
showing respondents’ assessments of 17 essential elements of the Spokane region
business environment that are drivers of competitiveness. The horizontal axis captures the
current state: it records the portion of respondents assessing each element in Spokane
region as it stands today compared to other similar sized regions’ economies. This is done
by adding positive responses and subtracting negative responses to come up with a value
between one (100% positive responses) and negative one (100% negative responses).
The vertical axis summarizes trajectory, adding the portion feeling that the Spokane
Region is pulling ahead of other similar sized regions’ economies on each element and
subtracting the portion feeling that Spokane region is falling behind. The vertical access
uses the same positive 100% to -100% response calculation. Figure 7 explains each
element.
FIGURE 6: POSITION AND TRAJECTORY OF ELEMENTS OF SPOKANE REGION
BUSINESS ENVIRONMENT
The top right corner of the graph shows the strong and improving elements, including
universities, property rights, legal framework and K-12 education system. Taking
universities as an example, Spokane ranked the No. 73 on education in the national level

13
(Forbes, 2013). According to U.S. News & World Report’s 2012 college rankings,
Gonzaga University is the No. 3 best university in the West. Whitworth University was
recognized No. 2 on the best values list in 2012. In U.S. News’ 2010 America’s Best
Colleges guidebook, Spokane is one of only four cities in the U.S. with more than one
school in the top 10 of both the best schools and best values rankings (Greater Spokane
Incorporated, 2014).
However, political system, regulation, innovation, entrepreneurship, clusters, capital
markets, macroeconomic policy and firm management are falling at the left bottom,
which means they are perceived as worse than other similar regions and falling behind
overtime. Some elements like logistics infrastructure, even though respondents value it
average level regarding its current situation, about half of business leaders thought it was
deteriorating overtime. As we all know, there are highways, railroads, and a major airport
in Spokane, but these assets are perceived as falling behind other regions.
FIGURE 7: ELEMENTS OF THE NATIONAL BUSINESS ENVIRONMENT
Source: Harvard Business School Survey on U.S. Competitiveness.
Figure 8 compares perceptions of the Spokane Region and U.S. business leaders on
essential elements of their respective business environments. Data points that fall on the
diagonal line mean that both groups hold the same perception on that aspect of their
business environments, like regulation; which both see as somewhat negative.
Perceptions of the Spokane Region business environment surpassed perceptions of the
U.S business environment in three elements found in the lower right: legal framework,
tax code and k-12 education system. The lower left portion of the figure reflects that

14
perceptions of both the U.S and the Spokane Region are low with respect to political
system and macroeconomic policy.
The upper right area shows that perceptions of both U.S. and Spokane Region
universities, property rights, hiring and firing, communication infrastructure, skilled labor,
and logistic infrastructure, are generally positive. The upper left shows there is a
difference of perception on clusters, capital markets, innovations and entrepreneurship;
which is seen as more negative in the Spokane Region but more positive in the U.S. as a
whole. There is an especially large difference of perception in the areas of innovations,
entrepreneurship, capital markets, and firm management. These areas in particular
deserve additional attention in order to catch up with U.S. perceptions.
FIGURE 8: COMPARING SPOKANE REGION VS. U.S. ON ELEMENTS OF BUSINESS
ENVIRONMENT
Most business leaders in the Spokane Region hold neutral perceptions of the Spokane
Region’s competitiveness, which is slightly positive compared to perceptions of U.S.
competitiveness as a whole. Remember, competitiveness is measured both in the abilities
of firms to compete and the ability to sustain high wages. In this sense, 46% of Spokane
business leaders expected the Spokane Region competitiveness to deteriorate, with firms
either less able to pay high wages or less competitive, or both. 32% were optimistic
(green boxes), expecting one or both dimensions of competitiveness to increase without a
drop in the other dimension.

15
Wil
l fi
rms
in t
he
U.S
. be
more
or
less
able
to
pay
hig
h w
ages
an
d b
enef
its?
Comparing the Spokane Region’s results with that of the U.S., we find more pessimism
in U.S. perceptions. 58% perceived one or both dimensions as weaker versus only 46% in
the Spokane Region. Only 26% perceived the U.S. as positive in one or both categories
without being negative in the other compared to 32% in the Spokane Region. Both
results show that respondents are more doubtful about the future of worker payment than
about the future of firms’ marketplace success. However, business leaders in Spokane
Region cast more doubt on worker pay, while seeming more confident to maintain firms
operating ability.
FIGURE 9: COMPETITIVENESS IN THREE YEARS
5.2
LESS
NEITHER
LESS NOR
MORE MORE
LESS 28% 17% 7%
NEITHER
LESS NOR
MORE 5% 17% 7%
MORE 1% 5% 14%
LESS
NEITHER
LESS NOR
MORE MORE
LESS 8% 30% 6%
NEITHER
LESS NOR
MORE 2% 25% 11%
MORE 0% 8% 13%
Red, or falling
competitiveness:
45% in total
Green, or rising
competitiveness:
30% in total
Red, or falling
competitiveness: 58%
in total
Green, or rising
competitiveness: 25%
in total
Wil
l fi
rms
in t
he
Spokan
e R
egio
n b
e m
ore
or
less
able
to p
ay h
igh w
ages
an
d b
enef
its?
Will firms in the Spokane Region be
more or less able to compete in the
U.S. economy?
Will firms in the U.S. be more or less
able to compete in the global
economy?
Percentages in boxes may not sum to total because of rounding.
Percentages in boxes may not sum to total because of rounding.
16
5.2 Actions by Business to Enhance Spokane Region Competitiveness
Firms play a significant role in regional competitiveness. They enjoy the benefits that a
business environment provides and they can and should take actions to enhance regional
competitiveness.
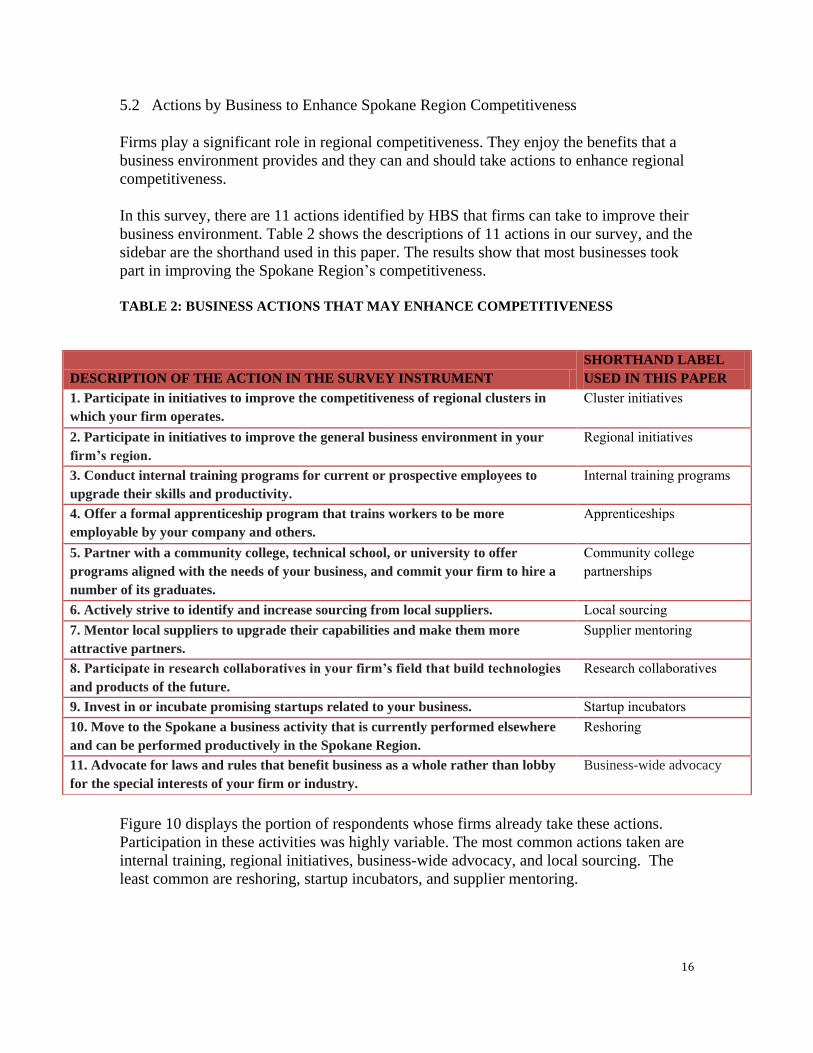
In this survey, there are 11 actions identified by HBS that firms can take to improve their
business environment. Table 2 shows the descriptions of 11 actions in our survey, and the
sidebar are the shorthand used in this paper. The results show that most businesses took
part in improving the Spokane Region’s competitiveness.
TABLE 2: BUSINESS ACTIONS THAT MAY ENHANCE COMPETITIVENESS
Figure 10 displays the portion of respondents whose firms already take these actions.
Participation in these activities was highly variable. The most common actions taken are
internal training, regional initiatives, business-wide advocacy, and local sourcing. The
least common are reshoring, startup incubators, and supplier mentoring.
DESCRIPTION OF THE ACTION IN THE SURVEY INSTRUMENT
SHORTHAND LABEL
USED IN THIS PAPER
1. Participate in initiatives to improve the competitiveness of regional clusters in
which your firm operates.
Cluster initiatives
2. Participate in initiatives to improve the general business environment in your
firm’s region.
Regional initiatives
3. Conduct internal training programs for current or prospective employees to
upgrade their skills and productivity.
Internal training programs
4. Offer a formal apprenticeship program that trains workers to be more
employable by your company and others.
Apprenticeships
5. Partner with a community college, technical school, or university to offer
programs aligned with the needs of your business, and commit your firm to hire a
number of its graduates.
Community college
partnerships
6. Actively strive to identify and increase sourcing from local suppliers. Local sourcing
7. Mentor local suppliers to upgrade their capabilities and make them more
attractive partners.
Supplier mentoring
8. Participate in research collaboratives in your firm’s field that build technologies
and products of the future.
Research collaboratives
9. Invest in or incubate promising startups related to your business. Startup incubators
10. Move to the Spokane a business activity that is currently performed elsewhere
and can be performed productively in the Spokane Region.
Reshoring
11. Advocate for laws and rules that benefit business as a whole rather than lobby
for the special interests of your firm or industry.
Business-wide advocacy

17
FIGURE 10: PORTION OF BUSINESS LEADERS WHOSE FIRMS TAKE SPECIFIC
ACTIONS IN THEIR SPOKANE REGION OPERATIONS
FIGURE 11: COMPARING SPOKANE REGION VS. U.S. ON ACTIONS FIRMS ARE
TAKING TO AFFECT BUSINESS ENVIRONMENT
In figure 11, internal training was the most common action taken by firms at 69%.
Because we have many medium and small sized firms in the Spokane Region, local
sourcing seems like play an important role, almost 20% higher than the national level.
Furthermore, because there are so many education resources here in the Spokane Region,
0% 20% 40% 60% 80% 100%
Reshoring
Startup incubators
Supplier mentoring
Research collaboratives
Cluster initiatives
Apprenticeships
Community college partnerships
Local sourcing
Business-wide advocacy
Regional initiatives
Internal training programs
Yes No Not Applicable Don't know
0%
10%
20%
30%
40%
50%
60%
70%
80%
90%
Spokane Region
U.S.

18
the amount of firms that partner with a community college, technical school, or university
to offer programs is also high. Advocating for laws and rules that benefit business as a
whole also seems like a special character of regional economy. Comparing with national
wide business actions, we still lag behind in research collaboratives and startup
incubators, which are strong factors for an innovation-driven economy.
5.3 Business Actions Patterns
TABLE 3: CORRELATIONS ACROSS BUSINESS ACTIONS
A company’s effort to boost competitiveness is defined not just by the number of
individual actions it takes but also by the way it combines and aligns its actions (Porter,
Rivkin, and Kanter, R., 2013). Table 3 shows the correlation in adoption across each pair
of actions, reflecting how often a firm that adopted one action also pursued another. This
statistical analysis revealed some set of patterns. Firms combined certain kinds of actions
to enhance the business environment and local situation.
Instead of isolated actions, firms sometimes take a set of measures to reinforce actions
effectively and efficiently. For instance, community college partnerships often
accompanied Apprenticeships (correlation index 0.63) as well as internal training
programs. Companies that stressed local sourcing were likely to mentor suppliers
(correlation index 0.51). Startup incubator was commonly employed alongside research
collaboratives (correlation index 0.59).
Cluster Regional Internal Training
Apprenticeships
Community College Local Supplier Research Startup Reshoring
Initiatives Initiative Program Partnerships Sourcing Mentoring Collabora
tive Incubation
Regional initiatives 0.22
Internal training programs 0.17 0.41
Apprenticeships 0.07 0.08 0.43 Community
college+ partnerships 0.10 0.29 0.56 0.63
Local sourcing 0.54 0.15 0.05 -0.01 0.05 Supplier
mentoring 0.47 0.09 0.08 -0.01 0.16 0.51 Research
collaboratives 0.14 0.04 0.39 0.33 0.47 0.14 0.29 Startup
incubation 0.32 0.08 0.36 0.36 0.37 0.32 0.27 0.59 Reshoring -0.07 0.03 0.10 0.16 0.11 0.21 0.18 0.20 0.30
Business-wide lobbying 0.36 0.31 0.23 0.08 0.14 0.44 0.18 0.20 0.32 0.00

19
5.4 A Willingness to Do More
We asked respondents about their firms’ willingness to consider actions that they are not
currently taking. Up to 57% indicated that they might be interested in doing so, with 7-23%
indicating that they would definitely be interested in particular actions as shown in figure
12. Spokane Region business leaders expressed greater interest in taking actions
compared with survey participants at the national level. Internal training programs and
business-wide advocacy attracted the most interest among them, followed by regional
initiatives, local sourcing and cluster initiatives.
FIGURE 12: PORTION OF FIRMS WOULD BE INTERESTED IN EACH ACTION
0% 20% 40% 60% 80% 100%
Cluster initiatives
Regional initiatives
Internal training programs
Apprenticeships
Community college partnerships
Local sourcing
Supplier mentoring
Research collaboratives
Reshoring
Startup incubators
Business-wide advocacy
Portion of firms would be interested in each action
Definitely not interested Probably not interested May or may not be interested

20
FIGURE 13: COMPARING SPOKANE REGION VS. U.S. ON ACTIONS FIRMS WOULD
LIKE TO TAKE
It can be clearly seen from figure 13 that Spokane Region business leaders, compared
with the U.S. as a whole, have more interest in taking business actions to enhance
regional competitiveness. This seems especially true for local sourcing and supplier
mentoring, since most of the respondents work for small and medium sized private
companies, it is reasonable for them to want to cooperate with nearby companies and
build strong relationships with suppliers. Moreover, from a long-term point of view, it
will help companies to cut down costs and control quality with local sourcing.

21
6. Recommendations
While the data does not offer a crystal ball into the problems or solutions of the Spokane
Region economy, it raises some informative points that could guide further study. One of
the Spokane Region’s clearest strengths is in its higher education. This bears out both in
official rankings of schools as well as local perception of them. Not only are our
institutions of higher learning well-perceived now, but participants also predict they will
get better with time. Added to this, many firms report that they take part in activities
such as community college partnerships and apprenticeships. One might think that a
highly rated education system would then translate into a skilled work force, but
perceptions on that point were only mildly positive as to Spokane’s current state of
having a skilled workforce and it is widely perceived that it will get worse.
Possible explanations of this disconnect may be that while we may have the ability to
produce a skilled workforce, Spokane does not retain these workers, who instead move to
other areas. Anecdotally, it seems to be a common complaint that Spokane is “ugly” or
otherwise lacks that certain cultural something that makes it a desirable place to live year
round. Developments such as Kindle Yards may add more recreation space and
attractions, while others such as developing Tubbs Hill (a popular outdoor recreation site
in the middle of civilization) may detract from Spokane’s attractiveness. A focused plan
to improve the collective attractiveness of Spokane as a city to live in may help stymie
this perceived brain drain.
A similar disconnect of perception is that innovation and entrepreneurship are poorly
perceived in both current state and future prospects despite glowing reviews of higher
education. Again, this may be linked to talent moving out of the area.
Linked to Spokane’s attractiveness is another factor that received tepid review: logistical
infrastructure. This factor received middling scores on perceptions of current status, but
was overwhelmingly seen as deteriorating in the future. This could be due to lack of
upkeep on current infrastructure, the snail’s pace of infrastructure improvements such as
the North/South corridor, and or urban sprawl; especially to the North. It may also be
that existing infrastructure, such as the airport, bus system, freeways, and rail systems are
perceived as less convenient or effective than they could be, with no perceived plans to
improve.
By far the lowest perceptions in both current status and future outlook belonged to the
political system. It is no secret that Spokane does no re-elect mayors, which may lead to
a perception of a revolving door of leadership where nothing lasting gets done. Perhaps
if leadership addressed other longstanding points with clear vision for the future, the
residents may be more inclined to keep that leadership in office.

22
7. Limitations
The primary limitations of the survey are the sample population and the sample size.
Since the majority of participants were drawn from the contacts of EWU faculty, the
sample may not be representative of business leaders in the Spokane Region. The sample
is likely to over-represent EWU alumni and others closely related to EWU. Also, despite
the high response rate, the overall sample size is fairly low, which could potentially make
the sample statistically unreliable in representing the greater population. It is possible
that others view Spokane competitiveness significantly differently than our sample
population.
It is also possible that our sample has a higher view of regional education than a less
biased sample that included fewer alumni, which would undermine one of the stronger
findings: that higher education is well-perceived.

23
8. References
Forbes (2013). Best Places For Business And Careers.
Gimeno, J. (2013). INSEAD European competitiveness survey: Implementation and
findings. 2013 INSEAD Faculty Workshop.
Greater Spokane Incorporated (2014). Education.
Porter, M , J Rivkin and R Kanter (2013). Competitiveness at a crossroads. Boston:
Harvard Business School.
The United States Census Bureau (2012). Metropolitan Statistical Areas Rank by
Population.
24
9. Appendix
Spokane Region Competitiveness Survey
Thank you for taking the Spokane Region Competitiveness Survey. The goal of the survey is to
measure the perceptions the Spokane region's economic competitiveness compared to other similar
regions in the U.S. The survey will take approximately 10 minutes and consists of four sections. Many
people find the questions very interesting. Participation in this survey is entirely voluntary and you can
stop at any time. Your responses to the survey are confidential.
This survey is adapted from the Harvard Business School ("HBS") U.S. Competitiveness Survey.
HBS developed this survey to better understand and improve the competitiveness of the United States.
HBS originally conducted its version of this study in 2011 and 2012 and results have been shared
through media such as the Economist. This study has sparked further study through the federal
government on how to improve the competitiveness of the U.S.
Eastern Washington University ("EWU") is part of the Microeconomics of Competitiveness
("MOC") network which is based at Harvard. EWU learned about the Harvard survey through this
network. As part of this MOC network, EWU teaches a course on Strategy, Competitiveness and
Economic Development, instructed by Dr. Harm-Jan Steenhuis. One of the goals of this course is
understanding and improving the competitiveness of the Spokane region. The survey instrument from
HBS was adapted as a project for this course in order to better understand and improve the
competitiveness of the Spokane region, as well as to compare results obtained from respondents in
Spokane with the national HBS survey. The aggregate results of this survey will be shared with HBS and
used for further research.
If you have any questions about this survey, please contact:
Eastern Washington University
Dr. Harm-Jan Steenhuis
Professor of Management and MOC member
Phone: 509-828-1202
E-mail: [email protected]
NOTE: For the purpose of the survey, the Spokane Region is defined as Spokane, Spokane Valley,
Coeur d’Alene, and adjacent cities and towns.
25
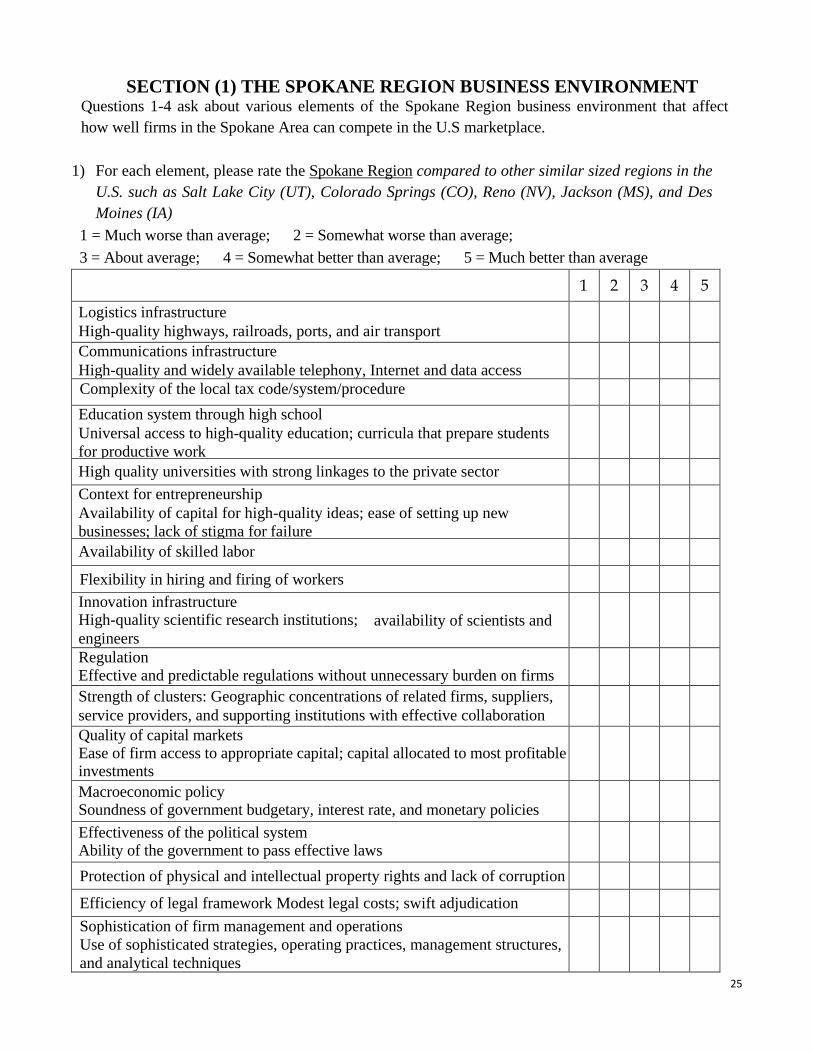
SECTION (1) THE SPOKANE REGION BUSINESS ENVIRONMENT Questions 1-4 ask about various elements of the Spokane Region business environment that affect
how well firms in the Spokane Area can compete in the U.S marketplace.
1) For each element, please rate the Spokane Region compared to other similar sized regions in the
U.S. such as Salt Lake City (UT), Colorado Springs (CO), Reno (NV), Jackson (MS), and Des
Moines (IA)
1 = Much worse than average; 2 = Somewhat worse than average;
3 = About average; 4 = Somewhat better than average; 5 = Much better than average
1 2 3 4 5
Logistics infrastructure
High-quality highways, railroads, ports, and air transport
Communications infrastructure
High-quality and widely available telephony, Internet and data access
Complexity of the local tax code/system/procedure
Education system through high school
Universal access to high-quality education; curricula that prepare students
for productive work
High quality universities with strong linkages to the private sector
Context for entrepreneurship
Availability of capital for high-quality ideas; ease of setting up new
businesses; lack of stigma for failure
Availability of skilled labor
Flexibility in hiring and firing of workers
Innovation infrastructure High-quality scientific research institutions; availability of scientists and engineers
Regulation Effective and predictable regulations without unnecessary burden on firms
Strength of clusters: Geographic concentrations of related firms, suppliers,
service providers, and supporting institutions with effective collaboration
Quality of capital markets Ease of firm access to appropriate capital; capital allocated to most profitable investments
Macroeconomic policy Soundness of government budgetary, interest rate, and monetary policies
Effectiveness of the political system Ability of the government to pass effective laws
Protection of physical and intellectual property rights and lack of corruption
Efficiency of legal framework Modest legal costs; swift adjudication
Sophistication of firm management and operations
Use of sophisticated strategies, operating practices, management structures,
and analytical techniques

26
2) Compared to other similar sized regions, would you say that the Spokane Region business
environment, overall, is…
A. Much worse than average
B. Somewhat worse than average
C. About average
D. Somewhat better than average
E. Much better than average
3) Over time, is each element of the Spokane Region business environment falling behind, keeping pace
with, or pulling ahead of the same element in similar sized regions?
1 = Falling behind; 2 = Keeping pace; 3 = Pulling ahead
1 2 3
Logistics infrastructure
High-quality highways, railroads, ports, and air transport
Communications infrastructure
High-quality and widely available telephony, Internet and data access
Complexity of the local tax code/system/procedure
Education system through high school
Universal access to high-quality education; curricula that prepare students for
productive work
High quality universities with strong linkages to the private sector
Context for entrepreneurship
Availability of capital for high-quality ideas; ease of setting up new
businesses; lack of stigma for failure
Availability of skilled labor
Flexibility in hiring and firing of workers
Innovation infrastructure High-quality scientific research institutions; availability of scientists and engineers
Regulation Effective and predictable regulations without unnecessary burden on firms
Strength of clusters: Geographic concentrations of related firms, suppliers,
service providers, and supporting institutions with effective collaboration
Quality of capital markets Ease of firm access to appropriate capital; capital allocated to most profitable investments
Macroeconomic policy Soundness of government budgetary, interest rate, and monetary policies
Effectiveness of the political system Ability of the government to pass effective laws
Protection of physical and intellectual property rights and lack of corruption
Efficiency of legal framework Modest legal costs; swift adjudication
Sophistication of firm management and operations
Use of sophisticated strategies, operating practices, management structures, and
analytical techniques

24
4) Over time is the overall Spokane Region business environment falling behind, keeping pace with, or
pulling ahead of the business environments in…
Falling
behind
Keeping
pace
Pulling
ahead
Other similar sized regions in the U.S. such as Salt Lake City (UT), Colorado Springs (CO), Reno (NV), Jackson (MS), and Des
Moines (IA)
Other larger regions in the U.S. such as New York-Newark-Jersey City, and Seattle-Tacoma (WA)
Other smaller regions in the U.S. such as Waco (TX), Bellingham (WA), Santa Cruz (CA)
SECTION (2) SPOKANE REGION FIRM’S PERFORMANCE The next set of questions (5-8) asks about the performance of firms from the Spokane Region.
5) Think about firms operating in the Spokane Region. Overall, how successful are these firms at
competing in the U.S. marketplace against firms operating in other similar sized regions in the U.S.
such as Salt Lake City (UT), Colorado Springs (CO), Reno (NV), Jackson (MS), and Des Moines
(IA)?
A. Not at all successful
B. Not very successful
C. Somewhat successful D. Very successful
E. Extremely successful
6) Three years from now, do you expect the ability of firms operating in the Spokane Region to
compete successfully against firms from similar sized regions in the U.S. to be…
A. Much worse than today
B. Somewhat worse
C. The same
D. Somewhat better
E. Much better than today
7) Three years from now, do you expect firms operating in the Spokane Region to be…
A. Much less able to support high wages and benefits
B. Somewhat less able to support high wages and benefits
C. Neither less nor more able to support high wages and benefits
D. Somewhat more able to support high wages and benefits
E. Much more able to support high wages and benefits
8) Can your firm’s Spokane Region operations compete successfully in the U.S. marketplace and
maintain current employment levels…
A. While supporting rising wages and benefits for an average employee
B. While supporting stable wages and benefits
C. Only with declining wages and benefits for an average employee
D. Your firm does not compete in the whole U.S. marketplace

25
SECTION (3) ACTIONS OF FIRMS
The next two questions ask about actions your firm is taking or might take in the future. 9) To the best of your knowledge, does your firm or organization currently take any of the following
actions in its Spokane Region based operations?
Yes No
Not
Appli-
cable
Don’t
know
Participate in initiatives to improve the competitiveness
of regional clusters in which your firm operates
Clusters are geographic concentrations of related firms,
suppliers, service providers, and supporting institutions
with effective collaboration
Participate in initiatives to improve the general business
environment in your firm’s region
Conduct internal training programs for current or
prospective employees to upgrade their skills and
productivity
Offer a formal apprenticeship program that trains
workers to be more employable by your firm and others
Partner with a community college, technical school, or
university to offer programs aligned with the needs of
your business, and commit your firm to hire a number of
its graduates
Actively strive to identify and increase sourcing from
local suppliers
Mentor local suppliers to upgrade their capabilities and
make them more attractive partners
Participate in research collaboratives in your firm’s field
that build technologies and products of the future
Invest in or incubate promising startups related to your
business
Move to the Spokane Region a business activity that is
currently performed elsewhere and can be performed
productively in the Spokane Region
Advocate for laws and rules that benefit business as a
whole rather than lobby for the special interests of your
firm or industry

26
10) Among the actions your firm does not currently take, would your firm be interested in undertaking
each of the following in its Spokane Region operations?
1 = Definitely not interested; 2 = Probably not interested; 3 = May or may not be interested
4 = Probably interested; 5 = Definitely interested; 6= Not applicable.
1
2
3
4
5
NA
Join or establish initiatives to improve the competitiveness of regional clusters in which your firm operates Clusters are geographic concentrations of related firms, suppliers, service providers, and supporting institutions with collaboration
Join or establish initiatives to improve the general business environment in your firm’s region.
Establish an internal program for current or prospective employees to upgrade their skills and productivity.
Create an apprenticeship program that trains Spokane Region workers to be more employable by your firm and others.
Enter into a partnership with a community college, technical school, or university to offer programs aligned with the needs of your business, and commit your firm to hire a number of its graduates.
Identify and increase sourcing from local suppliers.
Mentor local suppliers to upgrade their capabilities and make them more attractive partners.
Join or establish research collaboratives in your firm’s field that build technologies and products of the future.
Invest in or incubate promising startups related to your business.
Move to the Spokane Region a business activity that is currently performed elsewhere and can be performed productively in the Spokane Region.
Invest in or incubate promising startups related to your business.
Advocate for laws and rules that benefit business as a whole rather than lobby for the special interests of your firm or industry.

27
SECTION (4) YOUR FIRM’s INFORMATION
Questions 11-17 request information about your firm.
11) What is the size of your firm?
A. 0-20 employees B. 21-50 employees C. 51-100 employees D. 101-200 employees
E. 201-500 employees F. 501-1000 employees G >1000 employees
12) What is your current job title? ____________________________________________
13) Does your firm have any business activities outside the Spokane Region?
A. Yes B. No
14) Is your firm exposed to international competition?
A. Yes B. No
15) Does your firm do any international business?
A. Yes B. No
16) Are you employed by a…
A. Private sector, for-profit organization
B. Nonprofit organization C. Public sector or government organization
17) In what sector do you work?
Insurance Construction Accommodation and
Food Services
Financial Services
Real Estate
Health Care and Social
Assistance
Accounting
Wholesale and Retail Trade
Arts, Entertainment,
and Recreation
Professional Services Manufacturing: Food and
Beverage
Transportation and
Logistics
Scientific Services Manufacturing: Textile and
Apparel
Mining and Oil & Gas
Extraction
Technical Services Manufacturing: Wood,
Paper, and Printing Utilities
Media: Broadcast, Film,
and Multimedia
Manufacturing: Petroleum,
Chemicals, and Plastics
Agriculture, Forestry,
and Fishing
Media: Print and
Publishing
Manufacturing: Metal and
Machinery Educational Services
Telecommunications
Manufacturing: Computer,
Electrical, and Appliance Other Services
Data Processing Other Manufacturing Public Administration
THANK YOU FOR YOUR PARTICIPATION


