35
Sports Nutrition, Sleep and Performance Prof. Jason Ellis
Sports Nutrition, Sleep and Performance
Prof. Jason Ellis
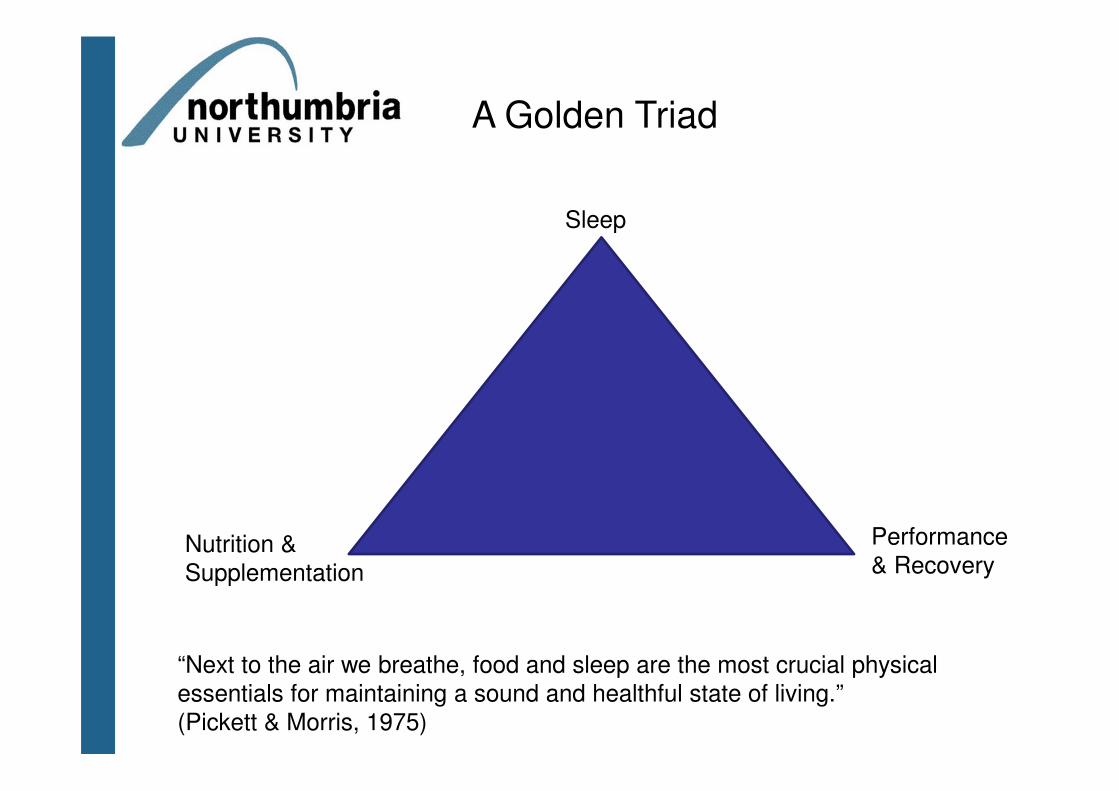
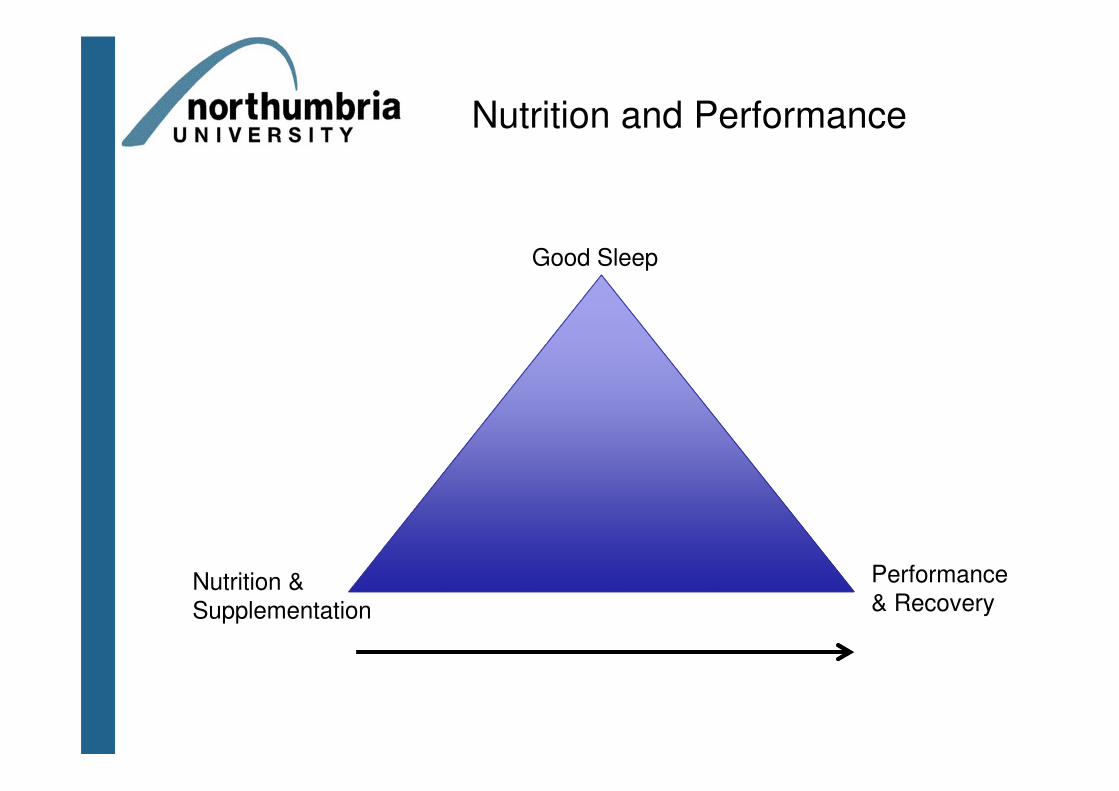
A Golden Triad
Performance
& Recovery
Sleep
Nutrition &
Supplementation
“Next to the air we breathe, food and sleep are the most crucial physical
essentials for maintaining a sound and healthful state of living.”
(Pickett & Morris, 1975)
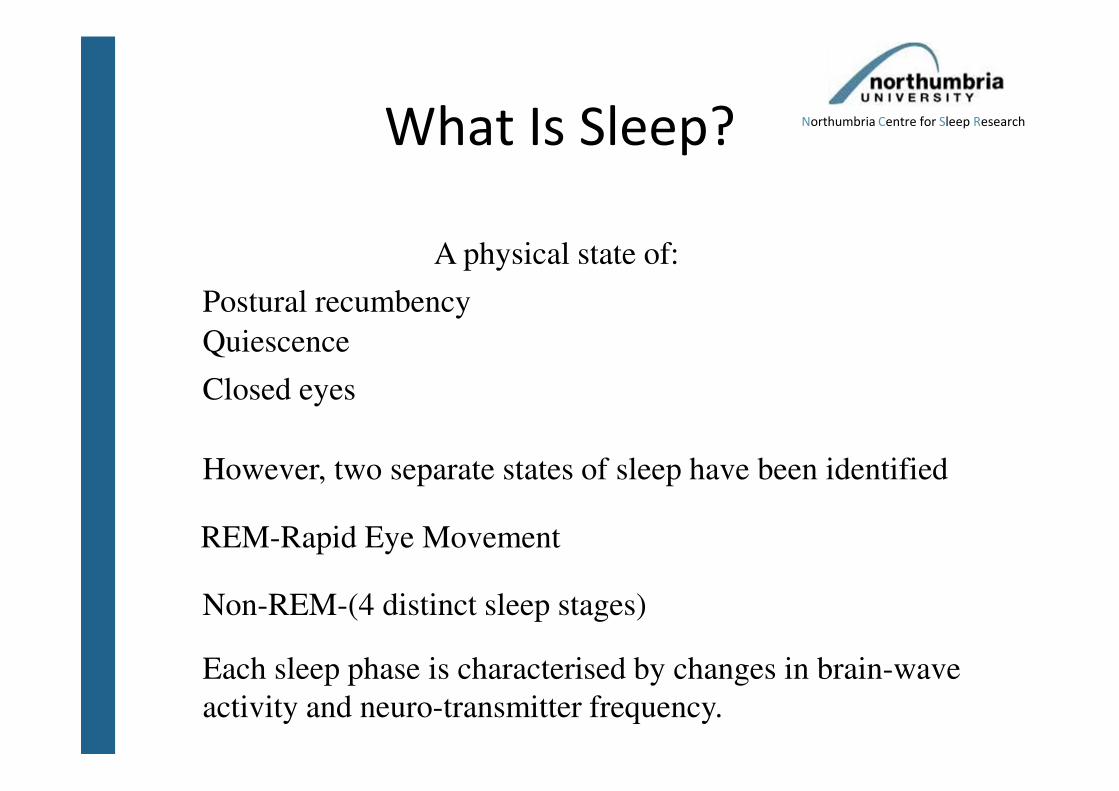
What Is Sleep?
Each sleep phase is characterised by changes in brain-wave
activity and neuro-transmitter frequency.
A physical state of:
Postural recumbency
Quiescence
Closed eyes
However, two separate states of sleep have been identified
REM-Rapid Eye Movement
Non-REM-(4 distinct sleep stages)
Northumbria Centre for Sleep Research
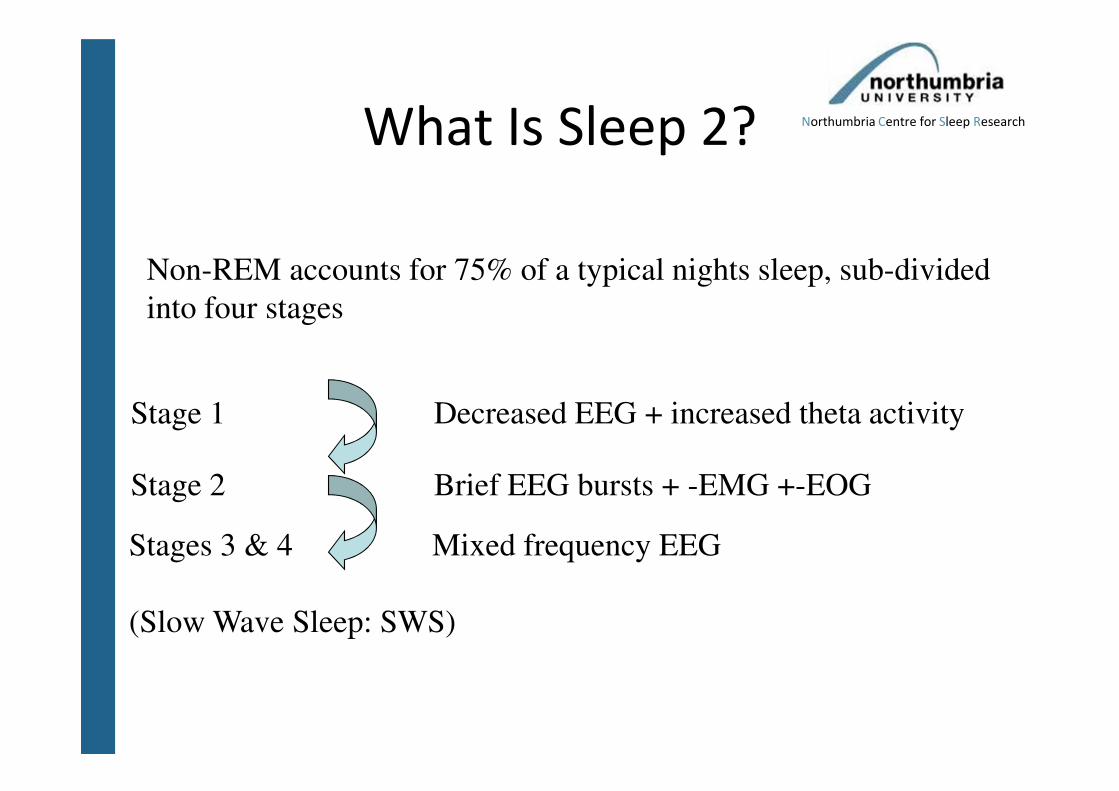
What Is Sleep 2?
Non-REM accounts for 75% of a typical nights sleep, sub-divided
into four stages
Stage 1
Stage 2
Stages 3 & 4
(Slow Wave Sleep: SWS)
Decreased EEG + increased theta activity
Brief EEG bursts + -EMG +-EOG
Mixed frequency EEG
Northumbria Centre for Sleep Research
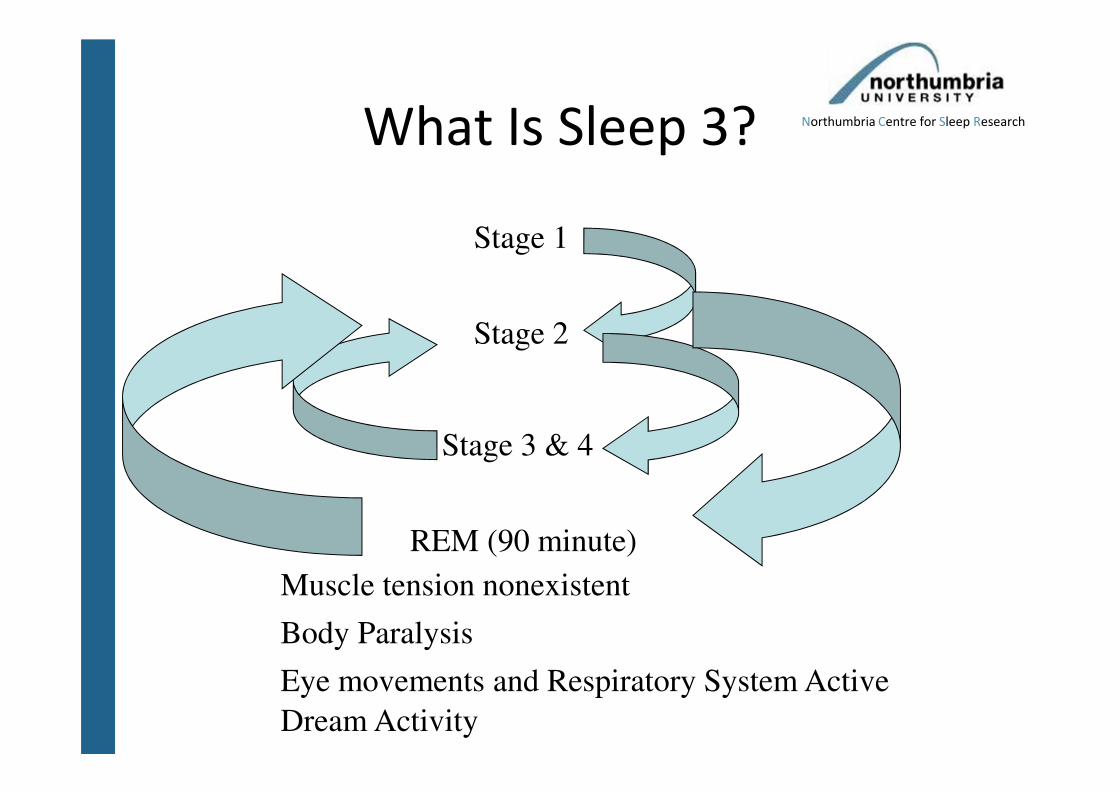
What Is Sleep 3?
Stage 1
Stage 2
Stage 3 & 4
REM (90 minute)
Muscle tension nonexistent
Body Paralysis
Eye movements and Respiratory System Active
Dream Activity
Northumbria Centre for Sleep Research
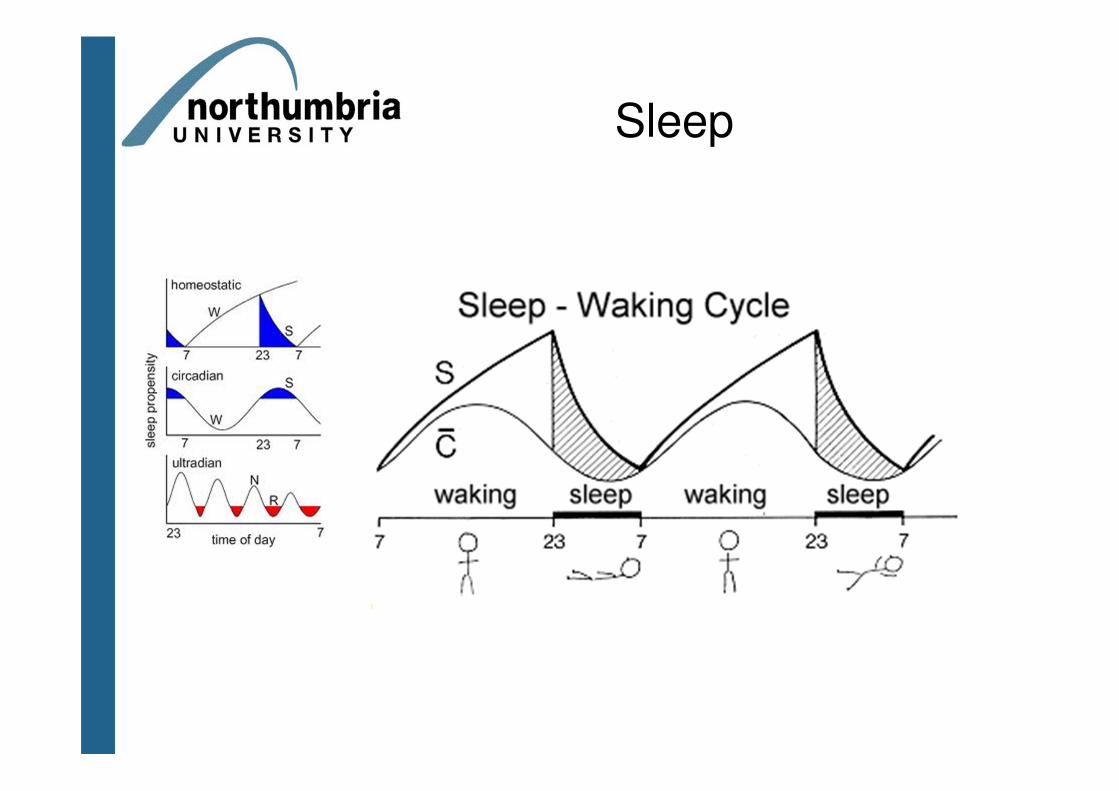
Sleep
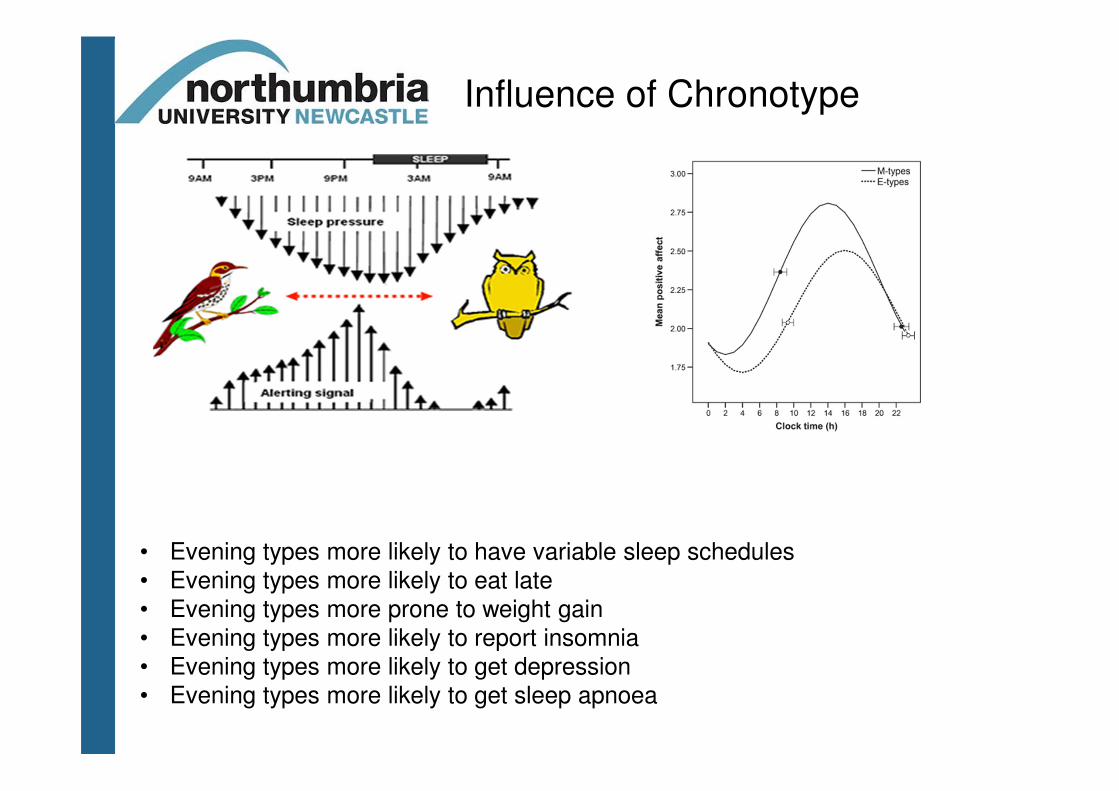
Influence of Chronotype
• Evening types more likely to have variable sleep schedules
• Evening types more likely to eat late
• Evening types more prone to weight gain
• Evening types more likely to report insomnia
• Evening types more likely to get depression
• Evening types more likely to get sleep apnoea
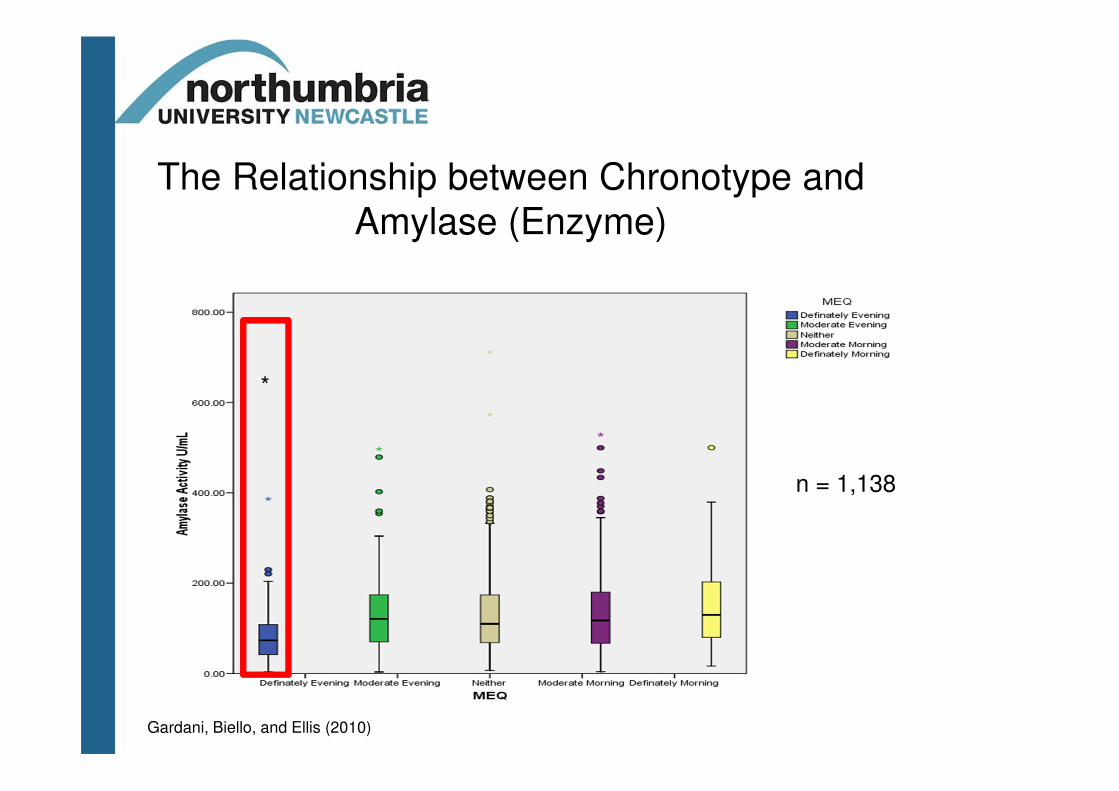
The Relationship between Chronotype and
Amylase (Enzyme)
n = 1,138
*
Gardani, Biello, and Ellis (2010)
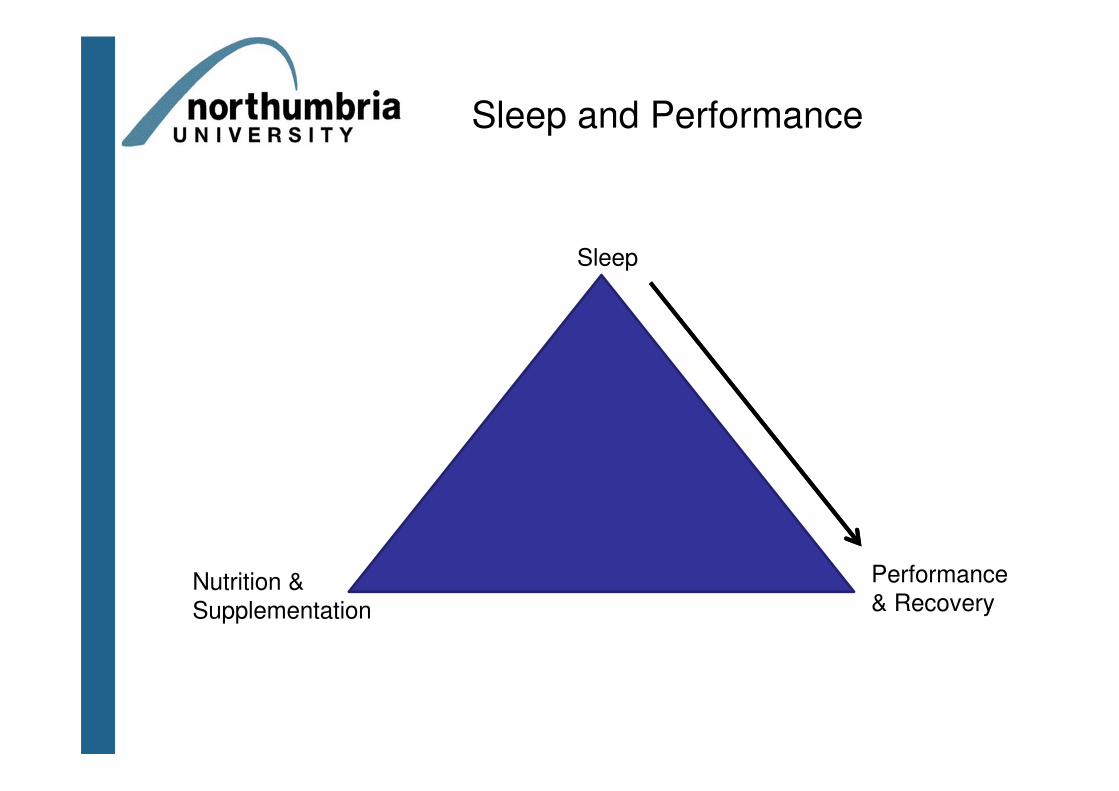
Sleep and Performance
Performance
& Recovery
Sleep
Nutrition &
Supplementation
Normal Sleep in Athletes
• Athletes require 9-10 hours per night (Bompa, 2009; Calder 2003)
• 80-90% of 24h sleep should be at night
• Napping is encouraged in this population (Kentta & Hassmen, 2002)
Unlikely to reflect individual sleep need
Unlikely to reflect variability in different sports
Excess time in bed is likely to lead to fragmented sleep
Excess napping (1h per 24h) is likely to disrupt the sleep homeostat

Normal Sleep in Athletes
Sleep in athletes:
Leeder et al (2012) – 46 Athletes vs. 20 Controls
Canoeing
Diving
Rowing
Speed Skating
Actigraphy
Lower Sleep Efficiency – 80.6% vs. 88.7% (Clinical Threshold)
Higher Sleep Fragmentation – 36 vs. 29.8 (%epochs of >0 during sleep)
Higher Time in Bed – 8h 36minutes vs. 8h 07minutes
Higher Sleep Onset Latency – 18.2minutes vs. 5minutes
Lower Total Sleep Time – 6h 55minutes vs. 7h 11minutes
Most research to date is self-report
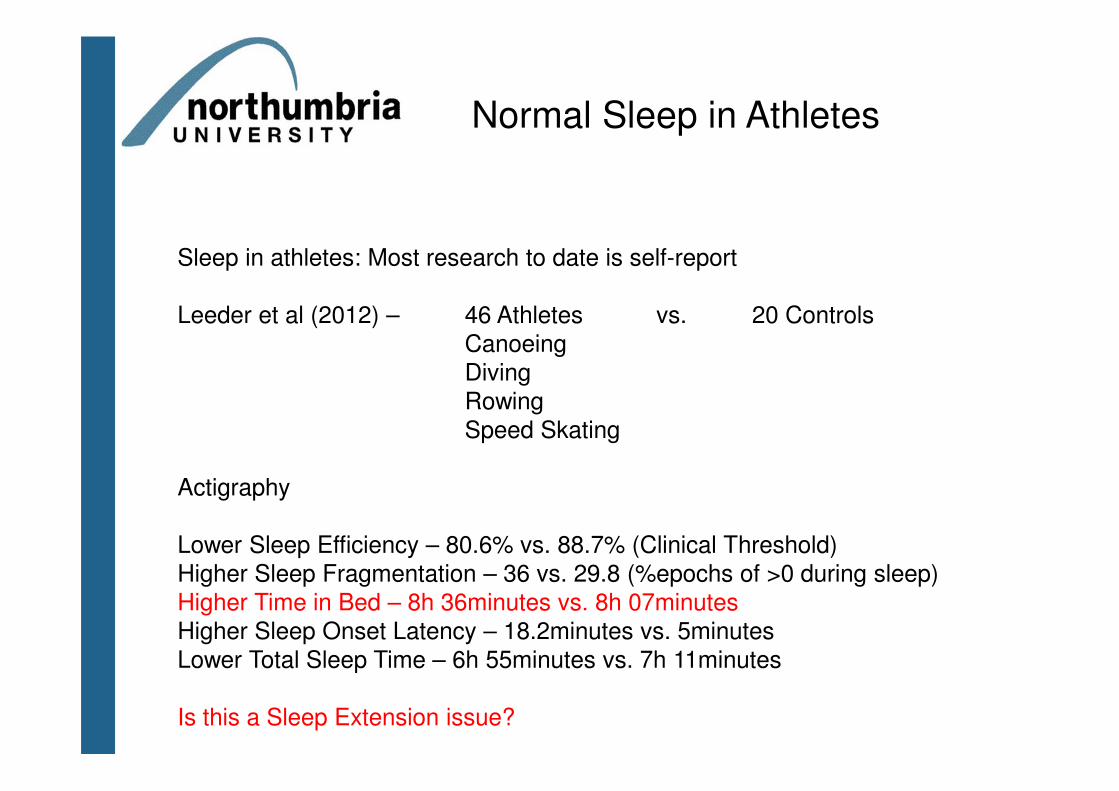
Normal Sleep in Athletes
Sleep in athletes: Most research to date is self-report
Leeder et al (2012) – 46 Athletes vs. 20 Controls
Canoeing
Diving
Rowing
Speed Skating
Actigraphy
Lower Sleep Efficiency – 80.6% vs. 88.7% (Clinical Threshold)
Higher Sleep Fragmentation – 36 vs. 29.8 (%epochs of >0 during sleep)
Higher Time in Bed – 8h 36minutes vs. 8h 07minutes
Higher Sleep Onset Latency – 18.2minutes vs. 5minutes
Lower Total Sleep Time – 6h 55minutes vs. 7h 11minutes
Is this a Sleep Extension issue?
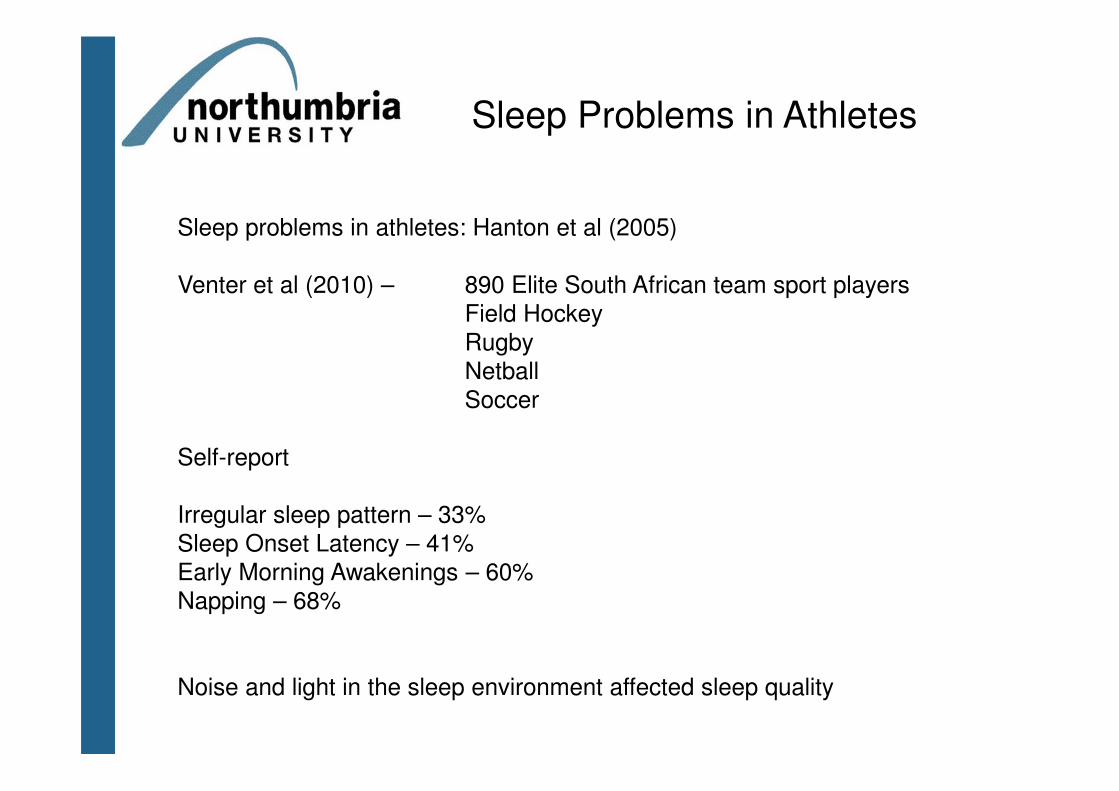
Sleep Problems in Athletes
Sleep problems in athletes: Hanton et al (2005)
Venter et al (2010) – 890 Elite South African team sport players
Field Hockey
Rugby
Netball
Soccer
Self-report
Irregular sleep pattern – 33%
Sleep Onset Latency – 41%
Early Morning Awakenings – 60%
Napping – 68%
Noise and light in the sleep environment affected sleep quality
Nutrition and Performance
Performance
& Recovery
Good Sleep
Nutrition &
Supplementation
Nutrition & Recovery
• Carbohydrate and Fatty Acids – oxidized by skeletal-muscle tissue during
exercise
• Mediated by exercise intensity, duration, and prior exercise status
• Endogenous Carbohydrate stored as muscle and liver glycogen
• Glycogen levels can decline between 30-70% depending on type of exercise
• Following exercise 24h to restore back to pre-exercise levels
(individual differences in glycogen repletion rates)
• Repletion synthesis occurs in two phases:
• Insulin-independent phase (II)(30-60 minutes)
• Insulin-dependent (ID)phase – slower up to 48h
• Supplementation during ID phase with Carbohydrate promotes repletion with
more frequent supplementation conferring more benefits for endurance
recovery
• Similar story for Muscle Protein Synthesis to facilitate muscle-damage repair
(achieve a positive muscle/protein balance) for reconditioning
Nutrition, Performance &
Recovery
• Caffeine or Guarana = 2-6mg/kg optimal for cognitive performance (alertness,
vigilance, STmemory), ameliorating impact of sleep deprivation in terms
of skill execution, sustained performance sport, recovery (combined
with carbohydrate)
• Vitamin D = 25-hydroxy-vitamin D is optimal level for physical performance
(Cannell et al, 2009) and most athletes are deficient and this changes
over seasons and declines with age (Bannert et al,1991)
• Glycerol = 1-1.5g/kg glycerol with 25-35ml fluid provides 600-1000ml (2011
World Anti-Doping Agency ruling against supplemented diuretics)
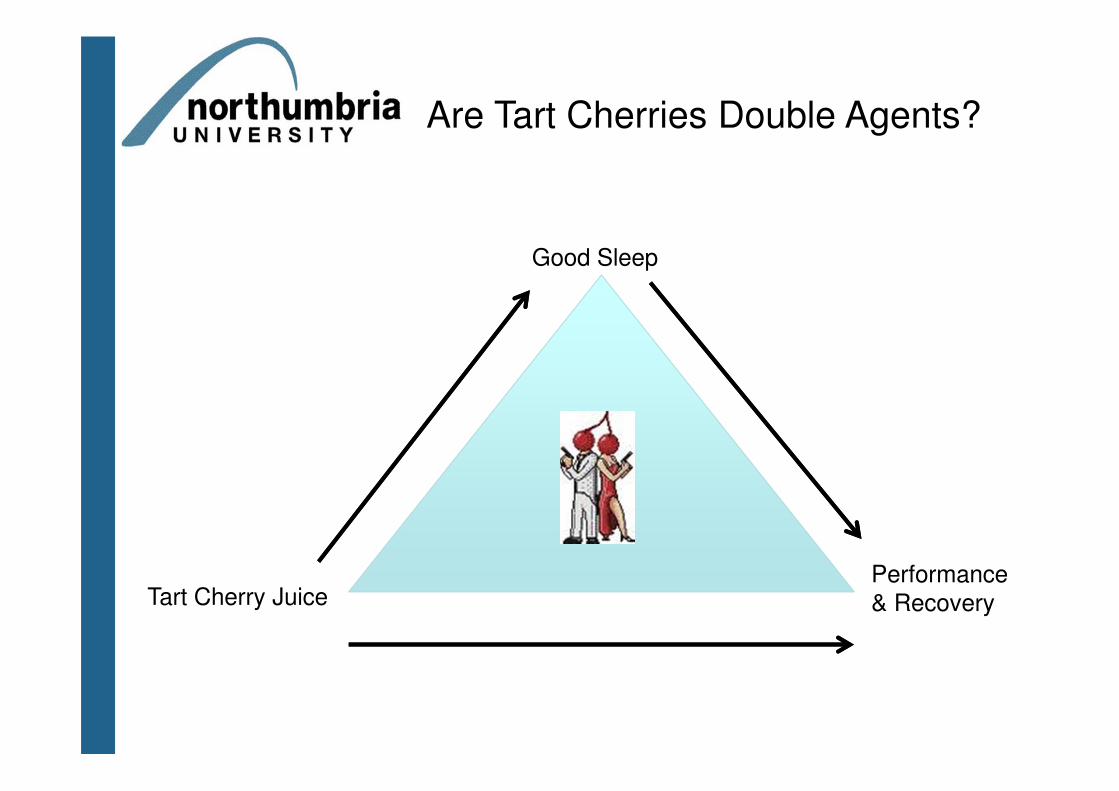
Are Tart Cherries Double Agents?
Performance
& Recovery
Good Sleep
Tart Cherry Juice
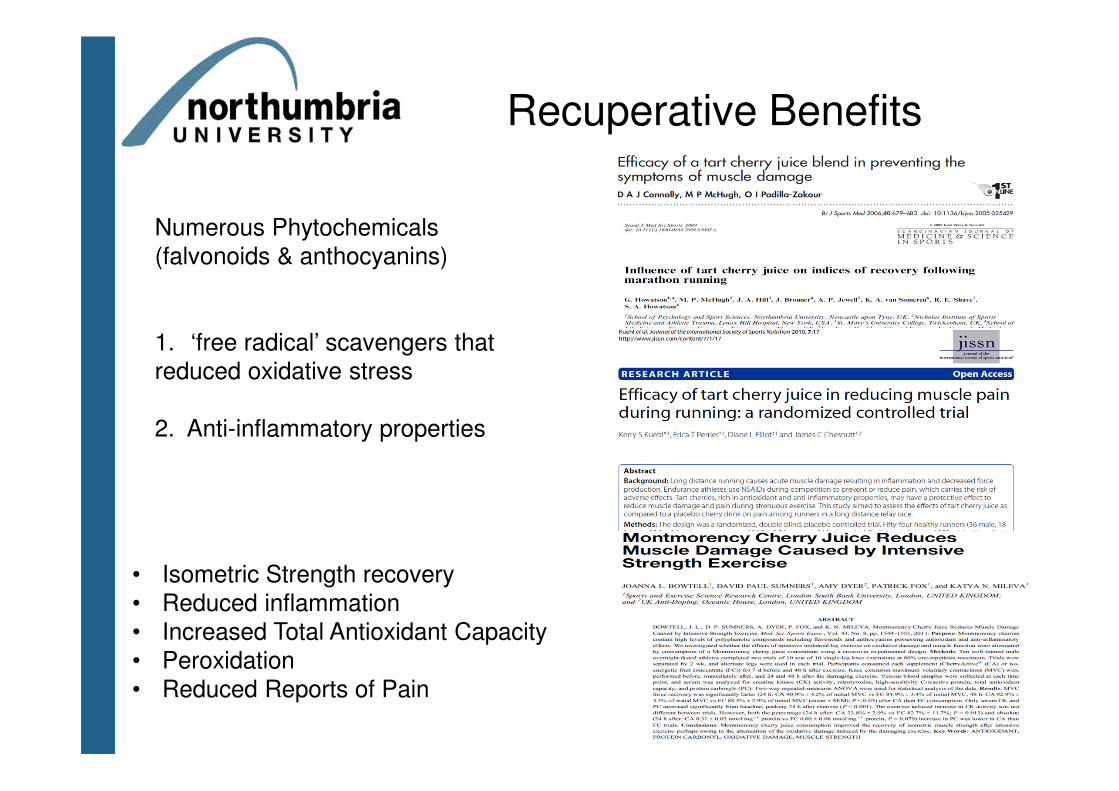
Recuperative Benefits
• Isometric Strength recovery
• Reduced inflammation
• Increased Total Antioxidant Capacity
• Peroxidation
• Reduced Reports of Pain
Numerous Phytochemicals
(falvonoids & anthocyanins)
1. ‘free radical’ scavengers that
reduced oxidative stress
2. Anti-inflammatory properties
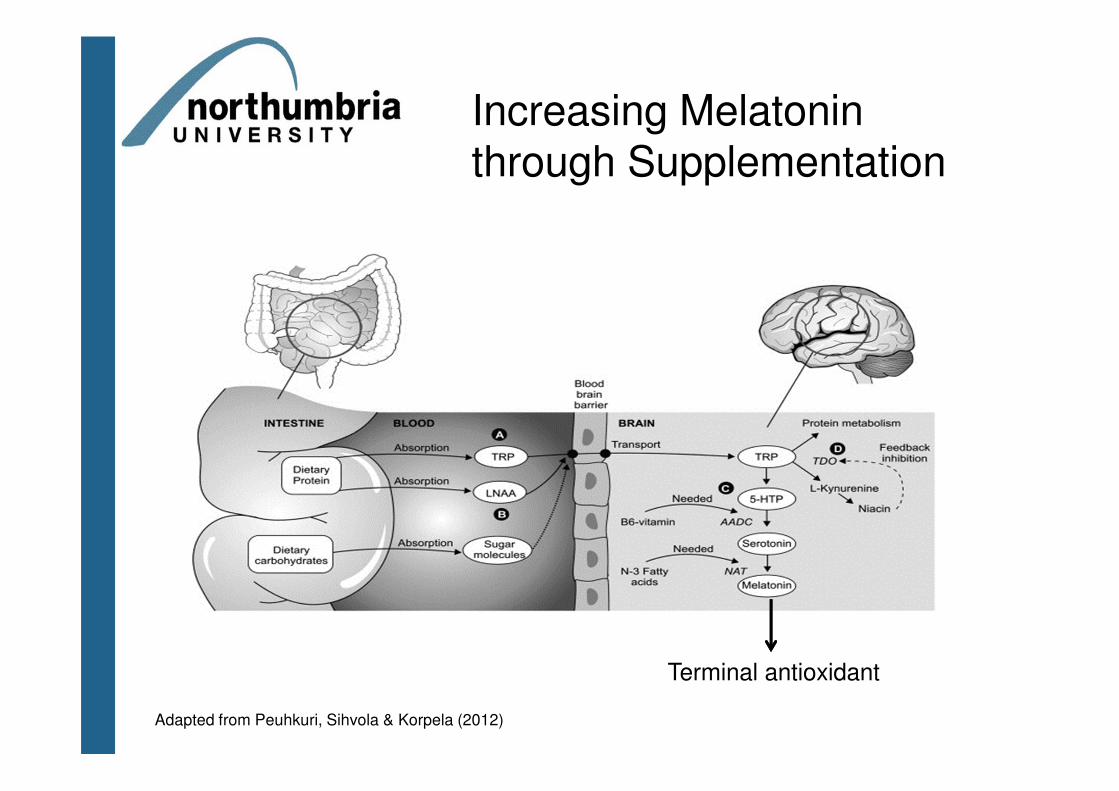
Increasing Melatonin through Supplementation
Terminal antioxidant
Adapted from Peuhkuri, Sihvola & Korpela (2012)
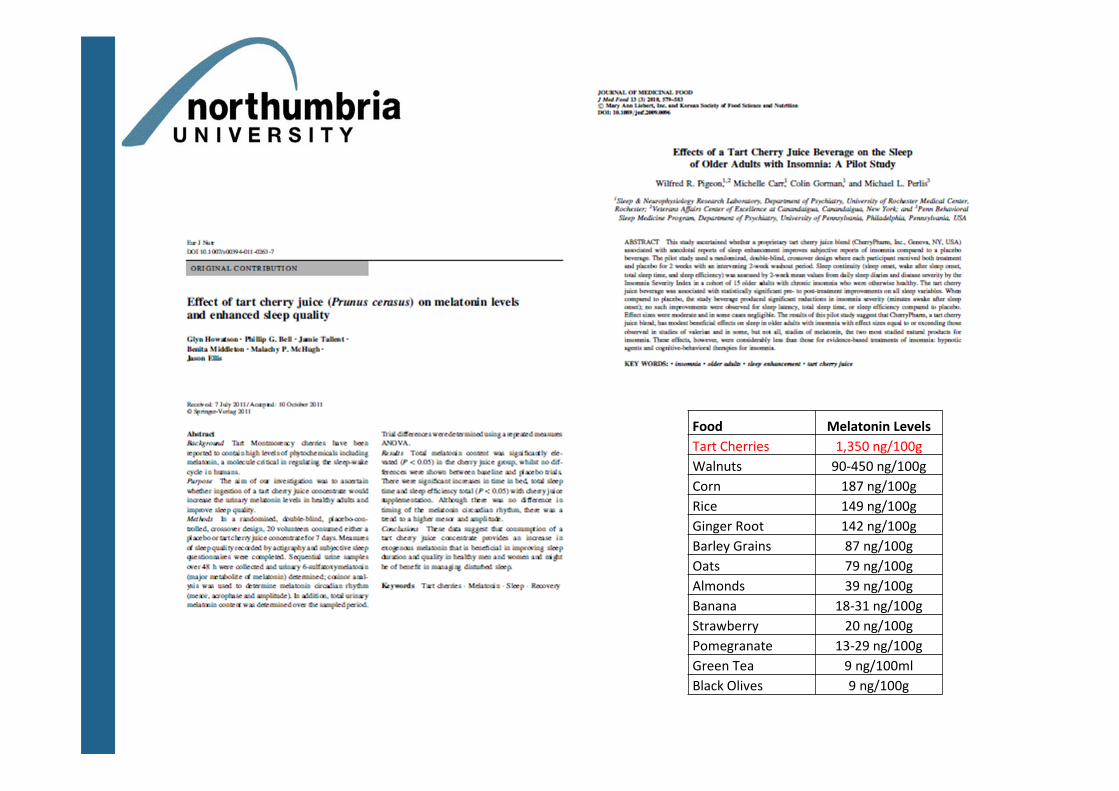
Food Melatonin Levels
Tart Cherries 1,350 ng/100g
Walnuts 90-450 ng/100g
Corn 187 ng/100g
Rice 149 ng/100g
Ginger Root 142 ng/100g
Barley Grains 87 ng/100g
Oats 79 ng/100g
Almonds 39 ng/100g
Banana 18-31 ng/100g
Strawberry 20 ng/100g
Pomegranate 13-29 ng/100g
Green Tea 9 ng/100ml
Black Olives 9 ng/100g
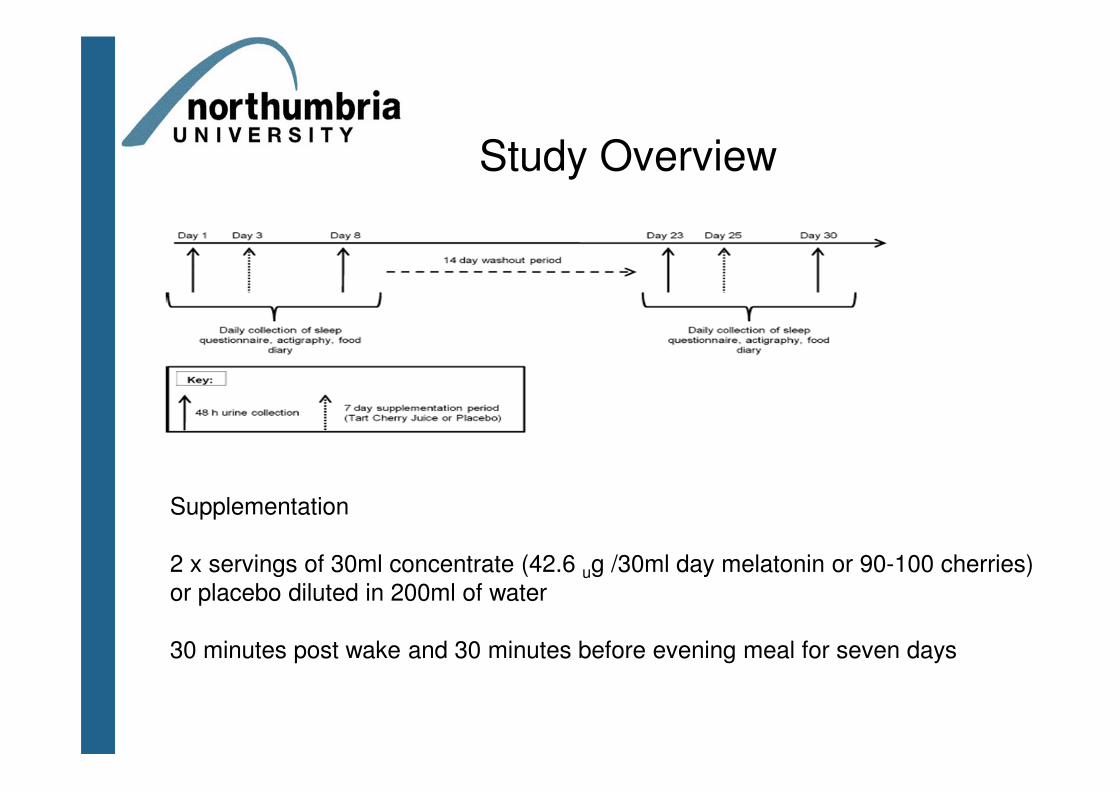
Study Overview
Supplementation
2 x servings of 30ml concentrate (42.6 ug /30ml day melatonin or 90-100 cherries)
or placebo diluted in 200ml of water
30 minutes post wake and 30 minutes before evening meal for seven days
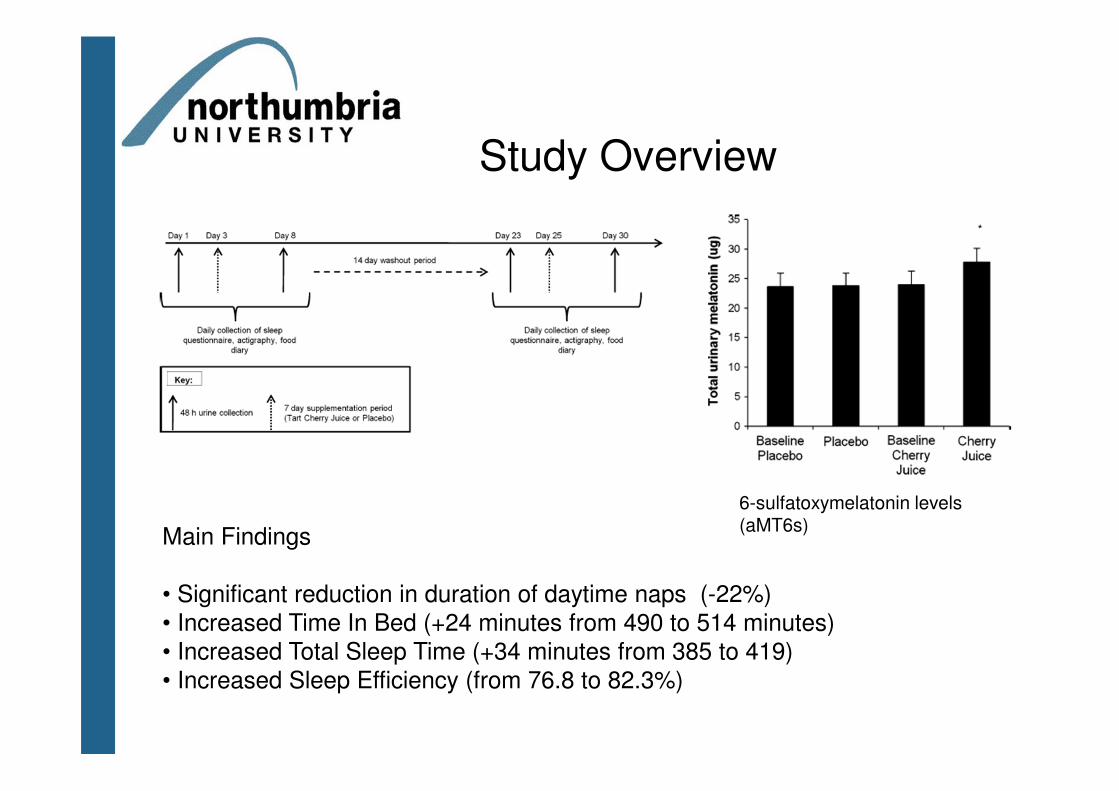
Study Overview
6-sulfatoxymelatonin levels (aMT6s)
Main Findings
• Significant reduction in duration of daytime naps (-22%)
• Increased Time In Bed (+24 minutes from 490 to 514 minutes)
• Increased Total Sleep Time (+34 minutes from 385 to 419)
• Increased Sleep Efficiency (from 76.8 to 82.3%)
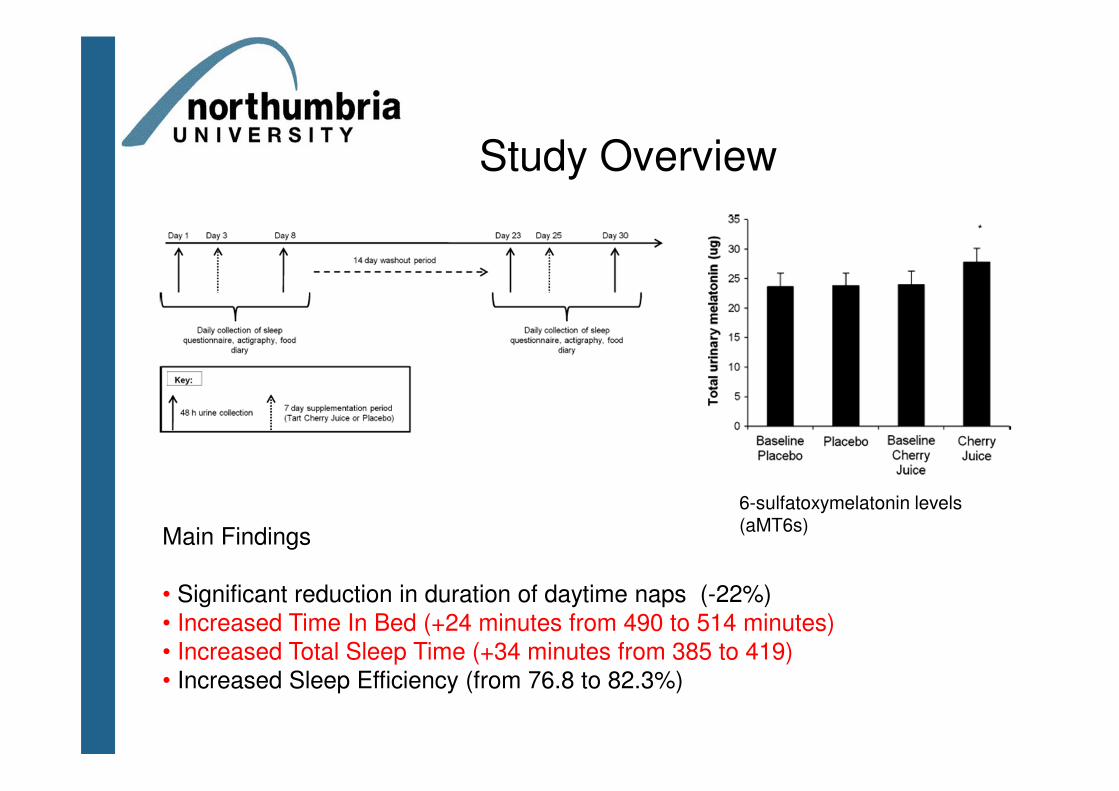
Study Overview
Main Findings
• Significant reduction in duration of daytime naps (-22%)
• Increased Time In Bed (+24 minutes from 490 to 514 minutes)
• Increased Total Sleep Time (+34 minutes from 385 to 419)
• Increased Sleep Efficiency (from 76.8 to 82.3%)
6-sulfatoxymelatonin levels (aMT6s)
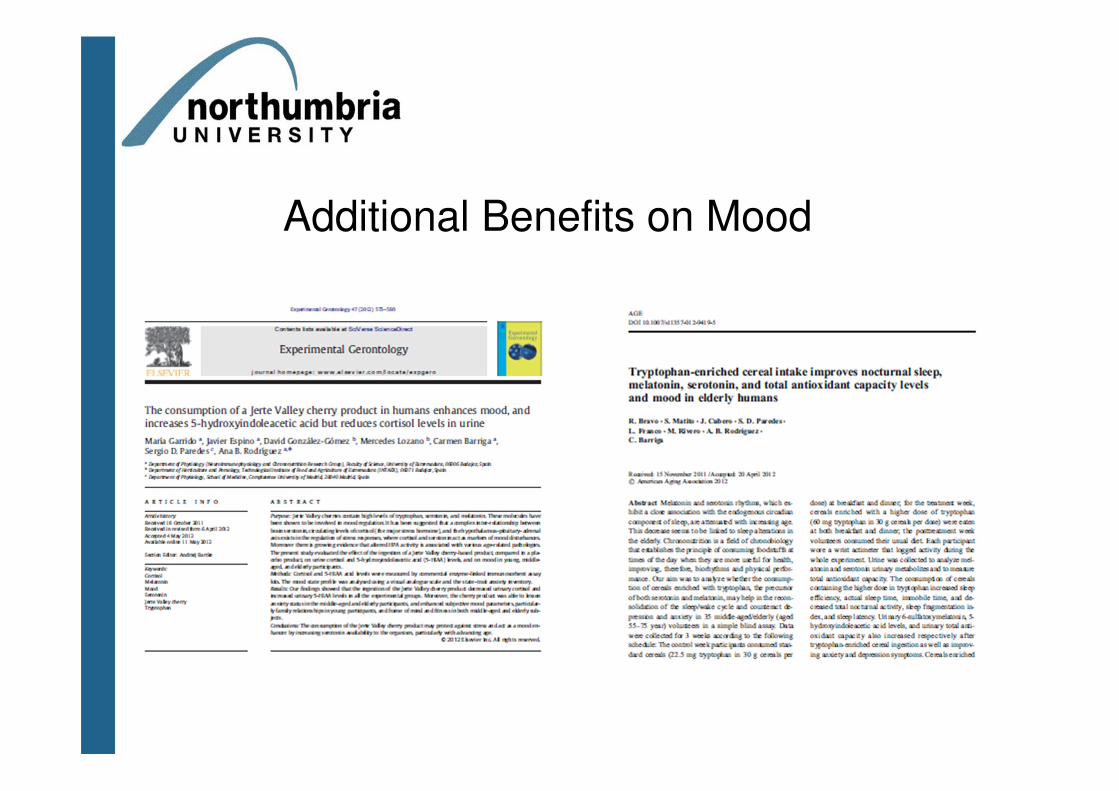
Additional Benefits on Mood
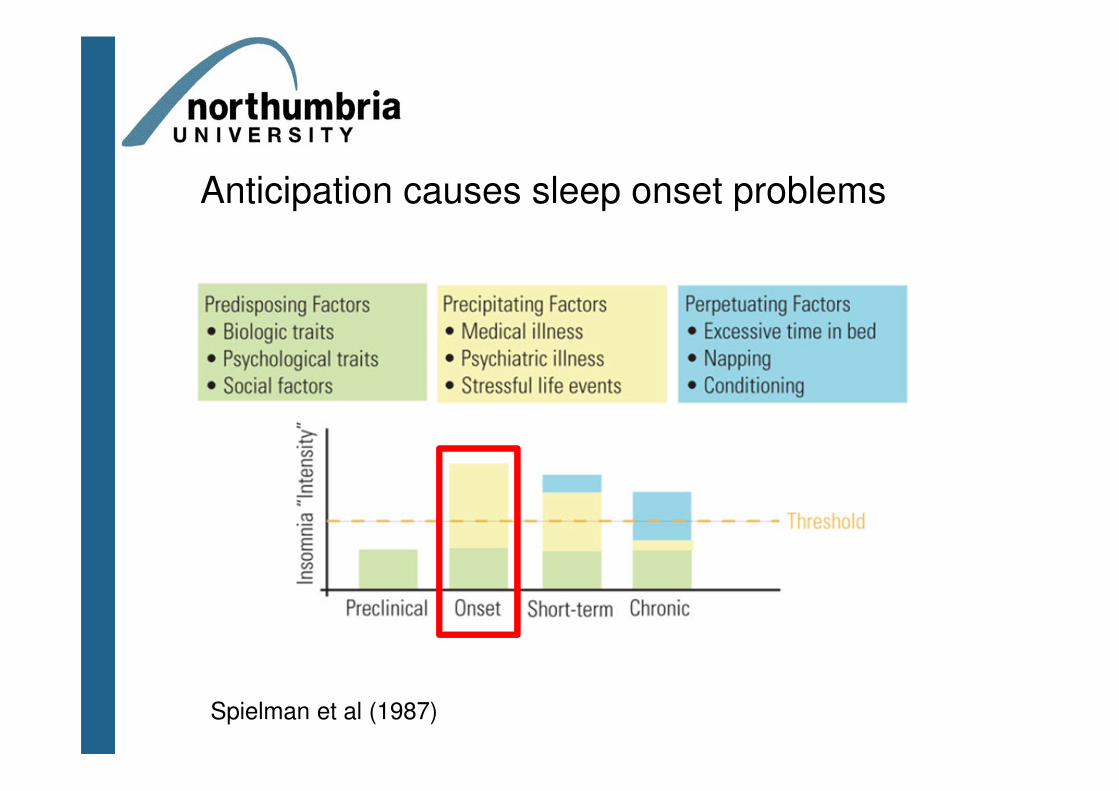
Spielman et al (1987)
Anticipation causes sleep onset problems
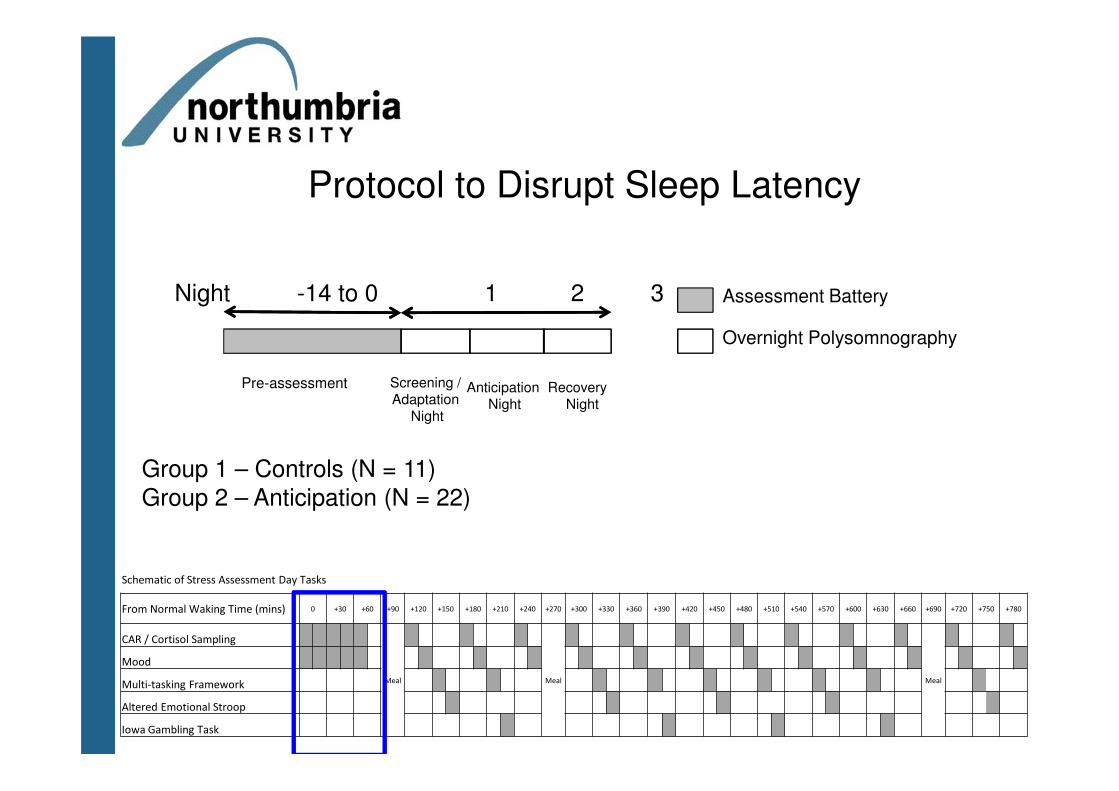
Protocol to Disrupt Sleep Latency
Schematic of Stress Assessment Day Tasks
From Normal Waking Time (mins) 0 +30 +60 +90 +120 +150 +180 +210 +240 +270 +300 +330 +360 +390 +420 +450 +480 +510 +540 +570 +600 +630 +660 +690 +720 +750 +780
CAR / Cortisol Sampling
Meal Meal Meal
Mood
Multi-tasking Framework
Altered Emotional Stroop
Iowa Gambling Task
Pre-assessment RecoveryNight
Screening / Adaptation
Night
Anticipation Night
Night -14 to 0 1 2 3 Assessment Battery
Overnight Polysomnography
Group 1 – Controls (N = 11)
Group 2 – Anticipation (N = 22)
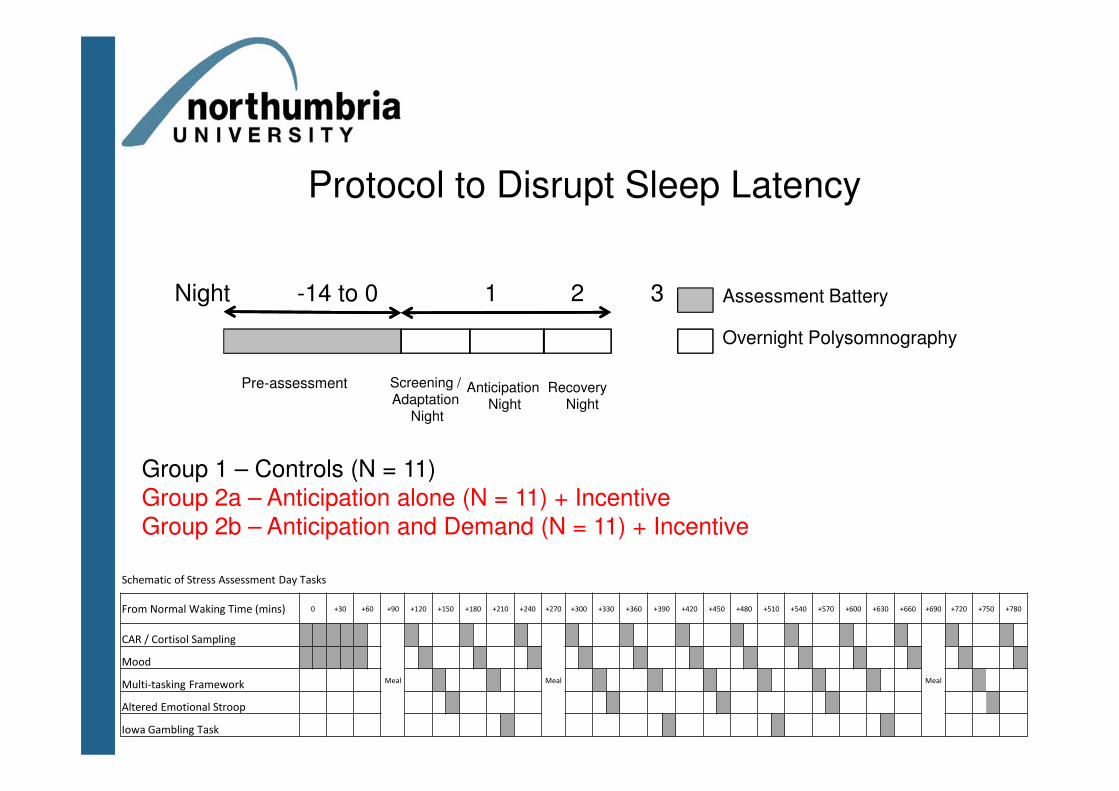
Protocol to Disrupt Sleep Latency
Schematic of Stress Assessment Day Tasks
From Normal Waking Time (mins) 0 +30 +60 +90 +120 +150 +180 +210 +240 +270 +300 +330 +360 +390 +420 +450 +480 +510 +540 +570 +600 +630 +660 +690 +720 +750 +780
CAR / Cortisol Sampling
Meal Meal Meal
Mood
Multi-tasking Framework
Altered Emotional Stroop
Iowa Gambling Task
Pre-assessment RecoveryNight
Screening / Adaptation
Night
Anticipation Night
Night -14 to 0 1 2 3 Assessment Battery
Overnight Polysomnography
Group 1 – Controls (N = 11)
Group 2a – Anticipation alone (N = 11) + Incentive
Group 2b – Anticipation and Demand (N = 11) + Incentive
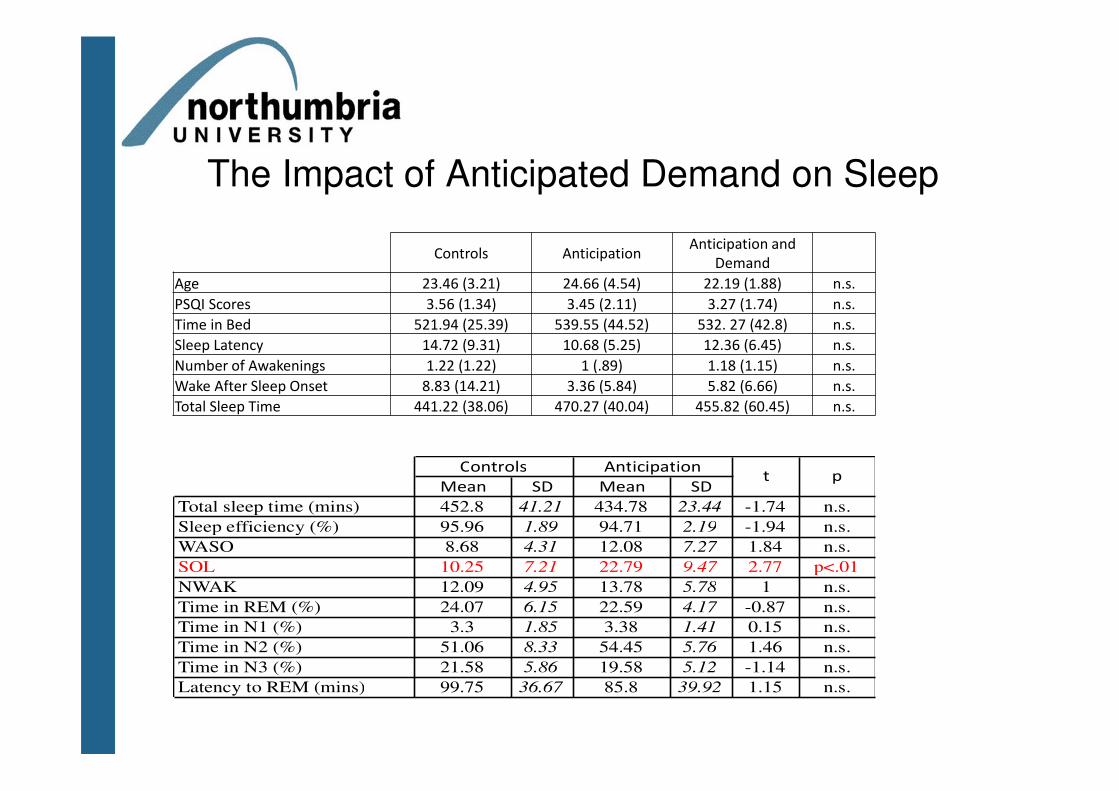
The Impact of Anticipated Demand on Sleep
Controls AnticipationAnticipation and
Demand
Age 23.46 (3.21) 24.66 (4.54) 22.19 (1.88) n.s.
PSQI Scores 3.56 (1.34) 3.45 (2.11) 3.27 (1.74) n.s.
Time in Bed 521.94 (25.39) 539.55 (44.52) 532. 27 (42.8) n.s.
Sleep Latency 14.72 (9.31) 10.68 (5.25) 12.36 (6.45) n.s.
Number of Awakenings 1.22 (1.22) 1 (.89) 1.18 (1.15) n.s.
Wake After Sleep Onset 8.83 (14.21) 3.36 (5.84) 5.82 (6.66) n.s.
Total Sleep Time 441.22 (38.06) 470.27 (40.04) 455.82 (60.45) n.s.
Mean SD Mean SD
Total sleep time (mins) 452.8 41.21 434.78 23.44 -1.74 n.s.
Sleep efficiency (%) 95.96 1.89 94.71 2.19 -1.94 n.s.
WASO 8.68 4.31 12.08 7.27 1.84 n.s.
SOL 10.25 7.21 22.79 9.47 2.77 p<.01
NWAK 12.09 4.95 13.78 5.78 1 n.s.
Time in REM (%) 24.07 6.15 22.59 4.17 -0.87 n.s.
Time in N1 (%) 3.3 1.85 3.38 1.41 0.15 n.s.
Time in N2 (%) 51.06 8.33 54.45 5.76 1.46 n.s.
Time in N3 (%) 21.58 5.86 19.58 5.12 -1.14 n.s.
Latency to REM (mins) 99.75 36.67 85.8 39.92 1.15 n.s.
Controls Anticipationt p
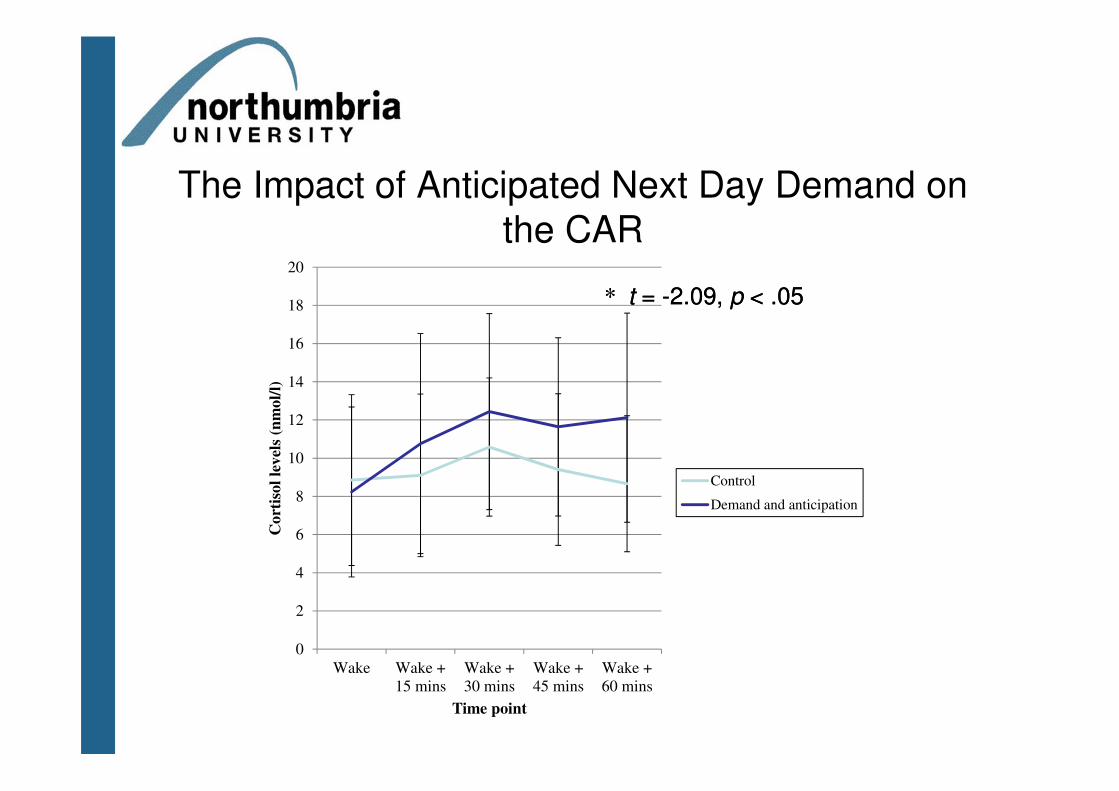
The Impact of Anticipated Next Day Demand on
the CAR
0
2
4
6
8
10
12
14
16
18
20
Wake Wake +
15 mins
Wake +
30 mins
Wake +
45 mins
Wake +
60 mins
Cort
isol
level
s (n
mol/
l)
Time point
Control
Demand and anticipation
* t = -2.09, p < .05* t = -2.09, p < .05
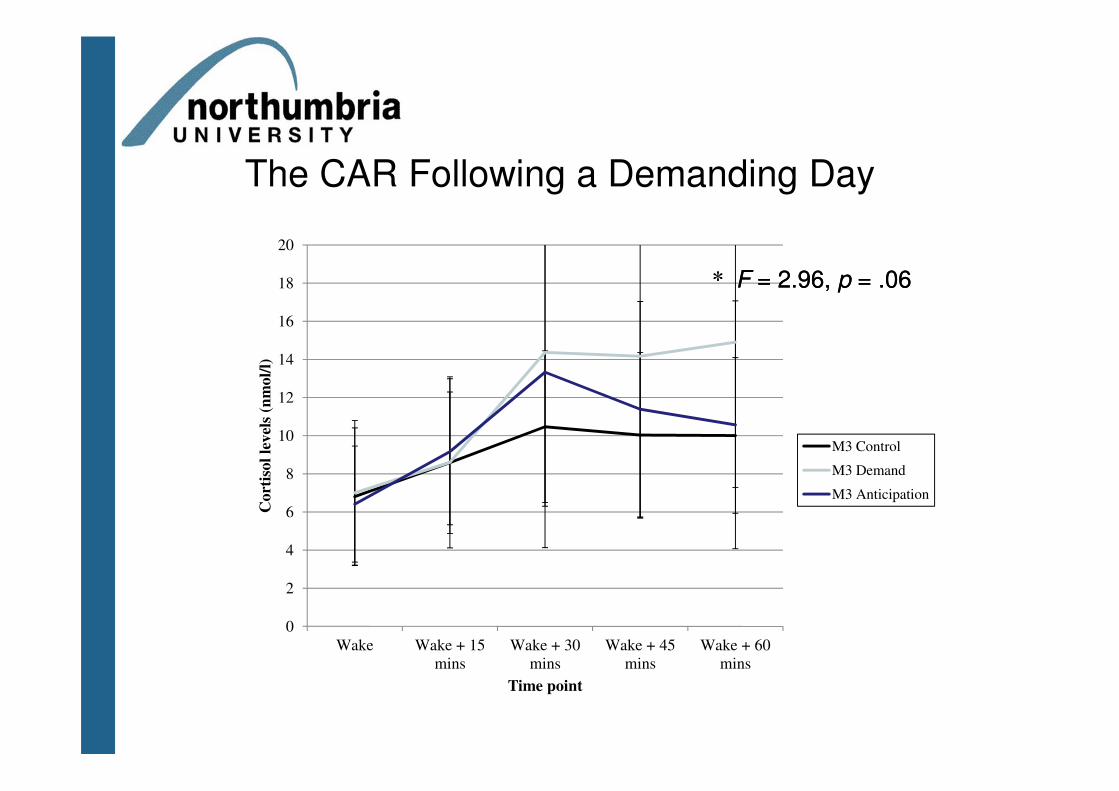
The CAR Following a Demanding Day
0
2
4
6
8
10
12
14
16
18
20
Wake Wake + 15
mins
Wake + 30
mins
Wake + 45
mins
Wake + 60
mins
Cort
isol
level
s (n
mol/
l)
Time point
M3 Control
M3 Demand
M3 Anticipation
* F = 2.96, p = .06* F = 2.96, p = .06
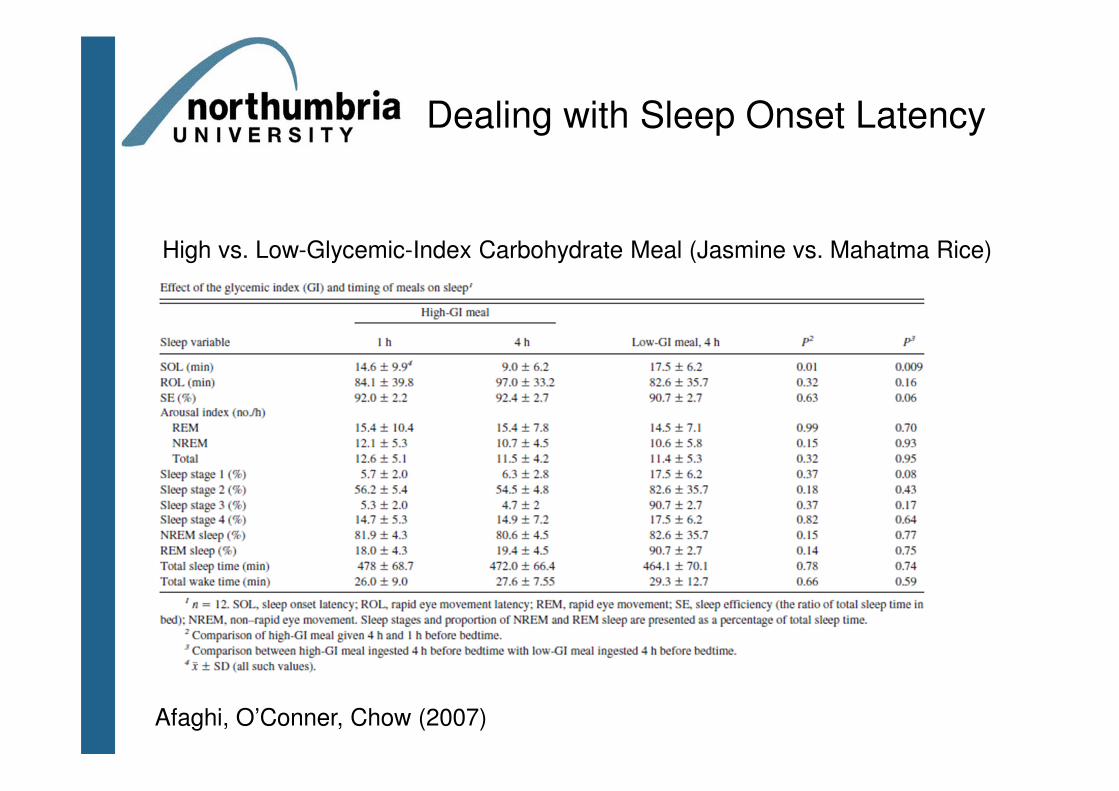
Dealing with Sleep Onset Latency
High vs. Low-Glycemic-Index Carbohydrate Meal (Jasmine vs. Mahatma Rice)
Afaghi, O’Conner, Chow (2007)
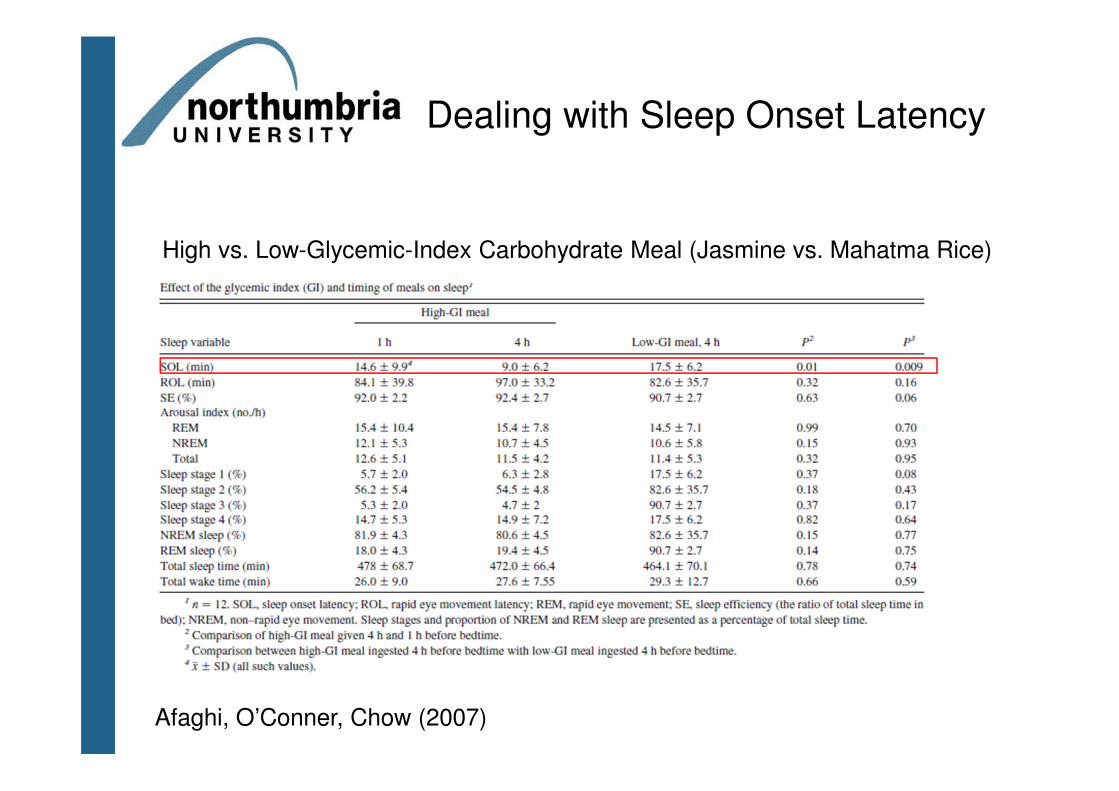
Dealing with Sleep Onset Latency
High vs. Low-Glycemic-Index Carbohydrate Meal (Jasmine vs. Mahatma Rice)
Afaghi, O’Conner, Chow (2007)
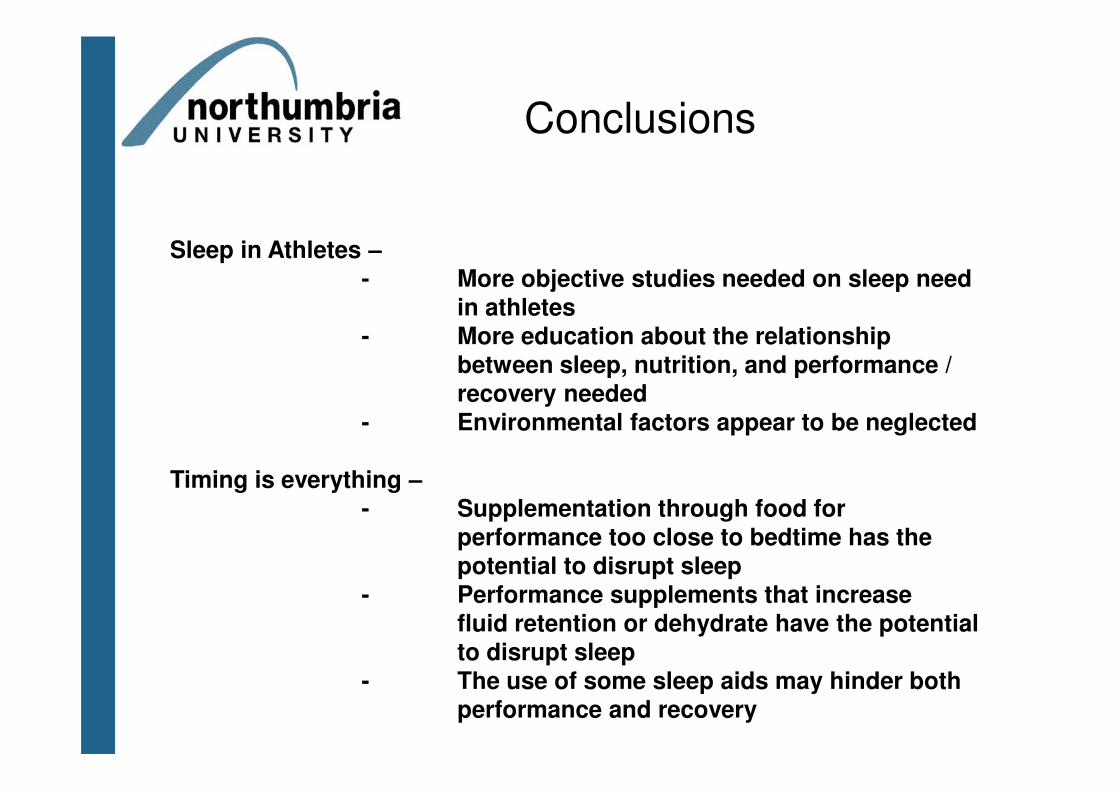
Sleep in Athletes –- More objective studies needed on sleep need
in athletes - More education about the relationship
between sleep, nutrition, and performance /
recovery needed
- Environmental factors appear to be neglected
Timing is everything –
- Supplementation through food for performance too close to bedtime has the
potential to disrupt sleep
- Performance supplements that increase
fluid retention or dehydrate have the potential to disrupt sleep
- The use of some sleep aids may hinder both performance and recovery
Conclusions
Collaborators from around the World
Dr. Michael Perlis (U Penn)
Professor Celyne Bastien (U Laval)
Dr. Wendy Troxel (RAND Corporation)
Professor Dieter Riemann (U Freiberg)
Dr. Sean Drummond (UCSD)
Professor Colin Espie (Oxford U)
Dr. Maria Gardani (U Glasgow)
Dr. Amy Thomson (U Glasgow)
Dr. Alice Gregory (U London)
Professor Annette Sterr (U Surrey)
Dr. Malcolm von Schantz (U Surrey)
Dr. Anne Germain (U Pittsburgh)
Professor Julia Newton (U Newcastle)
And the people who fund this programme of work
Wall to Wall
The Team
Dr. Vincent Deary
Dr. Nicola Barclay
Dr. Mark Wetherell
Dr. Samantha Man
Dr. Naomi Hynde
Dr. Greg Elder
Rachel Sharman
Zoe Gotts
Umair Akram
Alejandro Sanchez