Page 1
Page 1 of 18
Sports Participation Summary April 2011 – April 2012
Sport England – Active People Survey 6
Throughout this document, the participation values have been compared against baseline figures, which refer
to participation values taken during 2007/8 (Active People Survey 2, APS2) unless otherwise stated.
Sports participation across all sports for key demographic groups
The “1x30” sports participation indicator measures the number of adults (aged 16 and over) participating in at
least 30 minutes of sport at moderate intensity at least once a week.
During the period from April 2011 to April 2012, 15.3 million adults participated in sport at least once a week
for 30 minutes at moderate intensity, an increase of 1.3 million participants from the baseline value recorded
in 2005/6 when London won the Olympic bid, of 13.9 million adults.
Gender: The number of males participating in sport at least once a week during April 2011 to April 2012 was
8.653 million, an increase of 961,400 participants from the baseline value of 7.691 million in 2005-6. This
increase was statistically significant; meaning that we can say with 95% confidence that there was a real
change in the participation rate. Compared with Active People Survey 1 (2005/6) there was also a statistically
significant increase in participation among females by 376,000 adults from 6.248 million to 6.624 million
participants. Participation levels for both men and women have also increased since the previous Active People
Survey release (2010/11).
Age Groups: Across both age group categories; 16 to 25 and 26+, there has been a statistically significant
increase of 133,600 participants, and 1.2 million participants respectively. There are currently 3.785 million
young people aged 16 – 25 and 11.492 million adults aged 26 and over participating in sport at least once a
week of moderate intensity for at least 30 minutes.
Ethnicity: The rate of sports participation among white adults has increased from 12.594 million to 13.598
million (34.3% to 35.9%) since 2005/6. Sports participation among non-white adults has increased (but not
statistically significant) by 333,000 participants from 1.346 million (33.2%) in 2005/6 to 1.679 million (33.8%)
April 2011 to April 2012.
Page 2
Page 2 of 18
Disability: Compared with APS1 (2005/6), the rate of sports participation among adults with a limiting
disability/illness has increased from 1.317 million to 1.662 million (15.1% to 18.2%).
Socio-economic groups: participation among adults from all socio-economic groups has increased. In
particular, NS-SEC1-2, NS-SEC3 and NS-SEC4 have seen a statistically significant increase of 528,600, 103,000
and 77,200 participants respectively. The remaining socio-economic group NS-SEC5-8 has seen an increase
(although not a statistically significant one) of 170,400 adult participants.
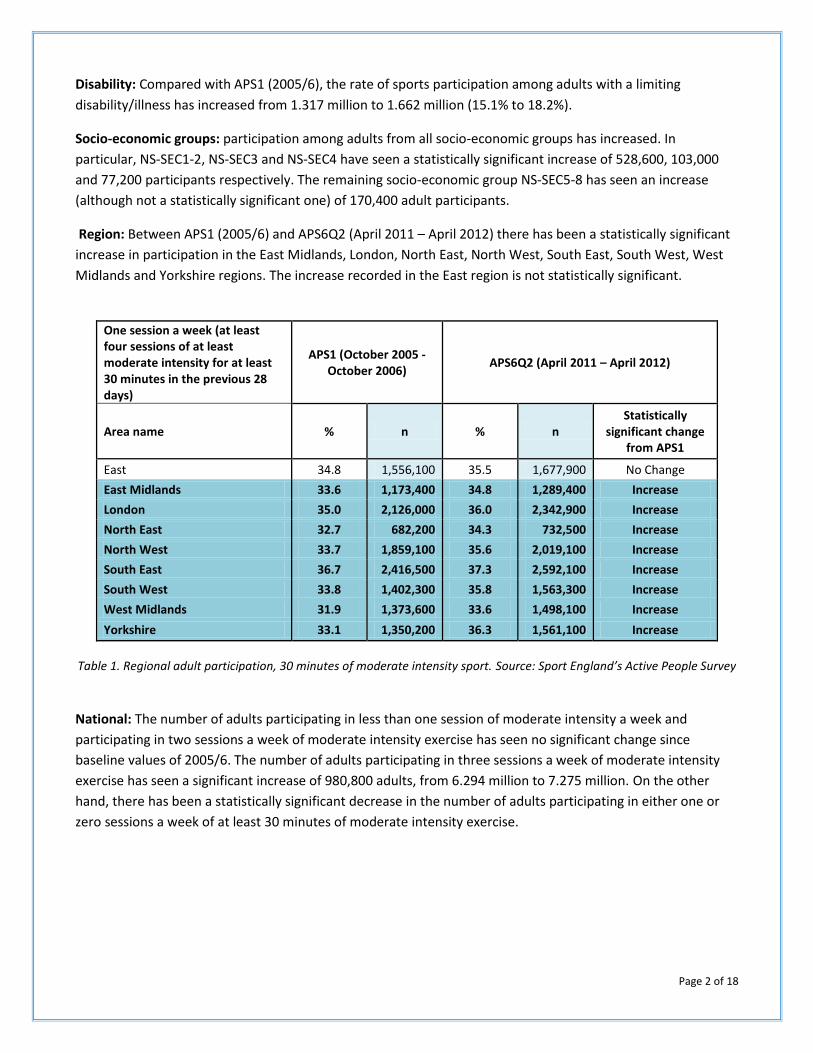
Region: Between APS1 (2005/6) and APS6Q2 (April 2011 – April 2012) there has been a statistically significant
increase in participation in the East Midlands, London, North East, North West, South East, South West, West
Midlands and Yorkshire regions. The increase recorded in the East region is not statistically significant.
One session a week (at least four sessions of at least moderate intensity for at least 30 minutes in the previous 28 days)
APS1 (October 2005 - October 2006)
APS6Q2 (April 2011 – April 2012)
Area name % n % n Statistically
significant change from APS1
East 34.8 1,556,100 35.5 1,677,900 No Change
East Midlands 33.6 1,173,400 34.8 1,289,400 Increase
London 35.0 2,126,000 36.0 2,342,900 Increase
North East 32.7 682,200 34.3 732,500 Increase
North West 33.7 1,859,100 35.6 2,019,100 Increase
South East 36.7 2,416,500 37.3 2,592,100 Increase
South West 33.8 1,402,300 35.8 1,563,300 Increase
West Midlands 31.9 1,373,600 33.6 1,498,100 Increase
Yorkshire 33.1 1,350,200 36.3 1,561,100 Increase
Table 1. Regional adult participation, 30 minutes of moderate intensity sport. Source: Sport England’s Active People Survey
National: The number of adults participating in less than one session of moderate intensity a week and
participating in two sessions a week of moderate intensity exercise has seen no significant change since
baseline values of 2005/6. The number of adults participating in three sessions a week of moderate intensity
exercise has seen a significant increase of 980,800 adults, from 6.294 million to 7.275 million. On the other
hand, there has been a statistically significant decrease in the number of adults participating in either one or
zero sessions a week of at least 30 minutes of moderate intensity exercise.
Page 3
Page 3 of 18
APS1 (Oct 2005 – Oct 2006) APS6Q2 (April 2011 – April 2012)
Zero sessions of moderate intensity for at least 30 minutes in the previous 28 days
% n % n Statistically significant
change from APS1
National overall 58.8 23,925,800 57.3 24,527,300 Decrease
Less than one session a week (1 to 3 sessions in the previous 28 days)
% n % n Statistically significant
change from APS1
National overall 7.0 2,845,700 7.0 3,004,800 No Change
One session a week (4 to 7 sessions in the previous 28 days)
% n % n Statistically significant
change from APS1
National overall 11.1 4,510,800 10.9 4,658,700 Decrease
Two sessions a week (8 to 11 sessions in the previous 28 days)
% n % n Statistically significant
change from APS1
National overall 7.7 3,134,700 7.8 3,343,300 No Change
Three sessions a week (at least 12 sessions in the previous 28 days)
% n % n Statistically significant
change from APS1
National overall 15.5 6,293,900 17.0 7,274,700 Increase
Table 2. National adult participation, 30 minutes of moderate intensity sport. Source: Sport England’s Active People Survey
Sports participation across individual sports – once a week
Comparison of the Active People Surveys from 2007/8 and the 12 months to April 2012, indicates six sports:
athletics, cycling, boxing, table tennis, netball and fencing that have seen a statistically significant increase in
participation rates for adults who have taken part in the sport at a moderate intensity for 30 minutes or more
at least once in the last week (or at least four days out of the previous 28 days).
Participation in athletics (including running and jogging) has grown from 1.612 million adults (3.89%) in
2007/8 to 1.982 million adults (4.63%) in 2011/12, an increase of 369,700 participants.
Participation in table tennis has grown from 75,600 adults (0.18%) in 2007/8 to 106,600 adults (0.25%)
in 2011/12, an increase of 31,000 participants.
Participation in netball has grown from 118,800 adults (0.29%) in 2007/8 to 147,100 adults (0.34%) in
2011/12, an increase of 28,300 participants.
15 sports have seen a statistically significant decrease in weekly participation rates between 2007/8 and the 12
months to April 2012 including: swimming, tennis, squash and racketball, rugby union, basketball and rugby
league.
Participation in swimming has declined from 3.244 million adults (7.83%) in 2007/8 to 2.807 million
adults (6.56%), a decrease of 437,100 participants.
Participation in tennis has declined from 487,500 adults (1.18%) in 2007/8 to 417,700 adults (0.98%), a
decrease of 69,800 participants.
Participation in squash and racketball has declined from 293,900 adults (0.71%) in 2007/8 to 279,400
adults (0.65%), a decrease of 14,500 participants.
Participation in rugby union has declined from 230,300 adults (0.56%) in 2007/8 to 196,300 adults
(0.46%), a decrease of 34,000 participants.
Page 4
Page 4 of 18
Participation in basketball has declined from 186,000 adults (0.45%) in 2007/8 to 148,500 adults
(0.35%), a decrease of 37,500 participants.
Participation in rugby league has declined from 82,000 adults (0.20%) in 2007/8 to 57,700 adults
(0.13%), a decrease of 24,300 participants.
Sports participation across individual sports – once a month
Comparison of the 2007/8 and the 12 months to April 2012 data shows athletics, netball and table tennis have
a statistically significant increase in participation rates for adults who have taken part in the sport at moderate
intensity for 30 minutes or more at least once in the last month.
Participation in athletics (including running and jogging) has grown from 2.514 million adults (6.07%) in
2007/8 to 2.881 million adults (6.73%), an increase of 366,800 participants.
Participation in netball has grown from 184,900 adults (0.45%) in 2007/8 to 223,300 adults (0.52%), an
increase of 85,496 participants.
Participation in table tennis has grown from 196,700 adults (0.47%) in 2007/8 to 242,600 adults
(0.57%), an increase of 45,900 participants.
APS2 (Oct 2007-Oct 2008) APS6Q2 (April 2011 – April 2012)
Sport England NGB 09-13 Funded sports
% n % n Statistically
significant change from APS 2
Athletics 6.07 2,514,400 6.73 2,881,200 Increase
Badminton 2.27 939,400 2.06 881,500 Decrease
Basketball 0.80 330,000 0.64 274,800 Decrease
Cricket 1.01 419,500 0.94 401,200 Decrease
Football 7.58 3,142,200 7.44 3,183,500 No Change
Hockey 0.38 156,500 0.36 153,400 No Change
Netball 0.45 184,900 0.52 223,300 Increase
Rugby League 0.32 131,900 0.19 82,700 Decrease
Rugby Union 0.76 314,000 0.67 287,000 Decrease
Squash and racketball 1.19 495,100 1.05 451,000 Decrease
Swimming 13.44 5,570,100 11.48 4,913,300 Decrease
Table Tennis 0.47 196,700 0.57 242,600 Increase
Tennis 2.27 940,000 1.82 778,900 Decrease
Table 3. Once a month adult participation, 30 minutes of moderate intensity sport.
Source: Sport England’s Active People Survey
Football and hockey are the only sports not to have experienced a statistically significant change in once a
month participation rates for adults. Hockey has had a slight decline in participation by 3,100 adults, whereas,
football has seen an increase of 41,300 participants.
The remaining sports; badminton, basketball, cricket, rugby league, rugby union, squash & racketball,
swimming and tennis, have all experienced a statistically significant decrease in participation rates for adults
who have taken part in the sport at moderate intensity for 30 minutes or more at least once in the last month.
Page 5
Page 5 of 18
APS2 (Oct 2007-Oct 2008) APS6Q2 (April 2011 – April 2012)
Sport England NGB 09-13 Funded sports
% n Base
(Sample Size) % n
Base (Sample Size)
Statistically significant change
from APS 2
Athletics 5.05 126,900 9,644 4.32 124,500 6,593 Decrease
Badminton 15.68 147,300 3,884 15.15 133,500 2,114 No Change
Basketball 13.22 43,600 865 10.24 28,100 512 No Change
Cricket 38.68 162,200 1,326 38.85 155,900 917 No Change
Football 20.44 642,300 9,022 18.99 604,600 5,797 Decrease
Hockey 56.98 89,200 525 62.46 95,800 269 No Change
Netball 37.94 70,200 701 35.17 78,500 522 No Change
Rugby League 39.24 51,800 284 40.00 33,100 149 No Change
Rugby Union 60.84 191,000 874 60.55 173,800 515 No Change
Squash and racketball 19.89 98,500 1,913 18.39 82,900 945 No Change
Swimming 3.34 186,100 26,618 3.23 158,500 14,550 No Change
Table Tennis 18.31 36,000 831 14.50 35,200 693 Decrease
Tennis 27.09 254,700 3,939 24.86 193,700 2,121 No Change
Table 4. Percentage of participants that are members of a sports club for that sport.
Source: Sport England’s Active People Survey
Comparison of the 2007/8 and the 12 months to April 2012 data shows that no sport had a statistically
significant increase in the percentage of participants that are members of a sports club for that sport.
Athletics, football and table tennis have experienced a statistically significant decrease in the percentage of
participants that are members of a sports club for that sport.
The percentage of member participants in athletics has declined from 5.05% (126,900 adults) in
2007/8 to 4.32% (124,500 adults), a reduction of 0.73% (2,400 member participants).
The percentage of member participants in football has declined from 20.44% (642,300 adults) in
2007/8 to 18.99% (604,600 adults), a reduction of 1.45% (37,700 member participants).
The percentage of member participants in table tennis has declined from 18.31% (36,000 adults) in
2007/8 to 14.50% (35,200 adults), a reduction of 3.81% (800 member participants).
The remaining sports: badminton, basketball, cricket, hockey, netball, rugby league, rugby union, squash &
racketball, swimming and tennis, haven’t experienced a statistically significant change in the percentage of
participants that are members of a sports club for that sport.
Page 6
Page 6 of 18
Individual Sports Participation Summary
Athletics
At least once a week participation in athletics continues to follow a strong upward trend; following a small
drop 6 months ago, participation has increased by 82,400 in the last 6 months.
Average once a week participation is now at 1,981,800, this is the highest point recorded since Active
People Surveys began.
Overall there has been a statistically significant increase in the number of participants, from 1.612
million (3.89%) in 2007/8 to 1.982 million (4.63%) April 2011 – April 2012, an increase of 369,700
participants.
Both male and female participation rates have increased by approximately 185,000 participants
since 2007/8.
The age range which has experienced the largest statistically significant increase in once a week
participation is 45 – 64 year olds from 289,900 (2.28%) in 2007/8 to 408,700 (3.07%) April 2011 –
April 2012, an increase of 118,800 participants.
The age range which has experienced the only decrease in once a week participation (although not
statistically significant) is 16 – 19 year olds, from 187,500 (6.92%) in 2007/8 to 180,700 (7.03%)
April 2011 – April 2012, a decline of 6,800 participants.
The London Region has seen the greatest statistically significant increase in participation of 82,700
adults from 306,800 (5.03%) in 2007/8 to 389,500 (6.00%) April 2011 – April 2012.
No region has experienced a decline in participation numbers, statistically significant or not.
At least once a month participation numbers in athletics has mirrored the increase of once a week
participation numbers.
There has been an increase (although not statistically significant) in the overall number of
participants, from 2.514 million (6.07%) in 2007/8 to 2.881 million (6.73%) April 2011 – April 2012,
an increase of 366,800 participants.
The age range which has experienced the largest statistically significant increase in once a month
participation is 45 – 64 year olds, from 434,500 (3.40%) in 2007/8 to 563,700 (4.22%) April 2011 –
April 2012, an increase of 129,200 participants.
The age range which has experienced the only decrease in once a month participation (although
not statistically significant) is 16 – 19 year olds, from 341,900 (12.58%) in 2007/8 to 304,900
(11.08%) April 2011 – April 2012, a decline of 37,000 participants.
The London Region has seen the greatest statistically significant increase in participation of 83,900
adults from 496,000 (8.13%) in 2007/8 to 579,900 (8.93%) April 2011 – April 2012.
No region has experienced a decline in participation numbers, statistically significant or not.
The increase in participation overall masks a drop in participation among people aged 16 -25.
Even though participation rates have increased, there has been a statistically significant decrease in the
number of people involved in organised forms of athletics over the last six months, down by 60,000
participants.
Page 7
Page 7 of 18
Badminton
At least once a week participation in badminton has increased over the last 6 months, however the long
term trend in participation is fairly flat.
There has been a decrease (although not statistically significant) in the overall number of
participants, from 535,700 (1.29%) in 2007/8 to 535,400 (1.25%) April 2011 – April 2012, a decline
of 300 participants.
Participation for men and women has increased over the last 6 months. This brings female
participation back to the level seen a year ago but it still remains significantly below baseline for
this group.
The age range which has experienced the largest increase (although not statistically significant) in
once a week participation is 45 – 64 year olds, from 160,000 (1.24%) in 2007/8 to 170,100 (1.23%)
April 2011 – April 2012, an increase of 10,100 participants.
The age range which has experienced the largest statistically significant decrease in once a week
participation is 35 – 44 year olds, from 119,200 (1.50%) in 2007/8 to 96,100 (1.27%) April 2011 –
April 2012, a decline of 23,100 participants.
The West Midlands Region has seen the greatest statistically significant increase of 14,400
participants from 60,600 adults (1.40%) in 2007/8 to 75,000 adults (1.68%) April 2011 – April 2012.
Whereas, the South-East Region has seen the greatest statistically significant decrease of 12,600
participants from 98,400 adults (1.46%) in 2007/8 to 85,800 adults (1.24%) April 2011 – April 2012.
At least once a month participation has stabilised over the last 6 months but has not increased in line with
once a week participation, there remains a long term downward trend in once a month participation.
There has been a decrease (although not statistically significant) in the overall number of
participants, from 939,400 (2.27%) in 2007/8 to 881,500 (2.06 %) April 2011 – April 2012, a decline
of 57,900 participants
Over the last six months male participation has increased slightly while female participation has
continued to decrease.
The age range which has experienced the largest statistically significant increase in once a month
participation is 65+ year olds, from 51,800 (0.62%) in 2007/8 to 66,900 (0.74%) April 2011 – April
2012, an increase of 15,100 participants.
The age range which has experienced the largest statistically significant decrease in once a month
participation is 35 – 44 year olds, from 210,100 (2.65%) in 2007/8 to 167,200 (2.23%) April 2011 –
April 2012, a decline of 42,900 participants.
The Yorkshire Region has seen the greatest increase of 10,500 participants (although not
statistically significant) from 75,000 adults (1.79%) in 2007/8 to 85,500 adults (1.99%) April 2011 –
April 2012.
Whereas, the South-East Region has seen the greatest statistically significant decrease of 25,300
participants from 175,600 adults (2.61%) in 2007/8 to 150,300 adults (2.16%) April 2011 – April
2012.
Page 8
Page 8 of 18
Basketball
At least once a week participation in basketball has a long term downwards trend, with participation
remaining flat over the last 18 months.
There has been a statistically significant decease in the overall number of participants, from
186,000 (0.45%) in 2007/8 to 148,500 (0.35%) April 2011 – April 2012, a decline of 37,500
participants.
Male and female participation numbers have experienced a statistically significant decrease since
the baseline values of 2007/8.
The age range which has experienced the only increase (although not statistically significant) in
once a week participation is 25 – 29 year olds, from 17,200 (0.49%) in 2007/8 to 18,700 (0.46%)
April 2011 – April 2012, an increase of 1,500 participants.
The age range which has experienced the largest statistically significant decrease in once a week
participation is 16 – 19 year olds, from 97,000 (3.27%) in 2007/8 to 68,400 (2.37%) April 2011 –
April 2012, a decline of 28,600 participants.
To be noted, 4 out of the 7 age groups were underrepresented in the survey and have no data
values, thus weren’t included in the analysis.
The East Region has seen the greatest increase of 400 participants (although not statistically
significant) from 19,900 adults (0.43%) in 2007/8 to 20,300 adults (0.43%) April 2011 – April 2012.
Whereas, the North-West Region has seen the greatest statistically significant decrease of 10,400
participants, from 24,200 adults (0.44%) in 2007/8 to 13,800 adults (0.24%) April 2011 – April 2012.
At least once a month participation has held up suggesting that it is reduced frequency of participation
rather than drop out of basketball all together occurring.
There has been a decrease (although not statistically significant) in the overall number of
participants, from 330,000 (0.80%) in 2007/8 to 274,800 (0.64 %) April 2011 – April 2012, a decline
of 55,200 participants.
Female participation continues to decline at a slightly faster rate than male participation.
The age range which has experienced the largest increase (although not statistically significant) in
once a month participation is 25 - 29 year olds, from 34,000 (0.98%) in 2007/8 to 35,000 (0.88%)
April 2011 – April 2012, an increase of 1,000 participants.
The age range which has experienced the only statistically significant decrease in once a month
participation is 16 – 19 year olds, from 159,800 (5.41%) in 2007/8 to 111,800 (3.97%) April 2011 –
April 2012, a decline of 48,000 participants.
The South-West Region has seen the greatest increase of 6,400 participants (although not
statistically significant) from 22,000 adults (0.52%) in 2007/8 to 28,400 adults (0.65%) April 2011 –
April 2012.
Whereas, the North-West Region has seen the greatest statistically significant decrease of 18,900
participants, from 40,200 adults (0.72%) in 2007/8 to 21,300 adults (0.38%) April 2011 – April 2012.
Club membership had been fluctuating around 15% of participants but has fallen in the last year to just
above 10%. Numbers have dropped by roughly 20,000 over this period.
Page 9
Page 9 of 18
Cricket
Once a week participation in cricket has remained fairly stable compared with 6 months ago with the long
term trend being flat.
Overall the number of participants has increased (although not statistically significant) by 5,200
adults from 204,800 (0.49%) in 2007/8 to 210,000 (0.49%) April 2011 – April 2012.
Female participation numbers have increased almost twice that of male participation numbers.
The age range which has experienced the largest increase (although not statistically significant) in
once a week participation is 45 - 64 year olds, from 25,600 (0.19%) in 2007/8 to 30,300 (0.21%)
April 2011 – April 2012, an increase of 4,700 participants.
The age range which has experienced the only decrease (although not statistically significant) in
once a week participation is 16 – 19 year olds, from 64,100 (2.26%) in 2007/8 to 54,800 (1.98%)
April 2011 – April 2012, a decline of 9,300 participants.
The Yorkshire Region has seen the largest increase (although not statistically significant) of 6,200
participants from 26,000 adults (0.62%) in 2007/8 to 32,200 adults (0.75%) April 2011 – April 2012.
Whereas, the London region has seen the greatest decrease (although not statistically significant)
of 3,200 participants from 36,000 adults (0.59%) in 2007/8 to 32,800 adults (0.50%) April 2011 –
April 2012.
At least once a month participation in cricket is also showing a long term flat trend.
Overall the number of participants has decreased (although not statistically significant) by 18,300
adults from 419,500 (1.01%) in 2007/8 to 401,200 (0.94 %) April 2011 – April 2012.
The age range which has experienced the largest increase (although not statistically significant) in
once a month participation is 35 – 44 year olds, from 71,500 (0.87%) in 2007/8 to 79,100 (1.02%)
April 2011 – April 2012, an increase of 7,600 participants.
The age range which has experienced the only statistically significant decrease in once a month
participation is 16 – 19 year olds, from 124,500 (4.40%) in 2007/8 to 88,700 (3.25%) April 2011 –
April 2012, a decline of 35,800 participants.
The Yorkshire Region has seen the greatest increase of 10,200 participants (although not
statistically significant) from 40,600 adults (0.97%) in 2007/8 to 50,800 adults (1.18%) April 2011 –
April 2012.
Whereas, the North-West region has seen the only statistically significant decrease of 10,700
participants from 52,400 adults (0.94%) in 2007/8 to 41,700 adults (0.74%) April 2011 – April 2012.
There is a growing number of people who participate very frequently; two or three times a week. This
indicates a growing group of very committed participants within the overall at least once a week
participation number.
Page 10
Page 10 of 18
Football
At least once a week participation in football has increased over the last 6 months and is now back at the
same level as 12 months ago.
There has been an increase (although not statistically significant) in the overall number of
participants, from 2.145 million (5.18%) in 2007/8 to 2.185 million (5.10%) April 2011 – April 2012,
an increase of 39,900 participants.
Once a week female participation has dropped over the last 12 months and is now significantly
below the 2007/8 baseline level.
The age range which has experienced the largest statistically significant increase in once a week
participation is 25 - 29 year olds, from 311,100 (9.51%) in 2007/8 to 399,400 (10.72%) April 2011 –
April 2012, an increase of 88,300 participants.
The age range which has experienced the largest statistically significant decrease in once a week
participation is 16 – 19 year olds, from 635,900 (22.82%) in 2007/8 to 497,800 (18.91%) April 2011
– April 2012, a decline of 138,100 participants.
The London Region has seen the largest statistically significant increase of 62,300 participants from
283,500 adults (4.65%) in 2007/8 to 345,800 adults (5.32%) April 2011 – April 2012.
Whereas, the North-East region has seen the greatest statistically significant decrease of 39,700
participants from 148,500 adults (7.07%) in 2007/8 to 108,800 adults (5.09%) April 2011 – April
2012.
At least once a month participation in football has a long term flat trend but has increased very gradually
every quarter for the last 18 months.
Overall the number of participants has increased (although not statistically significant) by 41,300
adults from 3.142 million (7.58%) in 2007/8 to 3.184 million (7.44 %) April 2011 – April 2012.
The number of females participating in football once a month has continued to decrease.
The age range which has seen the largest statistically significant participation increase of 121,800
adults, is 25 – 29 year olds, from 452,900 (13.91%) in 2007/8 to 574,700 (15.47%) April 2011 – April
2012.
The age range which has experienced the only statistically significant decrease in once a month
participation is 16 – 19 year olds, from 860,100 (31.02%) in 2007/8 to 690,400 (26.28%) April 2011
– April 2012, a decline of 169,700 participants.
The South-West Region has seen the only statistically significant increase of 30,700 participants
from 259,500 adults (6.10%) in 2007/8 to 290,200 adults (6.65%) April 2011 – April 2012.
Whereas, the South-East Region has seen the greatest statistically significant decrease of 32,100
participants, from 470,400 adults (7.00%) in 2007/8 to 438,300 adults (6.31%) April 2011 - April
2012.
Since 2007/8 115,000 less people are participating in organised football – this indicates a gradual switch
over time to more informal forms of the game. This is driven by a drop in tuition/coaching and organised
competition.
Page 11
Page 11 of 18
Hockey
At least once a week participation in hockey has increased sharply over the last 6 months however the
long term trend is fairly flat.
There has been an increase (although not statistically significant) in the overall number of
participants, from 99,800 (0.24%) in 2007/8 to 106,100 (0.25%) April 2011 – April 2012 an increase
of 6,300 participants.
The sharp increase in once a week participation has been almost entirely among male participants.
The age range which has experienced the highest increase (although not statistically significant) in
once a week participation is 16 – 19 year olds, from 35,700 (1.24%) in 2007/8 to 43,100 (1.52%)
April 2011 – April 2012, an increase of 7,400 participants.
The age range which has experienced the only decrease (although not statistically significant) in
once a week participation is 35 - 44 year olds, from 11,900 (0.14%) in 2007/8 to 11,200 (0.14%)
April 2011 – April 2012, a decline of 700 participants.
To be noted 4 out of the 7 age groups were under represented in the survey so have no data values
and weren’t included in the analysis.
The West Midlands Region has seen the greatest statistically significant increase of 8,400
participants from 10,200 adults (0.24%) in 2007/8 to 18,600 adults (0.42%) April 2011 – April 2012.
The South-East region has seen the greatest statistically significant decrease of 6,300 participants
from 25,300 adults (0.38%) in 2007/8 to 19,000 adults (0.27%) April 2011 – April 2012.
At least once a month participation in hockey has followed a similar pattern to once a week participation,
increasing sharply over the last 6 months but with an underlying flat trend over the longer term.
There has been a decrease (although not statistically significant) in the overall number of
participants, from 156,500 (0.38%) in 2007/8 to 153,400 (0.36 %) April 2011 – April 2012, a decline
of 3,100 participants.
The age range which has experienced the highest increase (although not statistically significant) in
once a month participation is 45 - 64 year olds, from 19,100 (0.14%) in 2007/8 to 25,700 (0.18%)
April 2011 – April 2012, an increase of 6,600 participants.
The age range which has experienced the largest decrease (although not statistically significant) in
once a month participation is 35 – 44 year olds, from 22,500 (0.27%) in 2007/8 to 18,700 (0.24%)
April 2011 – April 2012, a decline of 3,800 participants.
The West Midlands Region has seen an increase (although not statistically significant) of 4,700
participants from 18,400 adults (0.42%) in 2007/8 to 23,100 adults (0.52%) April 2011 – April 2012.
The South-East Region has seen the highest decrease (although not statistically significant) of 4,800
participants from 34,300 adults (0.51%) in 2007/8 to 29,500 adults (0.42%) April 2011 – April 2012.
The only statistically significant decrease in once a month participation levels was seen in the East
Region, of 4,600 participants. From 18,600 adults (0.40%) in 2007/8 to 14,000 adults (0.30%) April
2011 – April 2012.
Page 12
Page 12 of 18
Netball
At least once a week participation in netball has risen again over the last 6 months following a small dip,
this increase suggests a steady long term upward trend in participation.
There has been a statistically significant increase in the overall number of participants, from
118,800 (0.29%) in 2007/8 to 147,100 (0.34%) April 2011 – April 2012, and increase of 28,300
participants.
The age range which has experienced the largest increase (although not statistically significant) in
once a week participation is 16 – 19 year olds, from 39,400 (1.38%) in 2007/8 to 50,500 (1.77%)
April 2011 – April 2012, an increase of 11,100 participants.
The age range which has experienced the only decrease (although not statistically significant) in
once a week participation is 20 – 24 year olds, from 19,900 (0.54%) in 2007/8 to 19,100 (0.48%)
April 2011 – April 2012, a decline of 800 participants.
The South-West Region has seen the only statistically significant increase of 8,100 participants,
from 10,000 adults (0.23%) in 2007/8 to 18,100 adults (0.41%) April 2011 – April 2012.
No region has experienced a participation decrease, statistically significant or not.
At least once a month participation in netball is also rising steadily over the long term.
Overall the number of participants has increased (although not statistically significant) by 38,400
adults from 184,900 (0.45%) in 2007/8 to 223,300 (0.52 %) April 2011 – April 2012.
The age range which has experienced the largest statistically significant increase in once a month
participation is 25 – 29 year olds, from 20,100 (0.60%) in 2007/8 to 36,600 (0.91%) April 2011 –
April 2012, an increase of 16,500 participants.
The age range which has experienced the only decrease (although not statistically significant) in
once a month participation is 20 – 24 year olds, from 33,000 (0.90%) in 2007/8 to 26,000 (0.65%)
April 2011 – April 2012, a decrease of 7,000 participants.
The South-West Region has seen the only statistically significant increase of 11,700 participants
from 17,400 adults (0.41%) in 2007/8 to 29,100 adults (0.67%) April 2011 – April 2012.
No region has experienced a participation decrease, statistically significant or not.
In the last 6 months participation has dropped back sharply amongst 25 – 29 year olds, with a loss of 7,000
participants. However, 30 – 34 year old participation has grown by 6,000 over the same period so we could
see either an age cohort moving through the groupings or a shifting focus of the ‘back to’ programme.
Page 13
Page 13 of 18
Rugby League
At least once a week participation in rugby league has risen again over the last 6 months continuing the
steady increase in participation over the last year.
There has been a statistically significant decrease in the overall number of participants, from
82,000 (0.20%) in 2007/8 to 57,700 (0.13%) April 2011 – April 2012, a decline of 24,300
participants.
The only age range with data recorded for is the 16 – 19 year olds, which has experienced a
statistically significant decrease in once a week participation, from 48,100 (1.61%) in 2007/8 to
18,800 (0.69%) April 2011 – April 2012, a decline of 29,300 participants.
No age range has experienced an increase in once a week participation, statistically significant or
not. Although 6 out of the 7 age groups were under represented in the survey so have no data
values.
Only the North-West Region has collated enough data to be represented in the analysis, and has
seen a statistically significant decrease of 4,200 participants from 22,200 adults (0.43%) in 2007/8
to 18,000 adults (0.32%) April 2011 – April 2012.
At least once a month participation in rugby league has increased steadily over the past few years.
There has been a statistically significant decrease in the overall number of participants, from
131,900 (0.32%) in 2007/8 to 82,700 (0.19 %) April 2011 – April 2012, a decline of 49,200
participants.
The age range which has experienced the only increase (although not statistically significant) in
once a month participation is 20 - 24 year olds, from 22,200 (0.55%) in 2007/8 to 26,100 (0.68%)
April 2011 – April 2012, an increase of 3,900 participants.
The age range which has experienced the only statistically significant decrease in once a month
participation is 16 – 19 year olds, from 79,200 (2.51%) in 2007/8 to 26,500 (0.97%) April 2011 –
April 2012, a decline of 52,700 participants.
The current number of 16 – 19 year old participants is almost only a third of the number of
participants in 2007/8.
To be noted, 5 out of the 7 age groups were under represented in the survey so have no data
values.
No region has experienced an increase in once a month participation, statistically significant or not.
But again, 7 out of the 9 regions were under represented in the survey so have no data values.
However, out of the two regions represented, the North-West region has seen the greatest
statistically significant decrease of 8,500 participants from 30,900 adults (0.56%) in 2007/8 to
22,400 adults (0.39%) April 2011 – April 2012.
The increases in participation over the last year have been driven by the 13 aside game.
Page 14
Page 14 of 18
Rugby Union
At least once a week participation in rugby union remains statistically significantly below the baseline
values of 2007/8.
There has been a statistically significant decrease in the overall number of participants, from
230,300 (0.56%) in 2007/8 to 196,300 (0.46%) April 2011 – April 2012, a decline of 34,000
participants.
The age range which has experienced the largest increase (although not statistically significant) in
once a week participation is 25 – 29 year olds, from 29,700 (0.89%) in 2007/8 to 36,000 (0.94%)
April 2011 – April 2012, an increase of 6,300 participants.
The age range which has experienced the largest statistically significant decrease in once a week
participation is 16 – 19 year olds, from 87,700 (3.08%) in 2007/8 to 68,100 (2.51%) April 2011 –
April 2012, a decline of 19,600 participants.
The North-West region has seen the highest increase in participation numbers (although not
statistically significant) of 6,200 adults from 22,100 (0.40%) in 2007/8 to 28,300 (0.50%) April 2011
– April 2012.
Whereas, the West Midlands Region has seen the greatest statistically significant decrease of
18,500 participants from 30,700 adults (0.71%) in 2007/8 to 12,200 adults (0.27%) April 2011 –
April 2012.
At least once a month participation in rugby union has followed a similar pattern to once a week
participation but with slightly less downward movement. It also currently remains significantly below the
baseline values.
There has been a decrease (although not statistically significant) in the overall number of
participants, from 314,000 (0.76%) in 2007/8 to 287,000 (0.67 %) April 2011 – April 2012, a decline
of 27,000 participants.
The age range which has experienced the largest increase (although not statistically significant) in
once a month participation is 25 – 29 year olds, from 37,800 (1.13%) in 2007/8 to 47,900 (1.26%)
April 2011 – April 2012, an increase of 10,100 participants.
The age range which has experienced the largest statistically significant decrease in once a month
participation is 16 – 19 year olds, from 112,600 (3.97%) in 2007/8 to 90,000 (3.35%) April 2011 –
April 2012, a decline of 22,600 participants.
The North-West Region has seen the greatest increase (although not statistically significant) of
8,200 participants from 29,400 adults (0.53%) in 2007/8 to 37,600 adults (0.66%) April 2011 – April
2012.
Whereas, the West Midlands Region has seen the greatest statistically significant decrease of
21,000 participants from 37,300 adults (0.86%) in 2007/8 to 16,300 adults (0.36%) April 2011 –
April 2012.
The 15 aside game has driven the recent increase in participation.
Page 15
Page 15 of 18
Squash and Racketball
At least once a week participation in squash and racketball has been relatively stable over the past year
but is showing a slight downwards trend.
There has been a statistically significant decrease in the overall number of participants, from
293,900 (0.71%) in 2007/8 to 279,400 (0.65%) April 2011 – April 2012, a decline of 14,500 adults.
Male participation numbers haven’t changed since the baseline values in comparison to female
participation numbers which have dropped by 14,500 (a statistically significant decline).
The age range which has experienced the largest increase (although not statistically significant) in
once a week participation is 25 – 29 year olds, from 35,800 (1.13%) in 2007/8 to 46,700 (1.30%)
April 2011 – April 2012, an increase of 10,900 participants.
The age range which has experienced the only statistically significant decrease in once a week
participation is 35 – 44 year olds, from 73,600 (0.94%) in 2007/8 to 53,700 (0.75%) April 2011 –
April 2012, a decline of 19,900 participants.
The Yorkshire region has seen the only statistically significant increase of 20,100 participants from
21,400 adults (0.51%) in 2007/8 to 41,500 adults (0.96%) April 2011 – April 2012.
Whereas, the East-Midlands has seen the greatest statistically significant decrease of 7,800
participants from 28,100 adults (0.78%) in 2007/8 to 20,300 adults (0.55%) April 2011 – April 2012.
At least once a month participation in squash and racketball has followed a similar pattern to once a week
participation.
There has been a decline (although not statistically significant) in the overall number of
participants, from 495,100 (1.19%) in 2007/8 to 451,000 (1.05%) April 2011 – April 2012, a decline
of 44,100 participants.
The age range which has experienced the largest increase (although not statistically significant) in
once a month participation is 25 – 29 year olds, from 67,100 (2.13%) in 2007/8 to 77,400 (2.14%)
April 2011 – April 2012, an increase of 10,300 participants.
The age range which has experienced the largest statistically significant decrease in once a month
participation is 35 – 44 year olds, from 123,600 (1.59%) in 2007/8 to 91,200 (1.26%) April 2011 –
April 2012, a decline of 32,400 participants.
The Yorkshire Region has seen the only statistically significant increase of 31,100 participants from
37,500 adults (0.89%) in 2007/8 to 68,600 adults (1.59%) April 2011 – April 2012.
Whereas, the South-West Region has seen the greatest statistically significant decrease of 14,300
participants, from 51,600 adults (1.21%) in 2007/8 to 37,300 adults (0.85%) April 2011 – April 2012.
Organised Squash and Racketball has remained fairly stable around 27% of participants, with coaching and
tuition increasing over time both as a proportion of participants and in numbers of people.
Page 16
Page 16 of 18
Swimming
At least once a week participation in swimming has a strong long term downwards trend however it has
remained static over the past 6 months.
There has been a statistically significant decrease in the overall number of participants, from 3.244
million (7.83%) in 2007/8 to 2.807 million (6.56%) April 2011 – April 2012, a decline of 437,100
participants.
Female participation continues to decline at a faster rate than male participation.
The only age range to have experienced an increase in participation (although not statistically
significant) is the 65+ year olds, from 311,200 adults (3.81%) in 2007/8 to 314,200 adults (3.57%)
April 2011 – April 2012, an increase of 3,000 participants.
6 out of the 7 age ranges have experienced a statistically significant decrease in once a week
participation numbers, however the 35 – 44 year old category has seen the greatest decline of
145,500 adults, from 764,300 (9.79%) in 2007/8 to 618,800 (8.43%) April 2011 – April 2012.
No region has experienced an increase in once a week participation, statistically significant or not.
Whereas all regions have seen a statistically significant decline in once a week participation, with
the North-West Region seeing the greatest decline of 68,500 participants, from 455,200 adults
(8.19%) in 2007/8 to 386,700 adults (6.61%) April 2011 – April 2012.
At least once a month participation in swimming is showing signs of stabilisation, which has been driven by
participation increases over the last 6 months amongst the 45+ age groups where participation levels have
returned to those seen 12 months earlier.
There has been a decrease (although not statistically significant) in the overall number of
participants, from 5.570 million (13.44%) in 2007/8 to 4.913 million (11.48 %) April 2011 – April
2012, a decline of 656,800 participants.
Male participation has dropped by only 167,400 since APS2 (2007/8) in comparison to female
participation which has dropped by 489,400 (both a statistically significant decline).
The only age range to have experienced an increase in participation (although not statistically
significant) is the 65+ year olds, from 489,400 adults (5.98%) in 2007/8 to 504,300 adults (5.72%)
April 2011 – April 2012, an increase of 14,900 participants.
6 out of the 7 age ranges have experienced a statistically significant decrease in once a month
participation numbers, however like once a week participation, the 35 – 44 year old category has
seen the greatest decline of 258,700 adults, from 1.386 million (17.74%) in 2007/8 to 1.127 million
(15.33%) April 2011 – April 2012.
No region has experienced an increase in once a month participation, statistically significant or not.
The East Region has seen the greatest statistically significant decrease of 97,800 participants, from
622,200 adults (13.58%) in 2007/8 to 524,400 adults (11.11%) April 2011 – April 2012.
Organised swimming has remained fairly stable over time at just under 7% of participants. There has been
a statistically significant increase in the number of participants involved in competition swimming, from
1.4% in 2007/8 to 1.8% April 2011 – April 2012.
Page 17
Page 17 of 18
Table Tennis
Once a week participation in table tennis has dropped over the last 6 months, mainly from the 35 – 54 age
group, however participation of this group remains above the levels of 18 months ago.
There has been a statistically significant increase in the overall number of participants, from 75,600
(0.18%) in 2007/8 to 106,600 (0.25%) April 2011 – April 2012, an increase of 31,000 participants.
Out of the three age groups that had enough data to be analysed, the age range which has
experienced the largest increase (although not statistically significant) in once a week participation
is 45 – 64 year olds, from 25,000 (0.19%) in 2007/8 to 33,200 (0.23%) April 2011 – April 2012, an
increase of 8,200 participants.
No age range has experienced a decrease in once a week participation, statistically significant or
not. Although 4 out of the 7 age groups were under represented in the survey so have no data
values.
The East Region has seen the only statistically significant increase of 6,000 participants from 7,300
adults (0.16%) in 2007/8 to 13,300 adults (0.28%) April 2011 – April 2012.
The only region to have experienced a decrease in participation, (although not statistically
significant) is the West-Midlands, from 9,600 adults (0.22%) in 2007/8 to 9,400 adults (0.21%) April
2011 – April 2012, a decline of 200 participants.
The data for the most recent 6 months (Oct-Apr) replaces exceptionally high participation figures from the
same period a year ago. This is driving the slight drop in average once a week participation over the last 6
months.
At least once a month participation in table tennis is following a similar pattern to once a week
participation and has also dipped slightly over the last 6 months. There remains a long term picture of
growth in these figures too.
There has been an increase (although not statistically significant) in the overall number of
participants, from 195,600 (0.47%) in 2007/8 to 242,600 (0.57 %) April 2011 – April 2012, an
increase of 47,000 participants.
Both male and female participation numbers have seen a statistically significant increase from their
baseline values in 2007/8.
The age range which has experienced the largest statistically significant increase in once a month
participation is 45 – 64 year olds, from 53,600 (0.41%) in 2007/8 to 74,500 (0.53%) April 2011 –
April 2012, an increase of 20,900 participants.
The only age range to experience a decrease in participation (although not statistically significant)
is 16 – 19 year olds, from 30,900 adults (1.11%) in 2007 to 28,600 adults (1.06%) April 2011 – April
2012, a decline of 2,300 participants.
London has seen the greatest statistically significant increase of 13,300 participants, from 32,900
(0.54%) in 2007/8 to 46,200 (0.71%) April 2011 – April 2012.
Whereas, the South-West Region has experienced the largest decrease in participation (although
not statistically significant) of 1,700 participants from 23,300 (0.55%) in 2007/8 to 21,600 (0.50%)
April 2011 – April 2012.
Page 18
Page 18 of 18
Tennis
Once a week participation in tennis has increased in the last 6 months by 41,900 participants. This is the
first increase in once a week tennis participation for over 2 years.
There has been a statistically significant decrease in the overall number of participants, from
487,500 (1.18%) in 2007/8 to 417,700 (0.98%) April 2011 – April 2012, a decline of 69,800
participants.
The decline in female participation is more than twice that of male participation decline.
The only age range to experience an increase in once a week participation (although not
statistically significant) is 20 - 24 year olds, from 50,800 adults (1.41%) in 2007/8 to 51,000 adults
(1.35%), an increase of 200 participants.
The age range which has experienced the greatest statistically significant decrease in once a week
participation is 16 – 19 year olds, from 85,700 (3.05%) in 2007/8 to 60,900 (2.26%) April 2011 –
April 2012, a decline of 24,800 participants.
The North-East Region has seen the highest increase (although not statistically significant) of 4,000
participants from 12,900 adults (0.61%) in 2007/8 to 16,900 adults (0.79%) April 2011 – April 2012.
Whereas, the South-East region has seen the greatest statistically significant decrease of 25,900
participants from 121,900 adults (1.81%) in 2007/8 to 96,000 adults (1.38%) April 2011 – April
2012.
At least once a month participation in tennis has shown a similar bounce back over the last 6 months to
once a week participation.
There has been a decrease (although not statistically significant) in the overall number of
participants, from 939,400 (2.27%) in 2007/8 to 778,900 (1.82 %) April 2011 – April 2012, a decline
of 160,500 participants.
Female participation continues to decline at twice the rate of male participation decline.
No age range has experienced an increase in once a month participation, statistically significant or
not.
The age range which has experienced the largest statistically significant decrease in once a month
participation is 16 – 19 year olds, from 171,600 (6.16%) in 2007/8 to 107,100 (4.02%) April 2011 –
April 2012, a decline of 64,500 participants.
No region has experienced an increase in once a month participation, statistically significant or not.
Whereas, the South-East region has seen the greatest statistically significant decrease of 58,000
participants from 220,100 adults (3.27%) in 2007/8 to 162,100 adults (2.34%) April 2011 – April
2012.
There has been a statistically significant decrease in the number of participants involved in competition
Tennis from 18.0% in 2007/8 to 16.1% April 2011 – April 2012. On the other hand there has been a
statistically significant increase in the number of participants receiving Tennis tuition from 19.5% in 2007/8
to 22.3% April 2011 – April 2012.