1 Atlantic States Marine Fisheries Commission SPOT STOCK MONITORING REPORT Report to the South Atlantic State-Federal Fisheries Management Board May 5, 2010 Overview At the request of the South Atlantic State-Federal Fisheries Management Board, the Spot Plan Review Team (PRT) prepared this fourth annual report on trends in available fishery-dependent and fishery-independent indices of relative spot abundance through 2009. The PRT consists of representatives from Maryland Department of Natural Resources, Virginia Marine Resources Commission, North Carolina Division of Marine Fisheries, and South Carolina Department of Natural Resources, thus individual monitoring reports were generated for these states only. Another report on the NMFS Bottom Trawl Survey was provided by South Carolina Department of Natural Resources. Additional fishery-independent data were provided by staff from New Jersey Division of Fish and Wildlife and Delaware Division of Fish and Wildlife. Provided below is a brief overview of the reported indices of relative spot abundance. See the attached reports for more detailed descriptions and discussion. Overall conclusions on the stock’s health and recommendations from the PRT to the Management Board are included. Fishery-Dependent Data Summary 1. Commercial Harvest Per Unit Effort Commercial harvest and effort data from Maryland, Virginia, and North Carolina from the states’ respective commercial monitoring programs were used to create commercial harvest per unit effort (HPUE) indices for seven fisheries. These fisheries generally operate as multi-species fisheries; shifts in target species, because of market prices and/or species availability, lend some uncertainty to the observed trends. All 2009 data are preliminary. MD Inshore Pound Net Fishery: pounds per trip generally increased from 1980−2005, but have declined three of past four years (2006−2007, 2009) because of low catch despite stable effort. MD Inshore Gill Net Fishery: pounds per net yard hour were zero 1980−1984, moderate and variable through the 1990s, increased to a peak in 2002, declined to a moderate level 2005−2008, and increased in 2009. VA Inshore Gill Net Fishery: pounds per trip exhibit limited variability 1994−2009, with the 2009 value being above average. VA Haul Seine Fishery: pounds per trip were variable around the mean from 1994−2006, exhibited a sharp increase 2007−2008 before returning to average level in 2009. NC Long Haul Seine Fishery: pounds per trip were variable with slightly increasing trend 1994−2000, but declined nearly consistently 2001−2009, reaching the time series low in 2009. NC Inshore Gill Net Fishery: pounds per trip exhibit limited variability since 1994, but have been declining slightly since 2000, although the 2009 value is a slight increase from 2008. NC Ocean Gill Net Fishery: pounds per trip vary widely but declined consistently from 2004 to the time series low in 2008; the 2009 value exhibits a large increase but is still below average.
Transcript
1
Atlantic States Marine Fisheries Commission
SPOT STOCK MONITORING REPORT
Report to the South Atlantic State-Federal Fisheries Management Board May 5, 2010
Overview At the request of the South Atlantic State-Federal Fisheries Management Board, the Spot Plan Review Team (PRT) prepared this fourth annual report on trends in available fishery-dependent and fishery-independent indices of relative spot abundance through 2009. The PRT consists of representatives from Maryland Department of Natural Resources, Virginia Marine Resources Commission, North Carolina Division of Marine Fisheries, and South Carolina Department of Natural Resources, thus individual monitoring reports were generated for these states only. Another report on the NMFS Bottom Trawl Survey was provided by South Carolina Department of Natural Resources. Additional fishery-independent data were provided by staff from New Jersey Division of Fish and Wildlife and Delaware Division of Fish and Wildlife. Provided below is a brief overview of the reported indices of relative spot abundance. See the attached reports for more detailed descriptions and discussion. Overall conclusions on the stock’s health and recommendations from the PRT to the Management Board are included. Fishery-Dependent Data Summary
1. Commercial Harvest Per Unit Effort Commercial harvest and effort data from Maryland, Virginia, and North Carolina from the states’ respective commercial monitoring programs were used to create commercial harvest per unit effort (HPUE) indices for seven fisheries. These fisheries generally operate as multi-species fisheries; shifts in target species, because of market prices and/or species availability, lend some uncertainty to the observed trends. All 2009 data are preliminary.
MD Inshore Pound Net Fishery: pounds per trip generally increased from 1980−2005, but have declined three of past four years (2006−2007, 2009) because of low catch despite stable effort. MD Inshore Gill Net Fishery: pounds per net yard hour were zero 1980−1984, moderate and variable through the 1990s, increased to a peak in 2002, declined to a moderate level 2005−2008, and increased in 2009. VA Inshore Gill Net Fishery: pounds per trip exhibit limited variability 1994−2009, with the 2009 value being above average. VA Haul Seine Fishery: pounds per trip were variable around the mean from 1994−2006, exhibited a sharp increase 2007−2008 before returning to average level in 2009. NC Long Haul Seine Fishery: pounds per trip were variable with slightly increasing trend 1994−2000, but declined nearly consistently 2001−2009, reaching the time series low in 2009. NC Inshore Gill Net Fishery: pounds per trip exhibit limited variability since 1994, but have been declining slightly since 2000, although the 2009 value is a slight increase from 2008. NC Ocean Gill Net Fishery: pounds per trip vary widely but declined consistently from 2004 to the time series low in 2008; the 2009 value exhibits a large increase but is still below average.
2
2. Recreational Harvest Per Unit Effort Recreational harvest and effort data from the Marine Recreational Fisheries Statistics Survey (MRFSS) for Maryland, Virginia, North Carolina, and South Carolina have been used to estimate harvest per unit effort (HPUE) in past reports; the trends below are through 2008 only as 2009 data were incomplete at the time the state reports were generated. Effort is represented by trips in which anglers reported catching or targeting spot. Trends from additional state recreational programs are also reported below.
MD MRFSS: HPUE is widely variable, but generally decreased 1981-1999, generally increased 2000-2006, and decreased 2007-2008.
VA MRFSS: HPUE is widely variable, but generally average 1981-1988, high 1989-1991, average 1993-1998, lowest in 1999, and increased back to average by 2008.
NC MRFSS: HPUE shows inter-annual variability, but the overall trend since 1981 is increasing, although decreased in 2008.
SC MRFSS: HPUE is variable since 1981 and even more so since 2002, with a peak in 2007 and decline in 2008 to a level still well above the mean.
MD Charter Boat Logbook: catch per angler generally declined 1993−2001 and generally increased 2002−2009, with the 2009 value above the time series average. MD Citation Program: distribution of citations for spot > 12” was low 1994−1998, high 1999−2004, and similarly low 2005−2009. NC Recreational Commercial Gear License: survey suspended in 2009 so no updated trends; pounds harvested per trip were consistent 2002−2005, decreased 2006−2007, and leveled off near the low in 2008. NC Citation Program: distribution of citations for hook and line caught spot > 1 lb. was low 1994−2000, increased drastically to 2001 maximum, decreased but remained moderate 2002−2006, and has been low or non-existent 2007−2009.
3. Characterization Data Data from Maryland, Virginia, and North Carolina were used to produce commercial catch-at-age (CAA), weight-at-age (WAA), and length-at-age (LAA) for MD, VA, and NC fisheries where possible. Because of limited sample sizes for ages 4+ fish, only trends for ages 1−3 fish are discussed. Developing the Maryland matrices required borrowing some data from other states, which could influence the accuracy of the observed trends.
MD Commercial Pound Net Fishery: 1980−2009 CAA include ages 0−6, but are dominated by age 1 and sometimes age 2 fish; age 3 represented all but one year, ages 4-6 fish not present every year and are a small proportion of the catch; no clear trend in the CAA; lighter WAA and shorter LAA for ages 0−3 in recent years. VA Commercial Fisheries: 1998−2009 CAA for gill net (GN), pound net (PN), and haul seine (HS) caught spot include ages 0−6, but only ages 1−2 always present, and age 1 generally dominates; CAA expanded from ages 0−2 in 1998 to ages 0−6 in 2004−2005 and returned to ages <4 by 2009; WAA for GN ages 1−3 show limited variability or vary without trend, for HS ages 1−3 generally declined, and for PN age 1 was variable but generally declining and ages 2−3 declined 2001−2006/2007; LAA for GN ages 1−2 show no trend and age 3 a slight decline, for HS ages 1−3 show slight decrease, and for PN ages 1−2 have no trend and age 3 declined 2002−2007.
3
NC Commercial Fisheries: no processing of otoliths collected in 2007−2009; 1998-2006 CAA includes ages 0−6, but only ages 0−3 present all years; age 1 generally dominates, followed by age 2; decreasing trend in age 1 catch and increasing trend in age 3 catch 1998-2005; no WAA or LAA information available.
Fishery-Independent Data Summary
1. Juvenile Relative Abundance Indices Young-of-year (YOY) relative abundance indices from eight surveys reported.
DE Delaware Bay 16-ft Trawl Survey: variable throughout the time series but higher peaks 1980−1996 than 1997−2009, although modest peaks in 2005 and 2008; 2009 value decline from 2008. DE Inland Bays 16-ft Trawl Survey: variable throughout the time series but higher 1986−1996 than 1997−2009; decline in 2009 index value after modest peak in 2008. MD Chesapeake Bay Trawl and Seine Surveys: seine survey generally declining since peak in 1977; both surveys generally low with a few spikes in abundance since 1989; modest spikes in 2008 are followed by low index values in 2009. MD Coastal Bays Trawl and Seine Surveys: highly variable; moderate to high peaks in 2008 are followed by 5th lowest values in 2009. VIMS Juvenile Trawl Survey: generally higher prior to 1992, low since then, except an increase 2006−2008 although the 2009 index returned to pre-2006 level. NC Estuarine Trawl Survey: wide fluctuations with apparent peaks every 3−4 years; decline in 2009 from above average index in 2008. NC Pamlico Sound Trawl Survey: variable without trend; decline in 2009 from above average index in 2008. SC Electroshock Survey: high variability 2001−2009 with no clear trend; 2009 value exhibits large decline to below the time series average.
2. Adult or Aggregate Relative Abundance Indices Adult or aggregate (mix of YOY and older spot) relative abundance indices from six state survey, plus two multi-state survey, were reported.
NJ Delaware River Seine Survey: variable with high and moderate peaks and over all declining trend 1980−1997, then low 1998−2009 with a small peak in 2005; the 2009 value is the lowest in the time series. NJ Delaware Bay Trawl Survey: 2009 value not available to update trend; generally low and stable since 1991, with a spike in abundance in 2005, and consecutive increases 2007−2008 to time series high. NJ Ocean Trawl Survey: high inter-annual variability throughout the time series; decline in 2009 index after time series high in 2008. DE Delaware Bay 30-ft Trawl Survey: variable during disjoint portion of time series, then generally a decreasing trend 1990−2004, an increasing trend 2005−2008, with the 2009 value exhibiting a return to lower relative abundance. NC Independent Gill Net Survey: overall decline from 2001−2007, with 2008−2009 values low and stable.
4
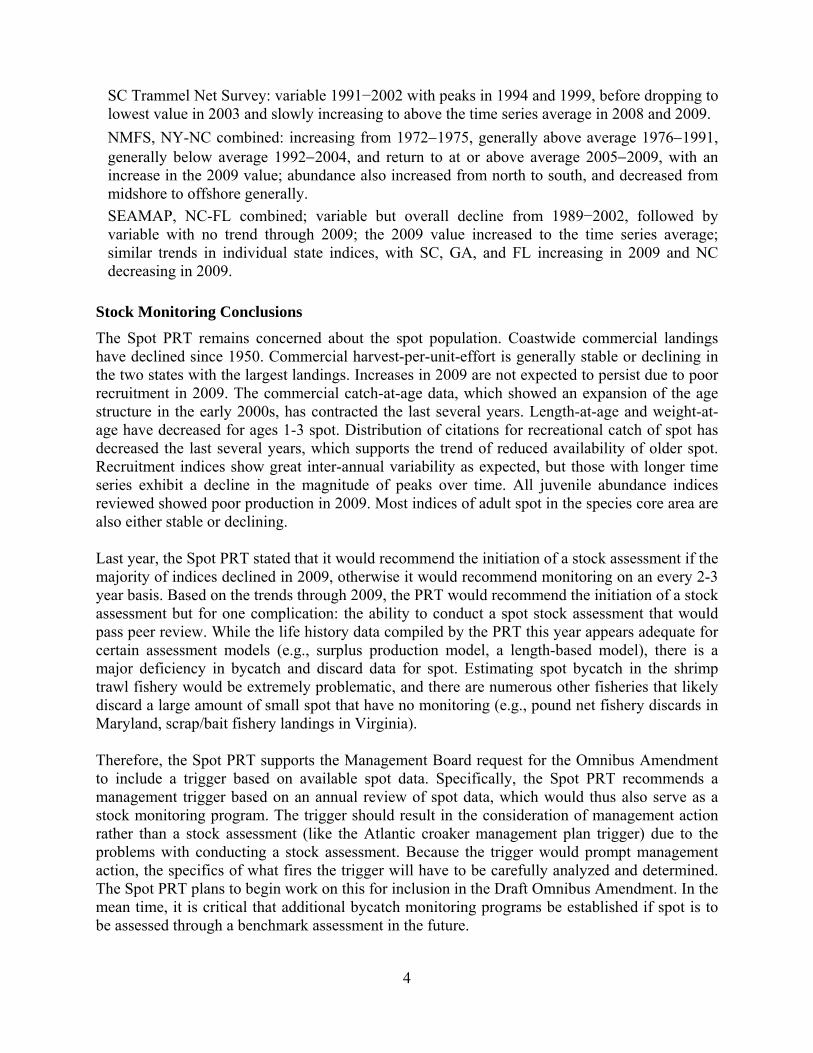
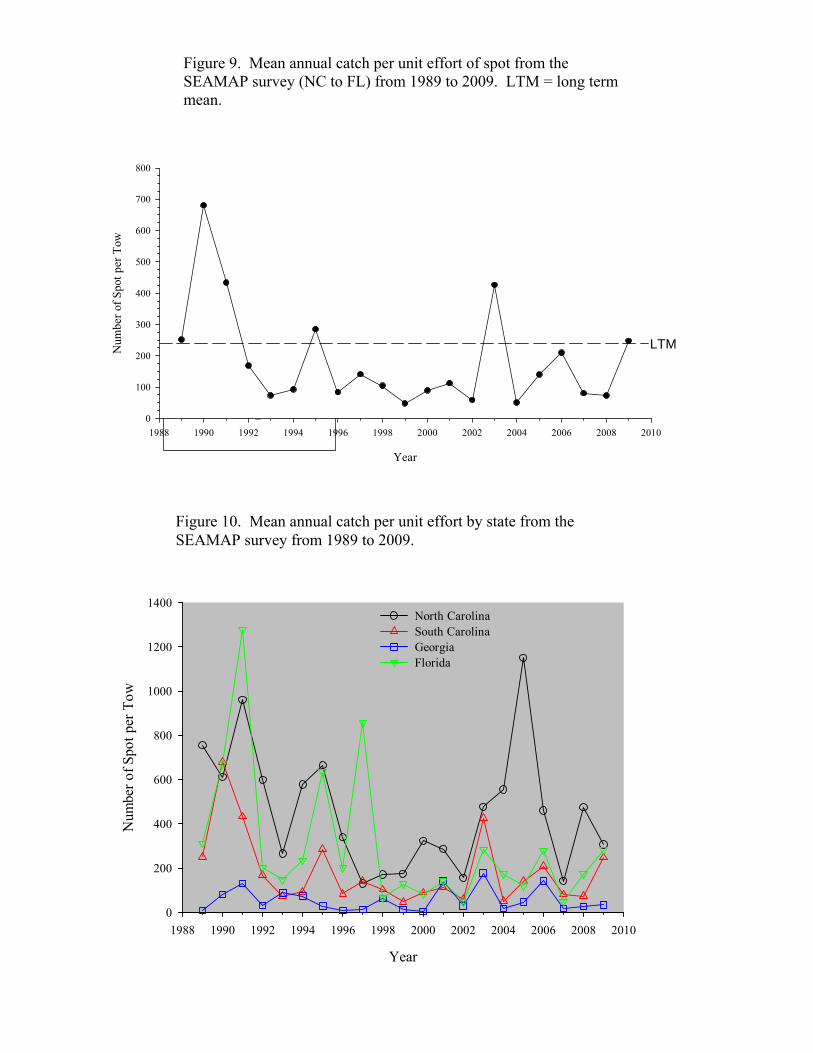
SC Trammel Net Survey: variable 1991−2002 with peaks in 1994 and 1999, before dropping to lowest value in 2003 and slowly increasing to above the time series average in 2008 and 2009. NMFS, NY-NC combined: increasing from 1972−1975, generally above average 1976−1991, generally below average 1992−2004, and return to at or above average 2005−2009, with an increase in the 2009 value; abundance also increased from north to south, and decreased from midshore to offshore generally. SEAMAP, NC-FL combined; variable but overall decline from 1989−2002, followed by variable with no trend through 2009; the 2009 value increased to the time series average; similar trends in individual state indices, with SC, GA, and FL increasing in 2009 and NC decreasing in 2009.
Stock Monitoring Conclusions The Spot PRT remains concerned about the spot population. Coastwide commercial landings have declined since 1950. Commercial harvest-per-unit-effort is generally stable or declining in the two states with the largest landings. Increases in 2009 are not expected to persist due to poor recruitment in 2009. The commercial catch-at-age data, which showed an expansion of the age structure in the early 2000s, has contracted the last several years. Length-at-age and weight-at-age have decreased for ages 1-3 spot. Distribution of citations for recreational catch of spot has decreased the last several years, which supports the trend of reduced availability of older spot. Recruitment indices show great inter-annual variability as expected, but those with longer time series exhibit a decline in the magnitude of peaks over time. All juvenile abundance indices reviewed showed poor production in 2009. Most indices of adult spot in the species core area are also either stable or declining. Last year, the Spot PRT stated that it would recommend the initiation of a stock assessment if the majority of indices declined in 2009, otherwise it would recommend monitoring on an every 2-3 year basis. Based on the trends through 2009, the PRT would recommend the initiation of a stock assessment but for one complication: the ability to conduct a spot stock assessment that would pass peer review. While the life history data compiled by the PRT this year appears adequate for certain assessment models (e.g., surplus production model, a length-based model), there is a major deficiency in bycatch and discard data for spot. Estimating spot bycatch in the shrimp trawl fishery would be extremely problematic, and there are numerous other fisheries that likely discard a large amount of small spot that have no monitoring (e.g., pound net fishery discards in Maryland, scrap/bait fishery landings in Virginia). Therefore, the Spot PRT supports the Management Board request for the Omnibus Amendment to include a trigger based on available spot data. Specifically, the Spot PRT recommends a management trigger based on an annual review of spot data, which would thus also serve as a stock monitoring program. The trigger should result in the consideration of management action rather than a stock assessment (like the Atlantic croaker management plan trigger) due to the problems with conducting a stock assessment. Because the trigger would prompt management action, the specifics of what fires the trigger will have to be carefully analyzed and determined. The Spot PRT plans to begin work on this for inclusion in the Draft Omnibus Amendment. In the mean time, it is critical that additional bycatch monitoring programs be established if spot is to be assessed through a benchmark assessment in the future.
Harry Rickabaugh Jr. Matapeake Terminal 301 Marine Academy Drive Stevensville, MD 21666 (410) 643 – 6776 extension 2109 • www.dnr.maryland.gov • TTY users call via Maryland Relay
Evaluation of the Status of Spot in Maryland - 2009
By Harry Rickabaugh
MD DNR Fisheries Service
April 2010
2
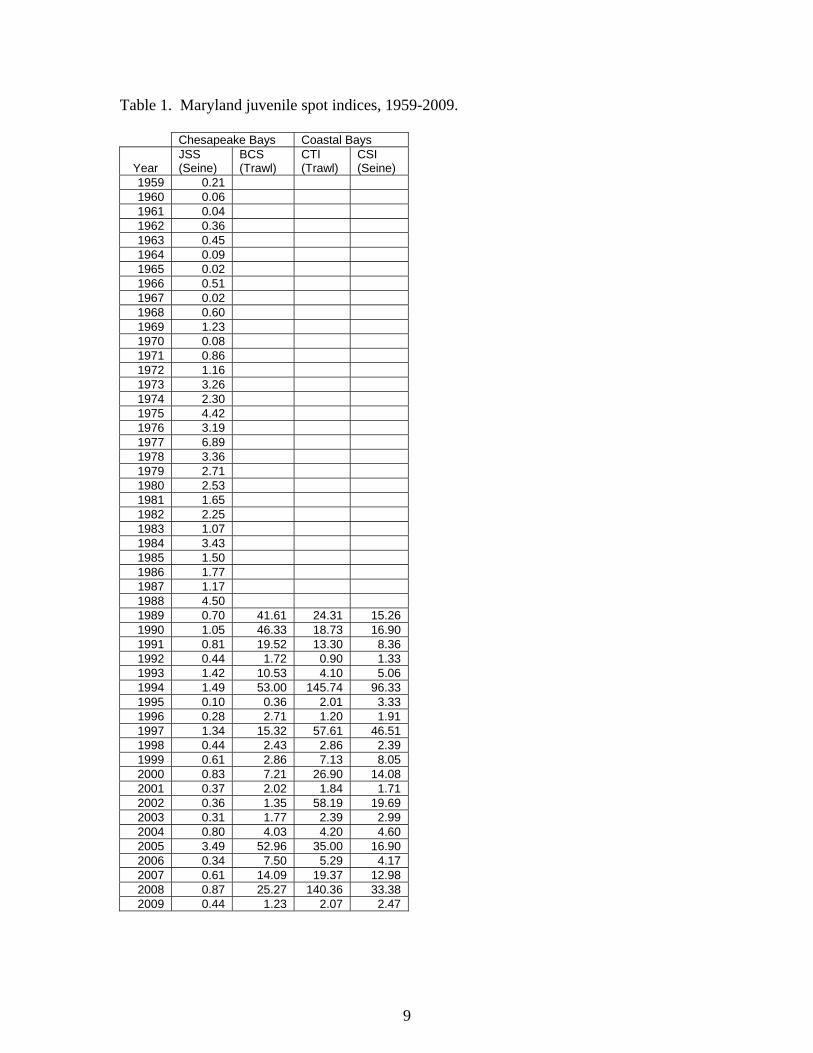
Introduction Recent declining trends in spot landings have raised some concern about the long term health of the stock. In the absence of a coast wide stock assessment, the South Atlantic State/Federal Fisheries Management Board (The Board) requested that the Atlantic States Marine Fisheries Commission (ASMFC) Spot Plan Review Team compile and summarize catch per unit effort (CPUE) data for spot in 2007 using data through 2006. The relationship between landings and abundance is not clear and before an amended spot plan is prepared, it should be determined if CPUE is actually declining. Participating states were to prepare individual reports using state specific data. A report for Maryland was completed in March of 2007. The board has requested each state continue to further develop and report on spot catch and biological information in subsequent years. Spot commercial CPUEs were updated through 2009 by making several assumptions and applying spatial and temporal limitations to the data. Recreational CPUEs were generated using the Marine Recreational Fishery Statistics Survey (MRFSS) estimates through 2008 and updated Maryland charter boat log data through 2009. Juvenile indices (JI) were also updated, through 2009, using data from existing surveys conducted by the Maryland Department of Natural Resources (MD DNR). In addition, data from Maryland pound net sampling was summarized from 1993-2009, and catch at age, mean weight at age and mean length at age calculated from 1998-2009. Methods Juvenile Indices Four juvenile indices were utilized in this evaluation, two from the Maryland portion of Chesapeake Bay and two from the Maryland coastal bays. The first JI is derived from the MD DNR Blue Crab Trawl Survey (BCS). The survey uses a 16ft bottom trawl at fixed stations in six areas of Maryland’s Chesapeake Bay. Survey details can be found in Davis et al. (1995). The BCS juvenile index is calculated as the geometric mean catch per tow and was updated through 2009. The survey has been conducted since 1980, but a review of the raw data revealed data entry omissions for spot in years prior to 1989. The second JI was derived from the Striped Bass Juvenile Seine Survey (JSS). This survey uses a 100ft long by 4 foot deep beach seine at fixed stations in five areas of Maryland’s Chesapeake Bay. Durell and Weedon (2005) describe the survey methods and index calculation in detail. The JSS index is calculated as a geometric mean catch per haul from 1959 -2009. The JSS has permanent and auxiliary sites, both of which were used in past spot JI calculations. However, for this report only permanent sites were used in JSS index calculations and analysis. The two coastal bay JIs are calculated from trawl and seine data collected by MD DNR Fisheries Service’s Atlantic Program (AP). The trawl survey uses the same type of trawl as the BCS at 20 fixed stations once a month from April through October (Luisi et al,
3
2005). The Coastal Trawl Index (CTI) was calculated using all 20 sites to derive an annual geometric mean catch by hectare. The seine portion of the AP sampling utilized a seine similar to the JSS, except for depth (6 ft vs. 4 ft) and the addition of a single central bag. Nineteen fixed stations were sampled once a month from June through September, and the corresponding Coastal Seine Index (CSI) was calculated using all sites to derive an annual geometric mean catch per haul. Both AP sampling efforts have been conducted since 1972, but sites and frequency were not standardized until 1989 (Angel Bolinger personal communication, 2007). Therefore, only 1989-2009 data was used for this analysis. Commercial Indices Commercial CPUEs were calculated from data collected by the MD DNR mandatory reporting system. Effort data was only available for 1980-1984, 1990 and 1992 - 2009, and consequently are the only years commercial CPUEs were generated. Maryland 2009 commercial effort and catch data are preliminary at this time. The landings data will change, since some 2009 commercial landings logs have not been received. Generally only minor changes in landings occur, but occasionally one or more larger scale fishermen send in later reports causing a more substantial increase in landings. CPUE was calculated for pound nets and gill nets, since they are the primary gears used to harvest spot in Maryland waters. The majority of fishermen did not indicate a target species when using either gear, so other criteria had to be developed to determine which fishermen to include for each CPUE. Pound net CPUE was limited to two regions that consistently produced spot annually, the main stem of Chesapeake Bay from the Chesapeake Bay Bridge south to the Maryland border with Virginia and the Maryland Potomac River tributaries. Any pound net set in either of these regions was included in this analysis. Only pound nets fished from May through October were included. Since Maryland reporting requirements did not require daily catch and effort entries prior to 2006, pound net data was reported monthly as the average number of nets fished and the number of days fished. For data prior to 2006 the catch per trip was calculated by dividing the catch for each month by the number of days fished for that month. Trip level catch and effort information is available for 2006 – 2009, so the pound net catch per trip was calculated directly from the database for those years. Since gill net catches were more sporadic and widely distributed than pound net catches, the area method for CPUE calculation was impractical, Atlantic Ocean catches were excluded from this analysis, and only fishermen that caught at least 100 pounds of spot in a given month were included. Net hour effort for gill nets was reported monthly as average length of net per day in yards, hours fished per day and days fished. CPUE effort was calculated by multiplying the average net length by hours fished multiplied by number of days (yards of net*hours fished*days fished). Gill net yard hour CPUE was the total effort for each year divided into the total catch in pounds for the year. Recreational Indices
4
The first recreational index was derived from MRFSS estimates of numbers of spot harvested and trips directed at spot through 2008 (National Marine Fisheries Service, Fisheries Statistics Division, personal communication). Preliminary 2009 data were only available for waves one through four at the time this report was written, so no 2009 index was calculated. Maryland wave six spot harvest estimates are generally very low and often are zero, but wave five catches can be substantial. Directed trips were from anglers that reported catching or targeting spot. Annual CPUE was calculated as the annual harvest divided by the number of trips for each year from 1981 to 2008. The second recreational index was derived from the Maryland charter boat log database. Charter captains are required to maintain daily logs of where they fish, how many fish of each species they catch and how many anglers participated. No indication of target species is recorded, so the CPUE includes only trips in which spot were captured. The number of anglers was used as effort and the number of spot captured was used as catch. The annual number of spot per angler was calculated for 1993-2009. The 2009 data is preliminary but should not change significantly. Maryland anglers who catch spot of a minimum length may apply for a Maryland state citation. Until 2003 the minimum length required was 10 inches but was raised to 12 inches in 2004. Lengths of submitted entries were available from 1994 through 2009, excluding 2000, so only 12 inch and greater spot were included for each year. The 2000 data was unavailable for inclusion in this report. Characterization Data From 1993- 2009 commercial pound nets were sampled from the mouth of the Potomac River and the lower portion of Maryland’s Chesapeake Bay. Each area was sampled once every two weeks, weather and fisherman’s schedule permitting. The commercial fishermen set all nets sampled as part of their regular fishing routine. Net soak time and manner in which they were fished were consistent with the fishermen’s day-to-day operations. All spot captured were measured from each net when possible. In instances when it was not practical to measure all fish, a random sample of spot was measured and the remaining individuals enumerated if possible. All measurements were to the nearest mm total length (TL). In 2009 seafood dealer sampling was added, all fish were from the pound net fishery. Random boxes of fish were selected and all fish measured to the nearest mm and weight was recorded in grams. Length frequency distributions were constructed for spot, using both data sets divided into 20 mm length groups (i.e. 130 mm length group comprised fish from 130-149 mm).
Catch at age was estimated in pounds and numbers from 1998-2009 using Maryland pound net length frequency data, Maryland commercial landings data, Virginia Marine Recourses Commission (VMRC) and North Carolina Department of Marine Fisheries (NCDMF) age data and VMRC length weight relationships by year. The 2009 catch at age used the same data sets with the exception of the length weight relationship, which
5
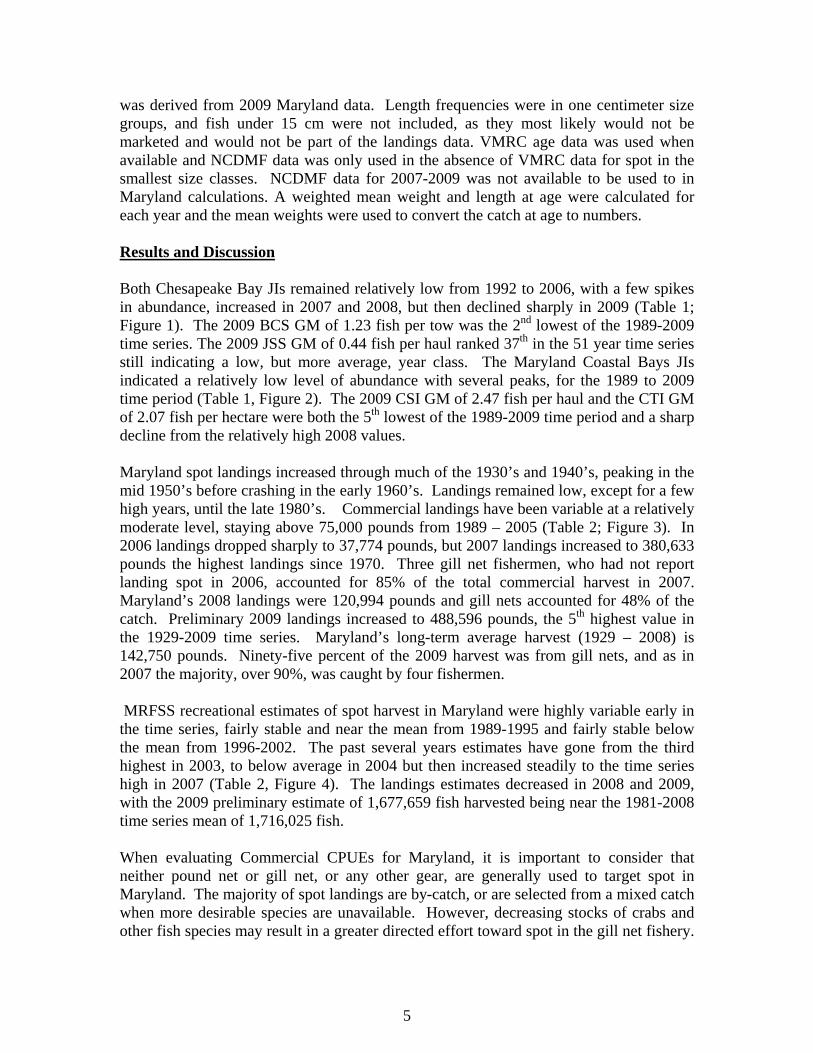
was derived from 2009 Maryland data. Length frequencies were in one centimeter size groups, and fish under 15 cm were not included, as they most likely would not be marketed and would not be part of the landings data. VMRC age data was used when available and NCDMF data was only used in the absence of VMRC data for spot in the smallest size classes. NCDMF data for 2007-2009 was not available to be used to in Maryland calculations. A weighted mean weight and length at age were calculated for each year and the mean weights were used to convert the catch at age to numbers. Results and Discussion Both Chesapeake Bay JIs remained relatively low from 1992 to 2006, with a few spikes in abundance, increased in 2007 and 2008, but then declined sharply in 2009 (Table 1; Figure 1). The 2009 BCS GM of 1.23 fish per tow was the 2nd lowest of the 1989-2009 time series. The 2009 JSS GM of 0.44 fish per haul ranked 37th in the 51 year time series still indicating a low, but more average, year class. The Maryland Coastal Bays JIs indicated a relatively low level of abundance with several peaks, for the 1989 to 2009 time period (Table 1, Figure 2). The 2009 CSI GM of 2.47 fish per haul and the CTI GM of 2.07 fish per hectare were both the 5th lowest of the 1989-2009 time period and a sharp decline from the relatively high 2008 values. Maryland spot landings increased through much of the 1930’s and 1940’s, peaking in the mid 1950’s before crashing in the early 1960’s. Landings remained low, except for a few high years, until the late 1980’s. Commercial landings have been variable at a relatively moderate level, staying above 75,000 pounds from 1989 – 2005 (Table 2; Figure 3). In 2006 landings dropped sharply to 37,774 pounds, but 2007 landings increased to 380,633 pounds the highest landings since 1970. Three gill net fishermen, who had not report landing spot in 2006, accounted for 85% of the total commercial harvest in 2007. Maryland’s 2008 landings were 120,994 pounds and gill nets accounted for 48% of the catch. Preliminary 2009 landings increased to 488,596 pounds, the 5th highest value in the 1929-2009 time series. Maryland’s long-term average harvest (1929 – 2008) is 142,750 pounds. Ninety-five percent of the 2009 harvest was from gill nets, and as in 2007 the majority, over 90%, was caught by four fishermen. MRFSS recreational estimates of spot harvest in Maryland were highly variable early in the time series, fairly stable and near the mean from 1989-1995 and fairly stable below the mean from 1996-2002. The past several years estimates have gone from the third highest in 2003, to below average in 2004 but then increased steadily to the time series high in 2007 (Table 2, Figure 4). The landings estimates decreased in 2008 and 2009, with the 2009 preliminary estimate of 1,677,659 fish harvested being near the 1981-2008 time series mean of 1,716,025 fish.
When evaluating Commercial CPUEs for Maryland, it is important to consider that neither pound net or gill net, or any other gear, are generally used to target spot in Maryland. The majority of spot landings are by-catch, or are selected from a mixed catch when more desirable species are unavailable. However, decreasing stocks of crabs and other fish species may result in a greater directed effort toward spot in the gill net fishery.
6
A unit of effort for gill net may vary considerably from year to year, as mesh sizes and set locations, change as watermen target more profitable species. These effects would be exacerbated if spot are targeted in some years and only by-catch in others, a likely possibility in the Maryland gill net fishery. Spot may be targeted when more profitable, since their dockside value adjusted to 2009 dollars had generally decreased slightly in Maryland until 2006 (Figure 5). The adjusted price per pound increased rapidly in 2006, and continued to increase through 2008, before declining back to the long term mean in 2009 (2009 data is preliminary). The recent above average prices for spot may be responsible for the sudden increase in gill net effort and catch. Because of the shifting nature of Maryland’s spot gill net fishery, conclusions concerning relative abundance from the associated CPUE values should be considered tenuous.
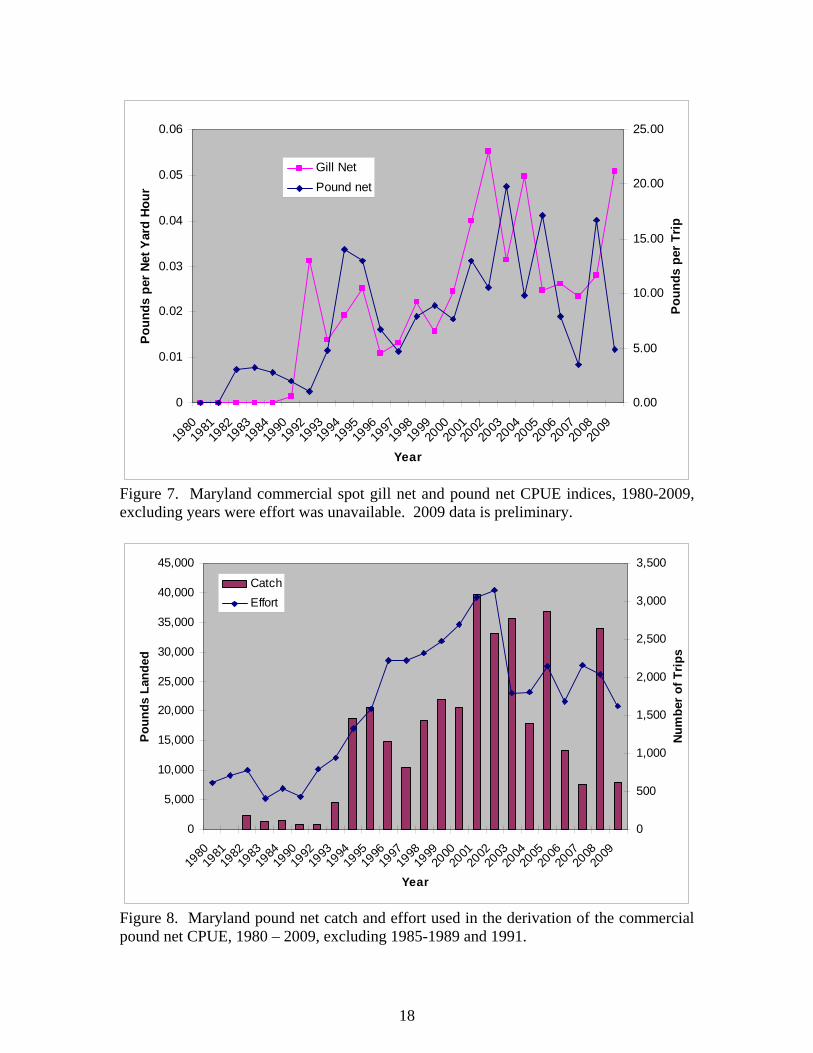
Gill net catch has generally followed effort, particularly in more recent years (Figure 6). The gill net CPUE had zero values for 1980-1984, were moderate and variable through the 1990s, and then increased peaking in 2002 (Table 3, Figure7). Since 2002 the gill net index decreased back to a moderate level in 2005, remained stable through 2008, and increased in 2009. The trend in pound net catch generally followed effort until 2006 and 2007, when effort remained fairly stable while catch declined (Figure 8). In 2008 effort remained similar to the previous 5 years, but catches increased. 2009 preliminary data indicates a decline in both catch and effort. The pound net commercial CPUE index generally increased through 2005 and then declined sharply in 2006 and 2007(Table 3, Figure 7). The 2008 pound net CPUE indicated an increase, but the preliminary 2009 CPUE indicates a sharp decline.
Pound net caught spot may also be landed as bait, either mixed with Atlantic menhaden or sold live to recreational fishermen. It is unclear how or if watermen report these landings. It is possible they are reported as menhaden when sold dead as bait. Spot sold live as bait often command much higher prices, but may be going unreported, or under reported, since they may not be sold through a dealer. The potentially changing proportion of spot landed as bait, because of their size or the price at the time they were landed is a primary concern with a Maryland pound net CPUE. The Maryland MRFSS CPUE varied widely, with a slight generally decreasing trend through 1999 and a generally increasing trend from 2000 to 2006 (Table 3, Figure 9). The 2008 Maryland MRFSS index decreased for the second straight year to approximately the time series mean. A 2009 CPUE was not generated, since wave 5 data was not yet available. The charter boat fishery for spot was prosecuted entirely in Chesapeake Bay. The Maryland charter boat CPUE generally declined from 1993 to 2002, and generally increased from 2002 through 2007 (Table 3, Figure 9). The 2009 Charter GM of 9.6 spot per angler was above the long term mean of 8.1 spot per angler. Both the MRFSS and charter boat indices did appear to follow a similar trend, particularly in recent years (Figure 9).
7
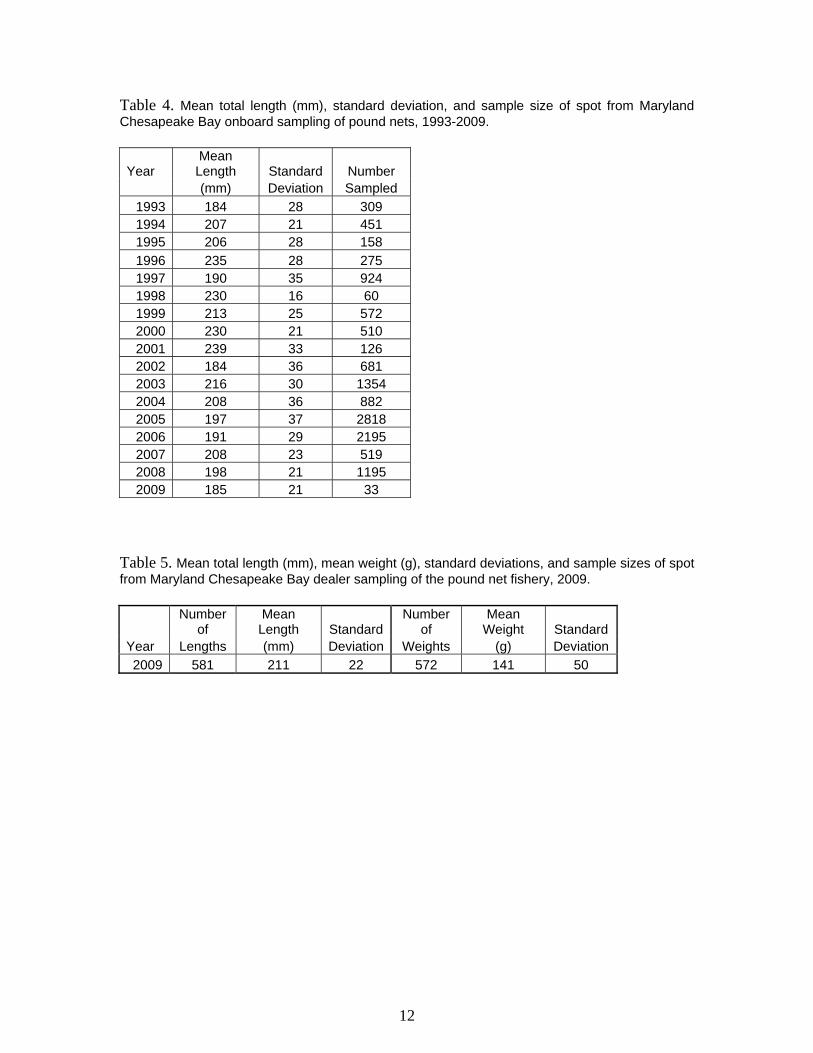
Submissions of 12 inch or greater spot to the Maryland citation program were very low (0-3 fish) from 1994 to 1998, increased rapidly to 141 in 2002, and then decreased sharply from 130 fish in 2003 to 0 fish in 2007 (Table 3). There were three submissions of 12 inch citation spot in 2008 and two in 2009. Spot mean length from the onboard sampling decreased in 2009 to 185 mm TL, the third lowest of the16 year time series (Table 4). Spot from seafood dealer sampling had a mean length and weight of 211 mm and 141 g, respectively (Table 5). The length frequency distribution in 2009 was further truncated, with fish between 150 and 199 mm TL accounting for 67% of the catch (Figure 10). Both mean length and length frequency distribution from the onboard sampling in 2009 may have been affected by the small sample size (n = 33). No jumbo spot were present in the 2009 onboard sampling. Jumbo spot in the survey have been declining for the past several years, with less than 1% of the pound net sample comprising spot >254 mm TL in 2007 and 2008, <2% in 2006 and 3% in 2005. This followed good catches in the early part of the decade (10% in 2003, 13% in 2004). The length frequency distribution from the seafood dealer survey indicated the majority of commercially harvested spot were 190 mm or greater (Figure 11), with a more normal distribution. There is no size limit for spot, but it is highly likely fishermen are discarding small spot, or selling them as bait.
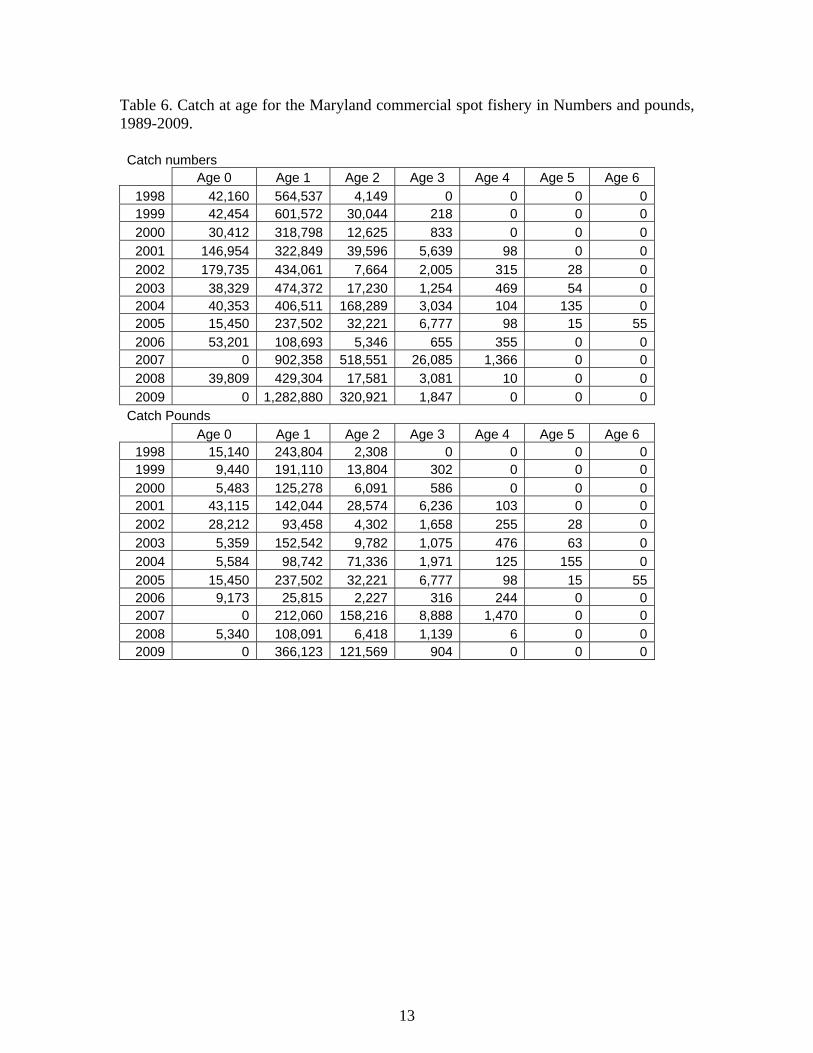
Catch at age estimates for Maryland’s commercial spot harvest in pounds and numbers were dominated by age one spot (Table 6, Figures 12 and 13). Age two spot were present each year, and occasionally represented a large portion of the catch. Age zero spot were present every year except 2007 and 2009, but since VA age sample sizes for the 15 and 16 cm length groups were very low, the smaller size groups may not be accurately represented. In previous years the NC spot age length key was used to fill in such cases, but it was not yet available for use. Spot age three were present in low numbers all years except 1998. Age four through six were not present every year, and only accounted for a very small portion of the catch in any given year. Catch at age in pounds and numbers was highly variable with no clear trends evident (Figures 12 and 13). However, the estimated number at age was derived solely from pound net length frequencies and utilized VMRC length weight relationships (except 2009, which uses MD DNR data) and age structure. While the Virginia biological data is probably representative of the age and weight characteristics of Maryland spot, small differences in age structure or the length weight relationship could cause a noticeable shift in numbers. Harvest from other gears may also produce different length frequencies than pound net caught fish.
Mean weight at age for pound nets was more variable between years than expected, but did indicate lighter weights at a given age in recent years for age zero through three spot (Table 7, Figure 14). Age four through six sample sizes were too low to make reasonable comparisons between years for weight or length at age. Mean length at age for ages zero through three were also generally shorter in recent years (Table 8, Figure 15). As with catch at age in numbers, the mean weights at age may not be accurate if spot in Maryland had different length weight characteristics than those in Virginia for any of the years examined.
8
References Davis, G. R., B. K. Daugherty, and J. F. Casey. 1995. Analysis of blue crab, Callinectes sapidus, stocks in the Maryland portion of the Chesapeake Bay from summer trawl data. Maryland Department of Natural Resources, Annapolis, Maryland. Durell, E.Q., and C. Weedon, 2005. Striped Bass Seine Survey Juvenile Index Web Page. http://www.dnr.state.md.us/fisheries/juvindex/index.html. Maryland Department of Natural Resources, Fisheries Service. Luisi, M., Docotor, S. and Staff of the MDDNR Atlantic Program. 2005. Investigation of Maryland’s Coastal Bays and Atlantic Ocean Finfish Stocks. Maryland Department of Natural Resources, Report F-50-R-14. Annapolis, Maryland.
Index Units Pound Net Pounds per Trip Gill Net Pounds per Yard Hour of Net MRFSS Fish per Trip Charter Boat Geometric Mean Catch per Angler Citations Number of citations submissions greater than 12 inches in length
12
Table 4. Mean total length (mm), standard deviation, and sample size of spot from Maryland Chesapeake Bay onboard sampling of pound nets, 1993-2009.
Table 5. Mean total length (mm), mean weight (g), standard deviations, and sample sizes of spot from Maryland Chesapeake Bay dealer sampling of the pound net fishery, 2009.
Table 6. Catch at age for the Maryland commercial spot fishery in Numbers and pounds, 1989-2009. Catch numbers Age 0 Age 1 Age 2 Age 3 Age 4 Age 5 Age 6
Figure 2. Comparison of Maryland Coastal Bay geometric mean juvenile spot indices, 1989-2009.
16
0
100,000
200,000
300,000
400,000
500,000
600,000
700,000
1929
1933
1937
1941
1945
1949
1953
1957
1961
1965
1969
1973
1977
1981
1985
1989
1993
1997
2001
2005
2009
Year
Poun
ds
Figure 3. Maryland’s spot commercial landings in pounds, 1929-2009. 2009 data are preliminary.
0
500,000
1,000,000
1,500,000
2,000,000
2,500,000
3,000,000
3,500,000
4,000,000
4,500,000
1981
1983
1985
1987
1989
1991
1993
1995
1997
1999
2001
2003
2005
2007
2009
Year
Num
ber C
augh
t
HarvestedReleased
Figure 4. MRFSS estimates of Maryland spot harvest and releases, 1981-2009. 2009 data is preliminary and does not include waves 5 or 6.
17
0.00
0.20
0.40
0.60
0.80
1.00
1.20
1.40
1980
1982
1984
1986
1988
1990
1992
1994
1996
1998
2000
2002
2004
2006
2008
Year
Pric
e pe
r Po
und
in 2
009
US
$
Figure 5. Price per pound, in 2009 dollars, for spot sold in Maryland, 1980-2009 for years with available data.
0
50000
100000
150000
200000
250000
300000
350000
400000
450000
500000
1980
1981
1982
1983
1984
1990
1992
1993
1994
1995
1996
199719
9819
9920
0020
0120
0220
0320
0420
0520
0620
0720
0820
09
Year
Poun
ds L
ande
d
0
2000000
4000000
6000000
8000000
10000000
12000000
14000000
16000000
18000000
Net
Yar
d Ho
urs
CatchEffort
Figure 6. Maryland gill net catch and effort used in the derivation of the commercial gill net CPUE, 1980 – 2009, excluding 1985-1989 and 1991.
18
0
0.01
0.02
0.03
0.04
0.05
0.06
1980
1981
1982
1983
1984
1990
1992
1993
1994
1995
1996
1997
1998
1999
2000
2001
2002
2003
2004
2005
2006
2007
2008
2009
Year
Poun
ds p
er N
et Y
ard
Hou
r
0.00
5.00
10.00
15.00
20.00
25.00
Poun
ds p
er T
rip
Gill NetPound net
Figure 7. Maryland commercial spot gill net and pound net CPUE indices, 1980-2009, excluding years were effort was unavailable. 2009 data is preliminary.
0
5,000
10,000
15,000
20,000
25,000
30,000
35,000
40,000
45,000
1980
1981
1982
1983
1984
1990
1992
1993
1994
1995
1996
1997
1998
1999
2000
2001
2002
2003
2004
2005
2006
2007
2008
2009
Year
Poun
ds L
ande
d
0
500
1,000
1,500
2,000
2,500
3,000
3,500
Num
ber
of T
rips
CatchEffort
Figure 8. Maryland pound net catch and effort used in the derivation of the commercial pound net CPUE, 1980 – 2009, excluding 1985-1989 and 1991.
19
0.0
1.0
2.0
3.0
4.0
5.0
6.0
7.0
8.0
1981
1983
1985
1987
1989
1991
1993
1995
1997
1999
2001
2003
2005
2007
2009
Year
Num
ber o
f Spo
t per
Trip
0.0
2.0
4.0
6.0
8.0
10.0
12.0
Num
ber o
f Spo
t per
Ang
ler
MRFSSMD Charter
Figure 9. Maryland charter boat CPUE, 1993-2009 and inland MRFSS CPUE, 1981-2008.
20
Figure 10. Spot length frequency distributions from onboard pound net sampling, 2006-2009.
Figure 11. Spot 2009 length frequency distribution from seafood dealer sampling.
0
50,000
100,000
150,000
200,000
250,000
300,000
350,000
0 1 2 3 4 5 6Age
Poun
ds
199819992000200120022003200420052006200720082009
Figure 12. Spot catch at age in pounds for Maryland’s commercial fishery, 1998-2009.
22
0
200,000
400,000
600,000
800,000
1,000,000
1,200,000
0 1 2 3 4 5 6Age
Num
ber H
arve
sted
199819992000200120022003200420052006200720082009
Figure 13. Spot catch at age in numbers for Maryland’s commercial fishery, 1998-2009.
0.0
100.0
200.0
300.0
400.0
500.0
600.0
700.0
0 1 2 3 4 5 6Age
Gra
ms
199819992000200120022003200420052006200720082009
Figure 14. Spot mean weight at age in grams for Maryland’s commercial pound net fishery, 1998-2009.
23
0.0
5.0
10.0
15.0
20.0
25.0
30.0
35.0
40.0
0 1 2 3 4 5 6Age
Cen
tem
eter
s199819992000200120022003200420052006200720082009
Figure 15. Spot mean length at age in centimeters for Maryland’s commercial pound net fishery, 1998-2009.
Annual Monitoring Report for Spot, Leiostomus xanthurus,
Occurring in Virginia Waters
Report to the Atlantic States Marine Fisheries Commission
April 2010 Prepared by:
Laura M. Lee Plans/Statistics Department Fisheries Management Division Virginia Marine Resources Commission 2600 Washington Avenue Newport News, VA 23607
2
Introduction The Atlantic States Marine Fisheries Commission’s (ASMFC) South Atlantic Board requested that the Spot Plan Review Team (PRT) review and update available data relevant for the spot resource. This report summarizes data specific to the state of Virginia and includes data through 2009 where possible.
Management The Virginia Marine Resources Commission (VMRC) currently has no (specific) regulations governing commercial or recreational fisheries for spot in Virginia’s marine waters.
Fisheries-Dependent Monitoring Commercial Fishery Commercial fisheries data were obtained from the VMRC mandatory reporting database. Note that 2009 commercial data are considered preliminary and should be interpreted with caution.
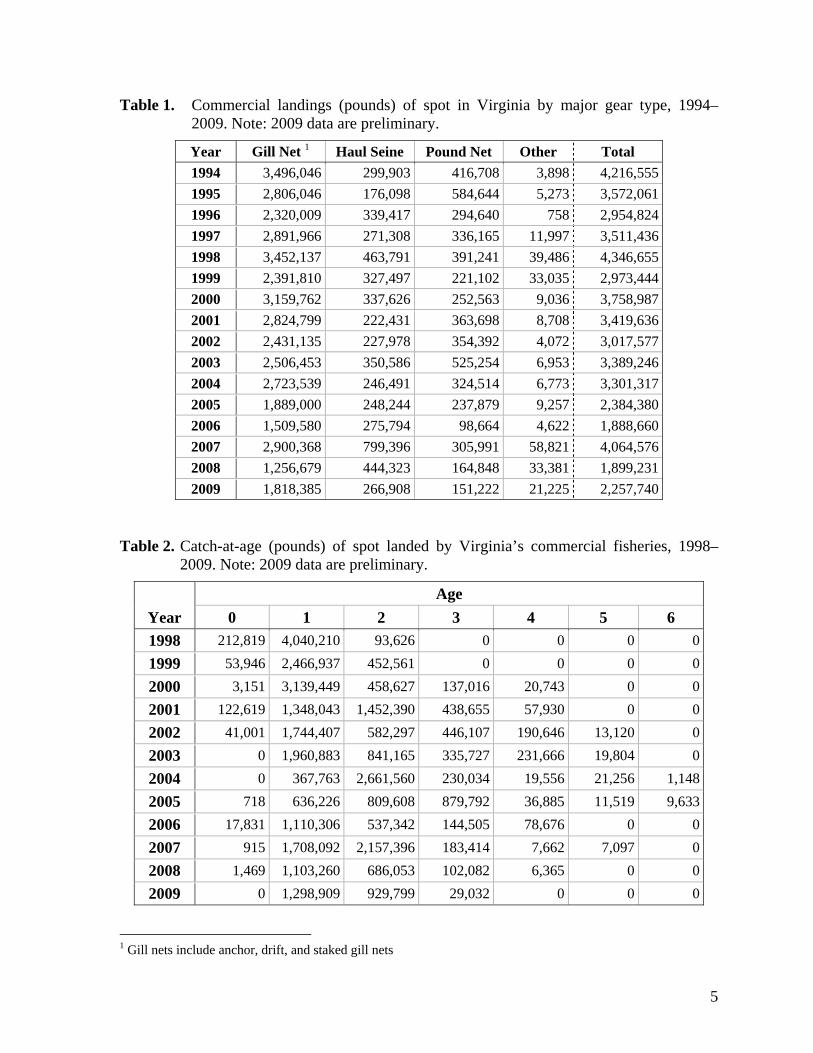
Commercial fisheries have landed an average of 3.18 million pounds of spot per year in Virginia from 1994 through 2009 (Table 1; Figure 1). During this time period, Virginia’s commercial landings of spot have ranged from a low of 1.89 million pounds in 2006 to a high of 4.35 million pounds in 1998. The majority of commercial landings of spot have been taken by gill nets (including anchor, drift, and staked), accounting for 79.2% of the harvest between 1994 and 2009. Haul seines and pound nets have accounted for most of the remaining landings, accounting for 10.4% and 9.86% of Virginia’s commercial landings, respectively.
The VMRC Biological Sampling Program collects biological data from Virginia’s fisheries. Fish samples are measured and weighed and selected species are further processed for ageing. Age data are available from 1998 to 2009, though 2009 data are considered preliminary. The biological sampling data were used to estimate the total weight at age of spot in Virginia’s commercial landings. Spot ranging in age from 0 to 6 have been observed in Virginia’s commercial landings during the available time series (Table 2). The commercial landings have been dominated by age-1 spot in most years of the available time series. Note that no age-0 spot were observed in 2003, 2004, or 2009.
Gear-specific estimates of average individual weight at age and average individual length at age were calculated using data collected from commercial gill nets, haul seines, and pound nets. Sample sizes for fish aged 0 and aged 4–6 were typically small and so biological characterizations for these ages should be interpreted with caution. The average weight of age-1 spot sampled from the commercial gill-net fishery showed little variation over the time series (Table 3). The average weight of age-2 and -3 spot harvested by gill nets varied over the time series. The average weight of spot aged 1 through 3 sampled from commercial haul seines exhibited a general decrease over the time series (Table 4). Spot samples collected from commercial pound nets showed a decline in the average weight of age-2 and -3 fish from 2001 through 2006/2007 (Table 5). The average weight of age-1 spot sampled from pound nets was variable, but generally decreasing, over the time series. The average length of spot sampled from commercial gill nets exhibited no apparent trend over time for fish aged 1 or 2 (Table 6). Samples from the gill nets suggested a slight decline in the average length of
3
age-3 spot over the time series. The commercial haul-seine data provided evidence of a slight decrease in the average length of age-1, -2, and -3 spot over the time period (Table 7). Age-3 spot sampled from the commercial pound-net fishery exhibited a declining trend in average length from 2002 through 2007 (Table 8). No clear trend in average length was evident for age-1 or age-2 spot sampled from the pound nets.
Fishery-dependent indices of commercial harvest-per-unit-effort (HPUE) were developed for Virginia's commercial inshore gill-net and haul-seine fisheries. Directed trips for the commercial inshore gill-net fishery were defined as those trips that harvested greater than or equal to 100 pounds of spot. The inshore gill-net HPUE exhibited limited variability between 1994 and 2009 (Figure 2). The series ranged from a low of 581 pounds per directed trip in 2006 to a high of 1,005 pounds per directed trip in 1998. The haul-seine HPUE has been slightly more variable, ranging from a low of 570 pounds per trip in 2001 to a high of 1,835 pounds in 2007. The haul-seine HPUE for spot has declined since the peak observed in 2007.
Recreational Fishery Recreational fisheries statistics for spot caught in Virginia waters were provided by the Marine Recreational Fisheries Statistics Survey (National Marine Fisheries Service, Fisheries Statistics Division, Silver Spring, MD, pers. comm.). Recreational statistics estimates for 2009 include waves 1–4 and 6 only and are considered preliminary; the 2009 estimates should be interpreted with caution.
Recreational fisheries have accounted for about 25% of the total landings (commercial landings plus recreational harvest—Type A + B1) in weight of spot in Virginia during 1994 to 2009 (Figure 1). From 1981 to 2009, annual recreational harvest (Type A+B1) of spot averaged approximately 1.41 million pounds in weight and 3.87 million fish in number (Table 9). The lowest annual recreational harvest on record in terms of weight during these years occurred in 1999, at just over 244 thousand pounds of spot. Since then, Virginia’s recreational harvest of spot in weight increased to nearly 2.50 million pounds in 2007. Estimated recreational harvest weight of spot in 2008 was just over 2.0 million pounds. The number of spot harvested by recreational anglers in Virginia ranged from a low of 527 thousand fish in 2000 to a high of 12.1 million fish in 1983, from 1981 to 2009. The 2009 estimates of recreational harvest weight and number are low relative to the previous five years; however, the 2009 estimates are incomplete as they do not yet include data from wave 5. During 2001 through 2008, the majority of Virginia recreational harvest of spot in terms of both weight and numbers occurred in wave 5. It is expected that the final estimates of recreational harvest weight and number for 2009 will be within the range of values observed between 2004 and 2008.
The number of spot released alive by Virginia’s recreational anglers has averaged over 2.0 million fish a year from 1981 to 2009 (Table 9). The annual number of recreational live releases has been below the time-series average since 1992, with the exception of 1994 (2.14 million fish) and 2007 (2.31 million fish). The largest number of live releases was observed in 1981, when an estimated 8.91 million spot were released by recreational anglers in Virginia. The number of spot released alive in Virginia exceeded recreational harvest in only one year between 1981 and 2009.
Recreational indices of harvest-per-unit-effort (HPUE) were developed by H. Rickabaugh (Maryland Department of Natural Resources, pers. comm.). The Virginia recreational HPUE
4
series was calculated by dividing the number of spot harvested (Type A+B1) by the number of trips that targeted spot and/or caught spot (Type A, B1, or B2). Since estimates of recreational harvest and recreational effort for 2009 are incomplete, a 2009 index was not calculated; an index for 2009 will be computed when the 2009 data are finalized. Recreational HPUE was variable from 1981 through 2008, ranging from a low of 1.42 spot harvested per trip in 2000 to a high of 16.6 spot harvested per trip in 1983 (Figure 3). Annual recreational HPUE has demonstrated an increasing trend in 2003 through 2008.
Fisheries-Independent Surveys VIMS Juvenile Fish and Blue Crab Trawl Survey The Virginia Institute of Marine Science (VIMS) Juvenile Fish and Blue Crab Trawl Survey was implemented in 1955 to monitor the seasonal distribution and abundance of important finfish and invertebrate species occurring in the Chesapeake Bay and its tributaries.
The VIMS develops annual indices of abundance for age-0 spot to provide a measure of relative year-class strength. The Random-Stratified Index (RSI) is a weighted geometric average based on data collected from stations in the tributaries (fixed and random) and in the bay (random) and so is considered the most comprehensive spatially (M. Fabrizio, VIMS, pers. comm.). The following months and length cut-offs were used to restrict the index to age-0 spot: July (0–160 mm total length); August (0–180 mm total length); September (0–200 mm); and October (0–200 mm total length).
The RSI index has been highly variable throughout much of the time series (Figure 4). The largest index values were observed during 1988–1990, the earliest years for the RSI time series. Since then, the index suggests spot year-class strength has been relatively weak. A slight increase occurred from 2006 to 2008, but decreased in 2009.
5
Table 1. Commercial landings (pounds) of spot in Virginia by major gear type, 1994–2009. Note: 2009 data are preliminary.
1 Gill nets include anchor, drift, and staked gill nets
6
Table 3. Average weight (pounds) at age of spot samples collected from commercial gill-net landings in Virginia, 1998–2009. Note: 2009 data are preliminary.
Table 5. Average weight (pounds) at age of spot samples collected from commercial pound-net landings in Virginia, 1998–2009. Note: 2009 data are preliminary.
Table 7. Average length (inches) at age of spot samples collected from commercial haul-seine landings in Virginia, 1998–2009. Note: 2009 data are preliminary.
Table 9. Estimated amount of spot harvested (Type A+B1) and released alive (Type B2) by recreational anglers in Virginia, 1994–2009. Note: 2009 estimates include waves 1–4 and 6 only and are considered preliminary.
rt Inshore Gill Net (lb/directed trip)Haul Seine (lb/trip)
0
500
1,000
1,500
2,000
2,500
3,000
3,500
4,000
4,500
5,000
1994
1995
1996
1997
1998
1999
2000
2001
2002
2003
2004
2005
2006
2007
2008
2009
Year
Thou
sand
s of
Pou
nds
CommercialRecreational
Figure 1. Annual commercial landings and recreational harvest of spot in Virginia, 1994–
2009. Note: 2009 data are preliminary. Figure 2. Harvest-per-unit-effort (HPUE) of spot in Virginia’s commercial inshore gill-net
and haul-seine fisheries, 1994–2009. Note: 2009 data are preliminary.
11
0
2
4
6
8
10
12
14
16
18
1981
1983
1985
1987
1989
1991
1993
1995
1997
1999
2001
2003
2005
2007
Year
Num
ber
Harv
este
d-pe
r-Tri
p
0
10
20
30
40
50
60
70
80
1988
1990
1992
1994
1996
1998
2000
2002
2004
2006
2008
Year
Wei
ghte
d G
eom
etri
c A
vera
ge
Figure 3. Harvest-per-unit-effort (HPUE) of spot in Virginia’s recreational fishery, 1981–
2009. Figure 4. Random-Stratified Index of age-0 spot relative abundance based on the VIMS
Juvenile Fish and Blue Crab Trawl Survey, 1988–2009.
DRAFT SPOT HARVEST AND INDEX REPORT FOR NORTH CAROLINA
A Report to the Atlantic States Marine Fisheries Commission
April 09, 2010
North Carolina Division of Marine Fisheries Recent (1994-2009) Trends in North Carolina Commercial and Recreational Spot Fisheries Introduction: The following represents North Carolina’s commercial and recreational harvest and biological information for 2010. No changes in management are proposed for the upcoming year. Dependent Data: Commercial Harvest (North Carolina Trip Ticket Program (NCTTP)):
Data shown for 2009 are preliminary and will not be verified and finalized until mid May 2010.
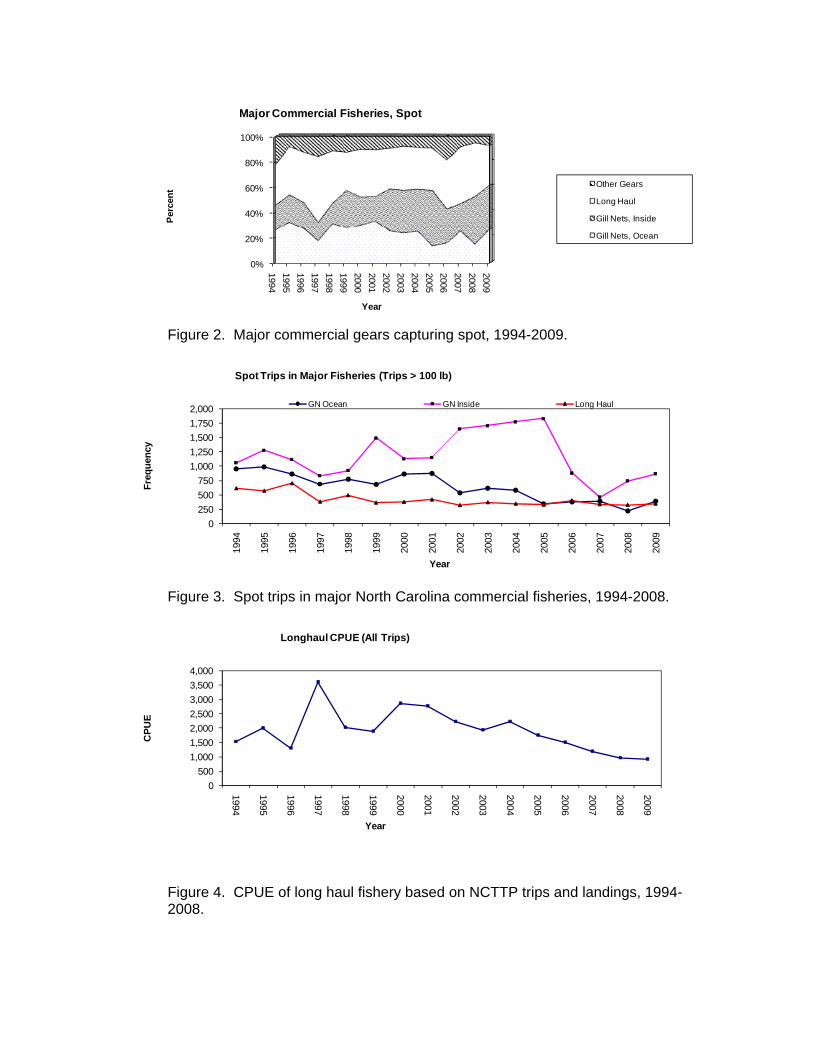
• Commercial landings since 1994 have averaged 2.1 million pounds (Figure 1).
• Three major fisheries accounted for an average of 89.0% of landings, inshore gill net, ocean gill net and long haul (Figure 2) since 1994, and 92.9% for 2008.
• Since 1994 declines greater than 20% year to year occurred 5 of the 15 years, most recently in 2007 when harvest decreased 36%. There was a 36.5% increase in 2009.
• Since 1994, effort had been decreasing in the ocean gill net fishery, however there was a 79% increase from 2008 to 2009. Effort also increased by 17% in the inshore gill net fishery and by 7% in the long haul fishery (Figure 3).
• The number of long haul trips has been consistent since 1999 but declined from 615 trips in 1994 to 327 trips in 2005, a decrease of 46.8%.
• Ocean gill net trips catching at least 100 lb steadily decreased from 952 trips in 1994 to 327 trips in 2005, a 64.3% decrease. Since 2001, the number of ocean gill net trips catching greater than 100 lb has been declining. However there was a 79% increase from 215 trips in 2008 to 385 trips in 2009 (Figure 3).
• 2009 inshore gill net trips increased 17.5% year to year, long haul trips increase 7.1% year to year, and ocean gill net trips increased 79.1% while total commercial landings increased 36.5% from the 15-year historical low.
• CPUEs in the long haul fishery were the lowest of the 15-year period and have decreased for 5 consecutive years. The CPUEs for the inshore gill net fishery increased from the lowest of the 15-year period. The ocean gill
net CPUEs have fluctuated the most, with CPUE values in 2009 increasing significantly from 2008, which is the lowest of the 15-year period (Figures 4 and 5).
Landings and Mean Catch Per Angler Trip - The mean catch per angler trip was examined from 1989 until 2008 (2009 effort data unavailable). It was calculated by summing Type A and Type B1 catch and dividing by the number of contributing fishermen at the interview/trip level. Landings data shown for 2009 are preliminary, do not include the wave 5 data, and will not be verified and finalized until later in 2010.
• Landings in the recreational fishery have averaged 1.2 million lb (Figure 1).
• Landings in 2009 were 86.4% below the 1994-2009 mean and decreased 81.2% year to year. However this does not include the wave 5 data from the 2009 MRFSS survey, and is likely not representative.
• Fluctuations have been common, landings up > 100% in 2001 relative to 2000, down 45% in 2002.
• Mean catch per angler trip decreased from 11.4 fish per trip in 2007 to 7.4 fish per trip in 2008. The average catch per angler trip from 1989-2008 was 7.5 fish per trip (Figure 6).
• Trend line has a positive slope since 1989 indicating a slight increase in CPUE during the 18 year period.
Recreational Commercial Gear License (RCGL) Harvest (NC Marine Fisheries License and Statistics Section): The RCGL allows recreational fishermen to use limited amounts of commercial gear to harvest seafood for their personal consumption. Seafood harvested under this license cannot be sold. Fishermen using this license are held to recreational size and possession limits.
• NCDMF began to gather data in 2002 on RCGL license holders and spot landings have averaged 203,383 lb since 2002.
• Due to budget constraints the RCGL surveys were suspended in 2009. • Landings increased 7.8% from 2007 to 2008 (Figure 7), while trips
increased 3.6%.CPUE (pounds/trip) also increased slightly in 2008, from the lowest on record in 2007.
• CPUE (pounds/trip) were consistent 2002-2005 but significantly decreased in 2006 and 2007 (Figure 8).
North Carolina Citation Program North Carolina awards a citation to applicants for any spot caught by hook and line if weight exceeds 1 lb.
• Low citation years, 1994-1999, year with highest number citations was
1999 with ten. • Beginning in 2000, many more citation sized fish applications were
received, 19 in 2000, 249 in 2001, and 81 in 2005 but there were only two citations received in 2007 and none in 2008 or 2009 (Figure 9).
Independent Data: Pamlico Sound Survey - Program 195: Fifty-two randomly selected stations (grids) are sampled in June and again in September. Stations are randomly selected from strata based upon depth and geographic location. Randomly selected stations are optimally allocated among the strata based upon all previous sampling in order to provide the most accurate abundance estimates (PSE <20). Tow duration is 20 minutes; utilizing double rigged demersal mongoose trawls (9.1-m headrope, 1.0-m X 0.6 m doors, 2.2 cm bar mesh body, 1.9 cm bar mesh cod end and a 100-mesh tailbag extension.
• Data from this survey were used to produce juvenile abundance indices for spot from 1994 to 2009 (Figure 10).
• CPUEs have been extremely variable with no clear trend. • Most recent year (2009) showed a significant decrease from 2008.
Estuarine Trawl Survey - Program 120:
One hundred five estuarine core stations along the coast are sampled each year without deviation to produce the JAI. Used is a two-seam 10.5 foot headrope trawl with a ¼ inch mesh in the body and 1/8 inch mesh in the tailbag. Tow duration is calibrated for 1 minute and a span of 75 yards.
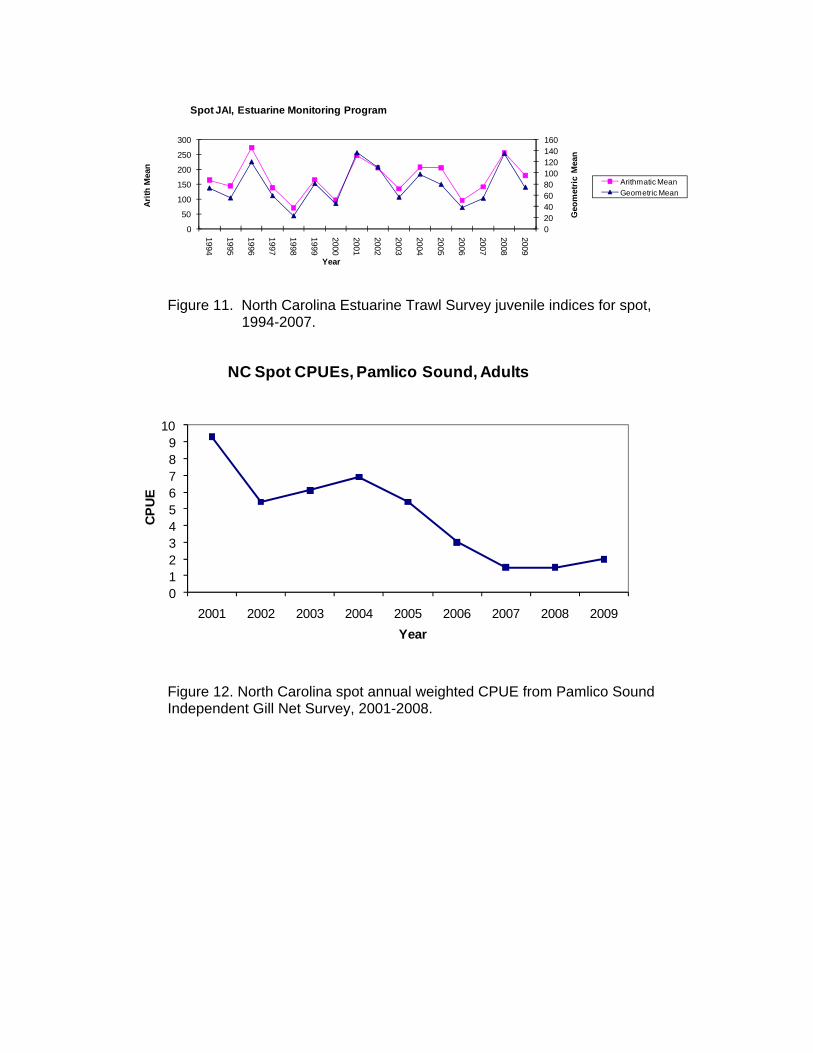
• Data from this survey were used to produce JAIs for spot from 1994 to 2009 (Figure 11).
• These data also show wide fluctuations with no clear trend. Independent Gill Net Survey: Pamlico Sound – Program 915:
This study that began in 2001 employs a stratified-random sampling design based on area and water depth. An array of nets consisting of 30-yard segments of 3, 3½, 4, 4½, 5, 5½, 6, and 6½ inch stretched mesh webbing is set. Catches from an array of gill nets comprise a single sample and two samples (one shallow, one deep), totaling 480 yards of gill nets fished, were completed in a trip. Within a month, 32 core samples were completed (8 areas x twice a month x 2 samples). Data are used to calculate annual indices of abundance for Pamlico Sound for the following target species: Atlantic croaker (Micropogonias undulatus), bluefish (Pomatomus saltatrix), red drum (Sciaenops ocellatus), southern flounder (Paralichthys lethostigma), spot (Leiostomus xanthurus),
• Adult spot CPUE trends decreased each from 2004 to 2007 and leveled off in 2008 (Figure 12).
• CPUE highest in 2001, lowest in 2007 and 2008 and increased slightly in 2009.
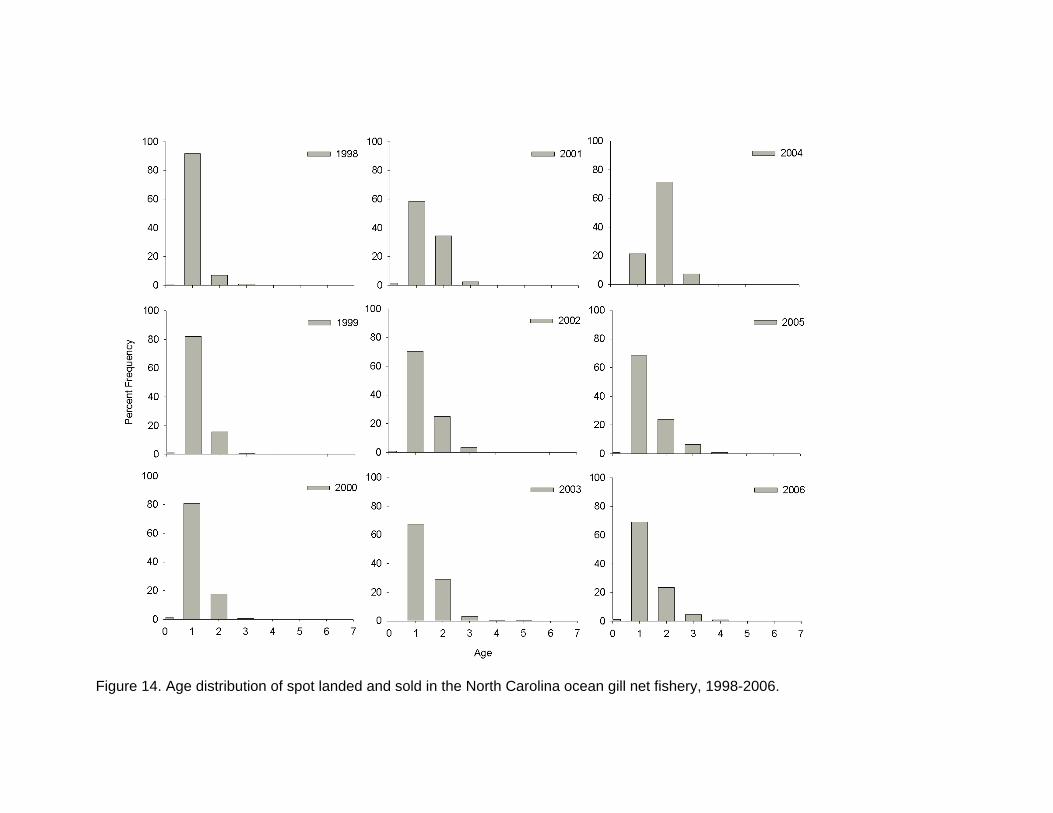
Aging Data: Data has not been completed for 2007 to 2009 and are unavailable at this time. Catch at Age for the Three Major Commercial Fisheries
• The dominant age classes in the ocean gill net, inshore gill net and the long haul fisheries are age I and age 2 (Figures 13,14 and 15).
• Very few age 0 fish are landed in these fisheries. • Proportion of older fish (3 and 4) showed little change.
Discussion Spot commercial landings in North Carolina’s major fisheries (long haul, ocean gill net and inshore gill net) have declined significantly since 2004 and commercial landings in 2008 were at historical low. Commercial landings increased in 2009 from the historical lows of 2008, but remain less than half of 2004 landings. Effort, measured by trips has increased in the ocean gill net, inshore gill net, and long haul fisheries (79.1, 17.5, and 7.1% respectively). CPUEs in the ocean gill net and inshore gill net fisheries increased in 2009 from historical lows in 2008. CPUEs in the long haul fishery decreased slightly but pounds landed increased from historical lows in 2008, due in part to increased effort. However, it must be noted that CPUEs in the long haul fishery have been the most consistent of the major fisheries over the last ten years.
Both landings and CPUEs (mean catch/angler) decreased in the recreational hook and line fishery in 2008. Preliminary data indicates the spot hook and line catch decreased 40.1% in 2008 and was 31.6% below the 15-year average. Additionally, the mean catch per angler trip also decreased in 2008, but was only 1% below the 15-year average mean hook and line catch. These data are difficult to interpret relative to the apparent scarcity of fish available to the commercial fishers. The year 2007 marked the first year that the recreational harvest exceeded the commercial harvest, 2008 saw a similar trend, but the difference was nominal. Landings and trips in the Recreational Commercial Gear License fishery also decreased in 2007 reflecting the same theme of fewer adult fish available to fishers. Juvenile abundance indices fluctuated much over the study period, a trend that is not remarkable for short-lived species such as spot. CPUEs in the Pamlico Sound Survey and the Estuarine Trawl Survey decreased in 2005 and 2006, similar to JAI dips between 1996 and 1998. However, there was an increase in 2007 and 2008 and again decreasing in 2009. The CPUE values for the Pamlico Sound adult gill net survey have trended down since the highest value in the first year of the study (2001). The CPUE value in 2007
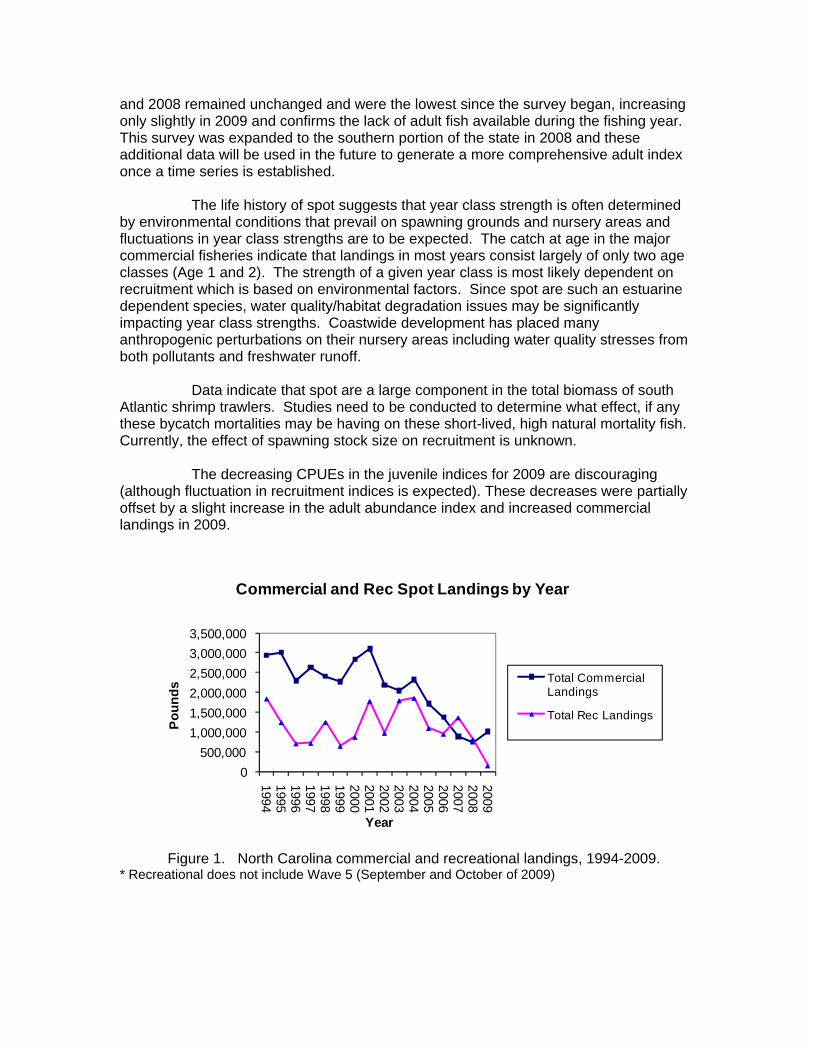
and 2008 remained unchanged and were the lowest since the survey began, increasing only slightly in 2009 and confirms the lack of adult fish available during the fishing year. This survey was expanded to the southern portion of the state in 2008 and these additional data will be used in the future to generate a more comprehensive adult index once a time series is established. The life history of spot suggests that year class strength is often determined by environmental conditions that prevail on spawning grounds and nursery areas and fluctuations in year class strengths are to be expected. The catch at age in the major commercial fisheries indicate that landings in most years consist largely of only two age classes (Age 1 and 2). The strength of a given year class is most likely dependent on recruitment which is based on environmental factors. Since spot are such an estuarine dependent species, water quality/habitat degradation issues may be significantly impacting year class strengths. Coastwide development has placed many anthropogenic perturbations on their nursery areas including water quality stresses from both pollutants and freshwater runoff. Data indicate that spot are a large component in the total biomass of south Atlantic shrimp trawlers. Studies need to be conducted to determine what effect, if any these bycatch mortalities may be having on these short-lived, high natural mortality fish. Currently, the effect of spawning stock size on recruitment is unknown. The decreasing CPUEs in the juvenile indices for 2009 are discouraging (although fluctuation in recruitment indices is expected). These decreases were partially offset by a slight increase in the adult abundance index and increased commercial landings in 2009.
Figure 1. North Carolina commercial and recreational landings, 1994-2009. * Recreational does not include Wave 5 (September and October of 2009)
Figure 9. Number of spot citations (issued for hook and line catches > 1 lb)
issued 1994-2008.
Figure 10. North Carolina Pamlico Sound Survey juvenile indices for spot 1994- 2008.
0
50
100
150
200
250
300
1994
1995
1996
1997
1998
1999
2000
2001
2002
2003
2004
2005
2006
2007
2008
2009Ye
ar
Frequency
North Carolina Spot Citations (1 lb)
0
50
100
150
200
250
0
200
400
600
800
1000
1200
1994
1995
1996
1997
1998
1999
2000
2001
2002
2003
2004
2005
2006
2007
2008
2009
Geo
met
ric
Mea
n
Arith
Mea
n
Year
Spot JAI, Pamlico Sound Survey
Arithmatic Mean
Geometric Mean
Figure 11. North Carolina Estuarine Trawl Survey juvenile indices for spot, 1994-2007.
Figure 12. North Carolina spot annual weighted CPUE from Pamlico Sound Independent Gill Net Survey, 2001-2008.
020406080100120140160
0
50
100
150
200
250
300
1994
1995
1996
1997
1998
1999
2000
2001
2002
2003
2004
2005
2006
2007
2008
2009
Geo
met
ric M
ean
Arith
Mea
n
Year
Spot JAI, Estuarine Monitoring Program
Arithmatic MeanGeometric Mean
0123456789
10
2001 2002 2003 2004 2005 2006 2007 2008 2009
CPU
E
Year
NC Spot CPUEs, Pamlico Sound, Adults
Figure 13. Age distribution of spot landed and sold in North Carolina inshore gill net fishery, 1998-2006.
Figure 14. Age distribution of spot landed and sold in the North Carolina ocean gill net fishery, 1998-2006.
Figure 15. Age distribution of spot landed and sold in the North Carolina long haul fishery, 1998-2006.
Evaluation of Spot, Leiostomus xanthurus, in South Carolina: 2009
Report to the Atlantic States Marine Fisheries Commission April 2010
Prepared By: Christopher J. McDonough Marine Resources Research Institute South Carolina Dept. of Natural Resources 217 Fort Johnson Rd Charleston, SC 29412
Introduction The Atlantic States Marine Fisheries Commission’s (ASMFC) South Atlantic Board requested that the Spot Plan Review Team (PRT) review and update available annual data relevant for Spot (Leiostomus xanthurus) as a resource. The historical fishery dependent data of commercial catch records covered the period from 1950 through 2009 (NMFS, 2010). While there was a commercial fishery for Spot in the past, there is no currently directed commercial fishery for Spot in South Carolina and the only reported landings come primarily from incidental shrimp trawl by-catch. The only current commercial fishery regulations that have jurisdiction for Spot in South Carolina is Section 50-5-1915 of the South Carolina Code, which requires for-hire boats to maintain a logbook of catch data. Section 50-5-380 of the South Carolina Code gives the SCDNR authority to require wholesale dealers and others to submit mandatory landings reports on a monthly basis. This information forms the basis for the state’s commercial landings monitoring. Additionally, Section 50-5-360 requires that anyone who buys, receives or handles any live or fresh saltwater fish or any saltwater fishery products taken or landed in the state for sale, must obtain a wholesale dealers license.
Recreational fishery catch data were obtained from the Marine Recreational Fisheries Statistics Survey (MRFSS), for the period 1981 to 2009, and from the South Carolina State Finfish Survey (SCSFS) for the period 1991 to 2009. The 2009 recreational data received from the MRFSS was preliminary because not all sampling waves were available at the time of this analysis. The State Finfish Survey is a fishery dependent program that collects catch/effort data and length measurements of selected species taken by private boat anglers in coastal and federal waters off South Carolina. There are currently no recreational fishery management regulations concerning Spot in the state jurisdictional waters of South Carolina. There are currently no South Carolina Dept. of Natural Resources (SCDNR) programs or projects specifically focused on gathering or analyzing fishery independent Spot data at this time. However, this species is a major component of three separate long-term surveys carried out by the SCDNR for different time periods between 1989 and 2009. Two of the surveys, carried out in estuarine waters, are a trammel net survey and an electroshock boat survey. The trammel net survey has been conducted since 1991 and is currently an ongoing program. It uses a stratified random sampling protocol from seven different estuaries (as strata) with individual sampling sites chosen at random within each estuarine area on a monthly basis. The trammel net program was designed to monitor important recreational finfish species over a broad geographic range. The electroshock sampling program began in 2001 and is also currently ongoing. The electroshock program also uses a monthly random stratified sampling design with six estuaries as strata. The electroshock boat survey was designed to complement and extend the trammel survey areas into the low salinity brackish and tidal freshwater portions of South Carolina’s estuaries where trammel nets cannot be set due to water depths, currents, and underwater obstacles. Many of the important recreational finfish species (including spot) utilize these low salinity areas in South Carolina’s estuaries. The third monitoring program is a near-shore trawl survey that was part of the Southeast Area Monitoring and Assessment – South Atlantic Program (SEAMAP-SA) conducted by SCDNR staff. This shallow water (15 to 30 ft) trawl survey monitors the status and trends of numerous coastal species within the South Atlantic Bight from
Cape Canaveral, FL to Cape Hatteras, NC. Multi-legged cruises are conducted in spring (early April - mid-May), summer (mid-July - early August), and fall (October - mid-November). Stations are randomly selected from a pool of stations within each stratum. The number of stations sampled in each stratum is determined by optimal allocation. A total of 102 stations are sampled each season (306 stations/year) within twenty-four shallow water strata, representing an increase from 78 stations previously sampled in those strata by the trawl survey (1989-2000). Strata are delineated by the 4 m depth contour inshore and the 10 m depth contour offshore. In previous years (1989-2000), stations were sampled in deeper strata with station depths ranging from 10 to 19 m in order to gather data on the reproductive condition of commercial penaeid shrimp. Twenty-seven stations located within ten outer strata in the southern half of the SAB were sampled in spring to collect data on spawning of white shrimp. Sixteen additional stations in the seven outer strata off North Carolina were sampled in fall to gather data on the reproductive condition of brown shrimp. No stations in the outer strata were sampled in summer. Outer strata were abandoned in 2001 in order to intensify sampling in the shallower depth-zone.
Results & Discussion
Commercial Landings
Commercial landings in South Carolina showed a substantial increase in 2009 to 22,557 lbs over 2008 landings (Table 1). While commercial landings have not been seen at this level since 1997, by historical standards spot landings were typically in the hundreds of thousands of pounds prior to the 1990s. So, while the increase in landings was a marked increase from the previous ten years, it does not necessarily represent the historical landing levels of this fishery. The majority of the landings were captured by the shrimp trawl fishery (presumably as utilized by-catch), with a small portion attributable to the gill net fishery (Table 2).
Recreational Landings
Recreational landings in 2009 decreased from 2008 levels, ending an increasing trend that had been occurring since 2003 (Fig. 1). In addition to a decrease in landings there was a decrease in the number of angler trips and, as a result, a corresponding drop in recreational catch to the lowest level seen in the time series since it began in 1981 (Fig. 2). The only other year with a catch that was comparable occurred in 1990. However, since the 2009 data was preliminary and only sampling waves 1-4 were available at the time of this analysis, the recreational data is subject to re-interpretation when the full data set becomes available. Historically, the majority of South Carolina’s harvest (A + B1) and total catch (A + B1 + B2) occurs in the fall during waves 5 & 6, so this number will have to be revised when the new data become available.
The South Carolina state finfish survey (SFS) reported a total of 5,878 spot caught from the following sources: creel census reported 4,957 spot kept (harvest) and 286 released, and the charter vessel landings reported 635 spot kept. Of the spot that were kept, 678 were measured by the creel census clerks for a mean total length of 233 mm and a range of 180-323 mm.
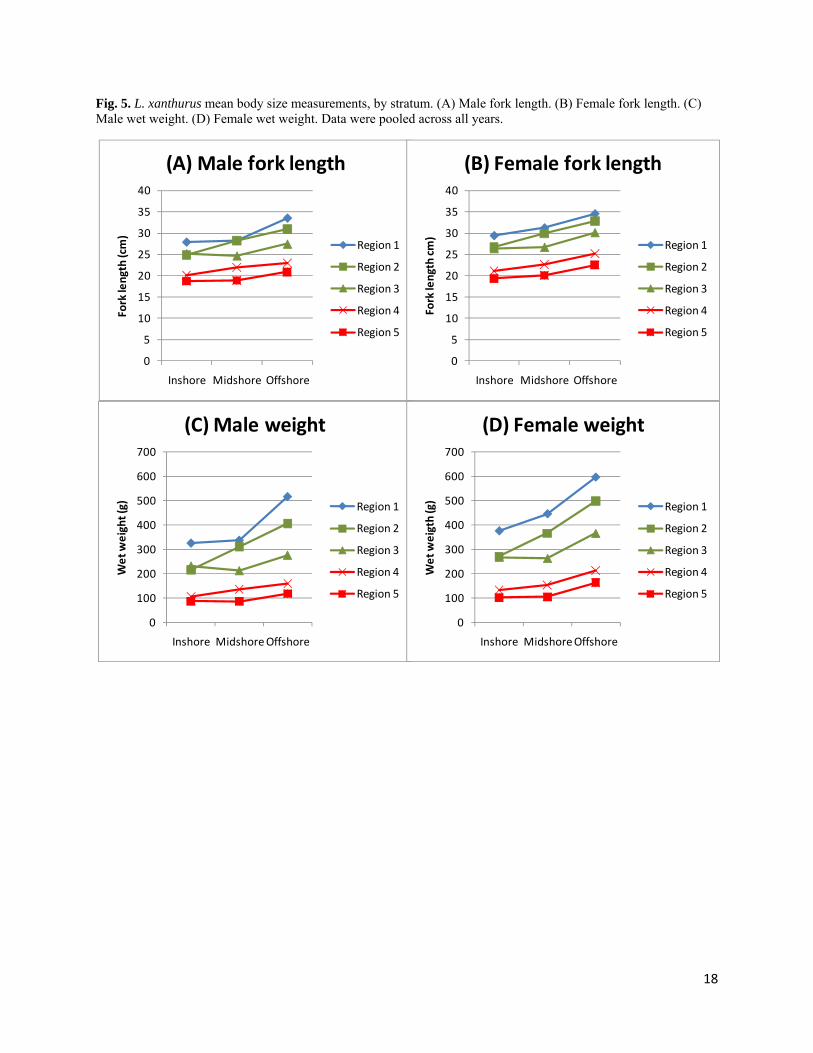
Trammel Net Survey There were 2,990 Spot captured in the trammel net survey 2009. Total length (LT) ranged from 145 to 345 mm with an overall mean of 206.9 ± 13.6 mm. Specimens were collected every month of the year. The majority of specimens seen (84.7%) occurred in the 190-220 mm range (Fig. 3), which was a function of gear selectivity due to mesh size. Spot generally recruited to the trammel gear at 180 mm LT, so there was a limited number of specimens caught below this size. Monthly size frequency distributions were similar across all months during all years. Beginning in 2009, preliminary age, sex, and maturity data were collected from the trammel net survey. There were 183 sex determinations, with 64 males and 119 females, which resulted in an approximate 2:1 female to male sex ratio. The majority of specimens was either immature (42.9%), or mature but reproductively inactive (30.9%), with remaining specimens undergoing reproductive development (22.1%) and only 7 specimens (4.1%) (all males) reproductively active. Ages ranged from 0 to 2 years, with most of the specimens (96.2%) being age 0 or 1. It must be noted that these data are very preliminary and only represent a limited time period, and at this time should not be taken as characteristic of the estuarine spot population in South Carolina. Electroshock Survey The electroshock survey captured 1,570 Spot in 2009. Spot were collected every month of the year throughout the entire time period. Sizes ranged from 27 to 230 mm LT (Fig. 4) with a mean size of 96.8 ± 30.4 mm LT. The majority of electroshock samples (78.7%) were young-of-the-year juveniles (≤ 120 mm LT). The presence of the smaller juveniles was a function of the ability of the electroshock boat to capture all size classes (compared to the trammel net) and the greater utilization of low salinity zones of the estuary by juvenile Spot. There were only 13 specimens greater than 180 mm LT captured by the electroshock boat. Monthly size frequency distributions were variable and indicated that the bulk of recruitment for juvenile Spot occurred from January through April. As with the trammel net survey, preliminary collections of specimens were made for age, sex, and maturity data in 2009. However, due to the small sizes of spot generally seen in the electroshock survey, all of the specimens were sexually immature with only 10 identified males and 22 identifiable females. All spot collected with the electroshock boat were considered age zero due to their small size. SEAMAP Survey The SEAMAP survey captured 70,596 Spot in 2009. Fork lengths ranged from 70 to 230 mm LF with a mean of 145.6 ± 2.83 mm LF. While the size distributions were similar between states (Fig. 5), Florida had a significantly larger mean LF (162.6 ± 2.32 mm, p<0.001), with North Carolina having the smallest mean LF (146.8 ± 2.99 mm) and both South Carolina and Georgia not varying significantly from the overall mean (SC: p = 0.356, GA: p = 0.085). North and South Carolina had approximately the same number of fish (25,928 and 25,852 respectively) and significantly more than either Florida (16,133) or Georgia (2,683). Although small juveniles (< 110 mm LF) were seen in the SEAMAP trawls, these specimens represented a small fraction (2.9%) of the overall samples in 2009. Although, since juvenile Spot live primarily in estuarine
environments they would be less likely to be caught in offshore habitats sampled during the SEAMAP cruises. There were no spot taken for age, sex, and maturity samples in 2009.
Catch Indices
Catch indices from the three fishery independent surveys provided proxies for annual abundance. The trammel net and SEAMAP surveys captured both a larger size range of specimens (≥ 170 mm LT for the trammel surveys, ≥ 150 mm LF for SEAMAP) and fewer juvenile fish than the electroshock efforts, and so both of these served as adult abundance indices. The electroshock survey captured mainly juvenile Spot (25-120 mm LT) and was used for the juvenile abundance index. All three surveys used randomly stratified sampling over varying geographic areas and encompassed a range of habitat types from tidal freshwater to coastal marine zones. Although the time periods varied between the surveys, all three occurred over long enough time scales to encompass a wide range of shifting environmental conditions under relatively stable sampling protocols that could illustrate changing population trends for Spot in South Carolina.
Mean annual CPUE in the trammel net survey for 2009 increased slightly (3.74) from 2008 staying well within the 0.81 to 5.47 range for all years (Table 3). The CPUE for 2009 did stay above the long term mean (2.60), the first time two years in a row have been above the long term mean since 2001-2003. Peak catches occurred in 1994 and 1999 with catches exceeding the long term mean in 8 of the 19 years. Overall the CPUE trend continues the increasing trend that began in 2001 (Fig. 6). In contrast, the mean annual CPUE in the electrofishing survey decreased in 2009 (6.8 spot per set) by more than half from 2007-2008 to almost the same level as 2006 (Table 3). Overall the mean annual CPUE has demonstrated a high degree of year to year variability for the entire time series (Fig. 7). The mean annual CPUE for the SEAMAP data ranged from 79.8 to 599.4 Spot per trawl with a long term mean of 240.2 ± 12.1 spot per trawl (Table 3). Since the SEAMAP program sampled along the entire southeastern coast (NC to FL), CPUE was examined for each state as well as all areas combined. CPUE off South Carolina tracked fairly well with the long-term trends for the overall CPUE, with the minimum CPUE for both South Carolina and the entire data set occurring in 1999. However, the years of the maximum annual CPUE differed in that South Carolina had its highest annual CPUE in 1990 (680.2 spot per trawl) where the maximum for the entire data set occurred in 1991. The mean annual CPUE in South Carolina did increase by over 300% from 2008 to 2009 (Table 3), but such year to year variability was not uncommon. North Carolina and Florida had the greatest year-to-year variability in CPUE and Georgia had the lowest overall CPUE over the entire 20 year time period (Fig. 8).
Table 1. Commercial landings for spot in South Carolina and Table 2. Commercial landings by gear type for spot in the south Atlantic from 1951 to 2009. N/A = not available from 1951 to 2009.
Table 3. South Carolina Spot CPUE indices (number of Spot per set) for fishery independent surveys from 1989 to 2008. All CPUE values are stratified mean annual CPUE based on randomly stratified sampling protocols.
Year
1980 1985 1990 1995 2000 2005 2010
Num
ber o
f Spo
t per
Trip
0
2
4
6
8
10
12
14
16
18
20
40
50Harvest (A + B1)Catch (A + B1 + B2)
Figure 1. Annual recreational landings for spot in South Carolina from the Marine Recreational Fisheries Statistics Survey (MRFSS) from the National Marine Fisheries Service. Landings are given for harvest (A = landings brought back, B1= spot kept) and total catch (A + B1 + B2 = fish released).
Figure 2. Total landings (A + B1 + B2) for spot in South Carolina from 1981 to 2009. Data from the Marine Recrational Fisheries Statistics Survey (NMFS).
Year
1980 1985 1990 1995 2000 2005 2010
Spot
Cat
ch (A
+ B
1 +
B2)
in lb
s
0
500000
1000000
1500000
2000000
2500000
3000000
3500000
Trammel Net Surveyn = 2990
Total Length (cm)
0 5 10 15 20 25 30 35
Perc
ent F
requ
ency
0
5
10
15
20
25
30
35
Figure 3. Length frequency distribution of Spot in South Carolina in 1 cm length bins from fishery independent trammel net survey in 2009.
Figure 4. Length frequency distribution of Spot in South Carolina in 1 cm length bins from fishery independent electroshock boat survey in 2009.
Electroshock Surveyn = 1570
Total Length (cm)
0 5 10 15 20 25 30 35
Perc
ent F
requ
ency
0
2
4
6
8
10
12
14
Figure 5. Length frequency distribution of spot from SEAMAP survey in 2009 using 1 cm length bins.
SEAMAPn = 70,596
Fork Length (cm)
0 5 10 15 20 25 30 35
Perc
ent F
requ
ency
0
5
10
15
20
25
30
Figure 6. Length frequency distribution of spot by state from the SEAMAPsurvey in 2009 using 1 cm length bins.
Fork Length (cm)
6 8 10 12 14 16 18 20 22 24
Perc
ent F
requ
ency
0
10
20
30
40
North CarolinaSouth CarolinaGeorgiaFlorida
Figure 7. Mean annual catch per unit effort of spot from South Carolina trammel net survey 1991 to 2009. LTM = long term mean.
Figure 8. Mean annual catch per unit effort of spot from South Carolina electroshock boat survey 2001 to 2009. LTM = long term mean.
The Woods Hole Laboratory of the National Marine Fisheries Service (NMFS) has performed a randomly stratified groundfish survey along the U.S. east coast since 1972. To date, these survey data have not been examined by the Spot Plan Review Team, although they are a valuable source of information because Leiostomus xanthurus is one of the main species caught throughout much of the survey area.
The purpose of this report is to provide a general overview of the L. xanthurus catch and life history information from the NMFS groundfish survey.
METHODS
NMFS trawl survey and database
Since 1972, the NMFS groundfish survey has conducted a biannual, fishery-independent trawl survey along the U.S. east coast, with cruises occurring during spring and fall (Grosslein, 1969; Azarovitz 1981; Azarovitz 1994). NMFS divide the coastal shelf into numerous strata that extend as far as Cape Hatteras NC in the south (Fig. 1). Within each stratum, ~30 minute tows are performed at stations selected at random from a 1 nm2 grid. A #36-Yankee otter trawl is used, rigged with rollers, 5 fathom legs and a 1000 pound polyvalent door. The cod end and upper belly of the net are lined with 0.5-inch mesh to retain young-of-year fish. The NMFS database parameters that are recorded at each station are shown in Table 1.
In this report, we have only analyzed fall trawl data that were collected between Long Island NY and Cape Hatteras NC. L. xanthurus was more prevalent during fall, and very rare in strata further north.
Pooling of strata
Sampling frequency varied among years and NMFS strata, making it necessary to pool data across strata in order to generate comparable, non-biased metrics of abundance across years. This was achieved according to the procedures outlined in Fig. 1, which resulted in 15 pooled strata arranged into five latitudinally separated regions (Region 1 = most northerly, Region 5 = most southerly), each comprising an inshore, midshore and offshore section. These pooled strata were denoted 1Near, 1Mid, 1Off .... 5Off.
Data from only the midshore and offshore strata were used for calculating catch per unit effort (10 strata in total) because the inshore strata were sampled infrequently. Data from all 15 strata were used for examining life history parameters.
3
Catch per unit effort (CPUE)
For calculating CPUE, only tows with a NMFS “SHG” code < 125 were included (i.e. random tows of 26-34 minutes duration that did not experience gear problems), and only the midshore and offshore strata were used.
The number of tows that was analyzed for CPUE, by year and stratum, is shown in Table 2. Note, however, that there were temporal changes in the vessels used, and also a temporal shift in the time of year that tows were made over the duration of the survey (Table 3). The effects of these two methodology changes are difficult to elucidate because of the lack of overlap between contrasting survey methods. This leaves some potential for temporal bias in the CPUE time series.
The geographical area (nm2) that was available for sampling within each stratum, and summary information of the depth of tows that occurred within them, are shown in Table 4. Mean tow depths increase from inshore to offshore. They also varied slightly from year to year in each stratum, but without any long-term trends (Fig. 2).
Annual stratified mean CPUE values for L. xanthurus were calculated based on methods described by Krebs (1998). For this, the arithmetic mean CPUE in each stratum was initially calculated as:
,∑ , ,
,
,
where is the mean CPUE in stratum h during year a; , , is the number of spot caught in tow t within stratum h during year a; and , is the total number of tows made within stratum h during year a.
The stratified mean CPUE was calculated as:
∑ ,
where is the stratified mean CPUE (i.e. coastwide); is the area available for sampling in stratum h (Table 4); and is the total area of all strata (i.e. ∑ , where stratum 1 through 10 represents the strata: 1Mid, 1Off, 2Mid........5Off).
4
The variance of the stratified mean during year a was calculated as:
,
,
where is the weighting factor of each stratum ( ; see Table 4). The standard error of the stratified mean was calculated as the square root of the variance.
Body size, sex and maturity
From 1997 onwards, fork length (LF, nearest centimeter), total wet weight (W, nearest gram), sex (immature, male, female) and gonad development stage (gross visual assessment) were recorded from sub-samples of some of the catches, but unfortunately no hard structures (otoliths or scales) were taken for age determination.
Gonads stages included: immature, developing, eyed (females), ripe, ripe and running (males), spent, resting and unknown. A fish was considered mature unless it was staged as ‘immature’ or ‘unknown’.
Biological data were analyzed to determine size-frequency distributions, weight-length relationships and size at maturity. The number of specimens examined by year and stratum is shown in Table 5.
RESULTS
Catch per unit effort
In general, both the proportion of tows that caught L. xanthurus (i.e. catches > 0) and mean CPUE of L. xanthurus increased from north to south, and decreased from midshore to offshore (Table 6).
Coastal-wide, annual stratified mean CPUE values are shown in Table 7 and Fig. 3. The long-term mean CPUE was 204.8 L. xanthurus per tow, with four main phases of fluction: (i) CPUE increased and then peaked during the 1970s and early 1980s before declining sharply in 1982 (ii) CPUE increased until 1989 and then declined until 1993 (ii) CPUE remained low throughout most of the 1990s, (iv) After 2001, CPUE generally increased to levels near or above the long-term mean.
5
There was no obvious relationship between variation in CPUE (Fig. 3) and changes in sampling protocol (survey month or survey vessel; Table 3), suggesting that the effects of sampling protocol were probably minor.
Body size, sex and maturity
Body size
In general, the mean body size of L. xanthurus increased from inshore to offshore, and from Region 5 (low latitude) to Region 1 (high latitude) (Fig. 4). For example, during 2006 (when LF and W were measured in all strata), both LF and W differed significantly among strata (1-way ANOVA, p < 0.0001). At one extreme, stratum 1Off had significantly longer and heavier fish than all other strata, whereas at the other extreme, stratum 5Near had significantly shorter and lighter fish than all of the strata in Region 1, and the mid- and offshore strata in Regions 2 and 3 (Tukeys tests, p ≤ 0.0001).
Females were also larger than males. For example, in 2006, both sex and its interaction with stratum were significant when these terms were added to ANOVA models described above for LF and W. Similarly, they were significant when data from all years combined were analyzed (Fig. 5).
Weight-length relationships
Analyses of relationships between total wet weight (W) and body length (LF) revealed no significant differences between males and females (p > 0.50). However, significant effects of year and strata were detected. For example, both the slope (a) and intercept (b) of the relationship log10W = a.log10LF + b differed significantly among years (p < 0.008) when tested using 1997-2008 data from stratum 5Mid, which had measures taken in each year. In addition, both of these regression parameters differed significantly among strata (p < 0.00001) when tested using just the 2006 data (when measures were available from all strata).
Although the effects of stratum and year were significant, the magnitude of their effects was relatively minor when compared against the relationship fitted to the dataset pooled across all years and strata (Fig. 6).
Size at maturity
Size at maturity was analyzed by region (Regions 1-5). Preliminary analysis revealed significant differences in size at maturity between males and females, and among regions (logistic regression with LF as a covariate, sex and region entered as factors; p < 0.0001 for sex
6
and region). Logistic regressions run on data separated by sex and region revealed two general patterns: (i) males matured at a smaller LF that females, and (ii) low latitude fish matured at a smaller LF than high latitude fish (Fig. 7). The effects of year have not been analyzed in detail.
REFERENCES
Azarovitz, T.R. 1994. Northeast Fisheries Science Center Bottom Trawl Surveys. In Proceedings of the workshop on the collection and use of trawl survey data for fisheries management. P. 4-7. ASMFC Special Rept. No. 35
Grosslein, M.D. 1969. Groundfish survey program of BCF Woods Hole. Commercial Fisheries Rev. 31 (8-9): 22-35.
Table 1. Database parameters within the NMFS groundfish survey
Variable Columns Definition Cruise code 1-4 First two digits are the year; second two digits sequentially
assigned to indicate the order in which the cruise were coded Station 5-8 Sequential station number Stratum 9-13 Strata identification numbers Tow number 14-16 Number of tow within a given stratum Station value 17 Station type – [1] survey haul; [2] non-random haul; [3]
special random add-on station haul [4] comparison haul; [5] no trawl – other gear; [6] site=specific; [7] systematic grid; [8] depletion site; [9] systematic parallel tracts; [0] systematic zigzag transects.
18 Relative success of haul [1] good tow – no gear or tow duration problems; [2] representative but with some problems due to gear or tow time; [3] problem tow – may or may not be representative due to gear or tow time; [4] not representative due to gear or time; [5] no trawl tow – other gear used
19 Gear condition – [1] no damage to insignificant damage; [2] Twisted wing small tears in belly; [3] hang with no to minor damage; [4] parted legs, sweep or headrope; [5] tear-up. But not total; [6] obstruction in net; [7] crossed doors; [8] open gear; [9] hang with major damage
Statistical area 20-22 International statistical area where tow made Vessel 23-24 AL = Albatross IV; AT = Atlantic Twin; DE = Delaware II Cruise 25-26 Assigned vessel cruise number Time 27 [1] = Eastern standard time; [2] = eastern daylight savings
Time Yr-mo-day 28-33 First two = year; second two = month; last two = day Gear code 34-35 Type of gear used (numerous code values) Time 36-39 Local time with 24-hour clock Minutes out 40-42 Actual time for gear out to with tenths of minutes Depth start/end 43-50 First four digits = start depth; last four digits = end depth Min/max 51-58 First four digits = minimum depth; second four digits =
maximum depth
Lat/long 59-66 Replace by GPS reading in 1999; prior to that, first four digits = beginning latitude last four digits beginning longitude; both rounded to whole minutes
Loran 67-98 Loran readings Cable 99-102 Cable in water measured in meters at the water’s surface Pitch 103-105 Pitch of prop if applicable Heading 106-108 Vessel’s heading in degrees Course 109-111 Actual course the vessel made good in degrees Rpm 112-114 Average shaft rpm under tow Doppler bottom 115-117 Speed over bottom Doppler water 118-120 Used on special occasions Des speed 121-122 Designated towing speed for a particular gear to 0.1 knots Gear- id 123-124 Gear -id number (each net has it’s own number) Door -id 125-126 Door id number Head-rope height 127-129 Not used leave blank Other gear 130-131 Code for other gear (hydro, plankton, etc) Air temp 134-136 Air temp to nearest whole degree Cloud cover 137-138 Code for cloud cover
8
Table 1 continued Variable Columns Definition Insol 139-142 Not used – blank Bar 143-146 Barometric pressure to nearest millibar Wind dir & speed 147-151 Wind direction in degrees; wind velocity in knots Weather 152-153 Weather codes Wave height 154-155 Height of waves to nearest tenth of meter Swell direction & hgt 156-160 First three digits swell direction in degrees, second two digits
= swell height in tenths of meters Surf temp 161-163 Surface temp in tenths of degrees C Surf salinity 164-167 Salinity parts per 1000 Wingspread 168-171 Not used – blank Sal depth 172-175 Not used leave blank Xbt 176 Type of temperature profiler used Surf & bot temp 177-182 First three digits = surface degrees c to tenths; second three
digits = bottom from xbt or ctd Coded species 183-184 Number of species caught and coded at station Trash 185-188 Amount of trash in liters Fullness of dredge 189-191 Not used leave blank Sed type 192-194 Not used leave blank Trash by % 195-203 Not used leave blank Ave depth 203-207 Average depth in meters between start and end of tow Calc speed 208-210 Calculated speed of tow derived from navigational
instruments Surf sal 214-218 Surface salinity (0.001) Bot sal 219-223 Bottom salinity (0.001) Total weight 224-229 Total weight of species to 0.1 kg Total number 230-235 Total number of animals at station
9
Table 2. Number of tows analyzed for CPUE, by year and stratum.
Total: 996 148 545 1689 1206 370 109 4 1689 Vessel names: AL = Albatross; AT = ; DE = Delaware; AT = Atlantic Twin.
11
Table 4. Geographical area and depth of each stratum. is the area available for sampling in each stratum (square nautical miles). is the weighting applied to each stratum (based on relative area) for calculating stratified mean CPUE parameters. is the total number of tows of tows that were analyzed across all years (1972-2008). Depth values (meters) and are summary statistics of the depths at which tows were made.
Stratum (h) Mean Min Max 1Near* (66) ‐ (63) 11.5 6 17
1Mid 150 0.034 155 16.0 9 30
1Off 348 0.080 160 23.3 17 31
2Near* (119) ‐ (61) 10.7 6 21
2Mid 370 0.085 156 14.8 9 21
2Off 523 0.120 150 20.6 10 30
3Near* (88) ‐ (82) 12.1 7 34
3Mid 392 0.090 156 15.3 9 35
3Off 339 0.078 147 19.5 11 29
4Near* (167) ‐ (66) 10.1 6 14
4Mid 466 0.107 157 15.1 9 23
4Off 194 0.045 145 20.5 12 28
5Near* (194) ‐ (119) 11.2 7 22
5Mid 660 0.152 231 16.5 8 29
5Off 911 0.209 232 22.5 10 37
Total: 4353* 1.0* 1689*
* Nearshore strata were not used for calculating CPUE. They are excluded from the ‘Total’ row shown here.
12
Table 5. Number of specimens from which fork length (LF), wet weight (W), sex and gonad development stage were recorded, by year and pooled stratum. None of these parameters was recorded prior to 1997.
Table 6. Proportion of tows that caught L. xanthurus (i.e. catches > 0) and mean CPUE of L. xanthurus, by year and stratum (see Fig 1 for stratum locations).
Details of NMFS strata numbering (circles) and pooling procedures used to create larger strata for analyzing the spot catch data. Note that along each section of the coast, there is a triplet of NMFS strata comprising a nearshore (e.g. 12), midshore (e.g. 13) and offshore stratum (e.g. 14). Data from NMFS strata <12 and > 44 were omitted due to most years having either missing data, very low tow numbers, or very low spot catches. Across the remaining survey area, groups of neighboring north/south NMFS strata were pooled to provide sampling coverage that was sufficient to allow the calculation of stratified mean CPUE values or biological parameters. Pooling was performed as follows: Pooled strata NMFS strata 1Near* Nearshore, 12+15 1Mid Midshore, 13+16 1Off Offshore, 14+17 2Near* Nearshore, 18+21 2Mid Midshore, 19+22 2Off Offshore, 20+23 3Near* Nearshore, 24+27 3Mid Midshore, 25+28 3Off Offshore, 26+29 4Near* Nearshore, 30+33 4Mid Midshore, 31+34 4Off Offshore, 32+35 5Near* Nearshore, 36+39+42 5Mid Midshore, 37+40+43 5Off Offshore, 38+41+44
* Not used for CPUE calculations due to insufficient data
Region 1
Region 2
Region 3
Region 4
Region 5
16
Fig. 2. Mean tow depth, by year and stratum.
Fig. 3. Stratified arithmetic mean CPUE (±SE) of spot in the NMFS groundfish survey.
0.0
5.0
10.0
15.0
20.0
25.0
30.0
1972
1974
1976
1978
1980
1982
1984
1986
1988
1990
1992
1994
1996
1998
2000
2002
2004
2006
2008
Mean tow depth (m
)
Year
1Mid
1Off
2Mid
2Off
3Mid
3Off
4Mid
4Off
5Mid
5Off
0
100
200
300
400
500
600
700
800
1970 1975 1980 1985 1990 1995 2000 2005 2010
Mean CP
UE
Year
17
Fig. 4. Length-frequency distribution, by stratum, for L. xanthurus caught in the NMFS groundfish survey. Data have been pooled across sampling years. Vertical grid lines show the 20, 30 and 40 cm fork length (LF) bins. Y-axis units are percent.
North
South
Inshore Offshore
18
Fig. 5. L. xanthurus mean body size measurements, by stratum. (A) Male fork length. (B) Female fork length. (C) Male wet weight. (D) Female wet weight. Data were pooled across all years.
0
5
10
15
20
25
30
35
40
Inshore Midshore Offshore
Fork length (cm)
(A) Male fork length
Region 1
Region 2
Region 3
Region 4
Region 5
0
5
10
15
20
25
30
35
40
Inshore Midshore Offshore
Fork length cm)
(B) Female fork length
Region 1
Region 2
Region 3
Region 4
Region 5
0
100
200
300
400
500
600
700
Inshore MidshoreOffshore
Wet weight (g)
(C) Male weight
Region 1
Region 2
Region 3
Region 4
Region 5
0
100
200
300
400
500
600
700
Inshore MidshoreOffshore
Wet weigth (g)
(D) Female weight
Region 1
Region 2
Region 3
Region 4
Region 5
19
Fig. 6. Weight-length relationship for L. xanthurus. The gray plus symbols show the entire dataset (all strata and years), which was used for fitting the line. The superimposed red pluses (3Off) and blue squares (1Off) show the strata with the most negative and most positive residuals from the model, respectively.
y = 0.0085x3.1142
R² = 0.9854
0
200
400
600
800
1000
1200
1400
1600
0 10 20 30 40 50
Total w
et weight (g)
Fork length (cm)
20
Fig. 7. Logistic regressions fits showing the proportion of L. xanthurus that were sexually mature with respect to fork length, by latitudinal region, in (A) males, and (B) females. Fork length at which 50% maturity occurred (as estimated by the logistic fits) is shown in parentheses. (Note: Region 1 is most north; Region 5 is most south).
0.0
0.5
1.0
10 15 20 25 30
Prop
ortion
mature
Fork Length (cm)
(A) Male Leiostomus xanthurus
Region 1 (19.8 cm)
Region 2 (18.3 cm)
Region 3 (18.0 cm)
Region 4 (15.9 cm)
Region 5 (16.0 cm)
0.0
0.5
1.0
10 15 20 25 30
Prop
ortion
mature
Fork Length (cm)
(B) Female Leiostomus xanthurus
Region 1 (21.3 cm)
Region 2 (20.6 cm)
Region 3 (19.9 cm)
Region 4 (17.7 cm)
Region 5 (17.0 cm)
Spot Relative Abundance Indices Provided by the New Jersey Division of Fish and Wildlife
Data provided by Heather Corbett Aggregate indices of spot abundance are available from three NJ DFW surveys. The Delaware River Recruitment Survey, a seine survey utilizing a bagged, 100-foot long by 6-foot deep by ¼-inch mesh beach seine, has been conducted for striped bass young-of-year since 1980. The survey consists of seining 32 stations twice a month from August through October. Both juvenile and adult spot are caught. For spot, the CPUE is calculated for the lower 24 stations within the Delaware River. The Ocean Trawl Survey, consisting of five nearshore (within 12 nautical miles) surveys, has been conducted each year since 1989. These surveys occur in January/February, April, June, August, and October. The gear used is a two-seam trawl with a 25 m headrope and 0.25” bar mesh codend liner. All species taken during these surveys are weighed and measured. Catch per unit effort in number of fish per tow is calculated for each year. Both juvenile and adult spot are caught. Indices of abundance for spot were calculated for the August and October trawls only, when spot recruit to the gear and abundance is most consistent. The Delaware Bay Trawl Survey has been conducted since 1991. A 16 foot otter trawl is used at eleven nearshore fixed stations from April to November. Both juvenile and adult spot are caught, and an aggregate relative index of abundance is generated.
0.0
1.0
2.0
3.0
4.0
5.0
6.0
7.0
8.0
0
1
2
3
4
5
6
7
8
1980
1982
1984
1986
1988
1990
1992
1994
1996
1998
2000
2002
2004
2006
2008
Traw
l Surveys CPU
E (G
M)
Sein
e Su
rvye
CPU
E (G
M)
Delaware River Seine
Ocean Trawl
Delaware Bay Trawl
NJ Spot Indices - Geometric Means
Ocean Trawl Delaware River Seine Delaware Bay Trawl
Spot Relative Abundance Indices Provided by the Delaware Division of Fish and Wildlife
Data provided by Stewart Michels Three indices, two young-of-year and one age-aggregated, are available for spot on Delaware: 1) An annual young-of-the-year index, expressed as the geometric mean catch per tow, for spot collected during
16-foot trawl sampling in the Delaware Estuary. 2) Annual young-of-the-year index values, expressed as geometric mean catch per tow, for various species
collected during 16-foot trawl sampling in Delaware's Inland Bays 3) Spot relative abundance (No./Naut. Mile) from 30-foot trawl sampling in the Delaware Bay