Biomaterials 28 (2007) 2380–2392 Review SPR microscopy and its applications to high-throughput analyses of biomolecular binding events and their kinetics Charles T. Campbell a, , Gibum Kim b a Department of Chemistry, University of Washington, Seattle, Washington 98195-1700, USA b Lumera Corporation, 19910 N, Creek Pkwy, suite 100, Bothell, WA 98011, USA Received 23 August 2006; accepted 31 January 2007 Abstract Surface plasmon resonance (SPR) sensing has long been used to study biomolecular binding events and their kinetics in a label-free way. This approach has recently been extended to SPR microscopy, which is an ideal tool for probing large microarrays of biomolecules for their binding interactions with various partners and the kinetics of such binding. Commercial SPR microscopes now make it possible to simultaneously monitor binding kinetics on 41300 spots within a protein microarray with a detection limit of 0.3 ng/cm 2 , or o50 fg per spot (o1 million protein molecules) with a time resolution of 1 s, and spot-to-spot reproducibility within a few percent. Such instruments should be capable of high-throughput kinetic studies of the binding of small (200 Da) ligands onto large protein microarrays. The method is label free and uses orders of magnitude less of the precious biomolecules than standard SPR sensing. It also gives the absolute bound amount and binding stoichiometry. r 2007 Elsevier Ltd. All rights reserved. Keywords: Surface plasmon resonance microscopy; Surface plasmon resonance imaging; Bioaffinity; Kinetics; Protein arrays; DNA arrays Contents 1. Introduction .............................................................................. 2380 2. Surface plasmon resonance (SPR) spectroscopy ..................................................... 2382 3. Quantitative SPR spectroscopy: absolute surface concentrations ......................................... 2382 4. SPR microscopy (SPRM) or ‘‘SPR imaging’’ (SPRI) ................................................. 2384 5. Quantitative SPR microscopy: absolute surface concentrations with spatial resolution .......................... 2385 6. Example applications ........................................................................ 2385 Acknowledgements ......................................................................... 2390 References ............................................................................... 2390 1. Introduction Surface plasmon resonance (SPR) spectroscopy is a popular surface analysis method based on changes in the optical reflectivity of a thin metal film (typically gold) when species adsorb or bind to its surface or to any material coated onto its surface. Specifically, it detects with high sensitivity (o10 6 ) and fast time resolution (1 s) changes in refractive index of any surface coating or solution near the SPR-active metal surface [1–13]. By ‘‘SPR spectro- scopy’’, we refer here to measurements of reflectivity both versus wavelength at fixed angle and versus angle at fixed wavelength (also called SPR reflectometry). Functionalization ARTICLE IN PRESS www.elsevier.com/locate/biomaterials 0142-9612/$ - see front matter r 2007 Elsevier Ltd. All rights reserved. doi:10.1016/j.biomaterials.2007.01.047 Corresponding author. Tel.: +1 206 616 6085; fax: +1 206 616 6250. E-mail address: [email protected] (C.T. Campbell).
Transcript
ARTICLE IN PRESS
0142-9612/$ - se
doi:10.1016/j.bi
�CorrespondE-mail addr
Biomaterials 28 (2007) 2380–2392
www.elsevier.com/locate/biomaterials
Review
SPR microscopy and its applications to high-throughput analyses ofbiomolecular binding events and their kinetics
Charles T. Campbella,�, Gibum Kimb
aDepartment of Chemistry, University of Washington, Seattle, Washington 98195-1700, USAbLumera Corporation, 19910 N, Creek Pkwy, suite 100, Bothell, WA 98011, USA
Received 23 August 2006; accepted 31 January 2007
Abstract
Surface plasmon resonance (SPR) sensing has long been used to study biomolecular binding events and their kinetics in a label-free
way. This approach has recently been extended to SPR microscopy, which is an ideal tool for probing large microarrays of biomolecules
for their binding interactions with various partners and the kinetics of such binding. Commercial SPR microscopes now make it possible
to simultaneously monitor binding kinetics on 41300 spots within a protein microarray with a detection limit of �0.3 ng/cm2, or o50 fg
per spot (o1 million protein molecules) with a time resolution of 1 s, and spot-to-spot reproducibility within a few percent. Such
instruments should be capable of high-throughput kinetic studies of the binding of small (�200Da) ligands onto large protein
microarrays. The method is label free and uses orders of magnitude less of the precious biomolecules than standard SPR sensing. It also
gives the absolute bound amount and binding stoichiometry.
r 2007 Elsevier Ltd. All rights reserved.
Keywords: Surface plasmon resonance microscopy; Surface plasmon resonance imaging; Bioaffinity; Kinetics; Protein arrays; DNA arrays
Surface plasmon resonance (SPR) spectroscopy is apopular surface analysis method based on changes in theoptical reflectivity of a thin metal film (typically gold) when
e front matter r 2007 Elsevier Ltd. All rights reserved.
species adsorb or bind to its surface or to any materialcoated onto its surface. Specifically, it detects with highsensitivity (o10�6) and fast time resolution (�1 s) changesin refractive index of any surface coating or solution nearthe SPR-active metal surface [1–13]. By ‘‘SPR spectro-scopy’’, we refer here to measurements of reflectivity bothversus wavelength at fixed angle and versus angle at fixedwavelength (also called SPR reflectometry). Functionalization
ARTICLE IN PRESSC.T. Campbell, G. Kim / Biomaterials 28 (2007) 2380–2392 2381
of the metal surface with specific binding sites withbioaffinity creates a biosensor that can detect biomolecularinteractions in real time with no labeling requirements.Therefore, SPR spectroscopy has become a commontool in biochemistry and bioanalytical chemistry, especiallyfor determining the on- and off-rates and equilibriumbinding constants which describe the interactions betweenproteins, DNAs or RNAs and a wide variety of otherbiomolecules or ligands, or for investigating the effectsof various cofactors or inhibitors on these bindingconstants. Many commercial instruments are availablefor these applications, the most common of which isthe Biacore system [14–30]. Our group has studied thekinetics of protein–ligand, protein–dsDNA and protein–vesicle interactions using a home-built SPR spectrometer[8–11].
More recently, SPR microscopy (SPRM), also referredto as ‘‘SPR imaging’’ (SPRI), has started to be used for thesame types of measurements, but with high spatialresolution. Since the measurements are done simulta-neously over the entire area radiated by the light orimaged onto the detector array (typically a charge-coupleddevice (CCD) array), combining SPRM with patternedmicroarrays of biomolecules allows for very high through-put analyses of biomolecular binding. Thus, SPRM hasbeen used to measure the binding of DNAs and RNAs toDNA arrays, of DNA-binding proteins to dsDNA arrays,of proteins to protein and peptide arrays, and even of smallligands to protein arrays. Just like SPR spectroscopy,SPRM can be used for determining the on- and off-ratesand equilibrium binding constants of all these types ofinteractions, only now in high throughput (41000 inter-actions simultaneously). Since the amount of biomaterialneeded to make one 100 mm spot on an SPR active surfaceis tiny, and since the same solution can be used to monitor41000 spots simultaneously, this provides not only a hugesavings in time, but also a tremendous cost savings for theprecious biomolecules used for these assays. More im-portantly, since the buffer and temperature and many other
Table 1
Advantages of SPRM for high-throughput bioaffinity assays
� Simultaneous monitoring of rates of 41000 different interactions
� Label-free detection
� Absolute quantification of binding amounts and ratios
� Kinetic measurements with �1 s time resolution
� Detection limit: �80 fg, or �1 attomole (o1million molecules) for 60-kDa
� Can detect small ligands (o300Da) interacting with 41000 different prot
� Near perfect referencing for removing spurious signals due to changes in i
� Time response and absolute quantitative nature render analyses of concent
design
� Requires much less of the precious biomolecules than normal SPR:J On-chip receptors: requires only enough of each for spotting �1 nL drJ Solution-phase biomolecules in the flow cell: requires 1000-fold less, sin
� SPR-active chips typically compatible with inexpensive but reliable robotic
� Timely: many new methods for spotting protein arrays and arrays of othe
variables are exactly the same for each spot in such ananalysis, this approach offers an improvement in measure-ment reliability relative to 1000 independent measurementsby the simpler SPR spectroscopy. Table 1 summarizessome of the advantages of SPRM and SPRI for suchanalyses.There are several disadvantages shared by both SPR and
SPRM. Perhaps the most important is that, without signalamplification in any way, one requires a minimum of�0.1% of the surface receptors to be occupied to detecttheir presence. Thus, to achieve the advantages in Table 1,one requires a concentration of the biomolecular bindingpartner in solution that is at least Kd/1000, where Kd is theequilibrium dissociation constant for the interaction ofinterest. However, a number of methods have beendeveloped for amplification that dramatically relax thislimitation, as outlined below. Another disadvantage is thatthe metal surface must be functionalized with a bioreceptorin a way that avoids non-specific adsorption. Non-specificadsorption can lead to false signals and biosensor fouling.Finally, biomolecules immobilized onto SPR sensorsurfaces do not always retain their native bioactivity and,with some immobilization schemes, only a small fraction ofthe immobilized biomolecules are active. This can effect thedetermination of binding stoichiometry (biomoleculesbound per receptor). The stoichiometry can also beinfluenced by the proximity of other receptors in theadlayer, especially when the analyte is a large biopolymer[31].Table 2 lists just a few of the potential applications of
SPRM.Here we will present first a brief review of SPR
spectroscopy, and then present a review of SPRM and itsapplications in microarray-based biaffinity analyses. Be-cause the basis for absolute quantitative analysis in SPRMis the same as that is SPR spectroscopy, we first will presenta detailed description of the methods for absolutequantitative analysis in SPR spectroscopy, and explainhow these are easily extended to SPRM.
proteins
eins simultaneously
ndex of refraction of buffer solutions, temperature, etc.
rations much more reliable, and make control experiments much easier to
oplet onto microarray
ce 41000 interactions probed with every injection to cell
spotters
r receptors on gold have recently been developed
Abhishek
Highlight
Abhishek
Highlight
Abhishek
Highlight
Abhishek
Highlight
Abhishek
Highlight
ARTICLE IN PRESS
0Θ i
100
SPR Angle or Wavelength
0Θ
i
100
Surface plasmon on the gold layer
Glass substrate
Refraction Index matching fluid
Prism
Reflecta
nce Inte
nsity (
%)
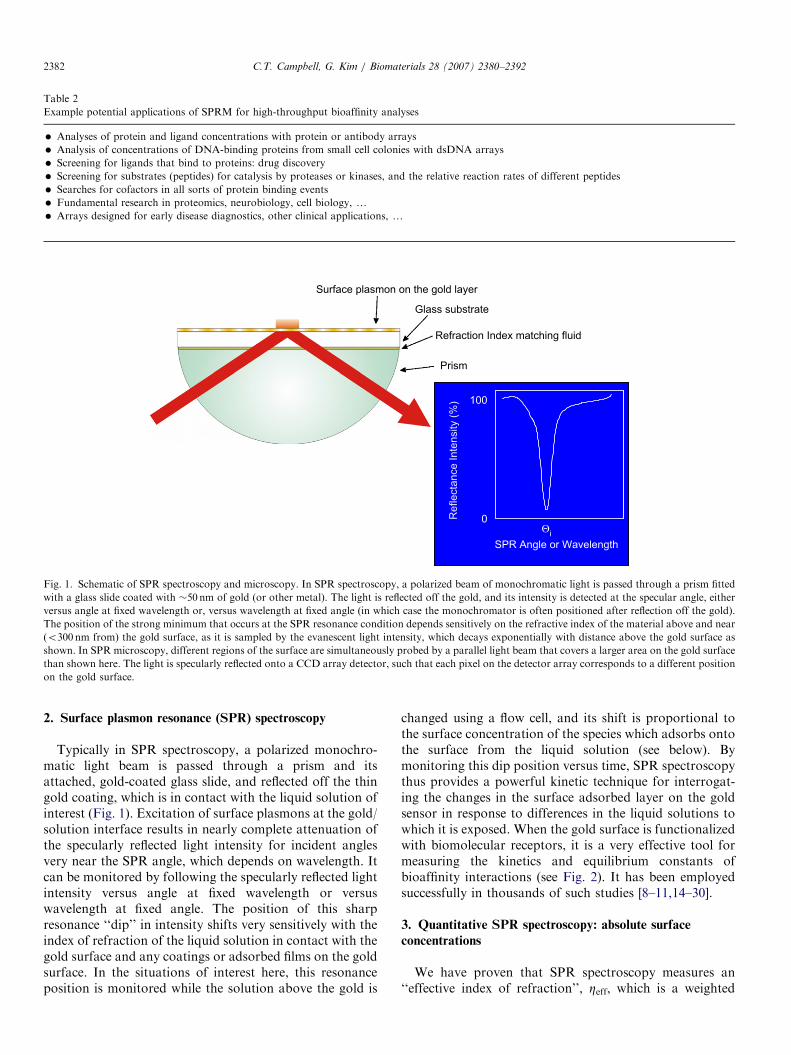
Fig. 1. Schematic of SPR spectroscopy and microscopy. In SPR spectroscopy, a polarized beam of monochromatic light is passed through a prism fitted
with a glass slide coated with �50 nm of gold (or other metal). The light is reflected off the gold, and its intensity is detected at the specular angle, either
versus angle at fixed wavelength or, versus wavelength at fixed angle (in which case the monochromator is often positioned after reflection off the gold).
The position of the strong minimum that occurs at the SPR resonance condition depends sensitively on the refractive index of the material above and near
(o300 nm from) the gold surface, as it is sampled by the evanescent light intensity, which decays exponentially with distance above the gold surface as
shown. In SPR microscopy, different regions of the surface are simultaneously probed by a parallel light beam that covers a larger area on the gold surface
than shown here. The light is specularly reflected onto a CCD array detector, such that each pixel on the detector array corresponds to a different position
on the gold surface.
Table 2
Example potential applications of SPRM for high-throughput bioaffinity analyses
� Analyses of protein and ligand concentrations with protein or antibody arrays
� Analysis of concentrations of DNA-binding proteins from small cell colonies with dsDNA arrays
� Screening for ligands that bind to proteins: drug discovery
� Screening for substrates (peptides) for catalysis by proteases or kinases, and the relative reaction rates of different peptides
� Searches for cofactors in all sorts of protein binding events
� Fundamental research in proteomics, neurobiology, cell biology, y
� Arrays designed for early disease diagnostics, other clinical applications, y
C.T. Campbell, G. Kim / Biomaterials 28 (2007) 2380–23922382
2. Surface plasmon resonance (SPR) spectroscopy
Typically in SPR spectroscopy, a polarized monochro-matic light beam is passed through a prism and itsattached, gold-coated glass slide, and reflected off the thingold coating, which is in contact with the liquid solution ofinterest (Fig. 1). Excitation of surface plasmons at the gold/solution interface results in nearly complete attenuation ofthe specularly reflected light intensity for incident anglesvery near the SPR angle, which depends on wavelength. Itcan be monitored by following the specularly reflected lightintensity versus angle at fixed wavelength or versuswavelength at fixed angle. The position of this sharpresonance ‘‘dip’’ in intensity shifts very sensitively with theindex of refraction of the liquid solution in contact with thegold surface and any coatings or adsorbed films on the goldsurface. In the situations of interest here, this resonanceposition is monitored while the solution above the gold is
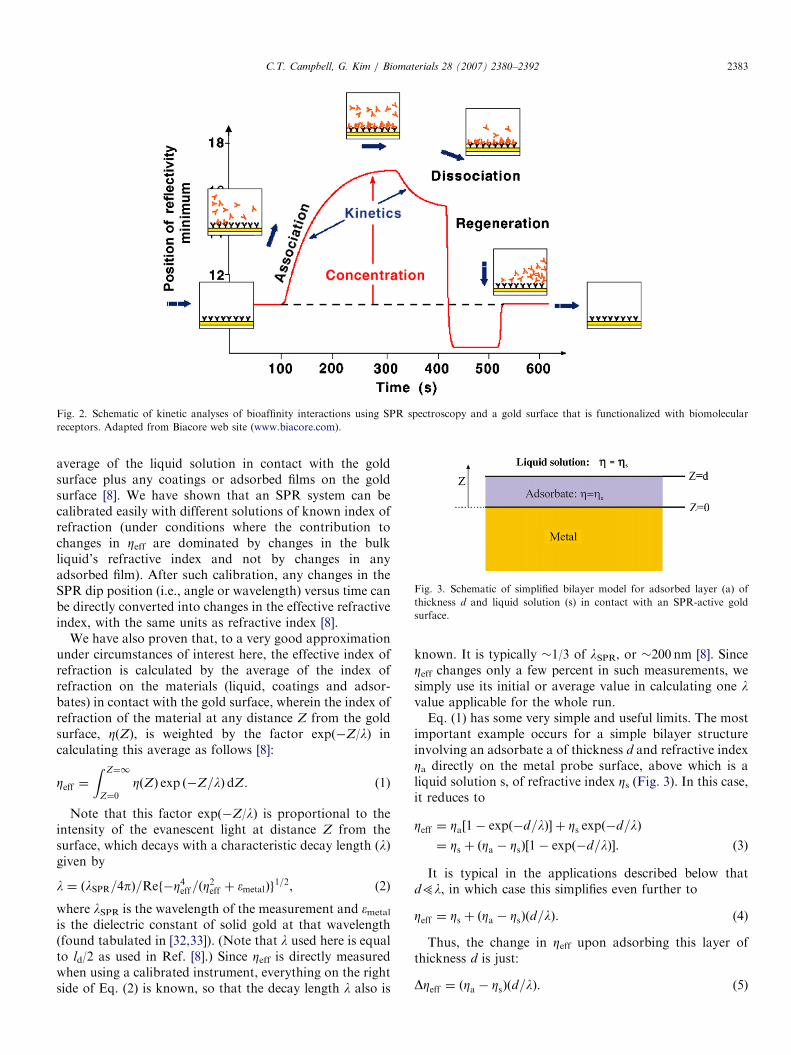
changed using a flow cell, and its shift is proportional tothe surface concentration of the species which adsorbs ontothe surface from the liquid solution (see below). Bymonitoring this dip position versus time, SPR spectroscopythus provides a powerful kinetic technique for interrogat-ing the changes in the surface adsorbed layer on the goldsensor in response to differences in the liquid solutions towhich it is exposed. When the gold surface is functionalizedwith biomolecular receptors, it is a very effective tool formeasuring the kinetics and equilibrium constants ofbioaffinity interactions (see Fig. 2). It has been employedsuccessfully in thousands of such studies [8–11,14–30].
We have proven that SPR spectroscopy measures an‘‘effective index of refraction’’, Zeff, which is a weighted
ARTICLE IN PRESS
Fig. 2. Schematic of kinetic analyses of bioaffinity interactions using SPR spectroscopy and a gold surface that is functionalized with biomolecular
receptors. Adapted from Biacore web site (www.biacore.com).
Fig. 3. Schematic of simplified bilayer model for adsorbed layer (a) of
thickness d and liquid solution (s) in contact with an SPR-active gold
surface.
C.T. Campbell, G. Kim / Biomaterials 28 (2007) 2380–2392 2383
average of the liquid solution in contact with the goldsurface plus any coatings or adsorbed films on the goldsurface [8]. We have shown that an SPR system can becalibrated easily with different solutions of known index ofrefraction (under conditions where the contribution tochanges in Zeff are dominated by changes in the bulkliquid’s refractive index and not by changes in anyadsorbed film). After such calibration, any changes in theSPR dip position (i.e., angle or wavelength) versus time canbe directly converted into changes in the effective refractiveindex, with the same units as refractive index [8].
We have also proven that, to a very good approximationunder circumstances of interest here, the effective index ofrefraction is calculated by the average of the index ofrefraction on the materials (liquid, coatings and adsor-bates) in contact with the gold surface, wherein the index ofrefraction of the material at any distance Z from the goldsurface, Z(Z), is weighted by the factor exp(�Z/l) incalculating this average as follows [8]:
Zeff ¼Z Z¼1
Z¼0
ZðZÞ exp ð�Z=lÞdZ. (1)
Note that this factor exp(�Z/l) is proportional to theintensity of the evanescent light at distance Z from thesurface, which decays with a characteristic decay length (l)given by
l ¼ ðlSPR=4pÞ=Ref�Z4eff=ðZ2eff þ �metalÞg
1=2, (2)
where lSPR is the wavelength of the measurement and emetal
is the dielectric constant of solid gold at that wavelength(found tabulated in [32,33]). (Note that l used here is equalto ld/2 as used in Ref. [8].) Since Zeff is directly measuredwhen using a calibrated instrument, everything on the rightside of Eq. (2) is known, so that the decay length l also is
known. It is typically �1/3 of lSPR, or �200 nm [8]. SinceZeff changes only a few percent in such measurements, wesimply use its initial or average value in calculating one lvalue applicable for the whole run.Eq. (1) has some very simple and useful limits. The most
important example occurs for a simple bilayer structureinvolving an adsorbate a of thickness d and refractive indexZa directly on the metal probe surface, above which is aliquid solution s, of refractive index Zs (Fig. 3). In this case,it reduces to
Zeff ¼ Za½1� expð�d=lÞ� þ Zs expð�d=lÞ
¼ Zs þ ðZa � ZsÞ½1� expð�d=lÞ�. ð3Þ
It is typical in the applications described below thatd5l, in which case this simplifies even further to
Zeff ¼ Zs þ ðZa � ZsÞðd=lÞ. (4)
Thus, the change in Zeff upon adsorbing this layer ofthickness d is just:
ARTICLE IN PRESSC.T. Campbell, G. Kim / Biomaterials 28 (2007) 2380–23922384
Thus, the SPR response upon adsorption is proportionalto the difference in refractive index between the adsorbateand the solution, Za�Zs, and the adsorbed layer’sthickness, d. Thus, a measurement of DZeff upon adsorptionusing SPR spectroscopy provides the value of d, theadsorbate film thickness. This is used to obtain d frommeasuring DZeff.
Note that the above method to measure film thickness, d,also applies when the adsorbate is not spread so nicely in afilm of uniform thickness, but instead makes a rough oreven porous layer, provided this porosity or roughnessoccurs on a distance scale (measured parallel to the goldsurface) that is small compared to �5 mm [8]. In that case,the d one obtains is really its ‘‘effective thickness’’, meaningthe thickness which this same amount of adsorbate(in mass per unit area) would have if it were spreaduniformly at its normal packing density, ra. For thisreason, we shall refer to the value of d obtained from usingEq. (5) as deff throughout the remainder of this paper.Actually, deff is more interesting than the film’s maximumthickness, since it is this effective thickness that must beused to quantify the amount of that adsorbate in mass perunit area [8]. Thus, one applies Eq. (5) to get deff:
deff ¼ ½DZeff=ðZa � ZsÞ�l (6)
and then obtains from deff the surface concentration:
mass per unit area of adsorbate ¼ deffra. (7)
In bioanalytical applications, the mass per unit area isthe key value of interest. Note that the value of ra used inthe above equation must be taken for the same form ofmatter as that for which Za is defined.
It is important to know how best to obtain literaturevalues for the needed parameters (Za and ra) when applyingEqs. (6) and (7). Often the values for the pure bulkmaterials are known or can be measured. For a moleculelike a protein which is not readily obtained in pure formoutside of solution, or which may change its charged statewhen not in aqueous solvent, it is most accurate to use thatmolecule’s so-called ‘‘refractive index increment in aqueousbuffer’’ to obtain Za and its ‘‘specific volume in aqueousbuffer’’ (similar to its partial molar volume) to obtain ra(1/specific volume) as described in detail in [8](see Eq. (10b) therein, and related discussion). Thesevalues are tabulated for some biomolecules [34,35], butcan also be measured. The key to understanding their use isto remember that the index of refraction of a binarymixture (for example, buffer plus protein, where thecomplex buffer is treated as a single component forsimplicity) is assumed to be given by
where fi is the volume fraction of component i, so thatfbuffer ¼ 1�fprotein. Measurements of the refractive index ofa protein–buffer mixture at various protein concentrationsallows one to estimate Zprotein. The volume fraction of
This same type of analysis has been applied to DNAs,RNAs and many other molecules. Typical resulting valuesin aqueous buffers are: rprotein ¼ 1/0.77mL/g ¼ 1.3 g/mL,Zprotein ¼ 1.57 (except for lipo- and glyco-proteins),rdsDNA ¼ 1.7 g/mL and ZdsDNA ¼ 1.7 [8,34,36–40].
4. SPR microscopy (SPRM) or ‘‘SPR imaging’’ (SPRI)
SPRM, also referred to as SPRI, provides the same typeof quantitative data as obtained in biosensing with SPRspectroscopy (i.e., amount adsorbed versus time), but it hasthe very important added feature of monitoring adsorptionwith a spatial resolution down to �4 mm over a large areaof a sensing surface [36,41–48].In most SPR microscopes, an expanded and collimated,
polarized and monochromatic light beam (often a He–Nelaser, but sometimes a narrow-pass filtered white light)travels through a prism and an attached glass slide coatedwith a thin gold film, and reflects from the gold/solutioninterface at an angle greater than the critical angle[36,41–48]. The reflected light intensity from the illumi-nated area of the surface is monitored at the specular angle,typically by a CCD detector array. (A more sophisticatedcommercial version has just been introduced wherein thelight is scanned across the sample surface [49].) In any case,each pixel on the CCD array maps into a specific locationon the gold surface, and provides the surface informationabout that spot on the surface (see Fig. 1). The spatialcontrast in an SPR microscope image comes from theheterogeneity in the complex dielectric due to differences inrefractive index near the surface at different lateralpositions across the surface, which results in slight shiftsin the resonance angle. This leads to changes across thesurface in reflected intensity at an incident angle near theresonance angle. If an adsorbate has a different refractiveindex than the solvent, its binding to the surface can thusbe detected in a spatially resolved way simply bymonitoring changes in reflected light intensity at thepixel(s) of interest. Since the pixels on a CCD array areall sampled simultaneously in modern instrumentation, thisallows for very high throughput studies of adsorbedamount versus position on the surface, ideally compatiblewith the probing of microarrays of biomolecules[36,44,46,48,50–68].A number of designs have been reported for SPR
microscopes [36,41–48]. In our home-built SPR microscope[36], a stabilized 632.8 nm HeNe laser serves as theexcitation source. The laser beam is p-polarized, expandedand collimated before traveling through an SF14 glasshemi-cylindrical prism and attached glass slide, to illumi-nate an approximately 16mm2 area of the gold-coated slidesurface. The reflected light is focused and directed by a lensdirectly onto the CCD detector of a video camera, creatingan image that is automatically digitized by a framegrabber
ARTICLE IN PRESS
0
10
20
30
40
50
60
70
53.8 54.8 55.8 56.8
Θ, degrees
Linear
region
Linear
region
Δ Intensity
Δ Θmin
Θ = 54.6°
ΔIntensity
Θ = 56.3°
ηsoln = 1.3330
ηsoln = 1.3342
Refl
ecta
nce In
ten
sit
y
% Reflected
% Reflected
Fig. 4. Principle of SPR microscopy. SPR reflectivity curves versus the
light’s incident angle (at fixed wavelength) for samples of two different
effective refractive indices in contact with the gold surface. There is a
linear region on the left where the light intensity increases almost
proportionally with the change in effective refractive index over a limited
range of �0.007 refractive index units (equivalent to �4ML of adsorbed
protein of 50 kDa mass). If the microscope is set up at an angle in this so-
called high-contrast region, the intensity change measured at fixed angle is
proportional to the change in effective refractive index, which in turn is
proportional to adsorbate coverage (or the fractional population of
immobilized receptors). From [36].
C.T. Campbell, G. Kim / Biomaterials 28 (2007) 2380–2392 2385
card and stored using image acquisition software (KSA400,k-Space Associates, Inc., Ann Arbor, MI). The detectionoptics are connected to an aluminum rail that is attached toa motorized rotation stage. This stage is mounted under anidentical stage that holds the prism. The centers of rotationfor the two stages are aligned. A computer connected to astage controller/driver is used to separately and equallyvary the angle of incidence and the angle of detection so theCCD detector stays at the specular angle for each angle ofincidence. The entire system is mounted on a laser tableand covered by a black box to minimize stray light, dust,and airflow effects. The image acquisition softwarecontrols the CCD camera exposure time, frame averagingand conversion of measured light intensity values to grayscale levels. A key feature of the software is its ability tointegrate the intensity in any number of selected regions ofan image simultaneously and plot/store that region’sintegrated intensity versus time in real time. The fluidicssystem includes a low-volume (�15 mL) flow cell, a syringepump, two switching valves, and low dead-volume laminarflow tubing. The syringe is computer controlled for rapidtime response in changing this solution in contact with thegold surface (�1 s).
One-dimensional SPRI is a related technique that usesone dimension of the SPR image to measure SPRreflectivity versus frequency and the other dimension toproduce a one-dimensional image of the sensor surface[69,70].
5. Quantitative SPR microscopy: absolute surface
concentrations with spatial resolution
We now review the method we recently developed for theconversion of light intensities in SPRM (or SPRI) toabsolute adsorbate coverages (mass or number of mole-cules per unit area) [36]. For this purpose, it is best first toset up the angle of light incidence (and detection) of themicroscope so that it is operating in the ‘‘linear’’ responseregion, as defined in Fig. 4. In this range of angles, thechange of light intensity is proportional to the change inZeff. The SPR microscope is calibrated easily in much thesame way as described above using a series of solvents ofdifferent bulk refractive indices, so that changes in reflectedlight intensity can be converted directly into changes in Zeff.A typical calibration plot is shown in Fig. 5. Thereafter, ameasurement of the change in light intensity versus time foreach spot on the sample surface directly provides DZeff,which in turn can be used to get deff (using Eq. (6)) and themass of adsorbate per unit area (using Eq. (7)), both nowmeasured locally with high spatial resolution.
We have described in detail elsewhere [36] this procedurefor microscope calibration and conversion of light intensitychanges into mass per unit area. This forms the basis forquantitative analysis using SPRM when absolute boundamounts (mass per unit area) are desired. This procedurehas been used in high-throughput bioaffinity analyses usingmicroarrays of both dsDNAs and proteins, to get both the
amount of immobilized receptor and the amount of proteinbound after exposure to aqueous solution containing thatprotein [36,66,67]. Comparing these two quantities alloweddetermination of the receptor–protein binding stoichiome-try. Obviously, this can be extended to studies of manyother biomolecular pairs.The absolute accuracy of this approach for measuring
absolute surface concentrations and binding ratios withSPRM should be better than 735% [8,36] with, of course,much better precision (o75%, see below). Absoluteaccuracy is typically limited by the accuracy of theparameter Za (or more properly, Za�Zs), which often isonly known rather approximately.
6. Example applications
SPRM has been investigated as a promising tool forsimultaneously monitoring binding events across functio-nalized surface microarrays. Early work in this arena waspioneered by the research groups of Wolfgang Knoll[41,42,45,68,71–73] and Robert Corn [46,53,74,75].By creating 1-D or 2-D arrays of binding sites on an
ARTICLE IN PRESS
Control
Control
SA only
1
2
3
4
5
6
7
8
Control
Control
9
10
Operator
Operator
400μm
Fig. 6. SPR microscope image and line profile of a section of a 120-spot
dsDNA array under buffer solution, before exposure to proteins. The
operator spots are those which contain the binding sequence for Gal4, and
the control spots are a sequence that is completely unrelated to the Gal4
binding sequence. The ‘‘SA only’’ spots are spots that only have
streptavidin, with no added biotinylated dsDNA. The DNAs are �100
base pairs long, and the spots are 200-mm across. From [66].
0
10
20
30
40
50
0 0.005 0.01 0.015
Δ Δ Refractive Index
Δ %
Refl
ecte
d In
ten
sit
y
Θ = 54.49°
Θ = 54.18°
Θ = 54.80°
Fig. 5. Calibration plots for an SPR microscope, where the changes in
reflected intensity are measured at fixed angle versus changes in bulk
refractive index of a simple solution in contact with the gold surface, under
conditions where changes in the effective refractive index due to
adsorption are negligible. Note that there is a proportional response over
a large range (�0.007 refractive index units) when the angle of light
incidence is chosen properly to be initially on the right edge of the linear-
response region shown in Fig. 4. The variation in the linear regions of the
curves with incident angle shows the dependence of the linear dynamic
range on proper selection of the high-contrast angle for use in the SPR
microscope’s measurement. From [36].
C.T. Campbell, G. Kim / Biomaterials 28 (2007) 2380–23922386
SPR-active surfaces, DNA–DNA binding, RNA–DNAbinding, protein–DNA binding and other bioploymerinteractions have been studied in a parallel fashion bySPRM [36,44,46,48,50–68,76,77]. Some of these applica-tions have been reviewed recently [48].
Corn’s group has been very active in the developmentand characterization of a wide variety of robust surfacechemistries to link biological molecules (DNA, proteins,peptides, carbohydrates, RNA, etc.) to gold surfaces, andmethods to deposit these in array formats appropriate forhigh-throughput applications using SPRI [48,50,52,53,56,57,60,61,64,78–81]. Generally, their starting point is a self-assembled monolayer of long-chain alkanethiols that are o-terminated with an amine functional group, which is thenchemically modified with heterobifunctional crosslinkerssuch as SPDP (N-succinimidyl 3-(2-pyridyldithio)-propio-namido), SATP (N-succinimidyl S-acetylthiopropioate) orSSMCC (sulfosuccinimidyl 4-(N-maleimidomethyl) cyclo-hexane-1-carboxylate). These are then used to chemicallyattach thiol-modified oligonucleotides or carbohydrates, orcysteine-terminated peptides to the surface.
Corn’s group has also demonstrated the application ofDNA microarrays for SPRI-based detection of oligonu-cleotides [46] and ribosomal RNA [50,82], for monitoringthe induced formation of hairpin structures [83], as well asfor studying the specific binding of two response regulatorsproteins (OmpR and VanR) to DNA [84]. They have alsodemonstrated the application of array-based detection withSPRI to quantitatively monitor carbohydrate–protein,peptide–protein, and protein–protein interactions, as wellas surface enzyme kinetics [48,55–57,60,62,64,79,81].
Without amplification, the detection limit in SPRIstudies of DNA or RNA hybridization onto microarrayswas close to 1 nM. Corn’s group recently has improved thisdetection limit by six orders of magnitude to �1 fMthrough the use of signal amplification via the enzymeRNase H [63,65]. When a ssDNA target binds to a surfaceRNA molecule within a single-stranded RNA (ssRNA)microarray, RNase H selectively hydrolyzes the RNAstrand in the RNA/DNA heteroduplex, thus releasing thetarget DNA back into solution. Amplification is achievedsince this binding/hydrolysis cycle occurs repeatedly forevery DNA molecule, thus removing many surface-boundRNA molecules and rendering the signal decrease ob-servable in SPRI. Yager’s group also has used enzymaticamplification in SPRI [85].Corn’s group has recently applied time-resolved SPRI to
a number of analyses, including a quantitative analysis ofthe kinetics of S-protein adsorption/desorption onto/froman array composed of five different S-peptide variants, anda study the surface enzymatic activities of the protease,factor Xa, with a peptide microarray [64].We have demonstrated several applications of the
method for absolute quantitative measurements describedabove (i.e., Eqs. (6) and (7)) to time- and spatially-resolvedmeasurements of absolute coverages made with a home-built SPR microscope during protein binding onto goldand onto dsDNA microarrays on gold [36,66,67].
ARTICLE IN PRESS
0
2
4
6
8
10
12
14
0 200 400 600 800 1000
Time, seconds
Gal4
Co
vera
ge, 10
11 G
al4
/cm
2
Inject Gal4
Buffer rinse
Fig. 7. Simultaneous, real-time measurement of Gal4 binding to (and
removal from) six representative, spatially separated spots on the dsDNA
array surface, each functionalized with the Gal4 Operator (taken from the
120-spot array shown in Fig. 6). Before Gal4 injection, the surface was in
protein-free buffer. The adsorption/removal curves show the SPR
response (reflected intensity change, after conversion to surface concen-
tration of Gal4) in each such 200-mm spot, after subtracting the response
measured at a nearby Control dsDNA spot, to eliminate signal
contributions due to non-specific Gal4 binding and changes in the index
of refraction of the buffer solutions. From [66].
Fig. 8. SPR microscope images of (a) protein microarray, before exposed to ant
and difference images after exposed to 0.1mg/ml human IgG in PBS (c) and 0
surface excess antibodies were rinsed with pure PBS. From [86].
C.T. Campbell, G. Kim / Biomaterials 28 (2007) 2380–2392 2387
For simultaneous measurement of adsorption onto morethan one hundred 200 mm� 200 mm spots within a 4mm�6mm area with 1 s time resolution, we demonstrated adetection limit for the change in effective refractive index of�2� 10�5, or 1.2 ng/cm2 of protein (0.5 pg in each spot),with a very useful linear dynamic range of �720 ng/cm2 ofadsorbed protein (�4 close-packed monolayers for aprotein with �50 kDa mass) [36]. We demonstrated itsability for quantitative, real-time measurement of thekinetics of sequence-specific binding of DNA-bindingproteins to double-stranded DNA (dsDNA) immobilizedin a 10� 12 array on a planar gold surface usingstreptavidin as the surface linker [36,66,67].Specifically, the binding of the yeast transcription factor
Gal4 to a 120-spot dsDNA array made with alternating200-mm spots of its dsDNA operator sequence and anunrelated DNA sequence proved that this method could beused to simultaneously monitor the kinetics of binding ofproteins to 120 different dsDNA sequences with sensitivityto o0.5 pg (o2� 107 molecules) of bound protein in eacharray spot at a time resolution of 1 s (see Figs. 6 and 7) [66].Absolute quantitative determination of the binding stoi-chiometry (i.e., the number of proteins bound per dsDNA)showed the expected saturation ratio of �two (i.e., it waspreviously known to bind as a homo-dimer in solutionphase) [66]. The data of Fig. 7 show the reproducibilityof the response on numerous representative spots withthe same DNA sequence. From each spot, an on-rateconstant of �600 Gal4 per dsDNA per s per M of Gal4
ibodies, protein microarray after exposed to 0.1mg/ml human IgG in PBS,
.1mg anti-BSA IgG in PBS (d). Image (b), (c) and (d) were captured after
ARTICLE IN PRESSC.T. Campbell, G. Kim / Biomaterials 28 (2007) 2380–23922388
concentration was estimated. From longer-time data (notshown but from the long-time behavior of the curves ofFig. 7), the effective first-order off-rate constant for Gal4
0 500 1000 1500 20000
100
200
300
400
500Inject anti-BSA IgG solution
(6.7X10⁻⁷
M in 100 mM PBS)
Bound a
nti-B
SA
IgG
(ng
/cm
2)
Time (seconds)
Buffer rinse
Fig. 9. Representative SPR binding and off-rate curves for ten Protein A
spots within a 288-spot array, showing the reproducibility of response to
injection of an anti-BSA IgG solution and then a buffer rinse using a SPR
microscope developed by the authors.
Fig. 10. A 1020-spot protein microarray as imaged by a modern commercial
were: human IgG1, human IgG2, human IgG3, human IgG4, sheep IgG, anti-
HSA, monoclonal HSA, human IgM, cat IgG, protein A, protein L, anti-DNP
specific binding (large intensity increases) upon exposure to probe proteins (see
spots, so they are not labeled. From [49].
binding to its operator sequence was estimated to be�6.770.7� 10�5 Gal4 homodimers per dsDNA per s.Dividing this by the on-rate constant gave an estimate ofthe pseudo-first-order equilibrium constant for Gal4binding to its immobilized Operator sequence of�200 nM, neglecting the dimeric character of the actualbinding [66]. These results demonstrated the feasibility ofhigh-throughput analyses of the kinetics and equilibriumconstants of protein–dsDNA binding using SPRM.More recently, we have improved the signal-to-noise
ratio of this instrument, and demonstrated that proteinarrays can be spotted and probed in this same way. Anexample of an array for probing antibody–antigen bindingis shown in Fig. 8, from [86]. Typical signal-to-noise andreproducibility are shown in Fig. 9. We have proven withthis instrument the ability to prepare and probe 300-spotprotein arrays, simultaneously detecting each 200-mm spotswith 1 s time resolution and a detection limit of 5� 10�6
refractive index units, corresponding to �0.4 ng of proteinper cm2, oro80 fg per spot (i.e., �1 attomole per spot for a60 kDa biomolecule).There are now several commercial SPR microscope
systems. These include the pioneering instrument partially
SPR microscope system (Lumera Corp.). The proteins used in this array
sheep IgG, human IgG, BSA, ployclonal anti-BSA, biotin-BSA, lysozyme,
antibody and monoclonal anti-ovalbumin. The protein spots which showed
below) are labeled on the image. The other protein spots were just control
ARTICLE IN PRESSC.T. Campbell, G. Kim / Biomaterials 28 (2007) 2380–2392 2389
developed by Robert Corn, and commercialized by GWCTechnologies, Inc. (Madison, Wisconsin: http://www.gwctechnologies.com/). Biacore also has developedan instrument (www.biacore.com). These systems aredesigned for relatively small arrays (10–400 spots).
A commercial SPR microscope system, the LumeraProteomic Processor (http://www.lumera.com/), was recentlydeveloped that handles much larger arrays (1000–10,000
Fig. 11. The same microarray as in Fig. 10 after exposure to human-IgG, pres
upon exposure to this protein (i.e., after subtraction of the initial intensity be
S
0 200
Pro
tein
s B
ou
nd
(n
g/c
m2)
0
20
40
60
80
100
Inject
streptavidin
↓
Inject
anti-BSA
↓
Fig. 12. Example binding curves at some of the spots in the 1020-spot protein m
human IgG (as marked), separated by PBS buffer rinses and one surface regen
solution (marked). The expected specificities of binding were observed. This in
spot) while simultaneously monitoring binding kinetics on 41000 spots with
capable of monitoring the binding of small ligands (o200Da) to large protein
spots) [87]. This instrument has demonstrated the ability tosimultaneously monitor binding kinetics on 1350-spot arrayswith superb detection limits (�0.3ng of protein per cm2, oro50 fg per spot) with a time resolution of 1 s, and even muchbetter spot-to-spot reproducibility than Fig. 9 (10-foldsmaller standard deviation in relative bound amountsamongst spots of the same receptor) [49]. That is, itcan collect 41000 kinetic curves similar to those in Figs. 2,
ented as a difference image where the intensity shown is only the increase
fore injection). From [49].
econds
400 600
Inject
human-IgG
↓
Regenerate
surface ↓ ↓
icroarray of Figs. 10 and 11 after injections of streptavidin, anti-BSA and
eration of binding sites by rinsing with a pH 3.2 0.1M glycine–HCl buffer
strument showed detection limits of 0.3 ng/cm2 (o1 million proteins per
1 s time resolution [49]. This implies that this commercial instrument is
ARTICLE IN PRESSC.T. Campbell, G. Kim / Biomaterials 28 (2007) 2380–23922390
7 and 9 simultaneously. An example image produced by thisinstrument of a 1020-spot protein microarray is shown inFig. 10. In this array, the 20 different proteins were spottedmultiple times in rows across the surface. It is clear fromthese results that, if more proteins had been available at thetime, an array of this same size could have been made with1020 different proteins. The difference SPR image of thissame array after exposure to human-IgG is shown in Fig. 11,demonstrating the selectivity of binding and detection. Aseries of kinetic response curves from this array uponinjection to solutions of several proteins is shown in Fig. 12.Note the absolute scale on the y-axis.
Similar experiments with this Lumera instrument,detecting the binding of a biotinylated peptide of 1500Damass (LHRH) onto streptavidin spots within an array of1200 spots showed a signal 420 times the detection limit[49], implying that this instrument must be capable ofprobing large protein arrays with small (�200Da) ligandsin a label-free manner. Successive exposures of a proteinarray to such ligands should be a powerful tool in drugdiscovery. This instrument has pattern-recognition soft-ware for automatic spot assignments and labeling, whichgreatly decreases user effort. Its chips are compatible withmost commercial robotic spotters or arrayers. The systemalso has the capability for scaling up to 10,000-spot arrays.Advantages of this scanner include compactness of designand the total absence of diffraction fringes and associatedoptical problems that arise when using coherent lightsources (a diode laser here). This relaxes considerably thedemands on lens and sample surface perfection andcleanliness.
As noted above, commercial SPR micrscopes are nowcapable of detecting less than one million protein moleculesbinding to a spot in large (1350 spot arrays), whilesimultaneously monitoring the absolute bound amountson all spots in the array. A look to the future suggests thatSPRM may eventually be converted to a technique that candetect only a single protein molecule binding to such spotsin high throughput. This might be done, for example, bylabeling the analytes with gold nanoparticles, which wouldinteract strongly with the evanescent wave above the goldsurface and should give a greatly amplified response. Thiswould also decrease the minimum detectable concentra-tions by many orders of magnitude. This has thedisadvantage, of course, that it requires labeling, addscomplexity and slows down analyte diffusion times.
Acknowledgements
This work was made possible by funding from theInstitute for Systems Biology, the University of Washing-ton Center for Nanotechnology, the National ScienceFoundation, the Department of Energy Office of BasicEnergy Sciences, and Lumera Corp. CTC thanks Dr.Ruedi Aebersold, Prof. Jennifer Shumaker-Parry, Dr.Hann Wen Guan, Dr. Pradip Rathod, Dr. Michael Gelb,
Dr. Leroy Hood, Prof. Rob Corn and Prof. WolfgangKnoll for helpful and enjoyable discussions over the years.
References
[1] Lukosz W. Principles and sensitivities of integrated optical and
surface plasmon sensors for direct affinity sensing and immunosen-
sing. Biosens Bioelectron 1991;6:215.
[2] Liedberg B, Nylander C, Lundstrom I. Biosensing with surface
plasmon resonance—how it all started. Biosens Bioelectron
1995;10:1995.
[3] Hutchinson AM. Evanescent wave biosensors: real-time analysis of