Spray Cooling Heat Transfer- Test and CFD Analysis Charles R. Ortloff * Marlin Vogel 1 CFD Consultants International, Ltd. 1 Juniper Networks [email protected][email protected]Abstract Spray cooling of high temperature surfaces subject to large internal heat generation is analyzed by computational fluid dynamics (CFD) methods to determine heat transfer coefficients and the micro-physical details of coolant droplet-heated surface interactions governed by evaporative processes. A high speed, high magnification digital camera (6000 frames/sec) is used to provide test data for micron scale spray droplet size distribution and droplet velocity from a spray nozzle for different supply pressures for HFE 7100 and water coolants. Droplet test data are then applied to construct FLOW-3D CFD models [1] of numerous translating spherical droplets impacting a heated surface with internal volume heat generation and the transient, free-surface fluid dynamics and heat transfer processes computed. Transient, expanding/collapsing, chaotic coolant vapor regions generated by evaporative processes during successive multiple droplet impacts on flat and roughened surfaces sustaining large heat fluxes (from 30 to 300 W/cm 2 ) are generated from the CFD solutions and shown to reproduce qualitative phase transition features observed from test photography. A computer program is provided to calculate heat transfer coefficients for different combinations of coolant droplet size, droplet velocity, droplet spatial distribution in nozzle sprays, heat flux magnitude, evaporation temperature and coolant flow rate incorporating the thermophysical coolant and wall properties for both flat and surface roughness cases. CFD results for a wide variety of droplet sizes, translation velocities, magnitudes of heat flux for flat and surface roughness patterns, coolant flow rates, coolant types and prescribed wall surface temperatures are used to provide physical insights into best ways to achieve maximum spray cooling heat transfer coefficients and avoid surface flooding and dry spotting. Use of high speed photographic micro- details of droplet impingement and evaporation structures on heated walls is made to qualitatively substantiate the CFD methodology by comparison of computed to test observations. 1. Introduction Spray cooling processes are known to yield high heat transfer coefficients due to the high rate of heat absorption associated with latent heat absorption during liquid-vapor phase transition [2- 7]. Of the spray cooling methods employed in current electronic cooling applications, spray injection of a
Transcript
Spray Cooling Heat Transfer- Test and CFD Analysis
Abstract Spray cooling of high temperature surfaces subject to large internal heat generation is analyzed by computational fluid dynamics (CFD) methods to determine heat transfer coefficients and the micro-physical details of coolant droplet-heated surface interactions governed by evaporative processes. A high speed, high magnification digital camera (6000 frames/sec) is used to provide test data for micron scale spray droplet size distribution and droplet velocity from a spray nozzle for different supply pressures for HFE 7100 and water coolants. Droplet test data are then applied to construct FLOW-3D CFD models [1] of numerous translating spherical droplets impacting a heated surface with internal volume heat generation and the transient, free-surface fluid dynamics and heat transfer processes computed. Transient, expanding/collapsing, chaotic coolant vapor regions generated by evaporative processes during successive multiple droplet impacts on flat and roughened surfaces sustaining large heat fluxes (from 30 to 300 W/cm2) are generated from the CFD solutions and shown to reproduce qualitative phase transition features observed from test photography. A computer program is provided to calculate heat transfer coefficients for
different combinations of coolant droplet size, droplet velocity, droplet spatial distribution in nozzle sprays, heat flux magnitude, evaporation temperature and coolant flow rate incorporating the thermophysical coolant and wall properties for both flat and surface roughness cases. CFD results for a wide variety of droplet sizes, translation velocities, magnitudes of heat flux for flat and surface roughness patterns, coolant flow rates, coolant types and prescribed wall surface temperatures are used to provide physical insights into best ways to achieve maximum spray cooling heat transfer coefficients and avoid surface flooding and dry spotting. Use of high speed photographic micro-details of droplet impingement and evaporation structures on heated walls is made to qualitatively substantiate the CFD methodology by comparison of computed to test observations. 1. Introduction Spray cooling processes are known to yield high heat transfer coefficients due to the high rate of heat absorption associated with latent heat absorption during liquid-vapor phase transition [2-7]. Of the spray cooling methods employed in current electronic cooling applications, spray injection of a
dielectric coolant fluid directly onto heat producing circuitry components followed by vapor collection and condensation in a pump-heat exchanger circuit to form a closed system is commonly used. A variant of this process involves spray cooling of heat collection plates attached to heat producing components with a separate cooling/condensation circuit to avoid direct spray impingement onto circuitry components. Other spray cooling applications involve open systems used in metallurgical heat treating systems [3]. Spray cooling can be thought of as a variant of an open heat pipe circuit where multiple phase change effects occur during evaporation and condensation changes. Spray cooling advantages lie in potentially eliminating TIM1 and TIM 2 thermal resistances, yielding a reduction in overall thermal resistances by 30-50% [8, 9], coolable power increases by 30-50% and decreases in leakage power [10 – 12] and junction temperature- all important considerations for high temperature, high heat flux electronics applications. Due to the complexity and chaotic nature of millions of high velocity spray droplets emanating from a nozzle continually interacting with heated surfaces accompanied by droplet fragmentation and fluid layer formation, the creation of imbedded vapor regions, vapor partial pressure effects that affect evaporation rate and changes in temperature-dependent thermophysical properties (surface tension, viscosity, conductivity, specific heat, for example), and the difficulty of observing rapidly developing micron scale physical interactions, only test determination of
average heat transfer coefficients appear as a viable way to understand global system behavior. Given the large number of parameters that affect the spray cooling heat transfer coefficient (i.e., droplet size, droplet velocity, spray nozzle position, spray particle distribution, die materials, surface roughness types and inclination, coolant types and properties, heat flux values, surface temperature prescription, etc.), the large test matrix size to determine the best combination of these parameters for a given cooling situation usually precludes an optimum selection of parameters to achieve the desired cooling result. To improve upon this situation, recourse to CFD methods is advanced as an alternative way to select the best combination of parameters for a given heat transfer situation. The CFD methodology applied consists of modeling streams of spherical spray droplets of given size, velocity, thermophysical properties, lateral and vertical separation distance (observed from test data) and then computing free-surface-heated wall impingement fluid dynamics and heat transfer (including impact droplet fragmentation, secondary spray particle formation and trajectories under gravity, fluid fragment coalescence with fluid layers, vapor bubble formation) and then performing statistical averaging over time and spatial extent of the spray impact area to evaluate an optimum parameter selection for a given cooling application. By use of a high speed 6000 frames/sec magnifying digital camera, observation of actual droplet impact dynamics and evaporation phenomena compared to CFD predictions under the same conditions then provides qualitative
verification that the computer solutions reproduce observed test observed micro-phenomena. From test measurements of evaporation times of different size droplets impacting a heated surface and comparison to CFD predictions matching test parameters, quantitative verification of the predictive capability of the FLOW-3D CFD code [1] is then confirmed in principle. From test results, a statistical measure of the vertical and horizontal spacing between droplets, as well as droplet size and velocity, is simulated by a large number of modeled spherical droplets (with the same separation distances) impacting a given sub-area which is a fraction of the total heat transfer area. The heat transfer results over this fractional sub-area are then used to characterize the total area’s heat transfer characteristics covered by the spray area. Here CFD symmetry boundary conditions bounding the sub-area imply uniformity of the nozzle spray over larger areas covered by the spray. 1.1 Test Results Table 1 shows test results obtained from high speed digital camera studies directed toward determining spray and droplet impact characteristics. For a given nozzle, supply pressure determines the range of droplet diameters permitting an average droplet diameter to be used in CFD calculations for a particular application. Air chamber pressure for all tests is maintained at atmospheric pressure (but it is understood that variations of this pressure can be another variable to regulate evaporation rate). The corresponding average droplet velocity, flow rate and cooling potential based on complete evaporation of
droplets are also shown in Table 1.Test data shown are used as input parameters in CFD models. Table 1- Spray test data Figure 1 shows the time progression of a HFE 7100 2 mm diameter (D) droplet at V = 72 cm/sec impacting a flat plate maintained above the droplet evaporation temperature of 334.5 K. The Reynolds number (Re = VD/υ) is 3600 where υ is the kinematic viscosity and the Bond (Bo) number is Bo = (ρ - ρ′) D2 g /σ = 98 where ρ is the droplet material density, ρ′ the surrounding medium (air) density, g the gravitational constant and σ the surface tension. The formation of vapor bubbles continues past 0.001 sec with total evaporation at 0.35 sec. Figure 1- Test data- droplet impact Figure 2 shows CFD results for a HFE 7100 20μm droplet on a heated surface maintained above evaporation temperature at 0.005 and 0.135 sec after droplet-wall contact. The open areas
represent vapor cavities progressing in size and time as indicated by a z-plane (vertical to the flat surface) cut through the impacted droplet. Due the small size of the droplet (compared to the Figure 1 droplet size), total evaporation appears to occur about 0.025 sec due to the lower mass of the droplet. The results shown indicate the capability of FLOW-3D to provide a qualitative measure of the creation of 3-D vapor bubbles once internal droplet evaporation temperature and heat absorption latent heat conditions are attained. Figure 2- CFD results Figure 3 shows test results of a 120μm water droplet at 2 cm/sec vertical velocity impacting a heated surface maintained above evaporation temperature. Here evaporation appears to be complete at 0.01 sec for Re = 6.0, Bo = 0.35 conditions. For all test cases, data obtained for averaged droplet size and droplet velocity is used as input for CFD runs as well as to verify the capability of FLOW-3D to generate qualitative agreement with droplet impact shape and generation of vapor cavities. Since both CFD and test vapor cavities are chaotic in size, growth and location, no direct comparisons between test and computer results at a given time under similar conditions are possible. Nevertheless, the presence of similar qualitative features between test and
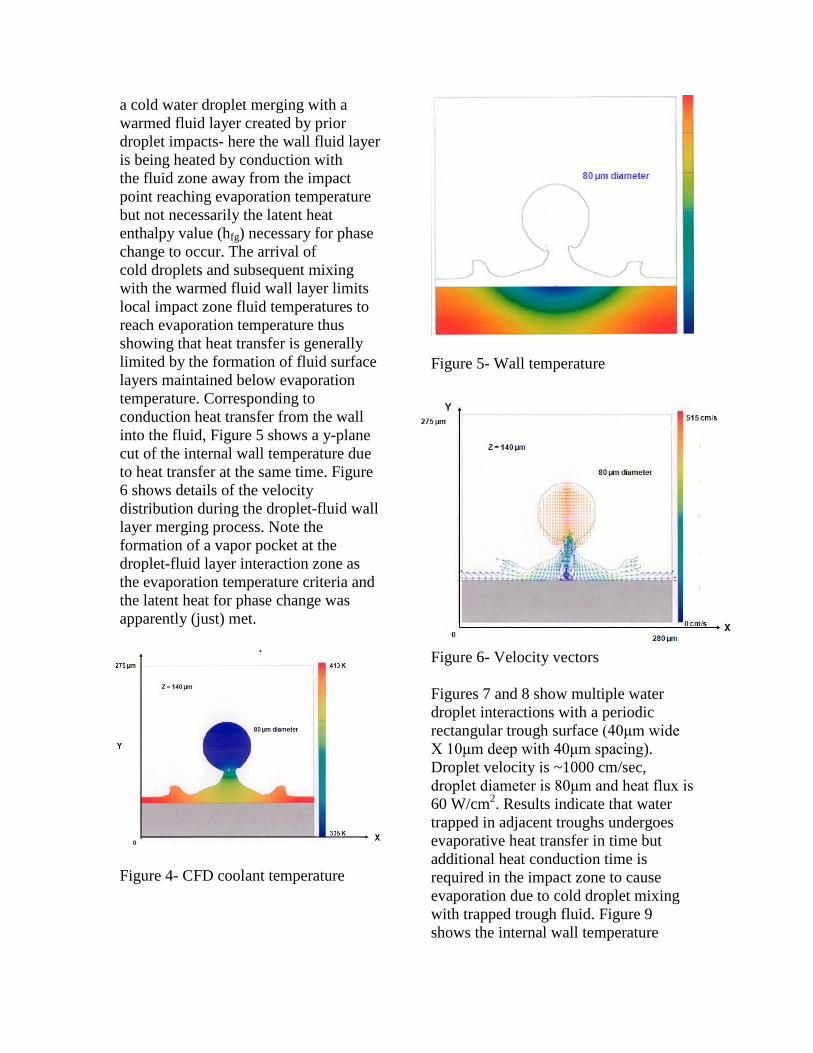
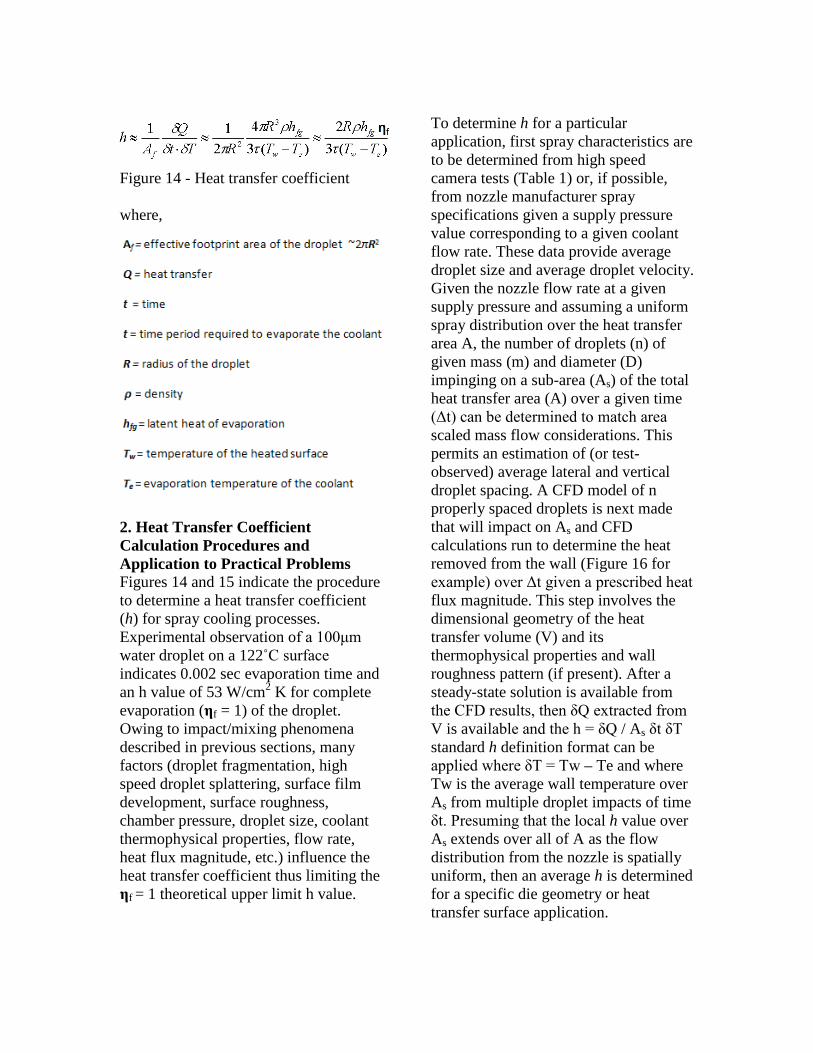
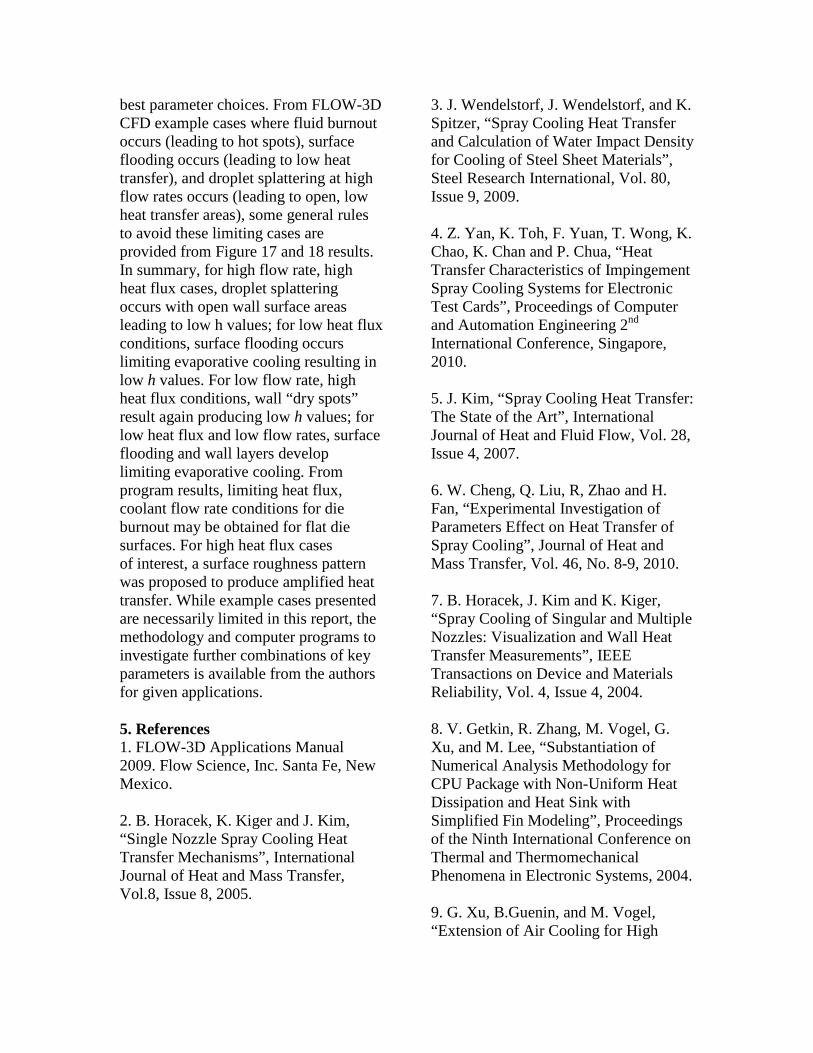
CFD results is a necessary step to show applicability of CFD methodology to represent essentially chaotic features of real spray-surface interactions. Note that the coolant fluid has a specified density, viscosity, conductivity, specific heat and surface tension at an average temperature between droplet supply and evaporation temperature and a k-ε turbulence model has been assumed in CFD calculations. Figure 4 Figure 3- Test data- evaporation time 1.2 CFD Methodology and Results – Exploration of Micro-details of Droplet-Heated Surface Interaction for Different Coolant, Droplet Size, Droplet Velocity, and Wall Roughness Parameters Figures 4, 5, and 6 show a z plane-cut time snapshot detail of a cold 335K, 80μm spherical water droplet at 515 cm/sec impacting an initial fluid layer 10μm thick whose height, temperature and free surface geometry has been affected by prior impacted droplets. Heat flux is maintained at 60 W/cm2. These figures provide micro-details of droplet impact dynamics at a given time that collectively determine heat transfer phenomena over larger areas impacted by numerous droplets. Figure 4 indicates
a cold water droplet merging with a warmed fluid layer created by prior droplet impacts- here the wall fluid layer is being heated by conduction with the fluid zone away from the impact point reaching evaporation temperature but not necessarily the latent heat enthalpy value (hfg) necessary for phase change to occur. The arrival of cold droplets and subsequent mixing with the warmed fluid wall layer limits local impact zone fluid temperatures to reach evaporation temperature thus showing that heat transfer is generally limited by the formation of fluid surface layers maintained below evaporation temperature. Corresponding to conduction heat transfer from the wall into the fluid, Figure 5 shows a y-plane cut of the internal wall temperature due to heat transfer at the same time. Figure 6 shows details of the velocity distribution during the droplet-fluid wall layer merging process. Note the formation of a vapor pocket at the droplet-fluid layer interaction zone as the evaporation temperature criteria and the latent heat for phase change was apparently (just) met. Figure 4- CFD coolant temperature
Figure 5- Wall temperature Figure 9 Figure 6- Velocity vectors Figures 7 and 8 show multiple water droplet interactions with a periodic rectangular trough surface (40μm wide X 10μm deep with 40μm spacing). Droplet velocity is ~1000 cm/sec, droplet diameter is 80μm and heat flux is 60 W/cm2. Results indicate that water trapped in adjacent troughs undergoes evaporative heat transfer in time but additional heat conduction time is required in the impact zone to cause evaporation due to cold droplet mixing with trapped trough fluid. Figure 9 shows the internal wall temperature
at a z-plane location below the trough depth. Figure 7- Fluid temperatures Figure 8- Fluid velocity vectors Here fluid trapped in adjacent troughs amplifies the internal wall temperature footprint and leads to amplified heat transfer capability. For higher heat flux values than those indicated, deeper troughs and closely spaced, higher but narrower die “islands” would capture splattered droplet fragments expected to occur at higher flow rates. Droplet fragments impacting heated island side walls add to the heat transfer surface area and are key to accommodating high heat flux heat transfer spray cooling situations (as will be discussed in further sections). Generally a criterion for island/trough design to be effective to permit large heat transfer under high heat flux
conditions is that trough widths are on the order of droplet size, elevated island widths a fraction of droplet size and island height is several times (2- 5X) droplet diameter. Since dimensions proposed are typically micrometers in scale, surface die modifications may be easily made as part of the die manufacturing process. For practical applications involving a specific choice of coolant, a specific heat flux and a prescribed surface wall temperature, resort to CFD investigation through use of the CFD program is advised to obtain optimum results by choice of flow rate and droplet size best suited to technical objectives. Figure 9 – Wall temperatures Figures 10, 11 show a snapshot view at 0.005 sec of effects of multiple streams of 20μm HFE7100 droplets at 1000 cm/sec impinging on a flat hot wall with a heat flux of 60 W/cm2. Lateral average separation of the droplet streams is ~ 80μm and vertical separation is ~ 40μm. Due to rapid evaporation, a vapor layer is formed close to the wall permitting lateral remnant droplet mobility (sizzling) to occur. As lateral temperature gradients exist away from droplet impact centers, Maragoni convection from gradients in temperature-dependent surface tension
can occur to promote lateral mobility. Due to the small size of the droplets and the relatively low evaporation temperature (334.5K) of HFE 7100, evaporation is rapid due to the high heat flux value and droplet remnants can appear to ride above a vapor layer before ultimately vaporizing. From test-estimated droplet lateral and vertical separation distances and area extent of spray onto a surface, and given a particular coolant particle size, the nozzle flow rate can be estimated. Figure 10 (top)- Multiple drop velocity Figure 11 (bottom) fluid and wall temperatures Figures 12 and 13 illustrate the effects of low (250 cm/sec) and high speed (3000 cm/sec) 20μm diameter droplet impacts on a 20μm wall coolant film originating from prior droplet impacts that have not evaporated due to slow conductive heat transfer from the wall into the coolant. Here the high speed impact opens an open area on the flat wall limiting fluid-wall contact area subject to evaporative cooling. Note that this effect limiting evaporative heat transfer may be reduced by elevated island-deepened trough transfer magnitude. While very high heat flux values usually imply solutions involving a high coolant flow rate of
large size particles at high velocity, this avenue of solution for flat surfaces results in surface droplet splattering (Figures 12, 13 and 19) and open areas not subject to evaporative cooling thus limiting the heat transfer value. In combination with well-designed roughness patterns, higher heat flux conditions can be addressed as previously discussed. Additionally, higher heat flux conditions can be addressed through re-design of the spray nozzle to deliver reduced droplet diameters at lower impact velocities with reduced lateral spacing while potentially maintaining the same or increased mass flow rate, thereby attaining increased cooling potential with a reduction in the formation of splattered fragments. wall roughness that captures splattered fluid fragments and conducts them to heated wall areas to increase the heat Figure 12- Low speed impact-FLOW-3D Figure 13- High speed impact
Figure 14 - Heat transfer coefficient where, 2. Heat Transfer Coefficient Calculation Procedures and Application to Practical Problems Figures 14 and 15 indicate the procedure to determine a heat transfer coefficient (h) for spray cooling processes. Experimental observation of a 100μm water droplet on a 122˚C surface indicates 0.002 sec evaporation time and an h value of 53 W/cm2 K for complete evaporation (ηf = 1) of the droplet. Owing to impact/mixing phenomena described in previous sections, many factors (droplet fragmentation, high speed droplet splattering, surface film development, surface roughness, chamber pressure, droplet size, coolant thermophysical properties, flow rate, heat flux magnitude, etc.) influence the heat transfer coefficient thus limiting the ηf = 1 theoretical upper limit h value.
To determine h for a particular application, first spray characteristics are to be determined from high speed camera tests (Table 1) or, if possible, from nozzle manufacturer spray specifications given a supply pressure value corresponding to a given coolant flow rate. These data provide average droplet size and average droplet velocity. Given the nozzle flow rate at a given supply pressure and assuming a uniform spray distribution over the heat transfer area A, the number of droplets (n) of given mass (m) and diameter (D) impinging on a sub-area (As) of the total heat transfer area (A) over a given time (Δt) can be determined to match area scaled mass flow considerations. This permits an estimation of (or test-observed) average lateral and vertical droplet spacing. A CFD model of n properly spaced droplets is next made that will impact on As and CFD calculations run to determine the heat removed from the wall (Figure 16 for example) over Δt given a prescribed heat flux magnitude. This step involves the dimensional geometry of the heat transfer volume (V) and its thermophysical properties and wall roughness pattern (if present). After a steady-state solution is available from the CFD results, then δQ extracted from V is available and the h = δQ / As δt δT standard h definition format can be applied where δT = Tw – Te and where Tw is the average wall temperature over As from multiple droplet impacts of time δt. Presuming that the local h value over As extends over all of A as the flow distribution from the nozzle is spatially uniform, then an average h is determined for a specific die geometry or heat transfer surface application.
Figure 15 Flow rate determination Figure 15- Internal wall heat release Figure 16- Internal wall heat release Figure 17- Heat loss with time 3. Selection of Conditions for Optimal Heat Transfer
Figure 17 shows calculated results (from code written to incorporate FLOW-3D results) for heat loss Q from a given heat transfer volume with an internal heat flux of 30 W/cm2 with surface area A for a spary of 20μm HFE 7100 droplets. The curves shown are for flow rates ranging from a low 0.02 to high 2.0 cm3/sec per cm2 of surface area and represent the transient heat loss development over time from initiation of spray cooling on the surface of a material volume initially at room temperature. Of interest is the long-time extent of these curves as steady state operation is approached. For high flow rates associated with high droplet velocity and high heat flux conditions, droplet splattering occurs (Figures 13 and 19) leading to open areas not subject to evaporate cooling effects- therefore low h results. For low heat flux but high flow rate conditions, surface flooding occurs with a surface fluid layer heated mainly by heat conduction/convection but with limited capability to evaporate coolant due to the rapid arrival of low temperature droplets and fluid layer mixing. This also results in low h values. For low flow rate conditions and (very) high heat flux, die surface dry-out occurs dominated by very low h free convection values for air-vapor mixtures within in the spray chamber. For low heat flux conditions, fluid surface layers form and from Section 2 considerations, h values are again low compared to cases for which evaporation and phase change dominate (Figures 10, 11 for example). Between these extremes, larger h values constant with time are expected for intermediate flow rates as indicated in Figure 16 results; at extreme low and high flow rates, h values can fluctuate in time and location due to phenomena described previously. While intermediate
flow rates apparently lead to optimal h values, smaller droplet sizes are advantageous (~ 20-50μm) as their smaller mass leads to more rapid heating, less tendency to cause splattering and splashing and short times required to evaporate. Coolants with lower evaporation temperature and hfg values (such as HFE 7100) also promote increased evaporation and heat transfer leading to higher h values. Effects of lower chamber pressure and/or a coolant with lower evaporation temperature are also conducive to higher heat transfer rates only if coolant hfg is high and remains so under reduced chamber pressure and evaporation is not impaired by vapor pressure increases. Provided coolant vapor/fluid runoff produced during heat transfer processes are extracted and recycled to liquid and reintroduced as spray in closed systems, no release of vapor occurs to ensure safety of operation. From Figure 17, curves that peak and then decrease (for higher flow rate cases) indicate that heat loss ultimately decreases with increasing time by the effects previous described once initial heat-up transients pass. For lower flow rates, heat loss decreases due mainly to fluid burnout/loss on the heated surface and the absence of evaporative cooling by free convective cooling at much lower heat transfer rates. Figure 17 indicates that higher flow rates always produce higher heat loss than lower rates but the key for optimizing heat transfer without unsteady fluid dynamic effects lies is droplet size selection and coolant type thermophysical properties. Figure 18 shows plots of Tw – Tevap where Tw is the wall temperature and Tevap is the coolant evaporation
temperature. For low flow rates, wall temperature continually increases while for high flow rates, lower wall temperatures result. Since splattering and fluid layer open areas occur at higher spray flow rates (Figures 13, 19) wall temperature naturally increases as the effective evaporative heat removal mechanism is somewhat reduced. Again, the fluid dynamic/heat transfer effects at low and high flow rates for low and high heat flux conditions previously described apply so that an intermediate flow rate that prevents unsteady heat transfer limiting conditions from occurring are the best option for sustained high and steady in time h values. Figure 18- Temperature change vs time Figure 19-High speed droplet splatter
Conclusions drawn from Figures 17 and 18 are specific to example parameter choices selected (heat flux, coolant type, droplet size, velocity and spatial distribution, flow rate, etc). Use of the program for other parameter choices to determine optimal h selection is, of course, required. 4. Conclusions Spray cooling heat transfer applications involve complex phase change and fluid mixing interactions between spray droplets and coolant films on heated surfaces in the presence of large internal heat flux conditions. Due to the spatial and temporal chaotic nature of interactions involving vapor region creation/extinction processes together with droplet impacts initiating interacting fluid wave structures affecting the free surface of coolant layers, a heat transfer coefficient based on a parameter selection of droplet size, coolant properties, droplet velocity, heat flux magnitude, nozzle types and operating pressure, flow rate, spray patterns, die materials, wall roughness, surface inclination relative to the spray direction, etc., selection of optimal heat transfer coefficient is not straightforward. However, to at least estimate a heat transfer coefficient (h) based upon the more important of these parameters, a program has been developed incorporating the lessons from many parameter variation studies (some of which are presented in this report) to aid in estimation of h for various applications. Further tests together with use of the program can provide foundation data for development of heat transfer correlation relationships involving key parameters. While overall heat transfer results may be obtained from extensive tests, little information
about detailed micro-physical interactions between droplets and a heated wall are available from these “black box” input-output tests. Comprehensive correlation development would involve a large test matrix involving all possible variations of the above parameters which would be economically impractical- thus using test criteria for selection of optimum spray cooling parameter sets to achieve high rates of heat transfer for different applications remains a costly exercise. To avoid lengthy and expensive testing and provide guidance for optimum heat transfer parameter selection for a given application, recourse to FLOW-3D CFD examples to provide “lessons” from example cases together with a program utilizing details of different size coolant droplet trains emanating from a spray nozzle at different velocities was developed that can be applied to specific applications. The example studies shown provide micro-details of droplet-heated wall and droplet-fluid wall layer interaction from multiple droplet impacts over a sub-area of the heat transfer area and serve as “lesson” guides to understand the fluid dynamic, heat transfer process underlying Figures 17 and 18. Inherent to CFD analysis, results obtained for the sub-area are assumed to apply uniformly to the total heat transfer area (assuming spray distribution uniformity) permitting a global heat transfer coefficient to be found. Since high heat flux values are currently of interest for the next generation of electronics cooling applications, generalizations drawn from the example cases together with use of the program behind Figures 17 and 18 can be used to evaluate effects of parameter variations on heat transfer and provide guidance for
best parameter choices. From FLOW-3D CFD example cases where fluid burnout occurs (leading to hot spots), surface flooding occurs (leading to low heat transfer), and droplet splattering at high flow rates occurs (leading to open, low heat transfer areas), some general rules to avoid these limiting cases are provided from Figure 17 and 18 results. In summary, for high flow rate, high heat flux cases, droplet splattering occurs with open wall surface areas leading to low h values; for low heat flux conditions, surface flooding occurs limiting evaporative cooling resulting in low h values. For low flow rate, high heat flux conditions, wall “dry spots” result again producing low h values; for low heat flux and low flow rates, surface flooding and wall layers develop limiting evaporative cooling. From program results, limiting heat flux, coolant flow rate conditions for die burnout may be obtained for flat die surfaces. For high heat flux cases of interest, a surface roughness pattern was proposed to produce amplified heat transfer. While example cases presented are necessarily limited in this report, the methodology and computer programs to investigate further combinations of key parameters is available from the authors for given applications. 5. References 1. FLOW-3D Applications Manual 2009. Flow Science, Inc. Santa Fe, New Mexico. 2. B. Horacek, K. Kiger and J. Kim, “Single Nozzle Spray Cooling Heat Transfer Mechanisms”, International Journal of Heat and Mass Transfer, Vol.8, Issue 8, 2005.
3. J. Wendelstorf, J. Wendelstorf, and K. Spitzer, “Spray Cooling Heat Transfer and Calculation of Water Impact Density for Cooling of Steel Sheet Materials”, Steel Research International, Vol. 80, Issue 9, 2009. 4. Z. Yan, K. Toh, F. Yuan, T. Wong, K. Chao, K. Chan and P. Chua, “Heat Transfer Characteristics of Impingement Spray Cooling Systems for Electronic Test Cards”, Proceedings of Computer and Automation Engineering 2nd International Conference, Singapore, 2010. 5. J. Kim, “Spray Cooling Heat Transfer: The State of the Art”, International Journal of Heat and Fluid Flow, Vol. 28, Issue 4, 2007. 6. W. Cheng, Q. Liu, R, Zhao and H. Fan, “Experimental Investigation of Parameters Effect on Heat Transfer of Spray Cooling”, Journal of Heat and Mass Transfer, Vol. 46, No. 8-9, 2010. 7. B. Horacek, J. Kim and K. Kiger, “Spray Cooling of Singular and Multiple Nozzles: Visualization and Wall Heat Transfer Measurements”, IEEE Transactions on Device and Materials Reliability, Vol. 4, Issue 4, 2004. 8. V. Getkin, R. Zhang, M. Vogel, G. Xu, and M. Lee, “Substantiation of Numerical Analysis Methodology for CPU Package with Non-Uniform Heat Dissipation and Heat Sink with Simplified Fin Modeling”, Proceedings of the Ninth International Conference on Thermal and Thermomechanical Phenomena in Electronic Systems, 2004. 9. G. Xu, B.Guenin, and M. Vogel, “Extension of Air Cooling for High
Power Processors, Proceedings of the Ninth International Conference on Thermal and Thermomechanical Phenomena in Electronic Systems, 2004. 10. N.S. Kim, T. Austin, D. Blaauw, T. Mudge, K. Flautner, J.S.Hu, M.J. Irwin, M. Kandemir, and V. Narayanan, “Leakage Current: Moore’s Law Meets Static Power”, IEEE Computer, Vol. 36, No.12, pp. 68-75, 2003. 11. S. Mukhopadhyay, A. Raychowdhury, and K. Roy, “Accurate Estimation of Total Leakage Current in Scaled CMOS Logic Circuits Based on Compact Current Modeling”, Proceedings of the Design Automation Conference, pp. 169-174, 2003. 12. F. Fallah, and M. Pedram, “Circuit and System Level Power Management”, Chapter 13, of M. Pedram and J.M Rabaey, “Power Aware Design Methodologies, 2002, Kluwer Academic Publishers.