by Standard & Poor’s Financial Services LLC. All rights reserved.
S&P’s ERM Framework
Sridhar Manyem
Director, Enterprise Risk Management
Financial Services Ratings
May 2015
Overview of S&P’s ERM Framework
S&P’s ERM Scores For North American & Bermudian Insurers
S&P’s ERM Benchmarking Review
S&P’s Economic Capital Analysis
2
Agenda
Overview of S&P’s ERM
Framework & Scores
4
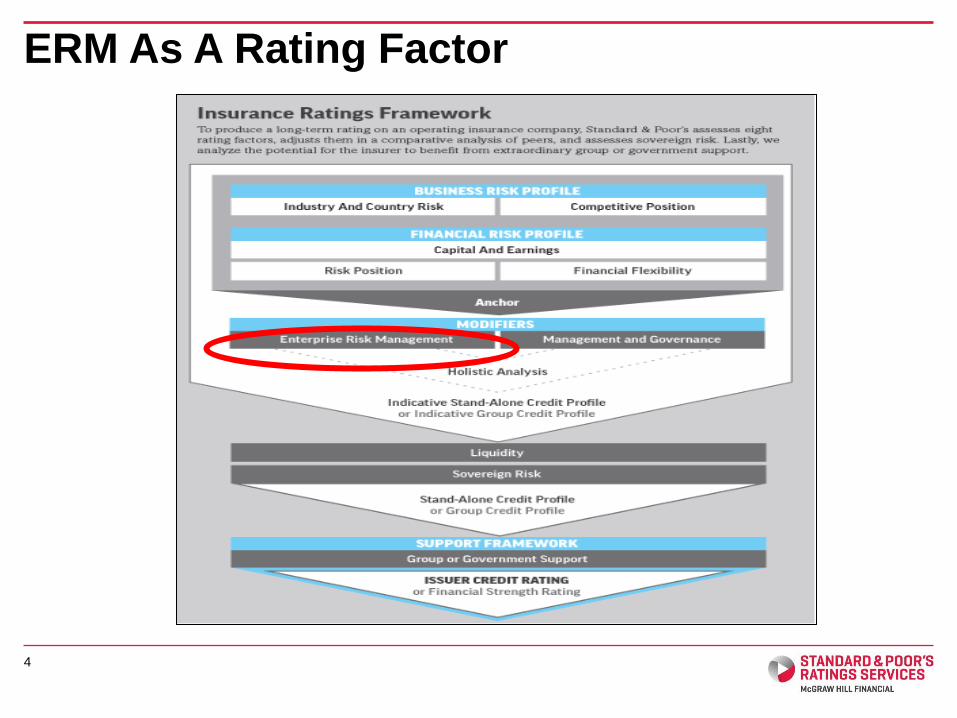
ERM As A Rating Factor
5
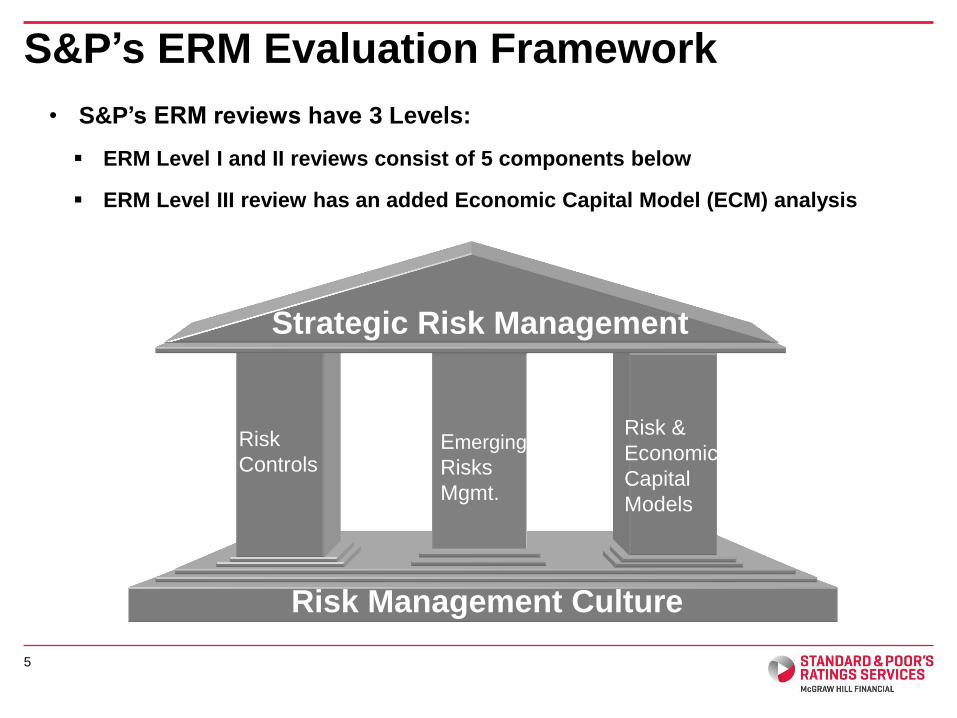
S&P’s ERM Evaluation Framework
• S&P’s ERM reviews have 3 Levels:
ERM Level I and II reviews consist of 5 components below
ERM Level III review has an added Economic Capital Model (ECM) analysis
Risk Management Culture
Risk
Controls Emerging
Risks
Mgmt.
Risk &
Economic
Capital
Models
Strategic Risk Management
• An insurer's ERM is scored as very strong (1), strong (2), adequate with strong risk controls (3), adequate (4) or weak (5) based on the assessments of the five sub-factors, which we classify as positive, neutral, or negative
• The analysis is evidence based- An insurer receives a neutral score for any of the five sub-factors where evidence is insufficient to assign either a positive or a negative score
6
S&P’s ERM Assessment Guidelines
7
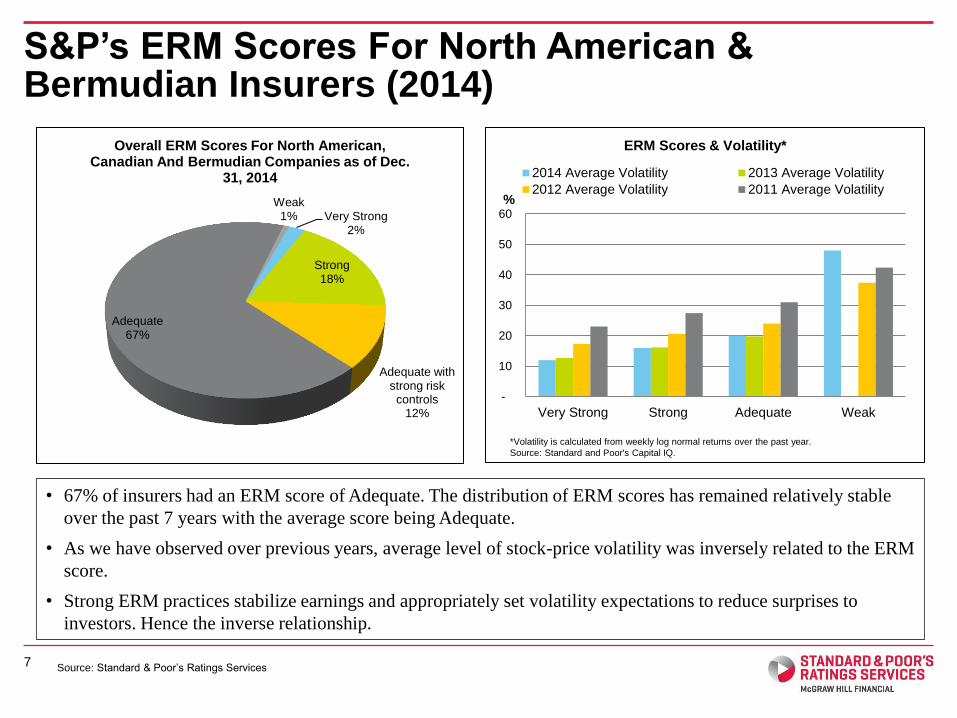
S&P’s ERM Scores For North American & Bermudian Insurers (2014)
• 67% of insurers had an ERM score of Adequate. The distribution of ERM scores has remained relatively stable
over the past 7 years with the average score being Adequate.
• As we have observed over previous years, average level of stock-price volatility was inversely related to the ERM
score.
• Strong ERM practices stabilize earnings and appropriately set volatility expectations to reduce surprises to
investors. Hence the inverse relationship.
Source: Standard & Poor’s Ratings Services
Very Strong 2%
Strong 18%
Adequate with strong risk controls
12%
Adequate 67%
Weak 1%
Overall ERM Scores For North American, Canadian And Bermudian Companies as of Dec.
31, 2014
-
10
20
30
40
50
60
Very Strong Strong Adequate Weak
%
ERM Scores & Volatility*
2014 Average Volatility 2013 Average Volatility
2012 Average Volatility 2011 Average Volatility
*Volatility is calculated from weekly log normal returns over the past year.
Source: Standard and Poor's Capital IQ.
S&P’s ERM Benchmarking
Review
• Insurers with higher ERM scores are closest to meeting the deadline for submitting their
self-assessments to NAIC regulators.
• Many insurers consider regulatory and legal changes some of the biggest risks they face,
while threats to the integrity of their IT systems remain a concern.
• Although most insurers will benchmark business risks against capital, the definition of what
constitutes that capital can vary widely.
• Comparing risk tolerances among insurers in some categories--such as for catastrophe
coverage—is complicated by the use of disparate models that can yield different results.
Highlights of 2014 ERM Survey
10
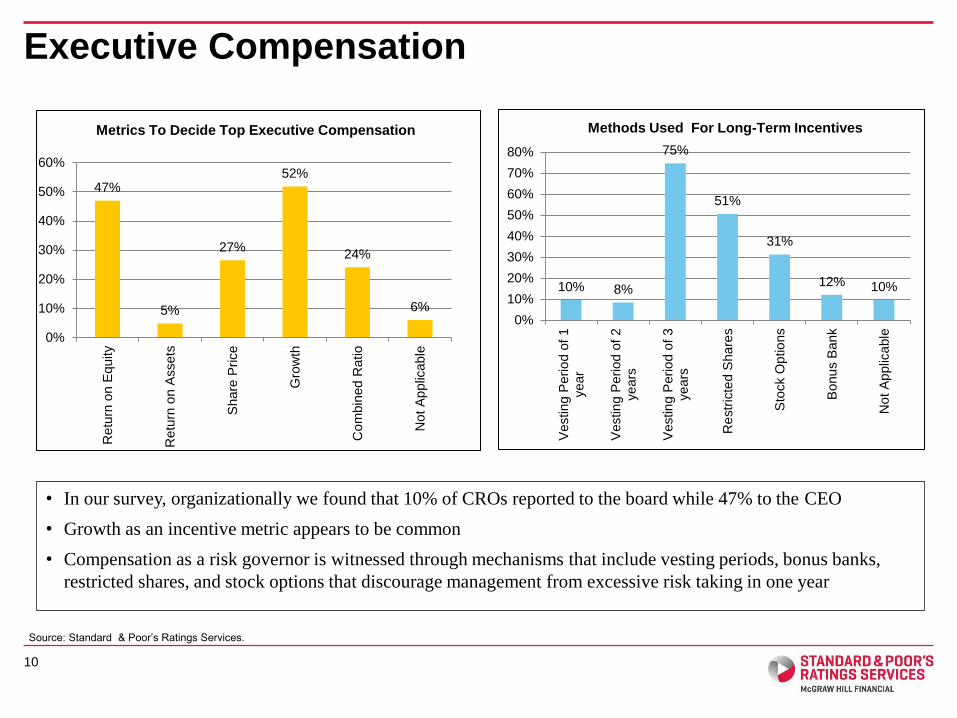
Executive Compensation
• In our survey, organizationally we found that 10% of CROs reported to the board while 47% to the CEO
• Growth as an incentive metric appears to be common
• Compensation as a risk governor is witnessed through mechanisms that include vesting periods, bonus banks,
restricted shares, and stock options that discourage management from excessive risk taking in one year
10% 8%
75%
51%
31%
12% 10%
0%
10%
20%
30%
40%
50%
60%
70%
80%
Vestin
g P
erio
d o
f 1
year
Vestin
g P
erio
d o
f 2
years
Vestin
g P
erio
d o
f 3
years
Re
str
icte
d S
ha
res
Sto
ck O
ptio
ns
Bonu
s B
an
k
No
t A
pplic
able
Methods Used For Long-Term Incentives
47%
5%
27%
52%
24%
6%
0%
10%
20%
30%
40%
50%
60%
Re
turn
on E
quity
Re
turn
on A
ssets
Share
Price
Gro
wth
Co
mbin
ed
Ratio
No
t A
pplic
able
Metrics To Decide Top Executive Compensation
Source: Standard & Poor’s Ratings Services.
11
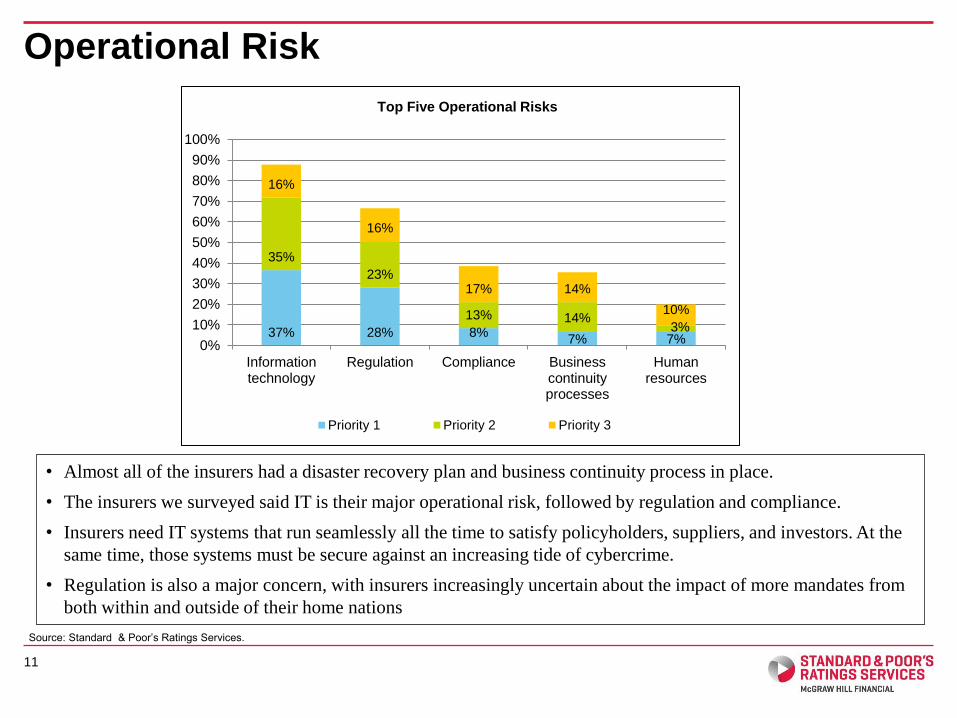
Operational Risk
• Almost all of the insurers had a disaster recovery plan and business continuity process in place.
• The insurers we surveyed said IT is their major operational risk, followed by regulation and compliance.
• Insurers need IT systems that run seamlessly all the time to satisfy policyholders, suppliers, and investors. At the
same time, those systems must be secure against an increasing tide of cybercrime.
• Regulation is also a major concern, with insurers increasingly uncertain about the impact of more mandates from
both within and outside of their home nations
37% 28% 8% 7% 7%
35%
23%
13% 14% 3%
16%
16%
17% 14%
10%
0%
10%
20%
30%
40%
50%
60%
70%
80%
90%
100%
Informationtechnology
Regulation Compliance Businesscontinuityprocesses
Humanresources
Top Five Operational Risks
Priority 1 Priority 2 Priority 3
Source: Standard & Poor’s Ratings Services.
12
Internal Models Will Be A Key Focus In The Future
• Almost 73% of the respondents had some form of internal economic or risk capital model
• Given that regulatory capital acts as a minimum, it is not surprising that 89% of companies have internal targets
greater than the regulatory capital.
• Internal models in our surveyed group are likely to range from a customized rating agency or regulatory model to
a sophisticated dynamic financial analysis (DFA) model
42%
47%
11%
Required Risk Capital Vs. Regulatory Capital
Greater than regulatory capital
Greater than twice the regulatory required capital
Lesser than regulatory capital
25%
22%
11%
28%
14%
Basis for Internal capital model
Cash flow model (Life/Health)
DFA (relationship based on ESG)
Factor Driven
Individual risk towers aggregated through correlations
Scenario based
Source: Standard & Poor’s Ratings Services.
13
Capital Allocation and Strategic Risk Management
• Metrics such as capital (89%) and ROE (72%) are popular among P/C insurers whereas life and health companies
used capital (90%) and IRR (75%) to compare strategic risk options
• Companies used various types of capital to allocate to various risk but regulatory capital, Stat surplus, GAAP
equity and required economic capital were more common
• Life and health companies tend to use regulatory capital in their strategic management decisions more than P/C
companies.
36% 37% 39%
16%
42%
22%
0%
5%
10%
15%
20%
25%
30%
35%
40%
45%
GAAPEquity
StatSurplus
RequiredEconomic
Capital
AvailableEconomic
Capital
RegulatoryCapital
RatingAgencyCapital
Type Of Capital Allocated
Source: Standard & Poor’s Ratings Services
88%
67%
34%
65%
37% 31%
0%
10%
20%
30%
40%
50%
60%
70%
80%
90%
100%
Capital IRR Earningat Risk(EaR)
ROE RAROC Others
Metrics Used To Compare Strategic Options
IRR – Internal Rate of Return , ROE– Return on Equity, RAROC-Risk Adjusted Return on Capital
S&P’s Economic Capital
Analysis
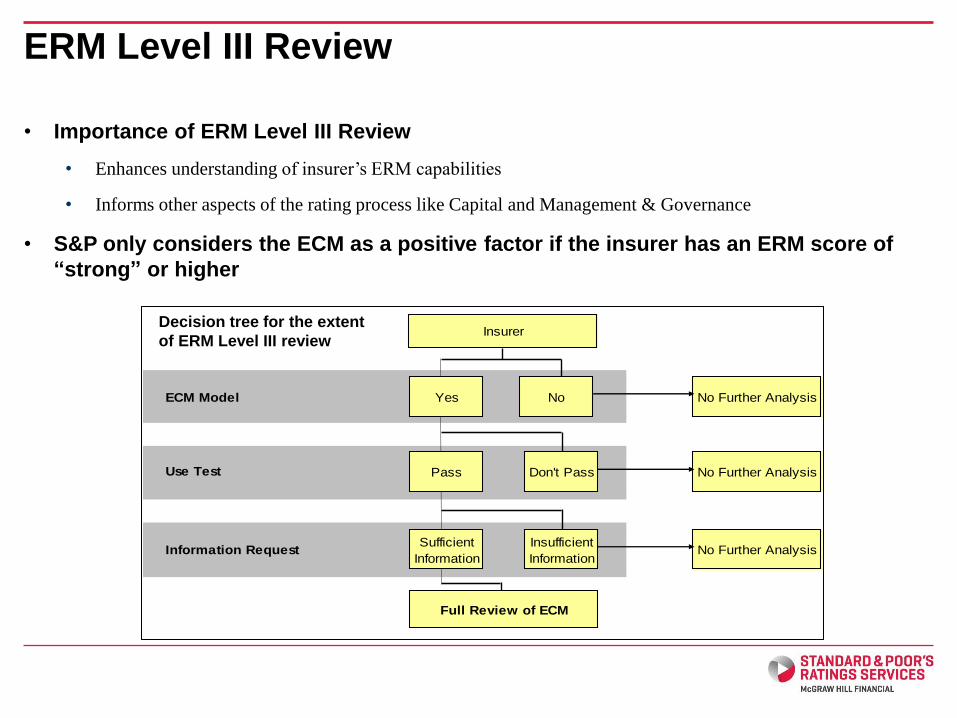
• Importance of ERM Level III Review
• Enhances understanding of insurer’s ERM capabilities
• Informs other aspects of the rating process like Capital and Management & Governance
• S&P only considers the ECM as a positive factor if the insurer has an ERM score of
“strong” or higher
ERM Level III Review
ECM Model Yes No No Further Analysis
Use Test Pass No No Further Analysis
Sufficient Insufficient
Information Information
Insurer
No Further AnalysisInformation Request
Full Revew of ECM
Yes
Pass
Sufficient
Information
No
Don't Pass
Insufficient
Information
No Further Analysis
No Further Analysis
No Further Analysis
Insurer
Full Review of ECM
Decision tree for the extent
of ERM Level III review
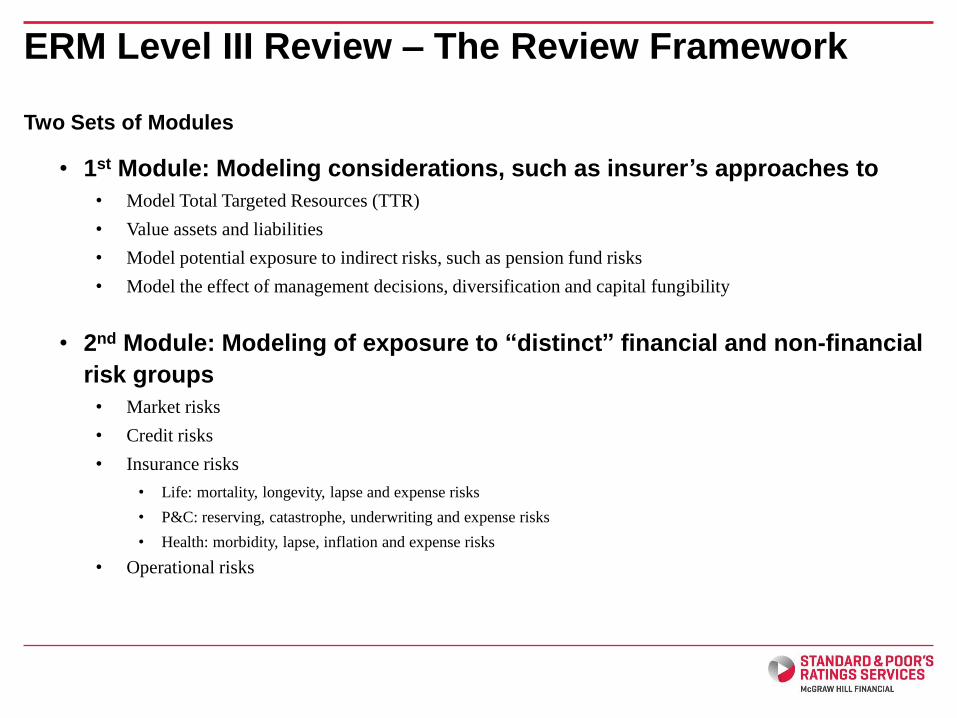
Two Sets of Modules
• 1st Module: Modeling considerations, such as insurer’s approaches to
• Model Total Targeted Resources (TTR)
• Value assets and liabilities
• Model potential exposure to indirect risks, such as pension fund risks
• Model the effect of management decisions, diversification and capital fungibility
• 2nd Module: Modeling of exposure to “distinct” financial and non-financial
risk groups
• Market risks
• Credit risks
• Insurance risks
• Life: mortality, longevity, lapse and expense risks
• P&C: reserving, catastrophe, underwriting and expense risks
• Health: morbidity, lapse, inflation and expense risks
• Operational risks
ERM Level III Review – The Review Framework
• For each risk, S&P reviews the following five categories
• Methodology
• Data Quality
• Assumptions and Parameterization
• Process and Execution
• Testing and Validation
• S&P assigns a score of “basic”, “good” or “superior” to each category
• Overall ECM assessment combines scores of the risk modules
• The use of ERM Level III results in S&P’s capital adequacy assessment
• “M-Factor” reflects S&P’s view of the robustness of the insurer’s ECM
• S&P’s capital model results may be adjusted, based on the insurer’s ECM model results, using the M-Factor
• We expect to see relatively low M-Factors in the beginning
• Impact of “M-factor” on our view of capital is limited to one full rating category up or down
ERM Level III Review – The Review Framework
ERM Level III Review – Economic Capital Model
• Review of Economic Capital Models for Insurance
– Insurers generally have “Good” assessments in
Modeling framework
Model governance
Modeling of main risks
– Areas of improvement:
Modeling of diversification
Fungibility of capital
Long term options and guarantees
– Solvency II
May lead to model convergence
Has put pressure on insurers to improve validation and governance
• The balance between a model’s complexity and expediency
• Correlation / Diversification
• Documentation
• Parameterization
• Validation
Common Challenges in ECM Reviews
Permission to reprint or distribute any content from this presentation requires the prior written approval of
No content (including ratings, credit-related analyses and data, valuations, model, software or other application or output therefrom) or any part thereof (Content) may be modified,
reverse engineered, reproduced or distributed in any form by any means, or stored in a database or retrieval system, without the prior written permission of Standard & Poor’s
Financial Services LLC or its affiliates (collectively, S&P). The Content shall not be used for any unlawful or unauthorized purposes. S&P and any third-party providers, as well as their
directors, officers, shareholders, employees or agents (collectively S&P Parties) do not guarantee the accuracy, completeness, timeliness or availability of the Content. S&P Parties
are not responsible for any errors or omissions (negligent or otherwise), regardless of the cause, for the results obtained from the use of the Content, or for the security or
maintenance of any data input by the user. The Content is provided on an “as is” basis. S&P PARTIES DISCLAIM ANY AND ALL EXPRESS OR IMPLIED WARRANTIES,
INCLUDING, BUT NOT LIMITED TO, ANY WARRANTIES OF MERCHANTABILITY OR FITNESS FOR A PARTICULAR PURPOSE OR USE, FREEDOM FROM BUGS,
SOFTWARE ERRORS OR DEFECTS, THAT THE CONTENT’S FUNCTIONING WILL BE UNINTERRUPTED OR THAT THE CONTENT WILL OPERATE WITH ANY SOFTWARE
OR HARDWARE CONFIGURATION. In no event shall S&P Parties be liable to any party for any direct, indirect, incidental, exemplary, compensatory, punitive, special or
consequential damages, costs, expenses, legal fees, or losses (including, without limitation, lost income or lost profits and opportunity costs or losses caused by negligence) in
connection with any use of the Content even if advised of the possibility of such damages.
Credit-related and other analyses, including ratings, and statements in the Content are statements of opinion as of the date they are expressed and not statements of fact. S&P’s
opinions, analyses and rating acknowledgment decisions (described below) are not recommendations to purchase, hold, or sell any securities or to make any investment decisions,
and do not address the suitability of any security. S&P assumes no obligation to update the Content following publication in any form or format. The Content should not be relied on
and is not a substitute for the skill, judgment and experience of the user, its management, employees, advisors and/or clients when making investment and other business decisions.
S&P does not act as a fiduciary or an investment advisor except where registered as such. While S&P has obtained information from sources it believes to be reliable, S&P does not
perform an audit and undertakes no duty of due diligence or independent verification of any information it receives.
To the extent that regulatory authorities allow a rating agency to acknowledge in one jurisdiction a rating issued in another jurisdiction for certain regulatory purposes, S&P reserves
the right to assign, withdraw or suspend such acknowledgement at any time and in its sole discretion. S&P Parties disclaim any duty whatsoever arising out of the assignment,
withdrawal or suspension of an acknowledgment as well as any liability for any damage alleged to have been suffered on account thereof.
S&P keeps certain activities of its business units separate from each other in order to preserve the independence and objectivity of their respective activities. As a result, certain
business units of S&P may have information that is not available to other S&P business units. S&P has established policies and procedures to maintain the confidentiality of certain
non-public information received in connection with each analytical process.
S&P may receive compensation for its ratings and certain analyses, normally from issuers or underwriters of securities or from obligors. S&P reserves the right to disseminate its
opinions and analyses. S&P's public ratings and analyses are made available on its Web sites, www.standardandpoors.com (free of charge), and www.ratingsdirect.com and
www.globalcreditportal.com (subscription), and may be distributed through other means, including via S&P publications and third-party redistributors. Additional information about our
ratings fees is available at www.standardandpoors.com/usratingsfees.
STANDARD & POOR’S, S&P, GLOBAL CREDIT PORTAL and RATINGSDIRECT are registered trademarks of Standard & Poor’s Financial Services LLC.