82
SCIENCE PROCESS SKILLS
| Date post: | 29-Nov-2014 |
| Category: |
Education |
| Upload: | marzita-omar |
| View: | 781 times |
| Download: | 3 times |

SCIENCE PROCESS SKILLS

SCIENCE PROCESS SKILLS

WHAT are the SCIENCE PROCESS SKILLS?1. Observing
2. classifying
3. Measuring and using numbers
4. making inferences
5. predicting
6. Communicating
7. Using space-time relationship
8. interpreting data
9. Defining operationally
10. Controlling variables
11. Making hypotheses
12. experimenting

HOW DO YOU TEACH SCIENCE PROCESS SKILLS?

Basically, you encourage a person to
ask questions, formulate a hypothesis,
design and run an experiment to test the
hypothesis and evaluate (analyze) the
result

observing
1. OBSERVING
Using your 5 senses effectively
observing
OBSERVING

observing
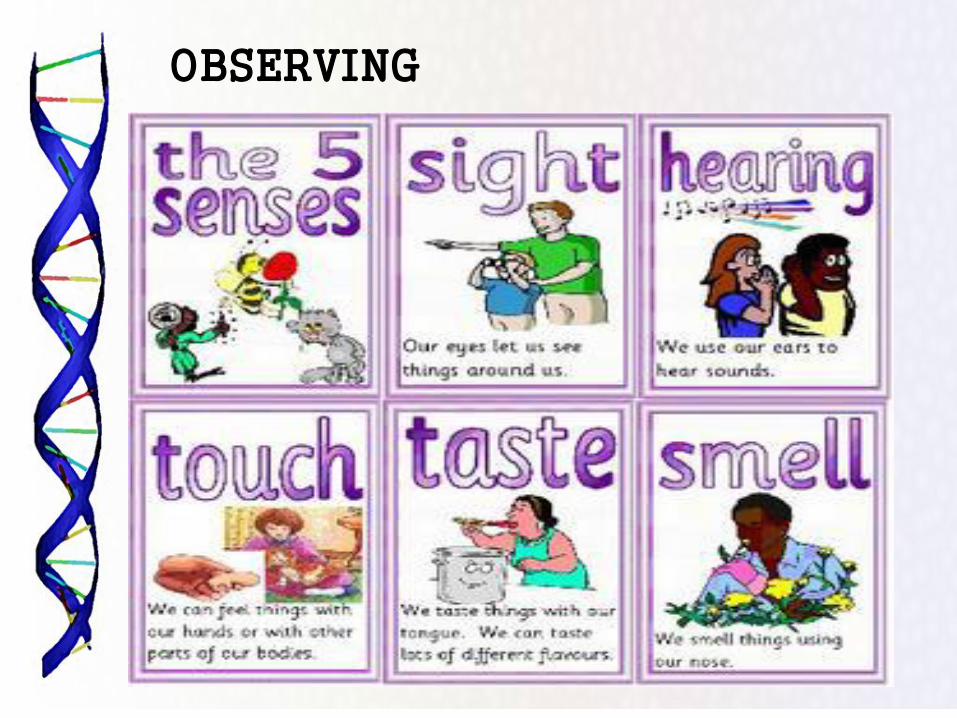
OBSERVINGUsing the 5 senses (see, hear, touch, smell, taste) to
find out about objects and events, their characteristics,
properties, differences, similarities, and changes
Qualitative – using the senses
Quantitative – using exact measurement
Observations are recorded.
Example: Describing a pencil as yellow.

observing
Identifying relevant particulars of
an objects and its environment.
OBSERVING

observing
Identifying relevant particulars of an objects and its environment

observing
Focusing on relevant particulars from massive information.

observing
Identifying similarities and differences.

observing
Identifying similarities and differences.

Identifying strange / unusual features.

observing
Identifying strange / unusual features.

observing
Realizing changes in environment.
melting ice

Identifying the correct sequence.

observing
Identifying the correct sequence.

observing
Using appropriate instrument(s) to enhance senses for the details.

2. CLASSIFYING
Using observation to group or order objects or events according to similarities or differences in properties
Example: Placing all rocks having certain grain size or hardness into one group.

classifying
WHY DO WE NEED TO CLASSIFY?
1.Too many items or information.
2. Items or information are not organized

classifying
HOW DO WE CLASSIFY ?
1.Identify the general characteristics of the items.
2. Sort out items of the same characteristics into their respective group.
3. Identify other characteristic.
4. Repeat step 1-3 until there is only one item in each group.

classifying
You are classifying when you are ...
1. Detecting similarities.
2. Grouping objects based on certain criterion.
3. Using other criterion in grouping objects.
4. Grouping objects in different ways.

CLASSIFY……

Detecting similarities
same color
same shape
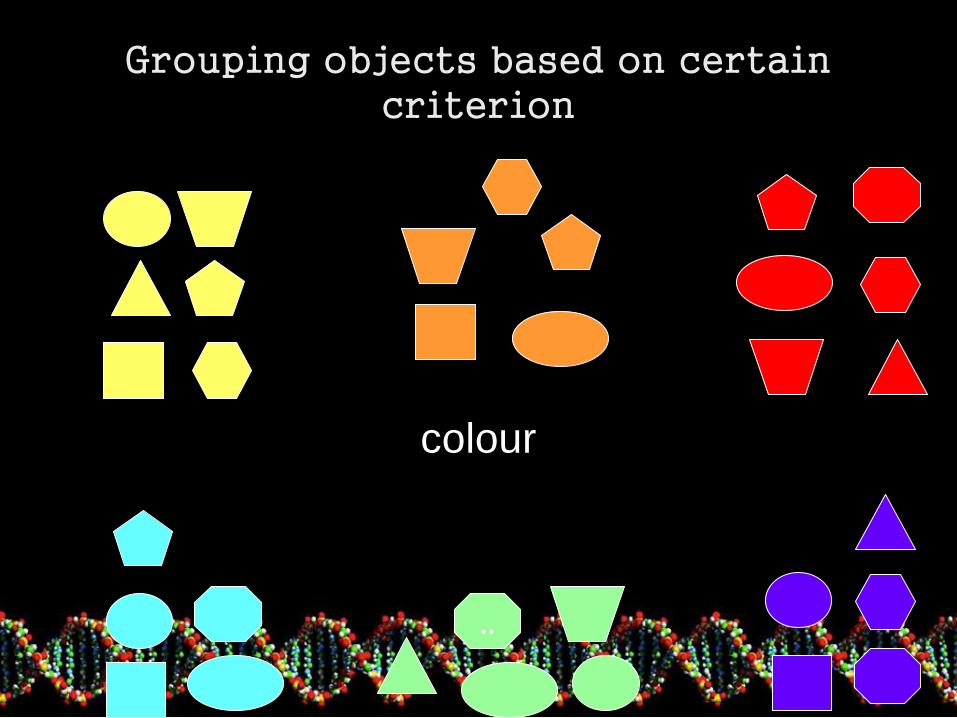
Grouping objects based on certain criterion
colour
..

Using other criterion in grouping objects
shape
..
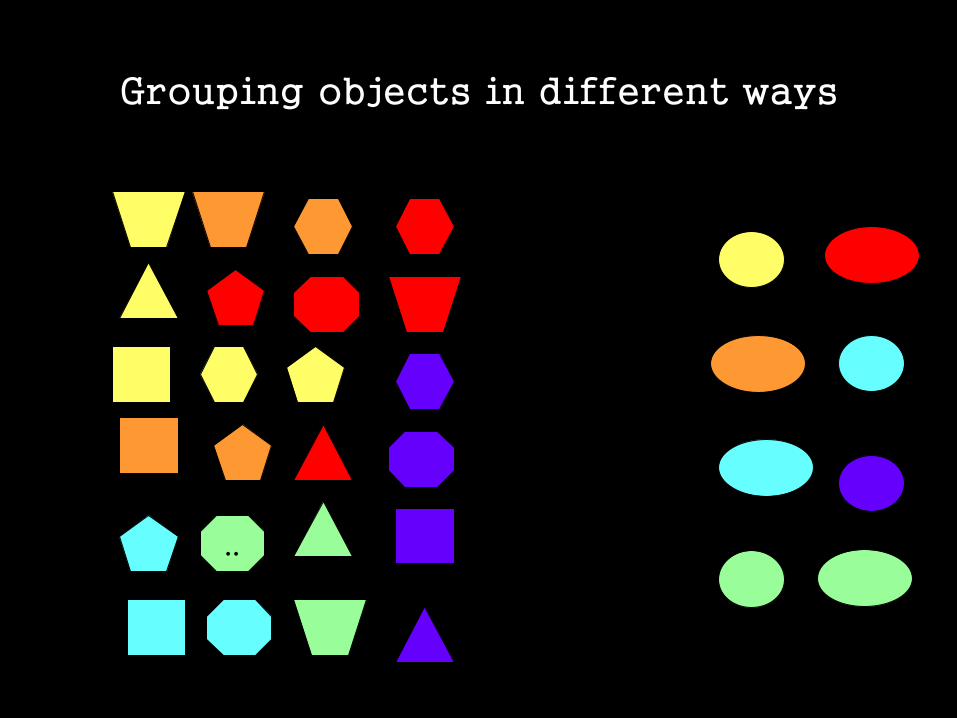
Grouping objects in different ways
..

classifying
Application of classifying

classifying
Application of classifying

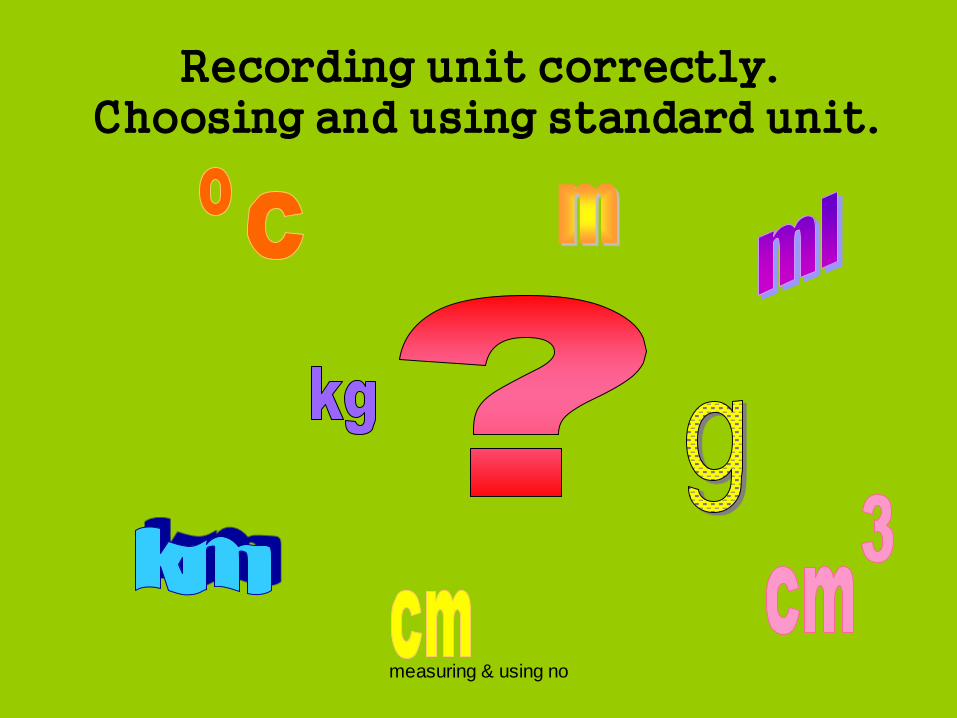
3. MEASURING AND USING NUMBERS
Comparing an unknown quantity with a known (metric units, time, student-generated frames of reference) unit
Observations are quantified using proper measuring devices and techniques

measuring & using no
• Measurements are to be recorded in an orderly and systematic fashion with labeled units of measure. Charts, graphs, or tables can be generated manually or with computer software.

measuring & using no
You are measuring and
using numbers
when you are……

measuring & using no
Able to count and compare quantity of items in different groups.

measuring & using no
Able to count and compare quantity of items in different groups.

measuring & using no
Able to count and compare quantity of items in one group
Genetic diversity in maize
Count and compare the
numbers of seeds which are
black, white and red in colour

measuring & using no
Able to recognize the pattern from a table of numbers.

measuring & using no
Using numbers to record phenomenon
0 - STOP
1 - ROTATE
2 - ROTATE FASTER
3 - FASTEST

measuring & using no
Using numbers to record phenomenon
Powder fall phenomenon
in Niseko Japan
- Count the powdered snow !!!

measuring & using no
Using scales and explaining ratios.

measuring & using no
Compare objects using numbers.

measuring & using no
Using tools correctly.
measuring & using no
Recording unit correctly.Choosing and using standard unit.

measuring & using no
Comparing time, distance, area and volume with relevant units.
Determining the accuracy in measurement

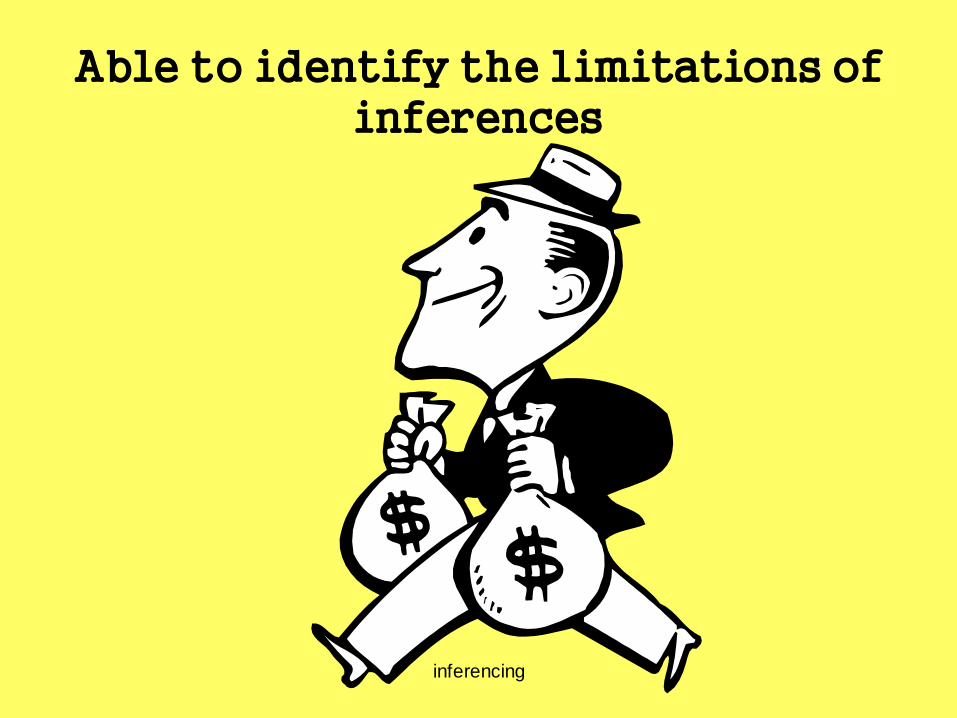
4. MAKING INFERENCES
Explanation or interpretation that follow from the observation.
• Making an "educated guess" about an object or event based on previously gathered data or information.

You are making
inferences when you
are……………

inferencing
Using information from observations to make reasonable
early conclusions.

inferencing
WHY IS THE COW SO FAT?
WHY IS THE COW SO FAT?

inferencing
MAKING INFERENCES
When we are able to make inferences, and interpret and explain events around us, we have better appreciation of the environment around us

inferencing
Making various possible interpretations from single
observation.

inferencing
Making various possible interpretations from single
observation.
inferencing
Able to identify the limitations of inferences

inferencing

inferencing
Testing the accuracy of inferences through additional
observations.

inferencing
Using inferences as a tool to determine the appropriate
additional observations.

5. PREDICTING
Stating the outcome of a future event based on a pattern of evidence.
Example: Predicting the height
of a plant in two weeks time based on a graph of its growth during the previous four weeks.

You are predicting, when you are …………………

predict
Using pattern of data explicitly to make projections.
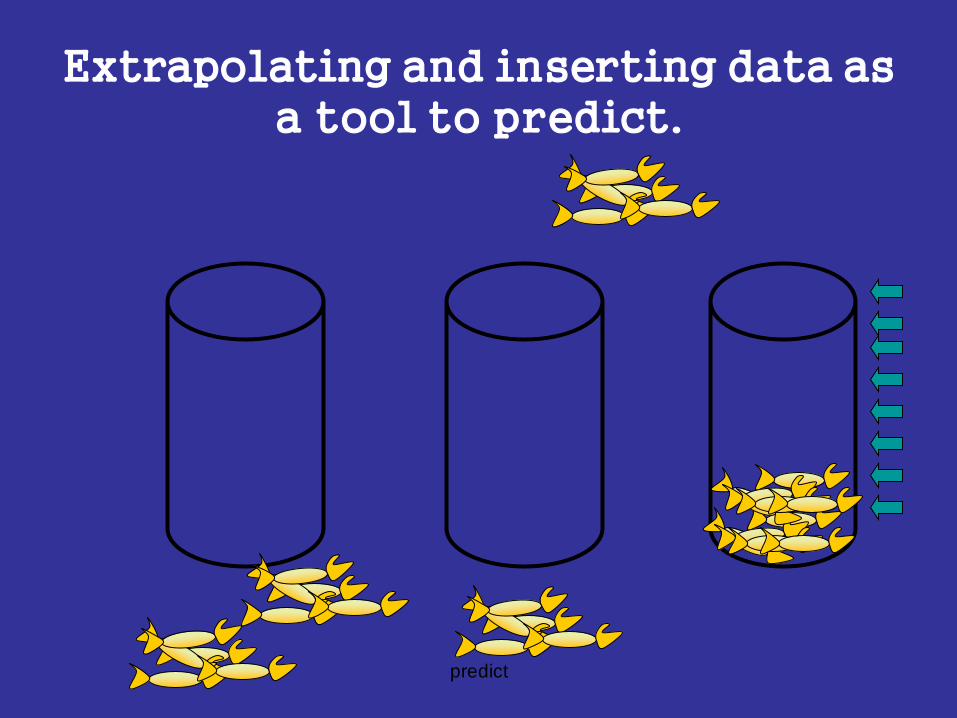
predict
Extrapolating and inserting data as a tool to predict.

6. COMMUNICATING
• using words (written and spoken) or
graphic symbols to describe an action,
object or event.
Example: Describing the change in height of a plant over time in writing, through a graph or drawing.

communicating
Using the written and spoken work, graphs, demonstrations, drawings, diagrams, or tables to transmit information and ideas to others
To reflect the true nature of science, ideas must be shared.

You are communicating
when you are….
• Speaking, listening or writing to express ideas or meanings.
• Using charts, graphs and tables to present information.
communicating
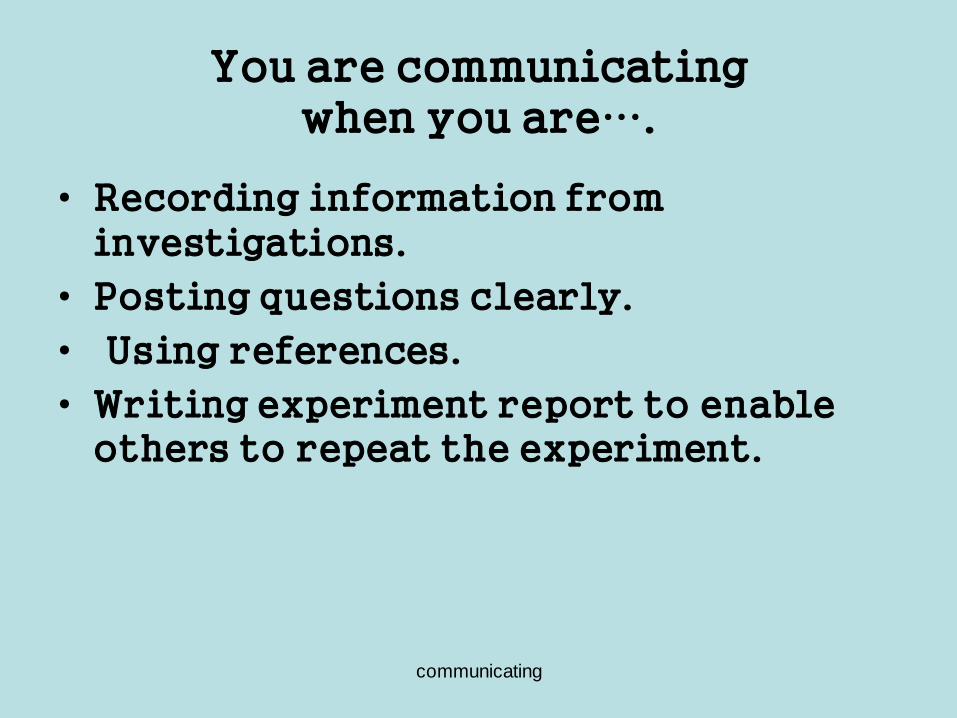
You are communicating when you are….
• Recording information from investigations.
• Posting questions clearly.
• Using references.
• Writing experiment report to enable others to repeat the experiment.

communicating
• Drawing and making notes.
It is brown in colour,
tastes sweet, rectangular and cone in shape

• Using and explaining the meaning of
symbols.
7. USING SPACE-TIME RELATIONSHIP
• Describing changes in parameter with time
• Parameters are location, direction, shape, size, volume, weight and mass.
• Applying numbers and their mathematical relationships to make decisions
Numbers are basic to science -mathematical knowledge is applied

Eg. Relationship between frequency of tetrahedron spin with time

8. INTERPRETING DATA(INTEGRATED SKILLS)
Organizing, analyzing, and synthesizing data using tables, graphs, and diagrams to locate patterns that lead to the construction of inferences, predictions, or hypotheses.

9. DEFINING OPERATIONALLY(INTEGRATED SKILLS)
• Creating a definition by describing what is done and observed
• It is in the language of thestudents.
• Definitions are in context of students' experiences - not from the glossary, not to be memorized.

DEFINING OPERATIONALLYStating how to measure a variable in an experiment.
Example: Stating that bean growth will be measured in centimeters per week.

DEFINING OPERATIONALLY• It is producing a definition of a thing
or event by giving a physical description or the results of a given procedure.
An acid turns blue litmus paper red and tastes sour.

10. CONTROLLING VARIABLES
Manipulating one factor to investigate the outcome of an event while other factors are held constant (keep the same)
Young children become confused with multiple variables. Students need practice in identifying variables that affect outcomes.

Identify variables in an investigation( What to keep the same, what to change
and what to observe)
Size of salt
Volume of water
Temperature of water
Rate of stir

11. MAKING HYPOTHESES
• Hypothesizing is stating a tentative generalization which may be used to explain a relatively large number of events. It is subject to immediate or eventual testing by experiments (to determine its validity)

Suggest suitable explanations in line with the evidence at hand
Quantity of
sugar
Time taken to
dissolve
5 spoons 10 min
3 spoons 5 min
1 spoon 2 min
Time taken for the sugar to dissolve increases as the quantity of sugar increases.

Be aware that there are more than one explanation for
events.
12. Experimenting (Designing a fair test)
• Designing experiments involves planning a
series of data-gathering operations which
will provide a basis for testing a hypothesis
or answering a question.
Example:
Automobile manufacturers test seat belt
performance in crash tests.

Be a scientifically literate teacher !!
• The scientifically literate person uses
processes of science in solving
problems, making decisions, and
furthering understanding of society and
the environment.

Science Process Skills
• "A Head Start on Science" emphasizes encouraging a sense of wonder within young children through their use of the science processes.

• Do not spoon-feed them specific
information about these objects and
phenomena.
• Rather, they are encouraged to expand their perceptions of the world by learning how better to observe such things :-
eg. as caterpillars changing into butterflies, how to compare the smells of various foods, how to classify leaves collected on a walk, and how to communicate what they have learned.

GOOD LUCKPrepared, researched and presented by:
Marzita Omar
Science Facilitator,