60
SPSS Statistical P ackage for the Social Sciences By Salem Almadhun 1
| Date post: | 18-Jul-2015 |
| Category: |
Software |
| Upload: | salemhusin |
| View: | 236 times |
| Download: | 1 times |

SPSS
Statistical Package for
the Social Sciences
By
Salem Almadhun
1

What is SPSS?
• SPSS is a program that can be used to perform data entry and analysis and to create tables and graphs.
• SPSS is capable of handling large amounts of data and can perform all analyses that you want.
2

Cont.…
• SPSS is commonly used in the Social Sciences and in the business world, so familiarity with this program should serve any one needs to analysis data.
3

Cont.…
• SPSS has two main windows:
1. The Data Editor window.
2. The Viewer window.
• The Data Editor window is divided into:
– Data View.
– Variable View.
4

Cont.…
• The Data View window is simply a grid with rows and columns.
• The rows represent subjects (cases or observations) and columns represent variables whose names should appear at the top of the columns.
5

The Data Editor window
6

Cont.…
• The Variable View window is also a simple grid with rows and columns.
• This window contains descriptions of the attributes of each variable that make up your data set.
7

The Variable View window
8

Cont.…
• The Viewer window is where results are displayed after a statistical procedure has been performed.
• It is divided into two main sections:
• The left pane contains an outline view of the output contents and the right pane contains statistical tables, charts, and text output.
9

The Viewer window
10

How to Make a Questionnaire?
1. Decide what you would like to learn from your questionnaire.
• This will help you come up with questions to ask and the order in which to ask them.
• Ask yourself how you will use the data and witch measure you want to use.
11

Cont..
2. Start writing out questions that can help you reach your goals.
Keep the questions and answers simple, using as few words as possible.
12

Cont..
3. Design your questionnaire based on the method in which it will be delivered.
Decide if you want to give clarifications to your questions if the respondent doesn't understand something.
13

Cont..
4. Ask questions that are very similar but worded differently.
This will give you a better chance at finding the person's true opinion on a given topic.
14

Cont..
5. Order the questions so that if a person says yes or no to a certain question, they bypass any questions that don't apply to them.
This will help keep the questionnaire focused and take less time to complete
15

Cont..
6. Test your questionnaire before you begin surveying people
Friends, employees and family can be good testers.
You may need to reword some things, rearrange questions, make additions or delete questions that don't help you reach your end goal
16

17
Sample Questionnaire
1. What is your gender? Please tick 1: Male / Female
2. What is your date of birth? ……………………
3. What is the total number of years you completed in
an educational establishment? …….
4. Which employment category do you belong to?
Please select one:
o Manager
o Clerical
o Custodial
5. What is your current salary? ……………….
6. What was your beginning salary? …………..

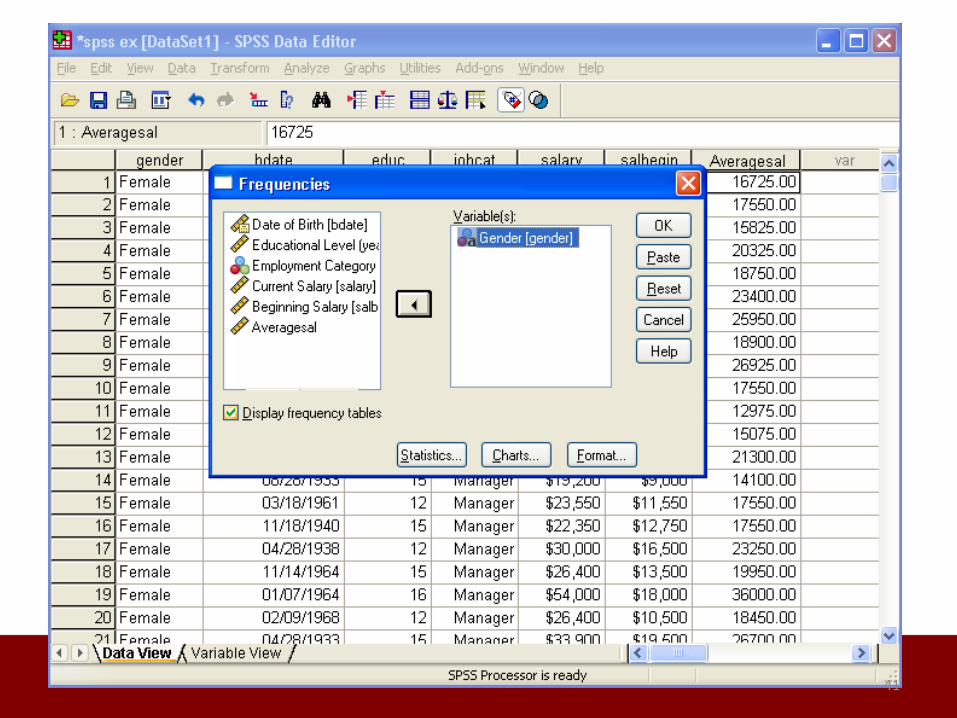
SPSS Form input
18

19

20
21

22
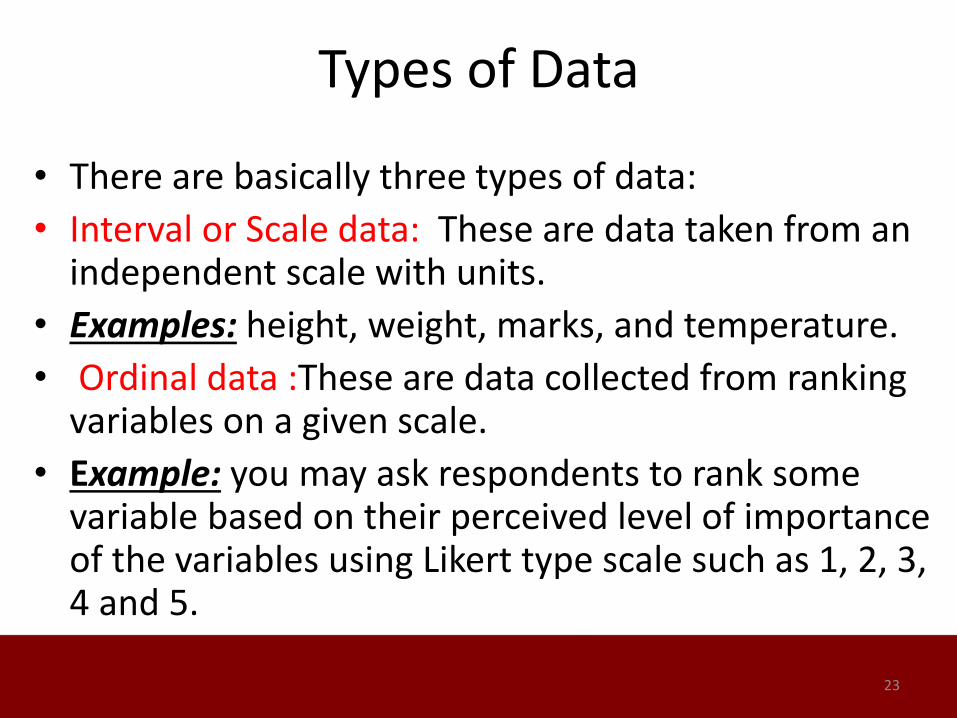
Types of Data
• There are basically three types of data:
• Interval or Scale data: These are data taken from an independent scale with units.
• Examples: height, weight, marks, and temperature.
• Ordinal data :These are data collected from ranking variables on a given scale.
• Example: you may ask respondents to rank some variable based on their perceived level of importance of the variables using Likert type scale such as 1, 2, 3, 4 and 5.
23

Types of Data
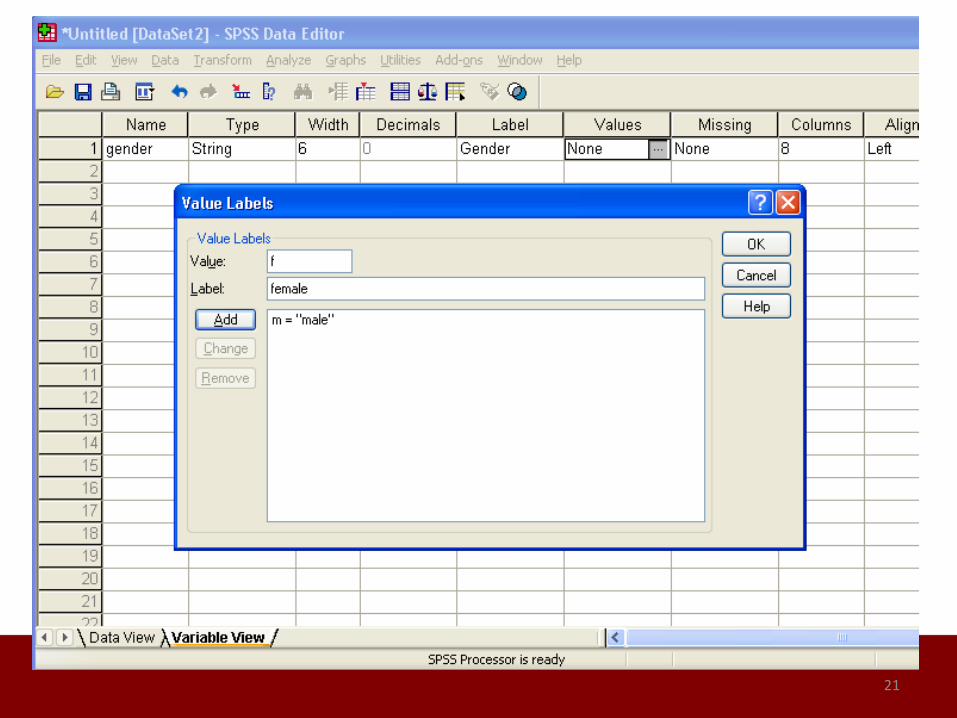
• Nominal data Examples: gender (male or female), nationality (British, American, African,.), etc.
• Both Interval and Ordinal data relate to quantitative variables while Nominal data refers to qualitative variables.
24

25

26

27

28

29

30

31

32

33

34

35

36
37

38

39
40
41

42

43

44

45
46

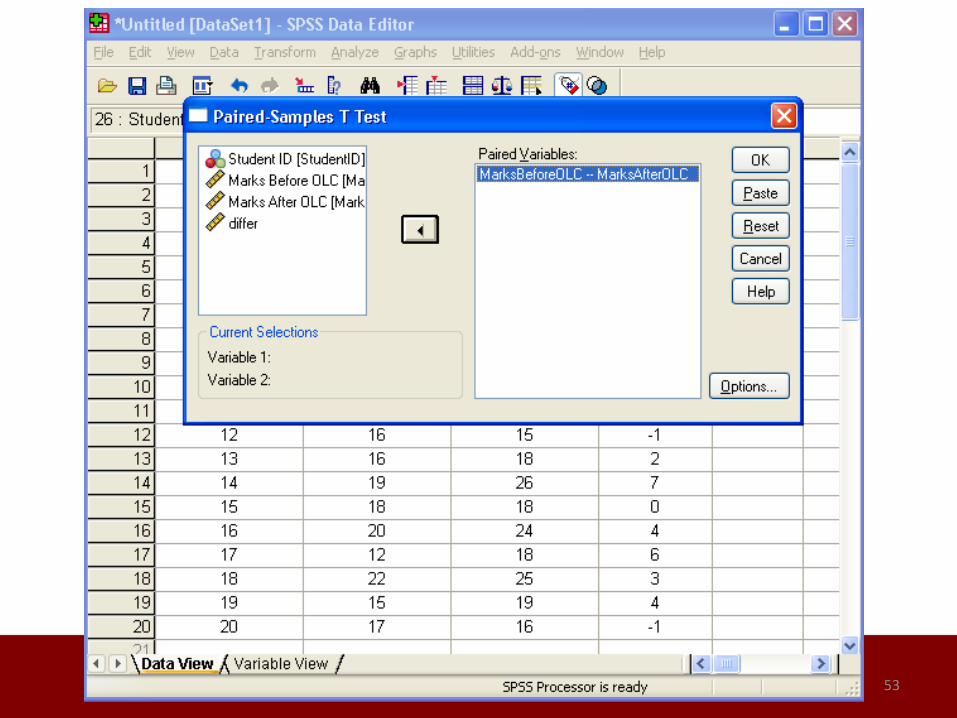
Paired T-test
• A paired T-test is used to compare between two means where you have two samples in which observations in one sample can be paired with observations in the other sample.
• Before-and-after observations on the same subjects.
47

48
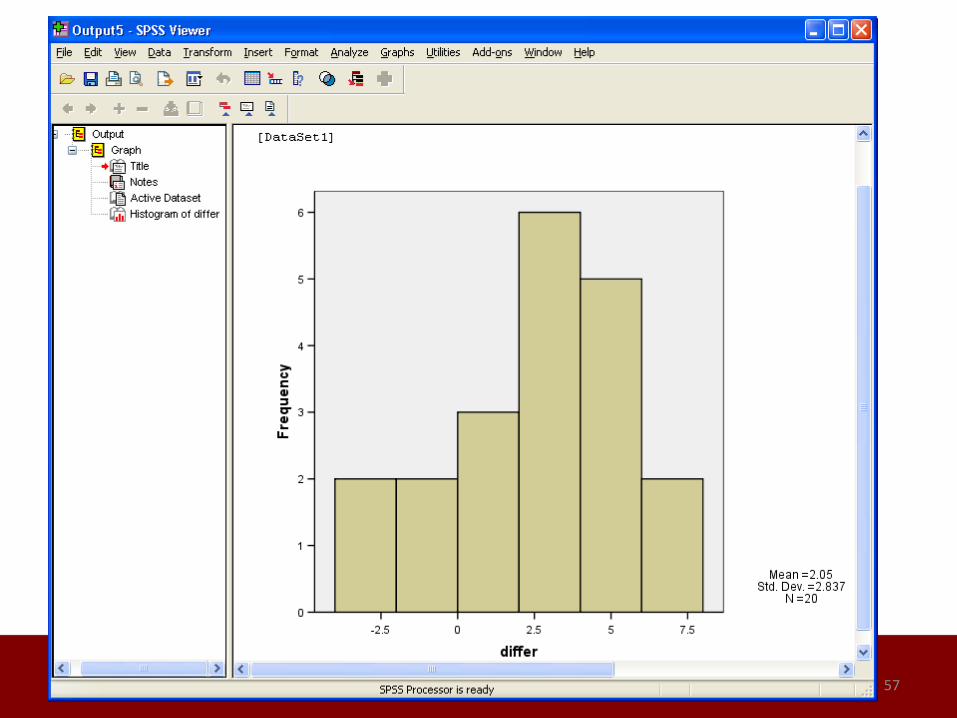
Student ID Marks Before OLC Marks After OLC Differ
1 18 22 4
2 21 25 4
3 16 17 1
4 22 24 2
5 19 16 -3
6 24 29 5
7 17 20 3
8 21 23 2
9 23 19 -4
10 18 20 2
11 14 15 1
12 16 15 -1
13 16 18 2
14 19 26 7
15 18 18 0
16 20 24 4
17 12 18 6
18 22 25 3
19 15 19 4
20 17 16 -1
OLC = Online Course

Cont.…
• Hypotheses:
• The ‘Null hypothesis' might be:
H 0 : There is no difference in mean Before-and-after marks (probability 0.05)
• And an ‘Alternative hypothesis' might be:
H 1 : There is difference in mean Before-and-after marks (probability 0.95)
49

50

51

52
53

54

55

56
57

58

Conclusion
• Using the SPSS package takes away the time-consuming tedium of computing statistics by hand and allows the researcher to concentrate on the conceptual aspects of his or her study.
• Of course, it is still important that the researcher understand the nature and use of statistical techniques.
59

Thank You
60


