70
SPT’s Cost of Capital – A Presentation for Ofgem 17 February 2011 Dr. Richard Hern Director Tomas Haug Senior Consultant
SPT’s Cost of Capital – A Presentation for Ofgem
17 February 2011
Dr. Richard Hern
Director
Tomas Haug
Senior Consultant

Content
� Ofgem’s initial range for the cost of capital
� NERA analysis of key factors affecting the cost of equity at RIIO-T1
� NERA analysis of historic betas
� Cost of equity – Preliminary analysis
1
� Impact of capex programme on SPT’s cost of equity
� Impact of Dividend Policy on Cost of Equity
� Cost of debt
– Debt indexation
– Recent utilities issues
� Appendix: Various further supporting evidence

Ofgem’s Initial Range for the Cost of Capital

Initial assessment of Ofgem’s real cost of equity range
� Ofgem’s low-end of 4.0% cost of equity is implausible
Low High
Gearing N/A N/A
Risk free rate 1.4 2.0
ERP 4.0 5.5
Asset Beta (number) N/A N/A
Equity Beta (number) 0.65 0.95
Cost of Equity (post-tax) 4.0 7.2
Ofgem’s Initial Range for the Real Cost of Equity
3
� Ofgem’s low-end of 4.0% cost of equity is implausible
– Significantly lower than other regulatory decisions worldwide
– Only slightly higher than recent Cost of Debt data
– Ofgem combines low-ends of parameters without regard to internal consistency
� Ofgem’s CoE is without reference to gearing, which is meaningless
– Equity beta low (but difficult to judge as no reference to gearing is made)
� No consideration of forward looking risks (even at the high end)
– Ofgem assert that financial markets will return to “normal” for RIIO-T1 but provide no evidence
� No cross-checks with wider market evidence (DGM, Market to Asset Ratios, etc.)
– E.g. if CoE = 4.0%, then UK utilities would historically have traded at much greater premiums

Ofgem’s allowed CoE and CoD shows a difference of 0.9-4.1%, which is out of line compared with previous UK decisions
� Only top end of Ofgem’s range consistent with precedent
– Low-end below all UK regulatory decisions since 2004
– Even mid-point of range below all regulatory decision since 2004
� But range is based on CoD allowance of 3.1%, which
Difference Between CoE and CoD
Allowance at Previous UK Regulatory Decisions
CAA NATS
Ofwat PR09CC Stansted
CC Gatwick
CC Heathrow4%
5%
6%
Ofgem Range
4.1%
4
allowance of 3.1%, which does not allow for transaction and pre-funding costs
� Other regulators (including the CC) have allowed 0.1-0.5% for transaction and pre-funding costs
� Recognising these costs decreases Ofgem’s range by 0.1-0.5% (mid-point 0.3%) to 3.7-0.6% (based on mid-point)
CC Bristol
Ofgem ED
CC Stansted
Ofgem GD
Ofgem ET & GT
Ofwat PR04
Ofgem ED
0%
1%
2%
3%
Sep-04 Mar-05 Sep-05 Mar-06 Sep-06 Mar-07 Sep-07 Mar-08 Sep-08 Mar-09 Sep-09 Mar-10 Sep-10 Mar-11
Average difference between
allowed CoE and CoD
(3.6%)
3.6%
0.9%
Source: Various regulatory decisions and NERA calculation

Ofgem’s WACC needs to attract capital in an environment of competing investment alternatives
Source: various regulatory decisions (see Appendix for individual decisions); allowed regulatory WACC uplift allocated to equity
(uplift CoE = allowed uplift / (1-gearing)); we use mid-points where regulators stated ranges for allowed uplifts
Average European Regulatory CoE Allowances for New Investment (2008-2010)
Year MRP Uplifts Min Max Average
2008 15 2.2% 0.91 4.2% 1.2% 3.4% 14.1% 7.3%
2009 12 2.3% 0.82 4.5% 0.9% 4.9% 10.0% 6.8%
2010 9 2.1% 0.99 4.6% 0.9% 4.2% 14.1% 7.5%
No. of
decisions
RFR
(real)
Equity Beta
(60% gearing)
CoE
(post-tax real, 60% gearing)
5
� Ofgem’s WACC range (4.0-7.2%) mostly below rates allowed in other European jurisdictions
– Average returns allowed in range of 6.8-7.5% despite many European networks being (significantly) state owned
– Many European energy network investments offer equity returns above Ofgem’s top end (7.2%)
– See Appendix for details
� In the US allowed returns are c.8.5% (real; c.50% gearing) before adders for investment incentives; and around 10.0% (real; c.50% gearing) after allowed adders (see slide 44, 56)
– UK network operators are also present in the US (e.g. Iberdrola and NG)
(uplift CoE = allowed uplift / (1-gearing)); we use mid-points where regulators stated ranges for allowed uplifts
�Ofgem’s current CoE range (4.0-7.2%) looks insufficient to attract capital into new required investment

Ofgem propose a cost of debt based on indexation using 10Y trailing averages (current result shows 3.1% real)
� Ofgem’s method of 10Y trailing averages increases risk for companies with large funding requirements (e.g. SPT)
– 10Y trailing averages only react with significant lag to changes in spot rates
– Spot rates may increase above 10Y trailing averages over the coming years, as quantitative easing is expected to unwind, interbank credit risk to increase, etc.
– Ofgem’s approach may be appropriate for companies with ‘steady state’ RAV, but not for companies with strongly increasing RAV
6
� Ofgem does not explain its method to derive real yields
– What is Ofgem’s implicit inflation assumption?
– Does Ofgem use ILG yields plus a credit spread? This would introduce bias as ILG yields are biased downwards, due to inelastic demand from institutional investors
� Ofgem dismisses a debt ‘weighting approach’, on the basis of complexity
– Complexity should not be the only reason to dismiss a method
– Where companies face large funding requirements a weighting approach would lead to greater protection
� Ofgem does not allow for transaction and pre-funding costs

Key Factors affecting the Cost of Equity at RIIO-T1

Data from option prices show that investors perceive greater downside risk in equity prices
� Downside risk is higher
over period than upside
risk
– However, CAPM
assumes symmetric
distribution of risk/
return
– To account for higher
Option Implied Percentiles for FTSE 100
in 6 Months Time
5000
6000
7000
8000
9000
Downside
Upside
Mean
90% probability
FTSE 100 will
be less than
5000 and more
than 3380
8
– To account for higher
expected downside
risk, CAPM-WACC
determination above
mid-point of plausible
range
� This is evidence for why
allowed returns should
be set at a premium to
the WACC in order to
offset downside
skewness
Source: Bank of England and NERA calculation; Data cut-off date 31-Dec-10; for an
explanation of the derivation of option implied index value probability density functions, see
Bank of England: “Notes on the Bank of England Option-Implied PDFs” and “Recent
developments in extracting information from options markets”
0
1000
2000
3000
4000
Jan
-01
Jul-
01
Jan
-02
Jul-
02
Jan
-03
Jul-
03
Jan
-04
Jul-
04
Jan
-05
Jul-
05
Jan
-06
Jul-
06
Jan
-07
Jul-
07
Jan
-08
Jul-
08
Jan
-09
Jul-
09
Jan
-10
Jul-
10
10% probability
FTSE 100 will be
between 3380 and
3890
3380
3890

Further market evidence shows returns are negatively skewed which is likely to lead to a downwardly bias in CAPM-CoE
� Further evidence from
option contracts shows
that expected returns
are negatively skewed
� However, CAPM
assumes zero skew in
market returns
Option Implied Skewness of FTSE 100
Returns in 6 Months Time-2.0
-1.5
-1.0
<<
Po
sit
ive S
kew
/ N
eg
ati
ve S
kew
>>
9
� Extensions of CAPM
which account for
skewness in returns
show higher CoE for
negative skew
Source: Bank of England and NERA calculation; a negatively skewed distribution is one for which
large negative deviations from the mean are more likely than large positive deviations; for an
explanation of the derivation of option implied market returns skewness, see Bank of England: “Notes
on the Bank of England Option-Implied PDFs” and “Recent developments in extracting information
from options markets”
-0.5
0.0
0.5
1.0
Jan-0
1
Jul-01
Jan-0
2
Jul-02
Jan-0
3
Jul-03
Jan-0
4
Jul-04
Jan-0
5
Jul-05
Jan-0
6
Jul-06
Jan-0
7
Jul-07
Jan-0
8
Jul-08
Jan-0
9
Jul-09
Jan-1
0
Jul-10 <
< P
osit
ive S
kew
/ N
eg
ati
ve S
kew
>>

35
40
45
50
Expected market volatility is higher than “normal” level over 2003 to 2008 period
� Ofgem states that current spot levels are back to 10 year trailing averages
� Therefore, Ofgem assumes long term “normal” market conditions for RIIO-T1
FTSE 100 Implied Volatility
(6 Months Maturity)
Burst of Dot-com
Bubble
Credit Crisis
Lehman
collapseSovereign
Debt Crisis
10
5
10
15
20
25
30
Jan-0
1
Jul-0
1
Jan-0
2
Jul-0
2
Jan-0
3
Jul-0
3
Jan-0
4
Jul-0
4
Jan-0
5
Jul-0
5
Jan-0
6
Jul-0
6
Jan-0
7
Jul-0
7
Jan-0
8
Jul-0
8
Jan-0
9
Jul-0
9
Jan-1
0
Jul-1
0
%
10 Year Trailing Average
conditions for RIIO-T1
� But last 10 years have seen three major crises with exceptionally high volatility
� Expected market volatility higher in current period relative to non-crisis periods (2003-2008)
Source: Bank of England; Data cut-off date 31-Dec-10
Debt Crisis
Non-crisis Period

Our analysis shows expected real market returns since Lehman above long-run averages
� We use DGM evidence on expected market returns and CoE for energy networks since Lehman
� Expected real market returns averaged 9.6% since Lehman
– Historic real market returns for UK market based on arithmetic averages: 7.2% (Source: Dimson Marsh and
Expected Market Returns (FTSE 100) and
Cost of Equity (50% gearing) of Energy Networks
12%
14%
16%
18%
20%
Average Market Returns
("Post Lehman") = 9.6%
Lehman CollapsExpected Market
Returns (real;
FTSE 100)
ERP
11
(Source: Dimson Marsh and Staunton 2010)
� Real cost of equity for UK energy networks averaged 6.7% (50% gearing) since Lehman
– CoE increases to 8.0% at 60% gearing, see slide 42
� Note all figures based on averages since Lehman (Sep-08); current figures are higher than averages since Lehman
0%
2%
4%
6%
8%
10%
Feb-08 May-08 Aug-08 Nov-08 Feb-09 May-09 Aug-09 Nov-09 Feb-10 May-10 Aug-10 Nov-10
Real Cost of Equity
(50% gearing) of
Energy Networks
Real risk free rate
Source: Bloomberg, Consensus Forecast and NERA analysis; DGM based on weekly updates of analyst
forecasts; expected real market returns calculated as the market cap weighted average of FTSE 100
companies’ prospective dividend yield and real long-term analysts’ earnings growth forecast.
Note: implied asset beta underlying cost of equity equal to 0.32 (average asset beta for energy network over
last 2 years); real risk free rate based on deflated nominal 10 year maturity government bond yields; inflation
forecasts based on Consensus Economics.

Global Investment Strategy
UK Equity Risk Premium
9%
10%
11%
12%
13%
14%
City analysts forecast ERP at 8% over the last 2 years, significantly above its historic long-run level
12
0%
1%
2%
3%
4%
5%
6%
7%
8%
9%
90 91 92 93 94 95 96 97 98 99 00 01 02 03 04 05 06 07 08 09 10
UK 104 per. Mov. Avg. (UK)
Source: UBS UBS Investment Research; Data cut-off date Dec-10

Impact of RIIO on Required Returns

Ofgem’s RIIO proposals lengthen the review period from 5 to 8 years
� A longer review period
exposes SPT to higher
cumulative risk (absence risk
mitigants)
� This is exacerbated at current
times of high uncertainty
� Possible mitigants to counter
Valu
e o
f K
ey F
inancia
l R
atio
Expected value
of financial ratio
Probability distribution
of financial ratios
Variance (i.e. distribution of outcomes)
increases over time
Distribution of Key Financial Ratios Over Time
14
� Possible mitigants to counter
higher risk exposure
– Margin in WACC to
compensate increased risk
– Reducing financial risk
(leverage) to alleviate higher
market risk
� Increases the need for
financeability testing
Time
Valu
e o
f K
ey F
inancia
l R
atio
Probability of
financial
distress increases
over time
Minimum threshold
for an investment
grade credit rating
NERA illustration; qualitative illustration only; figure not derived
through quantitative modelling

Longer review period exposes SPT to increased risk of higher future risk free rates
� Government bond yields are at historical lows and are affected by monetary
policy intervention (quantitative easing)
– E.g. Europe Economics (Dec, 2010) states “…current yields may be biased
downwards by around 100 basis points due to Quantitative Easing”
– Impact of QE may unwind over the regulatory period, leading to an increase in real
yields
15
� Bank of England expects inflation to stay above target, making an increase in the
Bank Rate more likely (currently at its historical low of 0.5%
– “Inflation is likely to stay above the 2% target throughout 2011, given the forthcoming
rise in VAT and continuing increases in import prices.” Bank of England, Inflation
Report, Nov-10
� UK regulated entities have no possibility to seek an adjustment to the cost of
equity during the regulatory period of 8 years
� A projected increase in the risk free rate needs to be recognised in determining the
risk free rate

1.0
1.2
1.4
1.6
1.8
+0.53%
5Y Maturity
10Y Maturity
20Y Maturity
Based on implied forward rates real yields of 10 year maturity are expected to increase by 0.7% (on average) over the coming 8 year period
� Increased risk of locking the
CoE for a longer period of
time (now 8 years)
� ILG yields are expected to
increase
– Yield curve is upward
sloping
– Merrill Lynch Global Fund
Implied Forward Yields of ILGs (%)
+0.66%
16
-0.2
0.0
0.2
0.4
0.6
0.8
1.0
Dec-10 Dec-11 Dec-12 Dec-13 Dec-14 Dec-15 Dec-16 Dec-17 Dec-18 Dec-19
Yie
ld (
%) +0.53%
– Merrill Lynch Global Fund
Manager Survey (14-Dec-
10), shows investors (net
27%) expecting an even
steeper yield curve
� Risk free rate needs to allow
for headroom to
accommodate the expected
increase in yields
� In the US some state
regulators allowed for a “stay-
out premium” when utilities
commit to a longer review
periodSource: Bank of England; projections based on NERA calculation of UK instantaneous
implied real forward curve, Data Cut-off point 13 Dec 2010
5Y 10Y 20Y
Spot (13 Dec 10) -0.06 0.72 0.87
Projection over 4 years (average) 1.55 1.45 1.12
Projected increase over 4 years (average) 1.61 0.73 0.25
Projection over 8 years (average) 1.58 1.38 na
Projected increase over 8 years (average) 1.64 0.66 na
Maturity
+0.66%
(on average
from Dec-10 to
Dec-18)

Ofgem plans to extend depreciation lives from 20 years to 45-55 years, which increases financing costs by c.0.5%
� Extending the regulatory deprecation lives increases cash
flow risk
� Analysis of yield curve data shows premiums investors
require to compensate for duration risk
– Swap curve data shows extending asset live by 30 years
increases the base risk premium by c.0.1%
– BBB corporate debt curve data shows extending the asset
life by 30 years increases the risk premium by c.0.5%.
Swap Curve (USD)
0.0
0.5
1.0
1.5
2.0
2.5
3.0
3.5
4.0
4.5
0 5 10 15 20 25 30 35 40 45 50
SW
AP
Ra
te
17
0.0
1.0
2.0
3.0
4.0
5.0
6.0
7.0
0 5 10 15 20 25 30 35 40 45 50
Years to Maturity
Yie
ld t
o M
atu
rity
NERA Projection
� No direct evidence from equity markets on duration risk
but this debt market evidence provides a proxy for equity
Source: Bloomberg and NERA calculation
US Corporate BBB Curve
Term Premium (%)
Note: 50 year maturity for BBB Corporates based on log-linear
projection (using data for maturity years 20 to 30)
0 5 10 15 20 25 30 35 40 45 50
Years to Maturity
Note: Analysis based on US data since EUR/GBP data
is less liquid in particular at the long end of the curve
20->50
USD Corporate (BBB) 0.5
USD SWAP Rate 0.1
Increase in Duration
(Years)
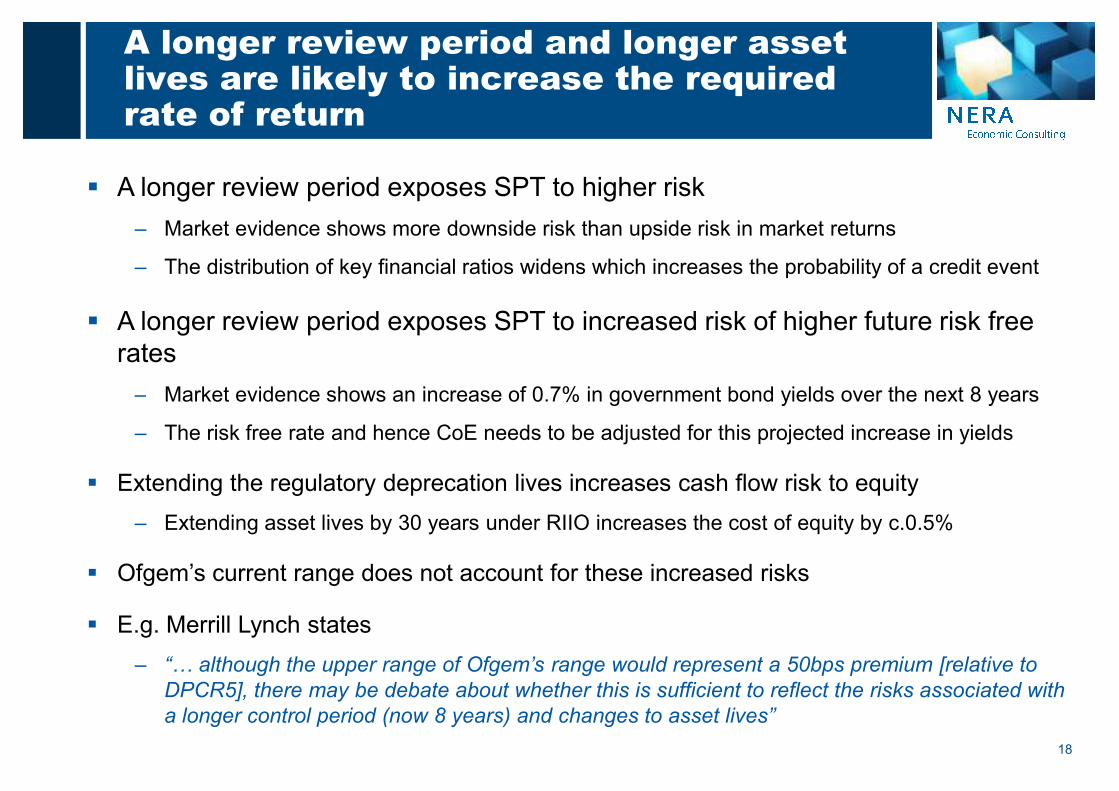
A longer review period and longer asset lives are likely to increase the required rate of return
� A longer review period exposes SPT to higher risk
– Market evidence shows more downside risk than upside risk in market returns
– The distribution of key financial ratios widens which increases the probability of a credit event
� A longer review period exposes SPT to increased risk of higher future risk free
rates
– Market evidence shows an increase of 0.7% in government bond yields over the next 8 years
18
– Market evidence shows an increase of 0.7% in government bond yields over the next 8 years
– The risk free rate and hence CoE needs to be adjusted for this projected increase in yields
� Extending the regulatory deprecation lives increases cash flow risk to equity
– Extending asset lives by 30 years under RIIO increases the cost of equity by c.0.5%
� Ofgem’s current range does not account for these increased risks
� E.g. Merrill Lynch states
– “… although the upper range of Ofgem’s range would represent a 50bps premium [relative to
DPCR5], there may be debate about whether this is sufficient to reflect the risks associated with
a longer control period (now 8 years) and changes to asset lives”
NERA Historic Beta Analysis

Asset betas for European energy networks depend on estimation period
5Y Asset Betas for European
Network Operators (Dec 05 – Nov 10)
2Y Asset Betas for European
Network Operators (Dec 08 – Nov 10)
0.35
0.44
0.45
0.50
0.56
0.41
0.40
0.37
National Grid
Red Electrica
Enagas
Gas Natural
Scottish & Southern
excl. GN & SSE
excl. GN
All Networks
Average
0.26
0.42
0.36
0.32
0.41
0.32
0.32
0.30
National Grid
Red Electrica
Enagas
Gas Natural
Scottish & Southern
excl. GN & SSE
excl. GN
All Networks
Average
20
Average Asset Beta of 0.41 for all energy networks
� Equity Beta = 0.82 (50% Gearing)
� Equity Beta = 1.03 (60% Gearing)
Source: Bloomberg; Raw betas Blume-adjusted; asset betas based on Miller formula. Daily Data. EUR Companies regressed against Euro Stoxx 600; UK
companies, are regressed against FTSE All Share
Average Asset Beta of 0.32 for all energy networks
� Equity Beta = 0.64 (50% Gearing)
� Equity Beta = 0.80 (60% Gearing)
� Note: Ofgem/EE use SSE. EE also use integrated utilities Centrica, Enel, GDF Suez and International Power as cross checks. GN has >50% share of profit from regulated activities
� Increased corporate activity at GN does not necessarily increase beta as it is likely to be uncorrelated to general market movements
0.28
0.34
0.35
0.35
0.00 0.10 0.20 0.30 0.40 0.50 0.60
Snam Rete Gas
ACEA
Terna
National Grid
0.25
0.24
0.29
0.26
0.00 0.05 0.10 0.15 0.20 0.25 0.30 0.35 0.40 0.45
Snam Rete Gas
ACEA
Terna
National Grid

Our results are similar for daily, weekly and monthly data
5Y Asset Beta for Network Operators (Dec 05 – Nov 10)� Results based on
daily and weekly
data very close
� Monthly data is less
robust due to the
small sample size 0.34
0.50
0.28
0.45
0.41
ACEA
Gas Natural
Snam Rete Gas
Enagas
AverageAverage Energy
Networks
21
small sample size
(60 observations)
� R-squared for daily
and weekly similar
(see next slide)0.35
0.56
0.44
0.35
0.34
0.00 0.10 0.20 0.30 0.40 0.50 0.60
National Grid
Scottish & Southern
Red Electrica
Terna
ACEA
Daily Weekly Monthly
Raw betas Blume-adjusted; asset betas based on Miller formula. EUR Companies regressed against Euro
Stoxx 600; UK companies regressed against FTSE All Share)

We also check the explanatory value (R-squared) for all our estimations
R-squared measures for different specifications
5-Year Time Horizon
� R-squared measures the
share of total variation in
stock returns that is
explained by variation in
market returns
� Variation in market
returns can explain ca.
Daily Weekly Monthly Daily Weekly Monthly
National Grid 0.35 0.36 0.29 0.35 0.38 0.17
Scottish & Southern 0.56 0.56 0.47 0.32 0.37 0.18
Red Electrica 0.44 0.46 0.49 0.27 0.34 0.30
Terna 0.35 0.33 0.37 0.17 0.20 0.29
ACEA 0.34 0.33 0.33 0.19 0.17 0.13
Beta R-squared
22
Source: Estimation based on Bloomberg data; European companies regressed against Euro Stoxx 600, UK
companies against FTSE All Share. Time Period: Dec 05- Nov 10
returns can explain ca.
30% of all variation in
stock returns
� Little difference in beta
and explanatory power
(R-squared) for different
frequencies when only
energy companies are
considered
ACEA 0.34 0.33 0.33 0.19 0.17 0.13
Gas Natural 0.50 0.49 0.57 0.41 0.34 0.40
Snam Rete Gas 0.28 0.28 0.28 0.11 0.11 0.07
Enagas 0.45 0.45 0.54 0.31 0.28 0.31
Average Energy 0.41 0.41 0.42 0.27 0.27 0.23
Northumbrian Water 0.27 0.29 0.17 0.23 0.27 0.03
Severn Trent 0.33 0.36 0.24 0.31 0.35 0.07
United Utilities 0.34 0.36 0.28 0.37 0.40 0.17
Pennon 0.34 0.39 0.32 0.23 0.34 0.17
Average All 0.38 0.39 0.36 0.27 0.30 0.19

Explanatory value (R-squared) for 2-year estimates
R-squared measures for different specifications
2-Year Time Horizon
� For energy companies R-
squared is highest for
monthly data, which has
highest beta values but:
– Monthly data over 2 years
is quite unreliable as it is
based on 24 data points
only
Daily Weekly Monthly Daily Weekly Monthly
National Grid 0.26 0.28 0.23 0.23 0.38 0.16
Scottish & Southern 0.41 0.39 0.38 0.17 0.22 0.19
Red Electrica 0.42 0.42 0.47 0.27 0.39 0.37
Terna 0.29 0.22 0.33 0.13 0.04 0.35
ACEA 0.24 0.19 0.19 0.09 0.04 0.05
Gas Natural 0.32 0.31 0.44 0.31 0.29 0.60
R-squaredBeta
23
Source: Estimation based on Bloomberg data; European companies regressed against Euro Stoxx 600, UK
companies against FTSE All Share. Time Period: Dec 08- Nov 10. Note: Monthly data over 2 years is
generally quite unreliable as it is based on 24 data points only.
– In the literature R-squared
is mostly used for
comparing specifications
that explain the same
dependent variable
� Changing the frequency /
time period means “total
variation” to be explained
changes � R-squared not
directly comparable
Gas Natural 0.32 0.31 0.44 0.31 0.29 0.60
Snam Rete Gas 0.25 0.20 0.24 0.07 0.02 0.06
Enagas 0.36 0.31 0.46 0.27 0.20 0.36
Average Energy 0.32 0.29 0.34 0.19 0.20 0.27
Northumbrian Water 0.23 0.22 0.17 0.18 0.17 0.04
Severn Trent 0.24 0.25 0.16 0.18 0.28 0.02
United Utilities 0.25 0.26 0.22 0.21 0.30 0.12
Pennon 0.29 0.33 0.29 0.19 0.37 0.26
Average All 0.30 0.28 0.30 0.19 0.23 0.21

Asset betas for UK water companies are lower than for energy networks
5Y Asset Betas (Dec 05 – Nov 10) 2Y Asset Betas (Dec 08 – Nov 10)
0.34
0.34
0.41
United Utilities
Pennon
Average
Energy Network
0.25
0.29
0.32
United Utilities
Pennon
Average
Energy Network
Average Energy
Networks
Average Energy
Networks
24
Source: Bloomberg; Raw betas Blume-adjusted; asset betas based on Miller formula. Daily Data. Water stocks regressed against FTSE All Share)
0.27
0.33
0.34
0.00 0.05 0.10 0.15 0.20 0.25 0.30 0.35 0.40
Northumbrian Water
Severn Trent
United Utilities
0.23
0.24
0.00 0.05 0.10 0.15 0.20 0.25 0.30
Northumbrian Water
Severn Trent
� Excluding Gas Natural and SSE produces an average asset beta of 0.37 (5Y) and
0.30, which is still higher than asset betas of water stocks

0.40
0.50
0.60
We cross-checked using a beta for a portfolio of energy network stocks
2Y Rolling Asset for Portfolios of Network Operators � We construct a
market cap
weighted portfolio
of UK network
operators and a
broader portfolio of
UK and EUR
network operators
25
-
0.10
0.20
0.30
Jan-06 Sep-06 Jun-07 Feb-08 Nov-08 Jul-09 Apr-10 Dec-10
EUR Portfolio (incl. UK) UK Portfolio
Source: Bloomberg; raw betas Blume-adjusted; asset betas based on Miller formula. UK Portfolio: National Grid,
Scottish & Southern, Scottish Power; European Portfolio: National Grid, Scottish & Southern, Scottish Power; Red
Electrica (ESP), Terna (ITA), ACEA (ITA), Gas Natural (ESP), Snam Rete Gas (ITA), Enagas (ESP); Based on daily
data, European index against Euro Stoxx 600, UK portfolio against FTSE All Share
network operators
� We calculate betas
based on portfolio
returns
UK Portfolio only Years Asset Beta R-squared
Dec-08 Dec-10 2.0 0.30 0.24
Dec-05 Dec-10 5.0 0.41 0.39
European Portfolio (incl. UK)
Dec-08 Dec-10 2.0 0.31 0.39
Dec-05 Dec-10 5.0 0.42 0.53

Summary
Asset Betas over 5 years (Dec 05 – Nov 10)
and 2 years (Dec 08 – Nov 10)
Individual Portfolio Individual Portfolio
National Grid 0.35 0.26
Scottish & Southern 0.56 0.41
Red Electrica 0.44 0.42
Terna 0.35 0.29
ACEA 0.34 0.24
Gas Natural 0.50 0.32
Snam Rete Gas 0.28 0.25
2 Year5 Year
26
� Based on empirical evidence we use a zero debt beta
� Portfolio approach yields consistent results with average peer group beta
� 5-Year average beta about 0.1 higher than 2-Year beta
� Cross Check with US evidence confirms our 5-Year results; the recent fall in US betas was less than for European betas
Snam Rete Gas 0.28 0.25
Enagas 0.45 0.36
Average GB 0.45 0.41 0.33 0.30
Average EU incl. GB 0.41 0.42 0.32 0.31
Average Electricity
Networks (USA)0.41 0.36
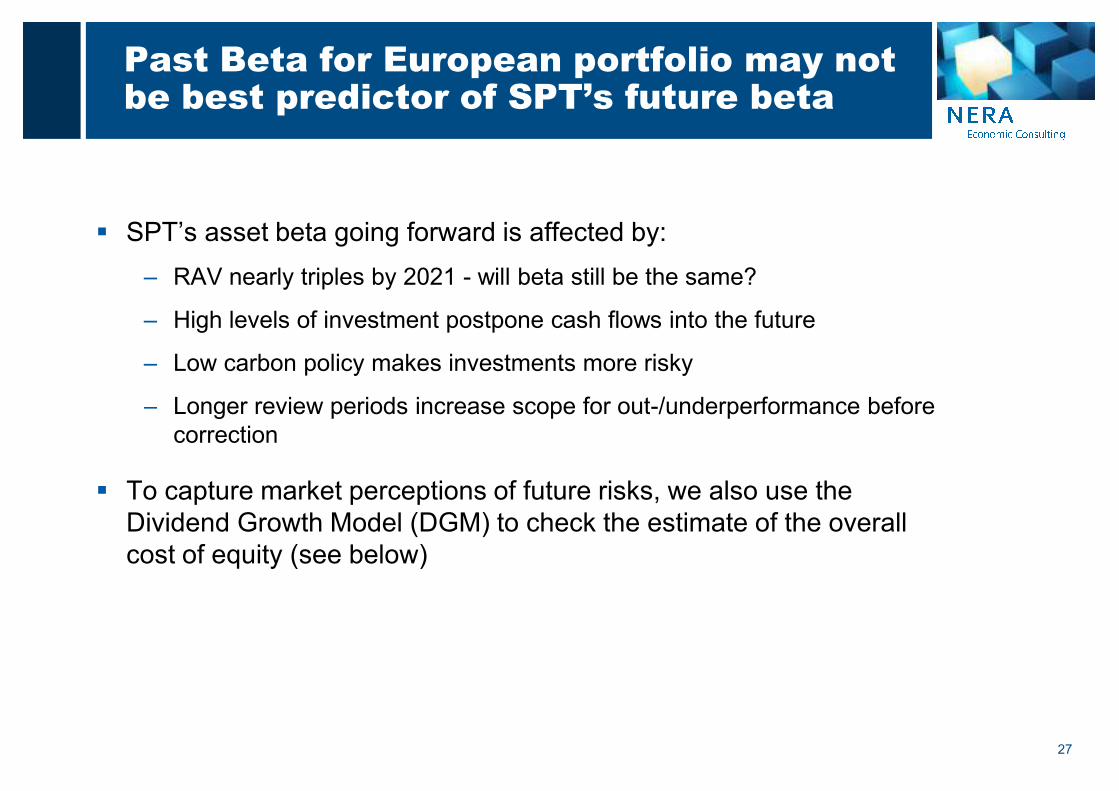
Past Beta for European portfolio may not be best predictor of SPT’s future beta
� SPT’s asset beta going forward is affected by:
– RAV nearly triples by 2021 - will beta still be the same?
– High levels of investment postpone cash flows into the future
– Low carbon policy makes investments more risky
– Longer review periods increase scope for out-/underperformance before
27
– Longer review periods increase scope for out-/underperformance before
correction
� To capture market perceptions of future risks, we also use the
Dividend Growth Model (DGM) to check the estimate of the overall
cost of equity (see below)

Gearing

The prudent level of leverage for SPT is substantially below recent Ofgem decisions
� Ofgem (2010): RIIO Handbook, p.107
– “we expect a network company to take a range of factors into account when choosing their
financial structure including the scale of future capital expenditure requirements and the
expected risks that the business faces”
� SPT Draft Investment Dossier (2010)
– Unprecedented capital investment programme; SPT Base Case sees Net Debt to RAV
increase to 65%, downside case >70% despite current leverage (~40%) substantially below
29
TPCR4 notional gearing (60%)
� Bank of International Settlement (2010): Basel 3 Rules on Capital
– BIS Impact Study (Dec 2010) calculates banks will be forced to raise €165bn in equity to meet
Common Equity requirements. Required de-levering will likely reduce available volume of
bank funding and may increase cost of funding
� Moody’s (2010): UK Water Sector Outlook cautions high leverage doesn’t come for free
– “Moody’s notes that the highly-leveraged companies have rigid financing structures that are
not designed to accommodate significant changes in industry structure or regulation”
The notional level of gearing for SPT needs to take account of forward-looking risk
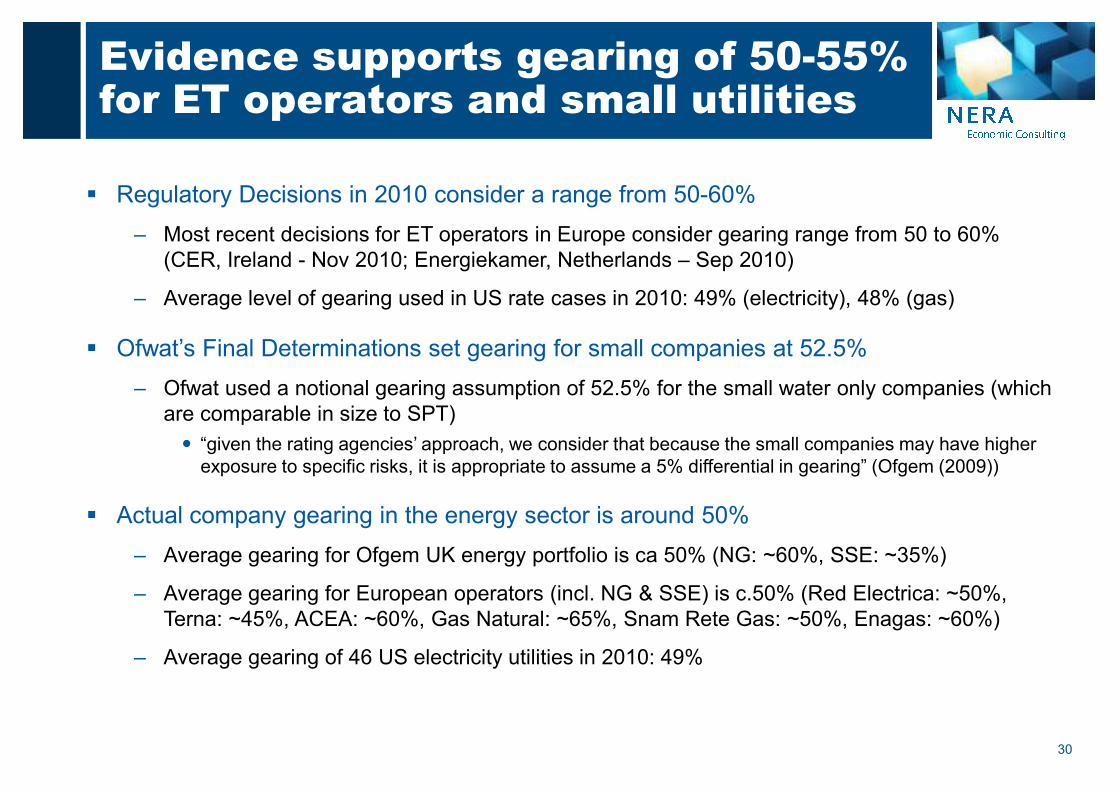
Evidence supports gearing of 50-55% for ET operators and small utilities
� Regulatory Decisions in 2010 consider a range from 50-60%
– Most recent decisions for ET operators in Europe consider gearing range from 50 to 60%
(CER, Ireland - Nov 2010; Energiekamer, Netherlands – Sep 2010)
– Average level of gearing used in US rate cases in 2010: 49% (electricity), 48% (gas)
� Ofwat’s Final Determinations set gearing for small companies at 52.5%
– Ofwat used a notional gearing assumption of 52.5% for the small water only companies (which
30
– Ofwat used a notional gearing assumption of 52.5% for the small water only companies (which
are comparable in size to SPT)
� “given the rating agencies’ approach, we consider that because the small companies may have higher
exposure to specific risks, it is appropriate to assume a 5% differential in gearing” (Ofgem (2009))
� Actual company gearing in the energy sector is around 50%
– Average gearing for Ofgem UK energy portfolio is ca 50% (NG: ~60%, SSE: ~35%)
– Average gearing for European operators (incl. NG & SSE) is c.50% (Red Electrica: ~50%,
Terna: ~45%, ACEA: ~60%, Gas Natural: ~65%, Snam Rete Gas: ~50%, Enagas: ~60%)
– Average gearing of 46 US electricity utilities in 2010: 49%

Real Cost of Equity – Preliminary Analysis

Indicative ranges for the CAPM real cost of equity
CAPM Real Cost of Equity: NERA vs Ofgem
Low High
Market
Evidence
Long-Run
Market
Evidence
'Current'
Market
Evidence
Long-Run
Market
Evidence
'Current'
Market Returns 5.4% 7.5% 7.2% 9.6% 7.2% 9.6%
RFR 1.4% 2.0% 2.0% 1.5% 2.0% 1.5%
ERP 4.0% 5.5% 5.2% 8.2% 5.2% 8.2%
Asset Beta na na 0.42 0.32 0.42 0.32
Gearing na na 50% 50% 60% 60%
Equity Beta 0.65 0.95 0.84 0.64 1.05 0.80
Ofgem NERA CAPM (50% Gearing) NERA CAPM (60% Gearing)
32
� We set out explicit “long-run” and “current” scenarios
– Ofgem “Low” and “High” scenarios combines parameters without theory
� Ofgem results are low relative to our market evidence for 60% gearing (=TPCR4):
– Ofgem high end (7.2%) is below NERA range (7.5-8.0%) at 60% gearing and roughly consistent with NERA range for 50% (6.4-6.7%)
– Ofgem’s low end is inconsistent with a reasonable cost of equity at any plausible gearing
– EE report suggests that Ofgem consider using 70% as sector gearing. In that case CoE would have to be significantly above Ofgem’s current top end
� The real CoE for SPT will depend on company-specific factors (discussed below)
NERA ‘current’ asset beta and risk-free rate are holding assumptions.
Equity Beta 0.65 0.95 0.84 0.64 1.05 0.80
Real CoE 4.0% 7.2% 6.4% 6.7% 7.5% 8.0%

We cross check our results using an alternative model (DGM)
DGM Real Cost of Equity: Indicative Estimates
includes generation
includes water
Real Cost of Equity Real Cost of Equity Real Cost of Equity
(Company actual gearing) (50% gearing) (60% gearing)
National Grid 9.2% 8.4% 10.0%
Scottish and Southern 9.0% 11.1% 13.4%
Red Electrica 7.7% 7.7% 9.1%
Terna 7.1% 7.7% 9.1%
ACEA 7.2% 5.8% 6.7%
Gas Natural 10.1% 7.4% 8.7%
Snam Rete Gas 6.9% 7.4% 8.7%
Enagas 8.1% 7.6% 9.0%
33
� DGM is the standard model US regulators use to calculate the CoE� accounts for risks not covered by CAPM, e.g. asymmetric risks
� We estimate dividend growth rates based on explicit analyst forecasts (short-term) and long-run GDP growth expectations (long-term)
� DGM results are in line with US regulatory precedent (avg base rate: 8.5% at 50% gearing, see appendix) and slightly above NERA’s CAPM range
Source: Bloomberg, IBES, NERA analysis
Enagas 8.1% 7.6% 9.0%
Average 8.2% 7.9% 9.3%
Average (exc. SSE) 8.1% 7.4% 8.8%
Low 6.9% 5.8% 6.7%
High 10.1% 11.1% 13.4%

US Regulatory Precedent for Trans-mission consistent with our DGM results
Company Name Decision
Year
Nominal Base
ROE (%) Real Base ROE (%)
Company
Gearing1
Virginia Electric and Power Company 2008 10.9 8.2 48%
Startrans 2008 12.0 9.3
Virginia Electric and Power Company 2008 10.9 8.2 48%
Pepco Holdings 2008 11.3 8.6 53%
Central Maine and Maine Public Service 2008 11.1 8.4
NSTAR 2008 11.1 8.4 58%
Duquesne Light Company 2008 10.9 8.2 46%
Recent FERC Decisions for Electricity Transmission Operators
34
Duquesne Light Company 2008 10.9 8.2 46%
Public Service Electric and Gas Company 2008 11.2 8.5
Green Power Express LP 2009 10.8 8.3
ITC Great Plains LLC 2009 10.7 8.2
Public Service Electric and Gas Company 2009 11.2 8.7
Average 11.1 8.5 51%
Median 11.1 8.4
� ROEs generally estimated using the DGM. Differences in capital structure are taken into
account in selecting appropriate comparators
� FERC also allows for ‘adders’ for new investments that reduce congestion or increase reliability as well as other incentive adders, e.g. for membership in an integrated structure
�Average real RoE for ET (8.5%) higher than for distribution (7.8%) over same period
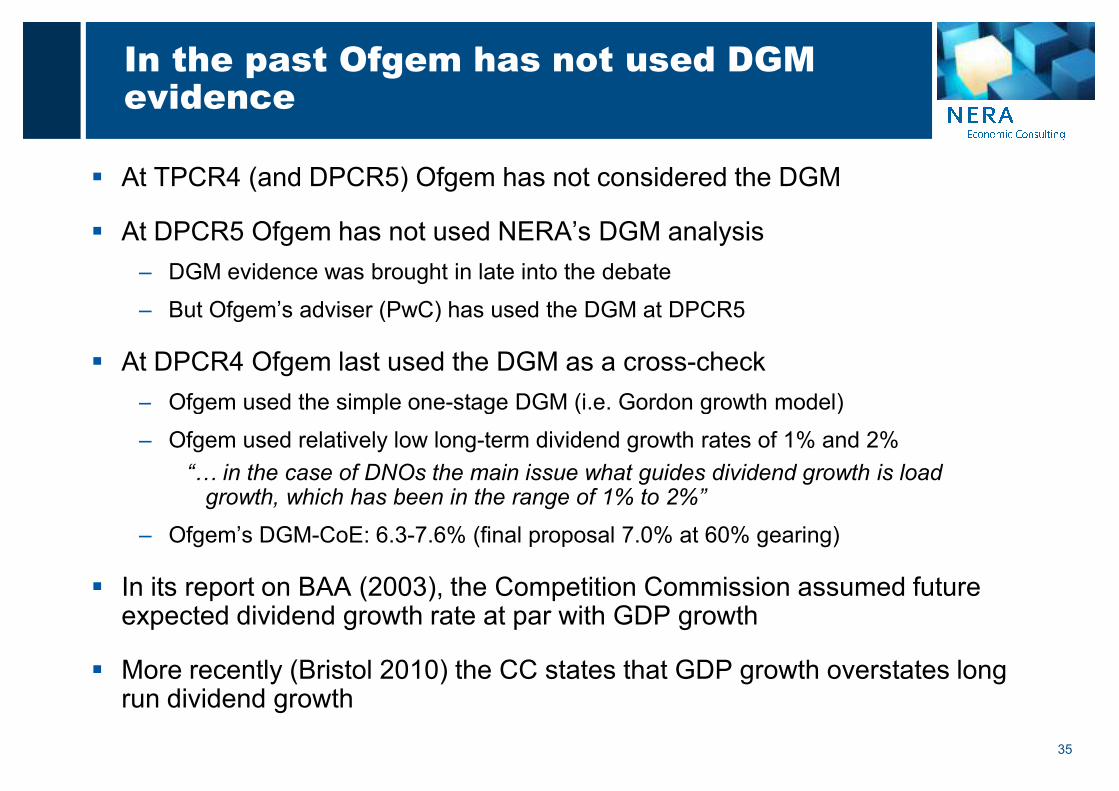
In the past Ofgem has not used DGM evidence
� At TPCR4 (and DPCR5) Ofgem has not considered the DGM
� At DPCR5 Ofgem has not used NERA’s DGM analysis
– DGM evidence was brought in late into the debate
– But Ofgem’s adviser (PwC) has used the DGM at DPCR5
� At DPCR4 Ofgem last used the DGM as a cross-check
– Ofgem used the simple one-stage DGM (i.e. Gordon growth model)
35
– Ofgem used the simple one-stage DGM (i.e. Gordon growth model)
– Ofgem used relatively low long-term dividend growth rates of 1% and 2%
“… in the case of DNOs the main issue what guides dividend growth is load growth, which has been in the range of 1% to 2%”
– Ofgem’s DGM-CoE: 6.3-7.6% (final proposal 7.0% at 60% gearing)
� In its report on BAA (2003), the Competition Commission assumed future expected dividend growth rate at par with GDP growth
� More recently (Bristol 2010) the CC states that GDP growth overstates long run dividend growth

DGM Cross Check confirms CoE for 50% Gearing around top end of Ofgem range
Real CoE Evidence
Low High
Market
Evidence
Long-Run
Market
Evidence
'Current' Low Avg High
Market Returns 5.4% 7.5% 7.2% 9.6%
RFR 1.4% 2.0% 2.0% 1.5%
ERP 4.0% 5.5% 5.2% 8.2%
Asset Beta na na 0.42 0.32
Gearing na na 50% 50%
Ofgem NERA CAPM (50% Gearing) NERA DGM (50% Gearing)
N/a
36
� Consistency between NERA DGM, CAPM and US regulatory precedent
– NERA CAPM range lies within the DGM range but below mid-point
– NERA DGM in line with US precedent, mid-point slightly below US mid-point
� Only the top end of Ofgem’s range is consistent with other estimates at 50%
– Ofgem do not specify the gearing at which their estimates CoE applies. Higher levels of gearing require higher CoE.
Source: Bloomberg, IBES, NERA analysis
Equity Beta 0.65 0.95 0.84 0.64
Real CoE 4.0% 7.2% 6.4% 6.7% 5.8% 7.9% 11.1%
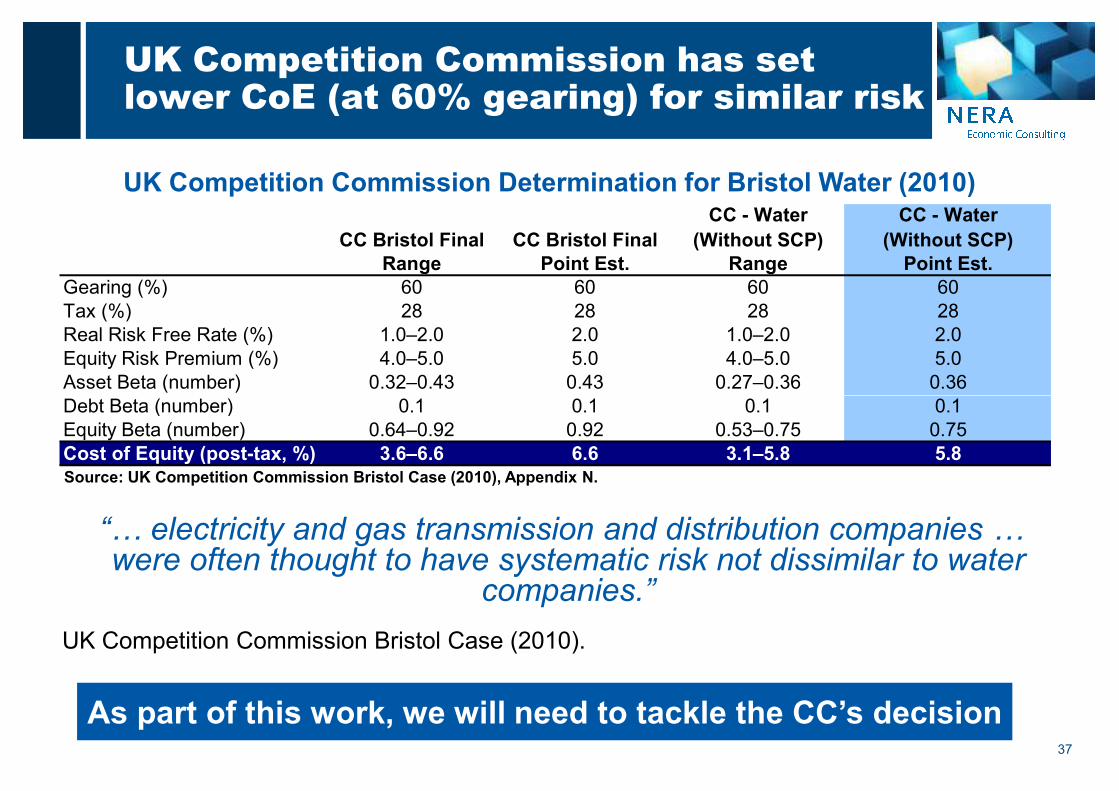
UK Competition Commission has set lower CoE (at 60% gearing) for similar risk
UK Competition Commission Determination for Bristol Water (2010)
CC Bristol Final CC Bristol Final
CC - Water
(Without SCP)
CC - Water
(Without SCP)
Range Point Est. Range Point Est.
Gearing (%) 60 60 60 60
Tax (%) 28 28 28 28
Real Risk Free Rate (%) 1.0–2.0 2.0 1.0–2.0 2.0
Equity Risk Premium (%) 4.0–5.0 5.0 4.0–5.0 5.0
Asset Beta (number) 0.32–0.43 0.43 0.27–0.36 0.36
Debt Beta (number) 0.1 0.1 0.1 0.1
37
“… electricity and gas transmission and distribution companies … were often thought to have systematic risk not dissimilar to water
companies.”
UK Competition Commission Bristol Case (2010).
Source: UK Competition Commission Bristol Case (2010), Appendix N.
Debt Beta (number) 0.1 0.1 0.1 0.1
Equity Beta (number) 0.64–0.92 0.92 0.53–0.75 0.75
Cost of Equity (post-tax, %) 3.6–6.6 6.6 3.1–5.8 5.8
As part of this work, we will need to tackle the CC’s decision

Impact of SPT’s Capex Programme on WACC

A substantial capex programme can increase the cost of capital
� Capex creates a mismatch between certain cash outflows and uncertain future returns
� Risk of asset stranding (ex-post disallowance) increases asymmetric risk
� Capex is a ‘fixed’ claim on future cash flows, which increases operating leverage
� increases beta risk
� Capex foregoes real option value (irreversible investment under uncertainty)
� Uncertainty increases the gain from waiting and hence increases hurdle rate of investment
39
Stylised Cash Flow Profiles for Different Investment Programmes
� Uncertainty increases the gain from waiting and hence increases hurdle rate of investment
Stylised Cash Flow Profile
('Investment Heavy')
0
200
400
600
800
1000
0 1 2 3 4 5 6 7 8 9 10YearCash Inflow Cash Outflow
('Investment Light')
0
200
400
600
800
1000
0 1 2 3 4 5 6 7 8 9 10YearCash Inflow Cash Outflow

1.6
1.8
2.0
2.2
2.4
RA
V a
s M
ult
iple
of
Year
0 R
AV
SPT (from 2012/13) BAA (Q4)
TPCR4 DPCR5
SPT capex larger than at reviews where WACC uplifts have been allowed
Trends in the Real RAV over Regulatory Period � Growth in RAV
= measure of delay of
returns into the future
– SPT real RAV growth
larger than any other
review
– Real RAV doubles in 5
40
1.0
1.2
1.4
Year 1 Year 2 Year 3 Year 4 Year 5 Year 6 Year 7 Year 8 Year 9
RA
V a
s M
ult
iple
of
Year
0 R
AV
N/AN/AN/A N/A
– Real RAV doubles in 5
years
– Nominal RAV (not
shown) nearly triples
between 2010/11 and
2017/18
Source: Ofgem Financial Models, CAA Final Decision 2003 and SPT Draft Investment Dossier; * Real RAV Calculation
based on NERA analysis of SPT Draft Investment Dossier. To be confirmed by SPT
Real RAV Growth in Absolute Numbers
£m Year 0 Year 1 Year 2 Year 3 Year 4 Year 5 Basis
SPT (Y0 = 2011/12) 1195 1510 1876 2186 2376 2513 2009/10 prices
BAA (Y0 = 2002/03) 6013 6559 7175 7961 8632 9337 2002 prices
DPCR5 (Y0 =2009/10) 16123 16731 17308 17878 18360 18817 2007/08 prices
TPCR4 (Y0 = 2004/05) 5853 6296 6468 6780 6964 7183 2004/05 prices

100%
150%
200%
Ca
pe
x t
o R
ev
en
ue
Ra
tio
SPT (from 2012/13) BAA (Q4)
TPCR4 DPCR5
SPT will spend unprecedented >200% of annual revenue to cover 2012/13 capex
Capex to Revenue over Regulatory Period� Capex to Revenue ratio
= measure of weight of
fixed cash outflows
compared to company
revenues
– Cash outflow >200%
of 2012/13 revenue
41
0%
50%
Year 1 Year 2 Year 3 Year 4 Year 5
Ca
pe
x t
o R
ev
en
ue
Ra
tio
of 2012/13 revenue
– Larger than TPCR4 &
DPCR5,
similar to BAA Q4
(period including
construction of
Heathrow Terminal 5)
Source: Ofgem Financial Models, CAA Final Decision 2003 and SPT Draft Investment Dossier; * Real RAV Calculation
based on NERA analysis of SPT Draft Investment Dossier. To be confirmed by SPT
Year 1 Year 2 Year 3 Year 4 Year 5 5Y Avg
SPT (from 2012) 201% 178% 139% 95% 70% 137%
BAA (Q4) 145% 143% 154% 130% 126% 140%
DPCR5 51% 50% 48% 45% 43% 47%
TPCR4 50% 54% 65% 55% 58% 56%
Comparison of Capex to Revenue

Regulators and rating agencies link large investment programmes to financing costs
� CC (2003): BAA Q4 WACC uplift of 0.25% for Heathrow T5
– “In our view the special factors linked to T5 … can best be recognized by way
of a further T5-related uplift to the WACC of some 0.25 per cent.”
� Ofgem (2006): TPCR 4 Final Proposals: WACC at upper end of range
– “Our decision on the cost of capital has taken into account … the investment
focus of the review, the risk profiles of the companies, …”
42
focus of the review, the risk profiles of the companies, …”
� Moody’s Global Infrastructure Finance (Dec-09)
– “…companies facing a very large investment programme compared to their
asset base … would score (a rating) at the low end of the spectrum”
� Standard & Poor’s (Sep 02): BAA Plc, Full Analysis
– “the large-scale nature of the capital projects is likely to reduce BAA's flexibility
to re-profile projects in times of financial stress.”

Relative risk assessment of SPT capex programme against Heathrow T5 criteria
Competition
Commission’s
Reasons
for Uplift
Relative Risk Assessment (SPT vs BAA)
Loss of Real
Option Value
Irreversible investment and uncertain demand (in particular for
capex associated with low carbon generation) �Financing Cost / Percentage addition to the asset base (>100%) much larger than
�
43
Financing Cost /
Rights Issue
Percentage addition to the asset base (>100%) much larger than
for BAA (~50%)
Even base case requires SPT to cut dividends or undertake rights
issues
�
Scope for
outperformance
Scope for outperformance not clear until package is known. BAA’s
regulatory framework allowed BAA to capitalise any cost overruns
at the end of the regulatory period.
?
Construction
Triggers
Uncertain: BAA had asymmetric trigger mechanism, does not
appear fully comparable to SPT revenue driver ?

Returns on new investment in the US often above base RoE because of incentive adders
� FERC Orders 679 and 679-A establish criteria and procedures for “incentive-based adders” to the base ROE to incentivise investment in new electricity transmission facilities.
� Adders are granted for ‘non-routine’ facilities that will improve regional reliability and/or reduce transmission congestion.
� In the past the FERC has considered the following risks when determining ‘non-routine’ status
44
‘non-routine’ status
– Financial risks (adverse changes to a company’s credit rating)
– Project size (both in absolute terms and relative to the company’s asset base)
– Siting, construction and environmental risks (e.g. the use of advanced technologies)
– Interaction with numerous state and municipal regulators
� The precise uplift is determined on a case-by-case basis and there is no guarantee of the uplift being approved. Recent FERC decisions have tended to allow 100-150 bps as well as non-RoE incentives such as allowances for abandoned construction

FERC has allowed adders of around 150bps in numerous cases
Other incentives
� Participation in regional transmission organisations (typically 50bps)
� Formation of “Transcos”, corporations that own only transmission assets
Company Name Decision Year Description
Virginia Electric Power Company 2008 150bps adder for 4 projects; 125bps adder for 7 projects; 50bps adder for RTO membership
New York Regional Interconnect 2008125bps for advanced technologies; 50bps adder for RTO participation; 100bps adder for
Transco formation (no base RoE determined yet)
Pepco Holdings (includes Potomoc
Electric Power Company)2008 150bps adder for the MAAP Project
Northeast Utilities 2008100bps adder for Middletown-to-Norwalk Project; 50bps adder for advanced technologies for
an underground cable
Central Maine and Maine Public
Service2008 150bps adder for Maine Power Connection Project; 50bps adder for RTO membership
NSTAR 2008 100bps adder for specific projects; 50bps adder for RTO membership
45
transmission assets (typically 100bps)
� In some cases the FERC has allowed non-RoE incentives (e.g. hypothetical capital structures, abandonment protection)
Note: according to FERC there was no case in 2010 where a network operator requested RoE incentives
Duquesne Light Company (1) 2008 50bps adder for RTO membership; 100bps adder for enhancement plan DTEP
Public Service Electric and Gas
Company (PSE&G) (1)2008
50bps adder for RTO membership; 125bps adder for 130-mile 500kV Susquehanna-Roseland
line
Duquesne Light Company (2) 2008 150bps adder for PJM Regional Transmission Expansion Project; 50bps for RTO membership
Tallgrass Transmission and Prairie
Wind Transmission2008 150bps adder for each project; up to 50bps for participation in SPP (Southwest power Pool)
Green Power Express LP 2009
10bps incentive adder for building a series of 765 kV transmission lines in the Midwest;
hypothetical capital structure of 60% Equity, 40% Debt approved; 50bps adder for RTO
participation; 100bps adder in recognition of its status as an independent transmission-only
company
ITC Great Plains LLC 2009 100bps adder for independent transmission companies; 50bps adder for RTO membership
Public Service Electric and Gas
Company (PSE&G) (2)2009
150bps incentive adder for its part of construction of new transmission facilities as part of a 230-
mile, 500 kV Mid-Atlantic Power Pathway (MAPP) Project
SoCal Edison 2009 100bps adder for additional risks, continued 50bps for zone membership
Public Service Electric and Gas
Company (PSE&G) (3)2009
125bps incentive adder for Branchburg-Roseland-Hudson 500 kV Line; 50bps adder for RTO
membership (previous decision)

In some cases FERC has explicitly cited “size of the capex programme” as risk justifying an “adder” to the allowed RoE
Company Date Size of Capex
programme
relative to
Asset Base
Allowed
ROE
Uplift
Other Allowances
& Notes
Southern
California Edison
17-Dec-
09~20% 1.00% FERC acknowledges absolute size as
criterion for RoE adder despite small
relative size
Central Maine –
MPRP
20-Oct-
08467% 1.25% Cost recovery in case of abandonment
46
MPRP
Duquesne 10-Oct-
0894% 1.50% Large adder because Duquesne is
constructing another large project at the
same time (total investment is around
200% of existing asset base)
PPL 22-Apr-
0860% 1.25%
PSE&G 22-Apr-
0880% 1.25%
FERC Allowances of 100-150bps for projects smaller in size than SPT capex
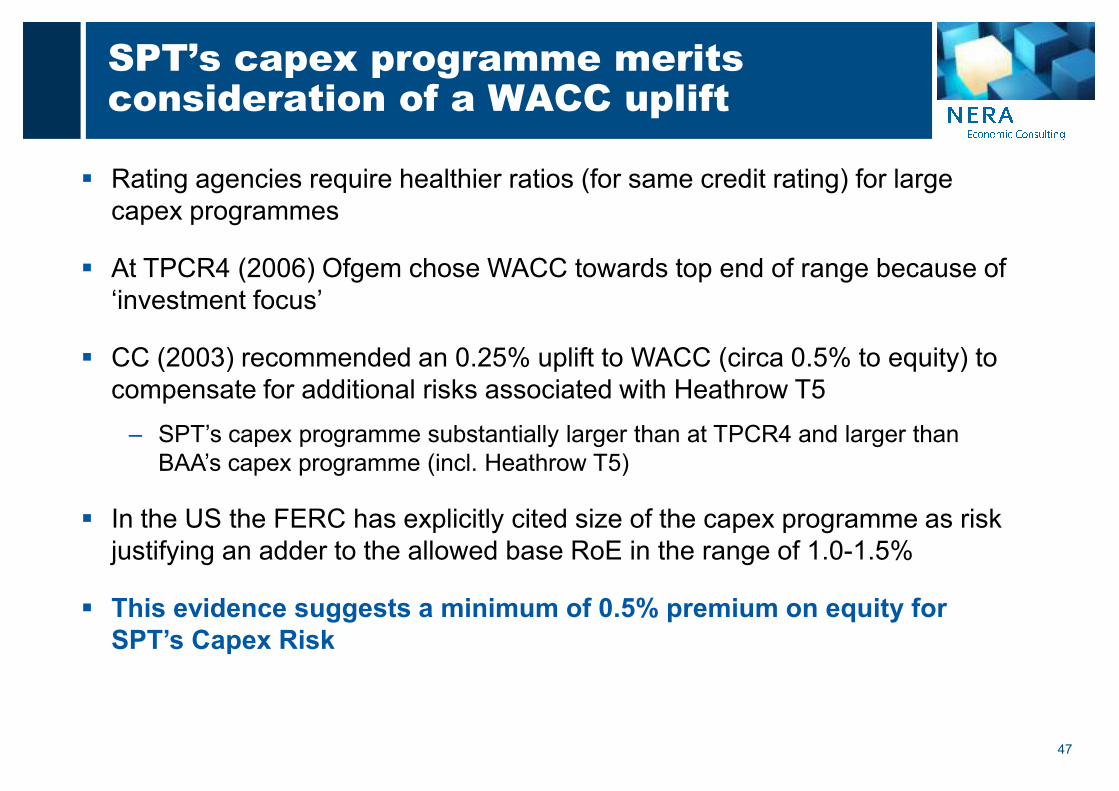
SPT’s capex programme merits consideration of a WACC uplift
� Rating agencies require healthier ratios (for same credit rating) for large
capex programmes
� At TPCR4 (2006) Ofgem chose WACC towards top end of range because of
‘investment focus’
� CC (2003) recommended an 0.25% uplift to WACC (circa 0.5% to equity) to
compensate for additional risks associated with Heathrow T5
47
compensate for additional risks associated with Heathrow T5
– SPT’s capex programme substantially larger than at TPCR4 and larger than
BAA’s capex programme (incl. Heathrow T5)
� In the US the FERC has explicitly cited size of the capex programme as risk
justifying an adder to the allowed base RoE in the range of 1.0-1.5%
� This evidence suggests a minimum of 0.5% premium on equity for
SPT’s Capex Risk

Impact of Dividend Policy on Cost of Equity
Ofgem proposes to inject new equity and/or cut dividends to fund new capex
� “Under the RIIO model, … the onus will be on the company to resolve the situation of
[e.g. high capital expenditure], including by injecting equity and/or reducing
dividend payments as they see fit.” (RIIO Handbook, p110, para 12.27)
� Ofgem sees cutting dividends as a less costly alternative to new rights issues:
– “… allow firms to increase equity through retained earnings, rather than by new rights
issues, which may reduce the transaction cost to firms…” (RIIO ‘Finance’ paper, para 2.45)
� Modigliani-Miller (1961) argued that dividend policy is “irrelevant”. However, newer
49
� Modigliani-Miller (1961) argued that dividend policy is “irrelevant”. However, newer
theories show that dividend payout policy does have an impact on the cost of capital
in some circumstances:
– “Term Premium”: Investors prefer dividends as it is more certain than capital gains.
Argument is strongest where opportunities for re-investment in similar assets are limited.
– “Clientele effects”: There are different “types” of investors with different preferences for
income or capital gains. Argument is strongest where (income/CGT) tax systems are
different or there are other restrictions on use of capital gains (e.g. endowments).
– “Agency theory”: Dividend policy is a mechanism for reducing monitoring costs. Argument
is strong in a regulated context where dividends are used to control regulatory behaviour
� According to the newer theories, cutting dividends to fund new capex is likely to have
an impact on the cost of capital

Examining the Term Premium Argument in a Regulated Context
� Gordon1 and Lintner2 (GL) argue that lower payouts result in higher costs of capital
– Investors prefer dividends as it is more certain than capital gains
– GL show that a higher “capital gains/dividend” ratio increases the required rate of return by
investors due to increased risk
– The GL findings are particularly relevant in the regulatory context where retained earnings
are subject to future regulatory discretion
– Our review of analyst reports shows that analysts attach a premium to utilities with stronger
50
– Our review of analyst reports shows that analysts attach a premium to utilities with stronger
or more stable dividend yields.
� Ofgem acknowledges - in the context of extending asset lives - that deferring
cashflows can increase regulatory risk:
– “… avoid any increased perception of regulatory risk that could arise from a sudden
deferral of cashflows” (RIIO Consultation ‘Finance’ paper, para 2.45)
� Cutting dividends to fund new capex may increase the cost of capital as future
dividends are more risky than current income
1) Myron J. Gordon, “Optimal Investment and Financing Policy”, Journal of Finance, May 1963.
2) John Lintner, “Dividends, Earnings, Leverage, Stock Prices, and the Supply of Capital to Corporations,” Review of Economics and Statistics, 1962.
The “clientele effect” also suggests that a dividend cut may increases the cost of capital for a regulated utility
� Different groups, or clienteles, of stockholders prefer different dividend payout policies1
– Retired individuals, pension funds, university endowment funds generally prefer cash income
– Stockholders in their peak earning years might prefer reinvestment (less need for current investment income;
they are generally in a high tax bracket)
� If a firm retains and reinvests income rather than paying dividends, those stockholders who need
current income are disadvantaged
– They would need to sell off some of their shares to obtain cash, incurring transaction costs
51
– Some institutional investors (e.g. endowment funds) may be legally precluded from selling stock
� Stockholders who are saving rather than spending dividends might favour the low dividend policy
– The less the firm pays out in dividends, the less the investor will have to pay in current taxes
� Therefore, investors who seek current income generally own shares in high dividend payout firms
and investors who seek future income generally own shares in low dividend payout firms
– Our review of city analysts reports strongly suggests that investors holding utility stocks expect current
income, i.e. the marginal investor is likely to be an institutional pension fund
� Changes in the dividend policy might cause current shareholders to sell their stock, forcing
the stock price down; this effect may be permanent if few new investors are attracted by the
new dividend policy
1) Petit, R. Richardson "Taxes, Transaction Costs and the Clientele Effect of Dividends“, Journal of Financial Economics, 1977

Agency theory arguments are strong in a regulated context
� Merton H. Miller, “Behavior Rationality in Finance: The Case of Dividends”, Journal of
Business (1986)
– “Public utility managements have found a policy of high dividends combined with frequent
external equity financing to be a useful strategy for forcing their regulators to keep utility rates
high enough to continue attracting new funds from investors.”
There are many academic papers that justify the payment of dividends in a
regulated context as a mechanism for controlling regulatory risk
52
� Stewart C. Myers, “The Capital Structure Puzzle”, Journal of Finance (1984)
– “Regulated firms, particularly electric utilities, typically pay dividends generous enough to force
regular trips to the equity markets. They have a special reason for this policy: it improves their
bargaining position vs. consumers and regulators. It turns the opportunity cost of capital
into cash requirements.”
� Clifford W. Smith, “Investment Banking and the Capital Acquisition Process," Journal of
Financial Economics (1986)
– “By paying high dividends, the regulated firm subjects both its regulatory body as well as itself
to capital market discipline more frequently. Stockholders are less likely to receive lower-than-
normal levels of compensation due to lower allowed product prices when the regulatory
authority is more frequently and effectively monitored by capital markets.”

In US regulation, utilities typically continue to pay dividends and regulators allow for “flotation costs” of new equity funding
� Ofgem acknowledges that funding new capex through new rights issues
increases transaction costs and that a dividend cut may be less costly
� However, according to “agency theory”1, dividends will subject a regulated
firm and its regulators to the discipline of the capital markets
� Cutting dividends might signal less effective monitored by capital markets,
which increases agency costs and reduces the value of the firm
53
which increases agency costs and reduces the value of the firm
� In the US, regulated utilities have maintained their dividend policies even
during periods of large new capex funding requirements2
– The benefits of subjecting the regulator (and the regulated company) to the
scrutiny of financial market outweigh the increased costs of flotation costs
– Under US regulation, flotation costs are allowed to be passed on to ratepayers
� Using dividends to fund new capex may signal to the market less
effective monitoring leading to increased regulatory risk
1) F. Easterbrook, “Two Agency-Cost Explanations of Dividends”, American Economic Review, 1984;
2) Clifford W. Smith, “Investment Banking and the Capital Acquisition Process," Journal of Financial Economics, 1985; Moyer, Rao Tripathy (1992)

Evidence from City Analysts support the fact that dividend policy has an impact on utilities’ valuation
� Dividends are a key consideration by investors in their investment making decision:
– “In this report, we address the specific issue of whether NG is attractive through looking at its
balance sheet, the impact of its higher capex plan, regulation, dividends, the underlying macro
and relative valuation” (Credit Suisse , 21 October 2010, National Grid)
– “NG would have the superior dividend growth…. In our view, this lower-risk dividend growth
deserves a premium.” (Credit Suisse , 21 October 2010, National Grid)
– “(W)e believe this premium [for UK Water] is partly justified on the basis of … no concerns on
dividend sustainability…” (Credit Suisse, 02 June 2010, European Power Breakfast, p3)
54
dividend sustainability…” (Credit Suisse, 02 June 2010, European Power Breakfast, p3)
� Utilities compete in dividend yields to attract capital:
– “This leaves [NWG] trading with a c4.1% dividend yield whilst stocks such as NG and UU are
offering c6.4% and c5.1% respectively”
(Credit Suisse puts NWG on underperformance from neutral, 21 October 2010, UK regulated
utilities, p12)
– “We remain buyers of the UU … it has a fast growing RAB, the highest dividend yield…” (Credit
Suisse, 30 July 2010, UK Regulated Utilities, p1)

NERA Analysis of Impact of Dividend Cuts on Cost of Equity: DRAFT RESULTS
� To estimate the impact of cutting dividends on the share price, we need to control for the expectations already
priced into the share price at the time of the announcement
– We expect the share price to increase if the dividend cut is less than what the market expects (and vice
versa)
– By contrast, if dividend payout policy were to be “irrelevant”, we would expect no significant reaction of the
share price following the announcement of a dividend cut
Case Study 1: Evidence from United Utilities (22 Jan 2010)
– UU announced a dividend cut of 12.5% for the next financial year in response to water regulator Ofwat’s
tougher-than-expected price controls
55
tougher-than-expected price controls
– Analysts had been projecting a dividend cut of 20-25%, i.e. more than what the company actually announced
(Reuters news release), which suggests actual dividend cut was ca. 10% smaller than what was already in
the price
– Shares in United Utilities increased by over 4% after the announcement (making it the top gainer within the
FTSE 100 index) and by up to 8.46% over the next two weeks
� Since the announcement of the dividend cut was less what the market expected, the increase in UU’s share price
confirms the impact of a dividend cut on the share price
� However, the impact on the cost of equity is less clear:
– In the one-stage DGM: CoE = D/P +g
– For constant long run growth rates (g) the impact of the observed UU price is an increase in the CoE from the
smaller than expected dividend cut: ∆CoE = (1+∆D)/(1+∆P)-1 = (1+10%)/(1+8.46%)-1 ≈ + 1.2%

Further Case Studies
Case Study 2: Evidence from Severn Trent
– Following the publication of Ofwat’s draft determination (23 Jul 09) Severn Trent’s
share price falls more than other water companies because of widespread concerns
about the sustainability of its dividend
� Forecast Cuts of SVT dividend: 30% (Morgan Stanley), 20% (Goldman), no specified
magnitude (CS, JP Morgan). However, UBS positive that no cut is needed
– When SVT actually announced a 10% dividend cut in Jan 10 share prices rose
indicating that the market was expecting a larger cut4%
56
indicating that the market was expecting a larger cut
-18%
-16%
-14%
-12%
-10%
-8%
-6%
-4%
-2%
0%
2%
4%
22-Jul-09 11-Aug-09 31-Aug-09 20-Sep-09 10-Oct-09 30-Oct-09 19-Nov-09
Severn Trent United Pennon Northumbrian
� “Whilst there are a variety of reasons for
this fall, speaking to investors, we believe
the key concerns over the sustainability of
the dividends were brought to
prominence.” (Credit Suisse, 24 Jul 09)
� “We continue to view United Utilities and
Pennon’s dividend policies as potentially
sustainable into the next regulatory period.
However we believe that the extension of
Severn Trent’s dividend policy would be a
stretch” (JP Morgan, 27 Jul 09)

Indicative Conclusions on Case Studies
� There is strong evidence that dividends are a key consideration by investors in their
investment making decision:
– UU’s share price surged after the company announced a smaller than expected dividend cut
in January 2010
– Severn Trent’s share price significantly underperformed the other listed water companies
after Ofwat’s draft determination as numerous equity analysts stated that Severn Trent’s
dividend was most at risk
57
� Linking the case studies to changes in the cost of equity is less straightforward:
– Impact on cost of equity defined by relative size of dividend cut compared to share price
reaction
– UU’s share price increased by slightly less than 10% following a dividend cut that was c.10%
smaller than expected (i.e. a perceived dividend increase)
– SVT down more than 15% following Ofwat DD with a number of analysts forecasting
dividend cuts of 10-30%
– Impossible to isolate impact of dividend cut, share price movements reflect impact relative to
expected changes and also other announcements, e.g. lower cost of capital at Ofwat DD
– No consensus on expected dividend cut � not clear what exactly market prices reflect

Two ways of funding new capex through equity
1. New Equity costs
� NERA formula
� Reg Precedent
2. Dividend Cut
58
� Theory says CoE increases
� Case Studies results
� 2 bigger impact than 1. = This is why US regulators allow the flotation cost

Summary / Conclusions
� Ofgem sees cutting dividends to finance new capex as a less costly alternative to new
rights issues.
� Our analysis shows that dividend cuts can increase the cost of equity of regulated
companies for the following reasons:
– “Term Premium”: Investors prefer dividends as it is more certain than capital gains. Analysts
attach a premium to utilities with stronger or more stable dividend yields.
– “Clientele effects”: There are different “types” of investors with different preferences for
59
income or capital gains. Our review of city analysts reports strongly suggests that investors
holding utility stocks expect current income, i.e. the marginal investor is likely to be an
institutional pension fund.
– “Agency theory”: Dividend policy is a mechanism for reducing monitoring costs. Argument is
strong in a regulated context where dividends are used to control regulatory behaviour. Many
academic papers support this argument.
� In US regulation, utilities typically continue to pay dividends and regulators allow for
“flotation costs” of new equity funding
� Evidence from City Analysts’ reports and “event studies” support the fact that dividend
policy has an impact on utilities’ valuation

Summary - Indicative Ranges for SPT’s Real Cost of Equity

DGM
(National Grid)
DGM
(National Grid)
CoE based on average network operator 6.4 6.7 7.5 8.0 8.0
SPT - Uplift for capex risk 0.5 0.5 0.6 0.6
Uplift for projected increase in risk free rate 0.7 0.7 0.7 0.7
60% Gearing
CAPMCAPM
50% Gearing
Indicative ranges for SPT’s real cost of equity
SPT’s Preliminary Real Cost of Equity Range
61
Uplift for projected increase in risk free rate 0.7 0.7 0.7 0.7
Compensation for extended asset lives under RIIO 0.5 0.5 0.6 0.6
SPT Cost of Equity 8.1 8.4 8.4 9.4 9.9 10.0
� SPT’s real CoE (50% gearing) lies in range of 8.1-8.4%
– Upper end of CAPM range (8.4%) consistent with National Grid’s CoE based on DGM
� Small company premium not included in cost of equity (unless further evidence can be found to support this), but we recommend including in cost of debt and gearing
Cost of Debt – Preliminary Analysis

The economic case and regulatory precedent for indexation
� Ofgem proposes an annual debt allowance indexed to a 10-year trailing average
of corporate bond yields
� The economic case for and against indexation
– Indexation can insulate companies from risks that they do not control,
e.g. changes to government bond rates
– Indexation can blunt efficiency incentives if companies do not earn
63
– Indexation can blunt efficiency incentives if companies do not earn
rewards/ penalties for decisions they do control
� Ofgem appears to prefer a broad index for the cost of debt rather
than company-specific debt costs
– Companies retain an incentive to ‘beat the index’
– However, one size may not fit all (e.g. Small Company Premium)
� To our knowledge regulators in Belgium, Finland and Portugal index the risk-free
rate but not the debt premium. We are not aware of regulators who index CoD.

Practical issues with indexation
� Limited data availability
– Bloomberg provides only one GBP-denominated index going back 8Y+ (Ticker: GBP EUR BFV BBB Curve)
– But this index is based on debt issued in GBP by companies outside UK
� Different data providers such as IBoxx have GBP-denominated debt issued by UK companies
– However, IBoxx indices only available for rating classes A and BBB and not for
64
– However, IBoxx indices only available for rating classes A and BBB and not for A- and BBB+
� Further issues
– Regulatory cost of debt is defined in real terms; but no index for the real cost of debt exists
– Using index-linked gilt (ILG) yields plus credit spread produces lower cost of debt than deflating nominal gilts, using inflation from Economic Consensus or Bank of England (because ILG yields are downwardly biased)
– “Breakeven inflation” [nominal gilt yield – ILG yield] is (on average) higher than forecast inflation
� Risk of levering bias in ILG market into the cost of debt allowance

Real Yields on GBP-denominated Debt issued by
European Corporates rated A and BBB
Indexation options based on Bloomberg data
4.0
5.0
6.0
7.0
Re
al
Yie
ld
� 8Y trailing averages of yields vary very little and
65
0.0
1.0
2.0
3.0
4.0
Apr-
03
Oct-
03
Apr-
04
Oct-
04
Apr-
05
Oct-
05
Apr-
06
Oct-
06
Apr-
07
Oct-
07
Apr-
08
Oct-
08
Apr-
09
Oct-
09
Apr-
10
Oct-
10
Re
al
Yie
ld
Real Yield (A) Real Yield (BBB) 5Y Index (A) 5Y Index (BBB) 8Y Index (BBB)
vary very little and provide no more protection against volatility in yields than a fixed allowance
Source: Bloomberg; real CoD based on ILG yield + debt spread. This method gives lower real CoD figures than
nominal yields less expected inflation, where inflation is taken from Economic Consensus or Bank of England;
this is because breakeven inflation is (on average) higher than forecast inflation.

Secondary market yield index fails to account for pre-funding & transaction costs
NERA preliminary analysis of additional costs
� Transaction costs include bank, legal, trustee and agent fees (~7pbs p.a.)
� Pre-funding costs are a real cost to companies (the difference in the cost of the debt and the interest earned on deposits is the ‘cost of carry’)
� We have previously calculated pre-funding and transaction costs (non-coupon costs) at around 15 bps before the financial crisis and 60 bps after the collapse
66
costs) at around 15 bps before the financial crisis and 60 bps after the collapse of Lehman Brothers
Regulatory Precedent
� At DPCR5 Ofgem has dismissed the need for an explicit non-coupon cost allowance but allowed it implicitly by setting the allowed cost of debt above the trailing average.
� CC has allowed 30 bps for Bristol (10 bps for transaction costs + 20 bps for pre-funding)

Recent Utilities Debt Issues (GBP, tenor larger than 10 years)
Recent utility debt issuance (GBP)
Issuer Rating Issue Date
Amount
(£m)
Maturity
(Years)
Headline
Coupon
Yield (%)
Real
Coupon
Yield (%)
DONG ENERGY A/S A- 09/04/2010 500 30 5.87% 3.11%
ANGLIAN WATER SERV FIN A- 17/05/2010 130 35 2.26% 2.26%
ELECTRICITE DE FRANCE A+ 22/09/2010 1000 40 5.23% 2.48%
GDF SUEZ A 01/10/2010 700 50 5.13% 2.39%
CENTRAL NETWORKS WEST PL A 10/12/2010 250 14 5.56% 2.83%
67
Source: Bloomberg; Ratings based on S&P where available and Moody’s where S&P was not available. The headline coupon yield is
calculated as the coupon reported by Bloomberg divided by the issue/ reoffer price. We adjust for expected inflation (as reported by
Consensus Economics) over the life of the bond.
CENTRAL NETWORKS WEST PL A 10/12/2010 250 14 5.56% 2.83%
CENTRAL NETWORKS EAST PL A 10/12/2010 250 30 5.85% 3.09%
Average "A" Rating 33 4.98% 2.69%
SOUTH EAST WATER FIN LTD BBB 11/02/2010 130 31 2.53% 2.53%
NORTHERN GAS NETWORKS BBB+ 23/03/2010 200 30 5.71% 2.96%
WESTERN POWER S.WEST BBB+ 23/03/2010 200 30 5.81% 3.05%
WESTERN POWER S. WALES BBB+ 23/03/2010 200 30 5.81% 3.05%
THAMES WATER UTIL CAYMAN BBB- 13/09/2010 300 20 5.80% 3.05%
Average "BBB" Rating 28 5.13% 2.93%
Average All 31 5.05% 2.80%

Recent Utility Debt Issues (EUR, tenor larger than 10 years)
Recent utility debt issuance (EUR)
Issuer Rating Issue Date
Amount
(£m)
Maturity
(Years)
Nominal
Coupon
Yield (%)
Real
Coupon
Yield (%)
TENNET HOLDING BV A- 09/02/2010 500 12 4.53% 2.53%
ACEA SPA A 16/03/2010 500 10 4.51% 2.54%
IBERDROLA FINANZAS SAU A- 23/03/2010 1100 10 4.16% 2.19%
CEZ AS A- 16/04/2010 750 15 4.89% 2.85%
ELECTRICITE DE FRANCE A+ 27/04/2010 1500 20 4.68% 2.62%
TENNET HOLDING BV A- 03/06/2010 200 20 4.75% 2.69%
SUEZ ENVIRONNEMENT A- 24/06/2010 500 12 4.16% 2.16%
RTE EDF TRANSPORT S.A A+ 28/06/2010 750 12 3.91% 1.92%
� BBB yields lower than “A” debt
– But, BBB shorter maturities
– Small number of BBB issues
� Shorter average tenor may explain some of
68
Source: Bloomberg; Ratings based on S&P where available and Moody’s where S&P was not available. The
headline coupon yield is calculated as the coupon reported by Bloomberg divided by the issue/ reoffer price. We
adjust for expected inflation (as reported by Consensus Economics) over the life of the bond.
Note that for comparability with GBP issues we only look at issues with a minimum maturity of 10 years. See the
appendix for a full list.
RTE EDF TRANSPORT S.A A+ 28/06/2010 750 12 3.91% 1.92%
CEZ AS A- 28/06/2010 500 10 4.54% 2.57%
GDF SUEZ A 18/10/2010 1000 12 3.52% 1.54%
ELECTRICITE DE FRANCE A+ 12/11/2010 750 15 4.05% 2.03%
ELECTRICITE DE FRANCE A+ 12/11/2010 750 30 4.51% 2.43%
CEZ AS A- 08/12/2010 250 10 4.56% 2.59%
Average "A" Rating 14 4.37% 2.36%
GAS NATURAL CAPITAL BBB 27/01/2010 850 10 4.53% 2.56%
VEOLIA ENVIRONNEMENT BBB+ 06/07/2010 834 11 4.25% 2.27%
EUROGRID GMBH BBB+ 22/10/2010 500 10 3.89% 1.94%
Average "BBB" Rating 10 4.22% 2.25%
Average All 14 4.34% 2.34%
may explain some of the difference between GBP (2.8%) and EUR (2.3%) issues

Contact UsContact UsRichard Hern
DirectorLondon+44 20 7659 [email protected]
© Copyright 2010
NERA UK Limited
All rights reserved.
Tomas Haug
Senior ConsultantLondon+44 20 7659 [email protected]


