32
Unfolded Cigarette Boxes (Flats) Packages Ltd Statistical Quality Management Group members Abdul Rafeh Iqbal Asad Mujeeb
| Date post: | 07-Apr-2018 |
| Category: |
Documents |
| Upload: | abdulrafehiqbal |
| View: | 229 times |
| Download: | 0 times |
8/6/2019 SQM Final Project
http://slidepdf.com/reader/full/sqm-final-project 1/32
Unfolded Cigarette Boxes (Flats)
Packages Ltd
Statistical Quality Management
Group members
Abdul Rafeh Iqbal
Asad Mujeeb
8/6/2019 SQM Final Project
http://slidepdf.com/reader/full/sqm-final-project 2/32
2
T able of contents
1. Executive Summary 4
2. Company Profile 53. Current Statistical Quality Control Systems 64. Application of Management Strategies 65. Eight Dimensions of Quality 76. Application of Descriptive Statistics 97. Statistical Methods Useful in Quality Improvement 128. Chance & Assignable Causes of Quality Variations 139. Magnificent Seven & Application 1410. Control Charts for Variables 1911. Control Charts for Attributes 2112. Process and Measurement System Capability Analysis 2313. Acceptance Sampling for Attributes and Variables 2614. ISO Standardization 2915. Application of Six Sigma Approach 2916. Critique of the Quality Control System 3017. References 3118. Annexure / Appendix 32

8/6/2019 SQM Final Project
http://slidepdf.com/reader/full/sqm-final-project 3/32
3
Acknowledgements
Firstly we would like to thank Mr. Shahid Hafeez, Manager of the Industrial performance department forgiving us the time to explain and make us understand all the various aspects of quality in the printindustry, and then providing us complementary information on the Rivera Lemanic print line on whichwe based our Statistical Quality Management project
Secondly we would like to thank Mr. Waqas Shuggaht, for also giving us a tour of the print line andexplaining to us in detail all the functions and operations of the machines. We thank him also for givingus an insight into the SQM systems in packages and techniques used in Quality control
Lastly we d like to thank Mr. Kamran Ijaz for providing us with the data on which we have performed the
test and tasks required to give meaning and purpose to this project
Thank you all

8/6/2019 SQM Final Project
http://slidepdf.com/reader/full/sqm-final-project 4/32
4
Ex ecutive Summary
Packages specializes in packaging using paper as the raw materials and covers a wide range of packagingmaterials starting from Cigarette boxes to tissue paper boxes, pamper covers to biscuit boxes. Thepartial project focuses in-depth quality management and statistical methods applied to interpret thecurrent quality standards and variations in the product and machinery. The product that has beencomprehensively spotlighted is Unfolded Cigarette boxes (flats).Being pioneers in the Packaging Industry, Packages observers strict measures to meet, ensure, andenhance Quality Standards by the use of advancing Quality Management Systems. Packages currently isguaranteeing Quality Assurance Systems and making head-fast implementations towards QualityMaintenance Systems to create a Material-Machine Relationship.

8/6/2019 SQM Final Project
http://slidepdf.com/reader/full/sqm-final-project 5/32
5
Company P rofile
Established in 19 56 as a joint venture between the Ali Group of Pakistan and Akerlund and Rausing of Sweden, Packages Limited provides premium packaging solutions for exceptional value to individualsand businesses. We are the only packaging facility in Pakistan offering a complete range of packagingsolutions including offset printed cartons, shipping containers and flexible packaging materials toindividuals and businesses world-wide. Our clientele includes illustrious names such as Unilever andPakistan Tobacco Company, who have been our customers for over 50 years. We employ over 3 000 people and had sales of over US $ 1 00 million in 2 004 .
Listed on all three stock exchanges in Pakistan, Packages Limited has maintained a long-time creditrating of AA. Our joint ventures and business alliances with some of the world's biggest names reflect
our forward-looking strategy of continuously improving customer value through improvements inproductivity.
Packages has always been at the forefront of new developments in packaging research and haspioneered several innovations, including the use of wheat straw as a raw material for paper and boardmanufacture. Our on-site paper and board mill, established in 19 68 , has constantly increased itsproduction capacity. A new plant with even greater capabilities is planned for the near future.

8/6/2019 SQM Final Project
http://slidepdf.com/reader/full/sqm-final-project 6/32
8/6/2019 SQM Final Project
http://slidepdf.com/reader/full/sqm-final-project 7/32
7
based on the amount of quality improvement in terms of immediate change that they bring. So, while aset of rules are being applied, there is always room for more efficiency.
8 D imensions of q uality
P roduct Unfolded Cigarette b o x es (F lats)
P erformance: The purpose of the product is to fold neatly into a box with functions performed at thePTC manufacturing plant. In order for that to happen the product must have consistence and equal cutlines and since each flat is cut from a big sheet on which 21-2 7 flats may be printed, the cutting needs tobe exact so as to not include part of another flat and compromise the structure and appearance
Features: The flat should have the specified features, the different colors on the flat should not overlapeach other, the colors used should be in conformity with the shades required by the brand, theembossing should be exactly on the text required and not deviated and the text or drawing should notbe smudged
Reliability: Since each flat has to be put through a machine, each flat should be within invisiblespecification of grammage, caliper and tensile strength to successfully make it out of the machineotherwise it could cause obstructions and cause a stoppage of the machine which would be veryexpansive and time consuming to restart
Conformance: Since this is not a finished a product the flats have to still meet specification of the clientsmachines which fold it into a box. The clients specification are regarding firstly grammage which is thenumber of fibers per square meter, then Caliper which is the thickness of the board and tensile strengthwhich the strength of the paper board vertically and horizontally
Durability: The flats first have to be transported and they have to deal with different levels of humidityand wetness in regards to different location of PTC factories, thus they need to remain in their originalshape. Each Flat has a certain amount of curve towards one side which is required by the machines atPTC and humidity can take that away or worsen it thus conditions of transportation need to be takeninto regard. Lastly the machines pull, push and exert pressure on the flats thus regarding tensile strengthspecifications need to adhere to.
Serviceability: Since the product is just a length of board with printing an embossing, if created out of speciation it cannot be repaired. Out of specification flats sent back by PTC cannot be repairedindividually because they are not of the nature which would be conducive to input them into the originalmachine but with the nature of the industry, Packages limited can recycle it completely bleach the woodfiber and put it into another paper board reel which can be used for another batch of flats.
8/6/2019 SQM Final Project
http://slidepdf.com/reader/full/sqm-final-project 8/32
8
Aesthetics: Pakistan Tobacco Company has certain brands, and these brands carry certain logos,designs and specific colors, the products (flats) need to adhere to all of these things if the company is tocreate a brand relation with their customers. Another major aspects is the colors used in the printingthey should be in conformity with the shades requires by the company. All of these characteristics of abrand are very important for consumer to draw bond with the brand
P erception or perceived Quality: Even thought the cigarette box is not a product of Pakistan tobaccocompany, people who smoke their cigarettes will draw conclusions from their experience as a wholewhich includes the experience they have with the box, Thus lack of quality in the box may have thecustomer thinking that the cigarettes contained in the box are also of low quality, thus it is of highimportance for PTC and Packages to have a good relationship and produce a quality product

8/6/2019 SQM Final Project
http://slidepdf.com/reader/full/sqm-final-project 9/32
9
Application of Descriptive Statistics
Aspect of Product chosen: Grammage : This is the amount of grams per square meter of fibers whichare left in the form of paper after almost 9 0 % of the water is taken out from the pulp
Shown Above is part of the sampling spread sheet in which the daily data is stored, from every reelthere are 2 sets of samples. Each reel is up to 1 500 meters of cardboard paper, the first set of samplesare taken from around 11 00 meters and the second from around 450 , finished flats come of threeparallel conveyer belts which are denoted by (a)(b) and (c), and supporting is the grammage data fromthe Packages paper labs
Grammage lower limit target upper limitbase board 180 188 196coating 18 20 22finished 196 208 218
Shown above are the specification of the Flats (unfolded cigarette boxes) required by the Pakistantobacco company, we will use this to analyze the descriptive statistics
D a
e Ree ¡ No. Sa ¢ p ¡ e No. £ ¤ a ¢ ¢ ageg/ ¢ ²
1 ( a ) 2191 ( b ) 2181 ( c ) 2152 ( a ) 2192 ( b ) 2172 ( c ) 2221 ( a ) 2161 ( b ) 2131 ( c ) 2202 ( a ) 2172 ( b ) 217
2 ( c ) 2181 ( a ) 2171 ( b ) 2111 ( c ) 2212 ( a ) 2142 ( b ) 2152 ( c ) 2206763- c7 /8/200 7
614 2 -c
61 07- c
8/6/2019 SQM Final Project
http://slidepdf.com/reader/full/sqm-final-project 10/32
10
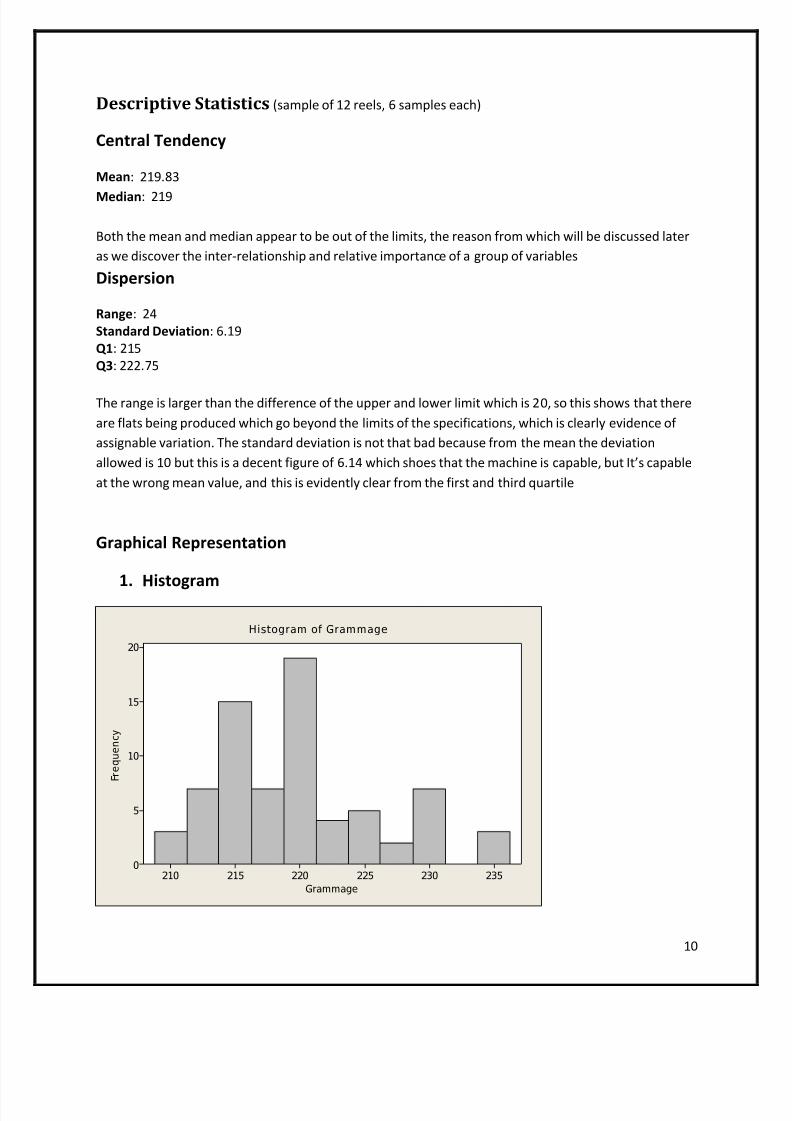
Descriptive Statistics (sample of 12 reels, 6 samples each)
Central T endency
Mean : 219. 8 3
Median : 219
Both the mean and median appear to be out of the limits, the reason from which will be discussed lateras we discover the inter-relationship and relative importance of a group of variables
Dispersion
Range : 24 Standard Deviation : 6 .19Q1 : 215 Q3 : 222. 7 5
The range is larger than the difference of the upper and lower limit which is 2 0 , so this shows that thereare flats being produced which go beyond the limits of the specifications, which is clearly evidence of assignable variation. The standard deviation is not that bad because from the mean the deviationallowed is 1 0 but this is a decent figure of 6 .14 which shoes that the machine is capable, but It s capableat the wrong mean value, and this is evidently clear from the first and third quartile
Graphical Representation
1.
H istogram
Grammage
F r e q u e n c y
235230225220215210
20
15
10
5
0
Histogram of Grammage
8/6/2019 SQM Final Project
http://slidepdf.com/reader/full/sqm-final-project 11/32
11
As shown above the Histogram of the distribution shows that the data set is symmetrically skewedwith the mean and median being almost the same, however there are more classes above themean, but with comparatively less frequency, thus the graph may now look exactly normallydistributed. A matter of concern however is that the Mean of the distribution is even higher thanthe upper limit of the specifications.
2 . Stem and leftStem-and-leaf of Grammage N = 72Leaf Unit = 1.0
3 21 11110 21 222223319 21 44444455528 21 666666777
(12) 21 88889999999932 22 0000000111121 22 222317 22 45
15 22 666711 22 899 23 000011
As shown above and hinted from the histogram table, the date distribution of Grammage issymmetrically skewed, with the median at 219, which is a really high median to have when we lookat the specification of the required product
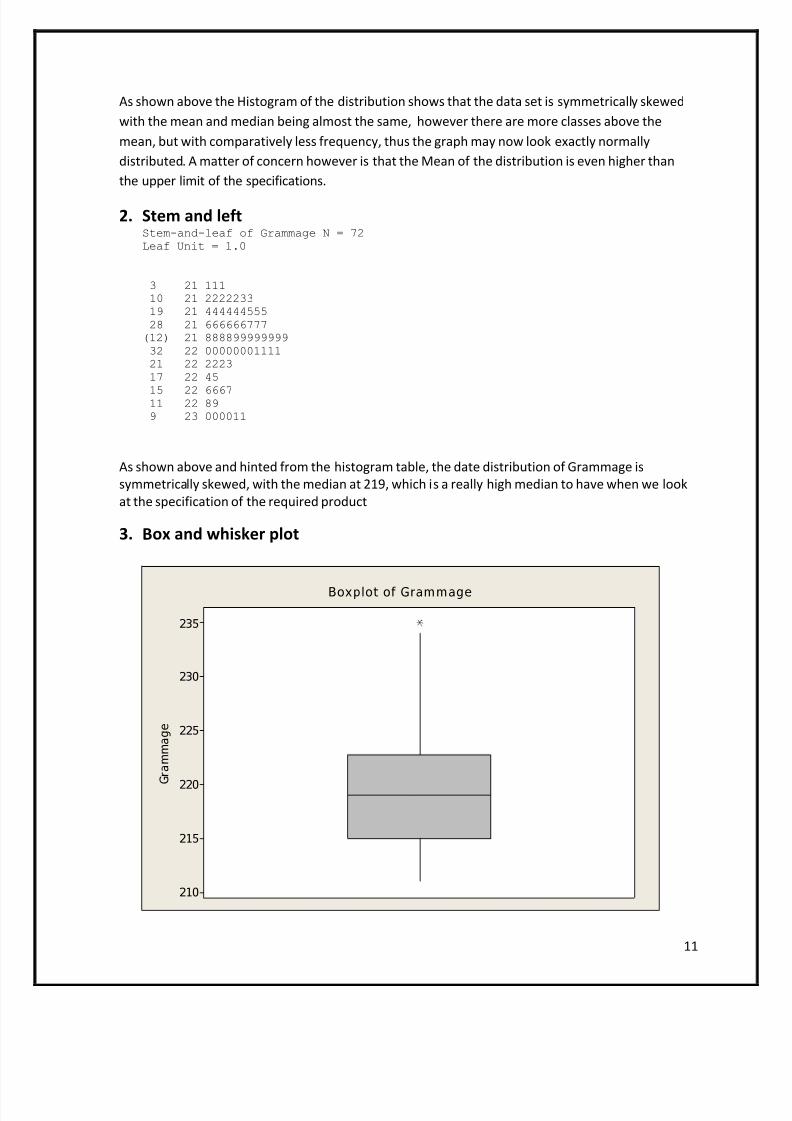
3. B ox and whisker plot
G r a m m a g e
235
230
225
220
215
210
Boxplot of Grammage

8/6/2019 SQM Final Project
http://slidepdf.com/reader/full/sqm-final-project 12/32
12
The above figure shows the Box and whisker plot, which basically depicts the same information asshown above but in this plot we can see the unnecessarily large range of the grammage that thecompany is currently providing.
Statistical Methods useful in Quality Improvement
Packages incorporates many different statistical methods which it finds useful in improvement of Quality , 2 of the most popular and usual are mentioned below
1. P rocess Capability2 . Control charts
But apart from these techniques packages pays a lot of heed to quality in matters of product in terms of machinery, in terms of employee efficiency and the quality of the firm as a whole. These include, theQM Matrix, QA Matrix, and YY Analysis & YYBecause Logic
T he QM Matrix is a tool that has been designed to measure the quality not only from the linguistic pointof view, but also from the functional- technical point of view of the product. Therefore its audience ismultiple: PM, TPM, vendors, Linguists, customers and anyone interested in monitoring the quality of thelocalized products.T he QA Matrix consists of two separate sheets:
y Review- sheet, which includes the "Review Comment" of the reviewery Evaluation- sheet, which includes the "Results" tables
The two sheets will be combined into one file when a reviewer evaluates the translation quality.
T he YY analysis is a technique which simply focuses towards the root problem, and can be applied toproducts, machines, employees and etc. it is famously pronounced the 5 Why analysis. When multipleWhy s are asked, each question leads to an answer and each answer leads towards another questionand thus that is how the root cause of the problem is reached.
8/6/2019 SQM Final Project
http://slidepdf.com/reader/full/sqm-final-project 13/32
13
Chance and Assigna b le Causes of Quality Variation
Chance of random variation can be caused from a variety of sources, some of which are mentionedbelow.
1. Un-even heating and cooling of the machine can produce expansion and contraction in the partsof the machines which may cause minor variations in their performance causing randomvariation
2. Variation in the viscosity of the ink used in the print line3. Fluctuations in the specifications of the Card board supplied by the packages paper mill. We are
talking about the in-range specifications, (e.g. Grammage UL=21 8 , LL=196 ) these minorfluctuation cause random variations in the final flats produced
Assignable causes of variation are as follows1. Power surges are a major cause in the assignable causes of variation, for they may make the
machines behave in an unusual manner for that time phase, the parts of the machines may notbe in proper Sync for that time, and may result in out of specification flats being produced
2. Where there are patches of card board in the reel which have specification out of range, thesepatches may cause problems to the machines which are designed to perform with set rules androom for flexibility, Thus these out of specification patches create errors in most of the processand cause flats made to be out of specification and deformed( smudged and un-cut)

8/6/2019 SQM Final Project
http://slidepdf.com/reader/full/sqm-final-project 14/32
14
T he Magnificent Se7en
1. Defect Concentration Chart
1
2
3
4
5
Defect Detection, concentration andidentification
1. When the reel of card board is printed, eachof the color( 8 ) stations print a cross on theflat, in the end all the crosses should beover each other, and we can detect thecolors which are not aligned properly
2 . Every printed flat has a identificationnumber , there are almost up to 21-2 7 flat
on one sheet, if a defect is found, thedefective, blade, color and emboss cylindercan be pin pointed
3. Gold Leaf has to be embossed on everyflats, those whose alignment is out can bepointed with the identification number, andthe defect can be counted and quantified,and analyzed later
4. D efect concentration can also be done usingthe 4 positions shown by the arrows with
cuttings which have to fold, impropercutting due to blunt blades can causesection of un-cut
5. On the sides of the flat are lines along whichthe Flat is suppose to be cut, and this linesbecomes a shorter and fatter with adifference of 0 .5 mm, to give an estimate of the deviation, as shown, defectconcentration can also be used with this
8/6/2019 SQM Final Project
http://slidepdf.com/reader/full/sqm-final-project 15/32
15
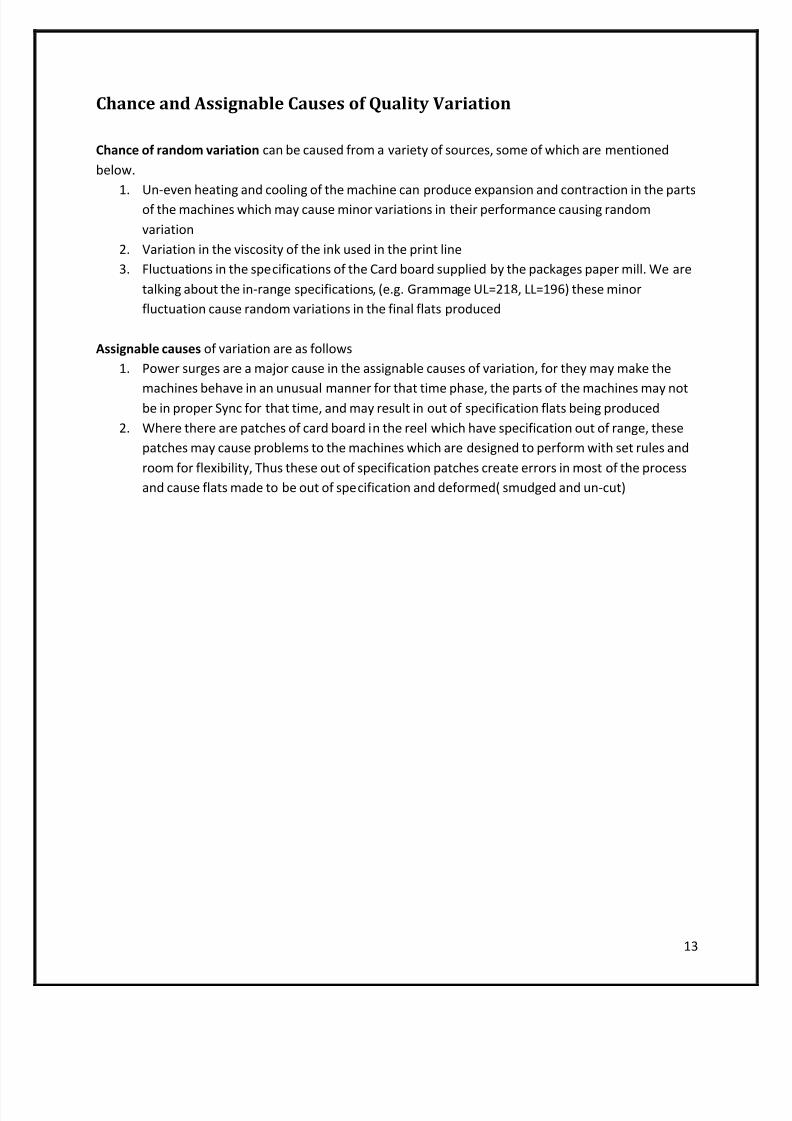
2 . Cause and effect diagram
IncreasedWastage
Environment
Material
Machines
Personnel
lazy(repairs/replacements)
ego(non co-operation)
over condident
improper feed of paper
inconsistant cooling
wornout print cylinders
Caliberation time
Imporper lubrication
blunt razors
ink viscosity
wrongshade(ink)
changinghumidity
water/ink spills
d e l e g a t i o n
I m p r o p e r
f r i e n d l y t o o
s u p e r v i s o r
p e r s o n n e l
c h a n g i n g
k n o w l e d g e
p r e - s t a r t o f l a c k
c o n d i t i o n s
l i g h t i n g W r o n g
i n g r e d i e n t s o f m i x
i n c o n s i s t a n c e
c o n t r o l a t m o s o f
l a c k
Cause-and-E ffec t Di ag ram
Above shown is the Cause and effect diagram for the causes and effect of increased Wastage
8/6/2019 SQM Final Project
http://slidepdf.com/reader/full/sqm-final-project 16/32
16
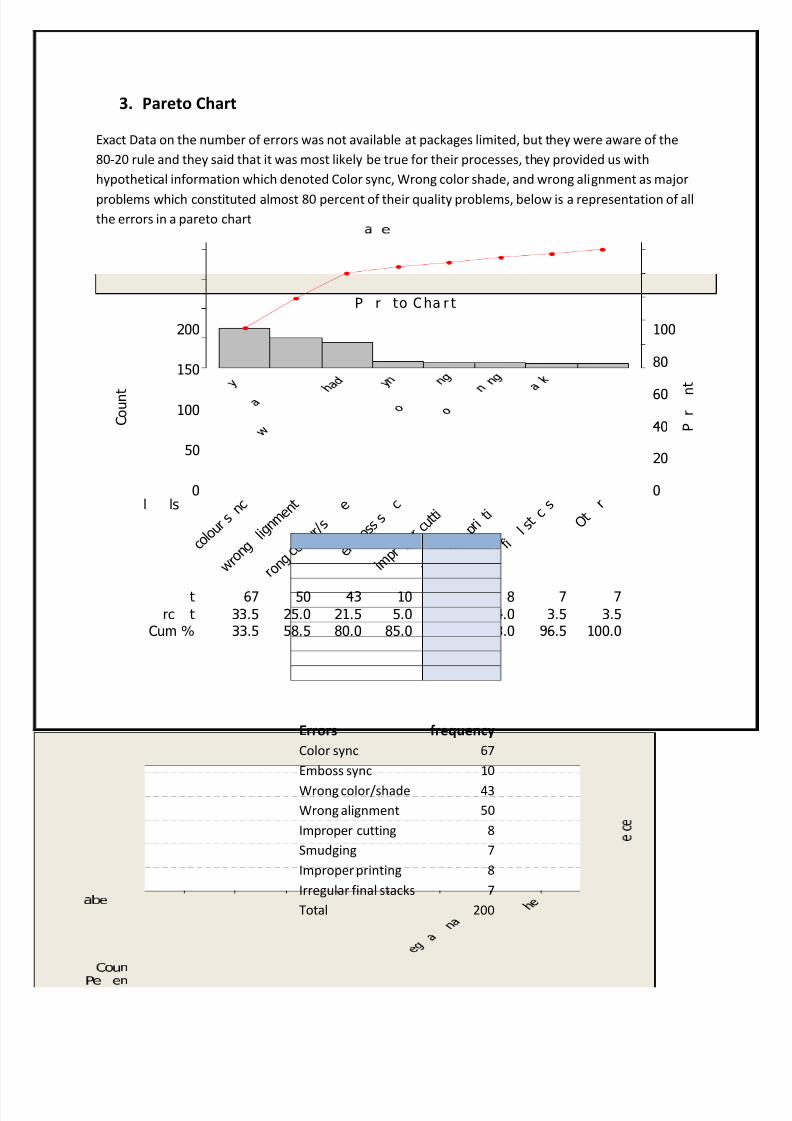
3. P areto Chart
Exact D ata on the number of errors was not available at packages limited, but they were aware of the80 -20 rule and they said that it was most likely be true for their processes, they provided us withhypothetical information which denoted Color sync, Wrong color shade, and wrong alignment as major
problems which constituted almost 80 percent of their quality problems, below is a representation of allthe errors in a pareto chart
C o u n t
P¥
r¦
¥ n t
l§
¨
© ls
t
© rc ©
t 33. 5 25 .0 21 .5 5 .0 4 .0 4 .0 3.5 3.5Cum %
67
33. 5 58 .5 80 .0 85 .0 89 .0 9 3.0 9 6.5 100 .0
50 4 3 10 8 8 7 7
O t r
i r r u l r
f i l s
t c s
i m p r
p e r p
r i t i
i m p r
p e r c
u t t i
e m b o
s s s
c
r o n g c
o l o u r / s
e
w r o n
g l i g n m
e n t
c o l o u r s
n c
200
150
100
50
0
100
80
60
40
20
0
P r t o Cha rt
Errors frequencyColor sync 6 7 Emboss sync 1 0 Wrong color/shade 4 3Wrong alignment 50 Improper cutting 8 Smudging 7 Improper printing 8 Irregular final stacks 7 Total 2 00
8/6/2019 SQM Final Project
http://slidepdf.com/reader/full/sqm-final-project 17/32
17
4. Stem and leaf/ H istogram
H istogram
Grammage
F r e q u e n c y
235230225220215210
20
15
10
5
0
Histogram of Grammage
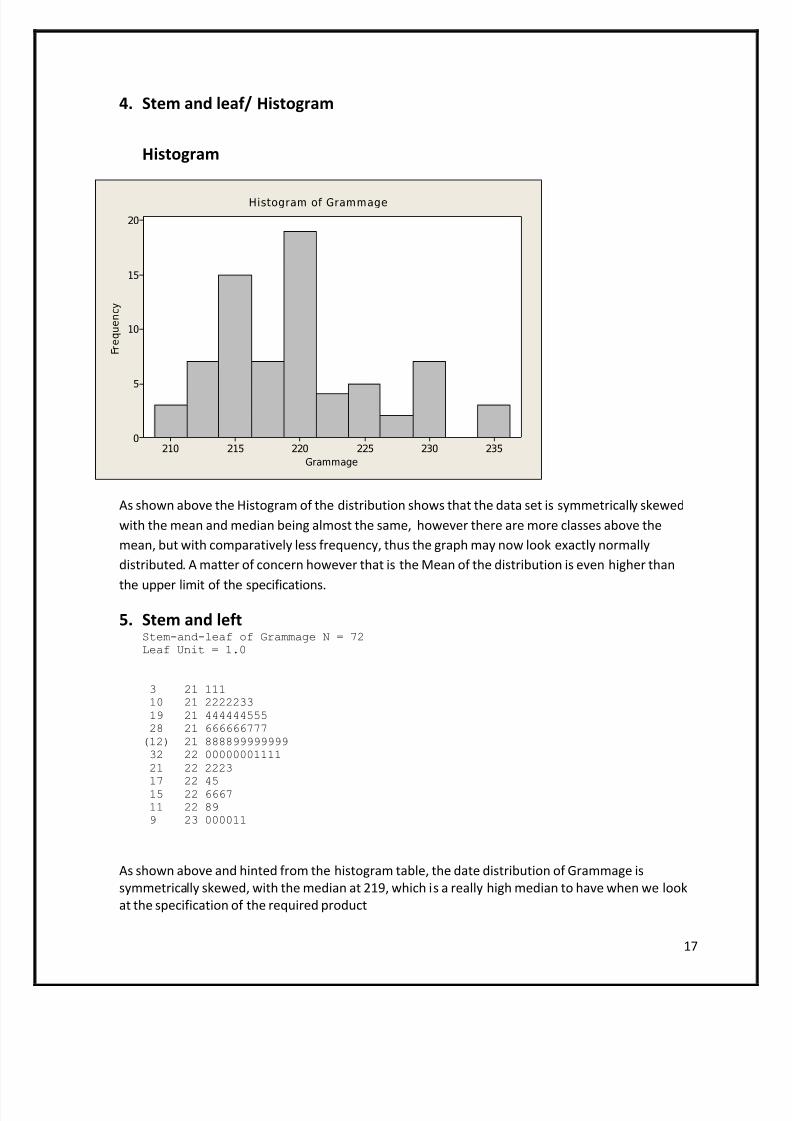
As shown above the Histogram of the distribution shows that the data set is symmetrically skewedwith the mean and median being almost the same, however there are more classes above themean, but with comparatively less frequency, thus the graph may now look exactly normallydistributed. A matter of concern however that is the Mean of the distribution is even higher than
the upper limit of the specifications.
5. Stem and leftStem-and-leaf of Grammage N = 72Leaf Unit = 1.0
3 21 11110 21 222223319 21 44444455528 21 666666777
(12) 21 88889999999932 22 0000000111121 22 2223
17 22 4515 22 666711 22 899 23 000011
As shown above and hinted from the histogram table, the date distribution of Grammage issymmetrically skewed, with the median at 219, which is a really high median to have when we lookat the specification of the required product

8/6/2019 SQM Final Project
http://slidepdf.com/reader/full/sqm-final-project 18/32
18
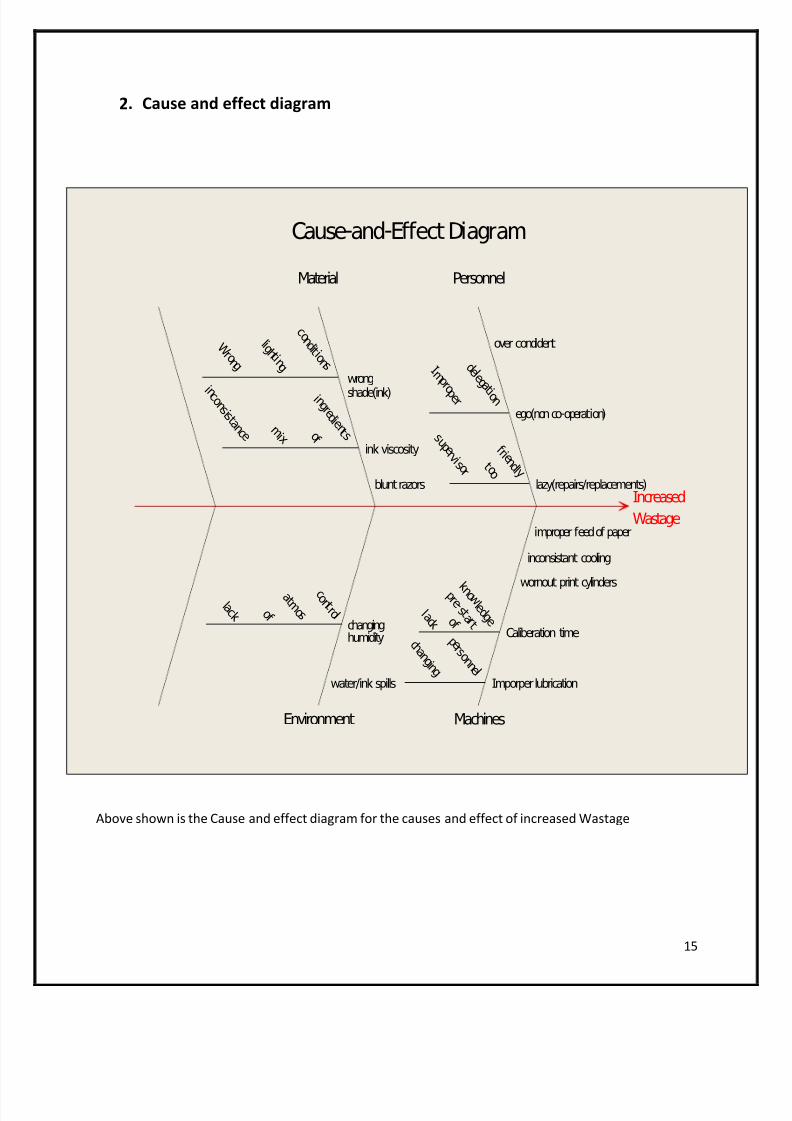
6. Control Charts
S ample
S a m p
l e M e a n
121110987654321
230
225
220
215
_ _X=219 .83
UCL=224 .52
LCL=215 .15
1
11
Xbar Chart of Grammage
Shown above is a simple X-bar chart of the grammage of the paper used, simple size was 6 and12 samples were used, and this chart is helpful in showing that the process is out of control asshown by the red dots. A more detailed analysis of variables and attributes in done in the nextsection
7 . Scatter plot (Variables for which data was provided were not related to each other , thus
were were unable to present any meaningful scatter plots) 8. Check sheet (the appropriate information was not available from packages limited to create
this sheet)
8/6/2019 SQM Final Project
http://slidepdf.com/reader/full/sqm-final-project 19/32
19
Control Charts Varia b les
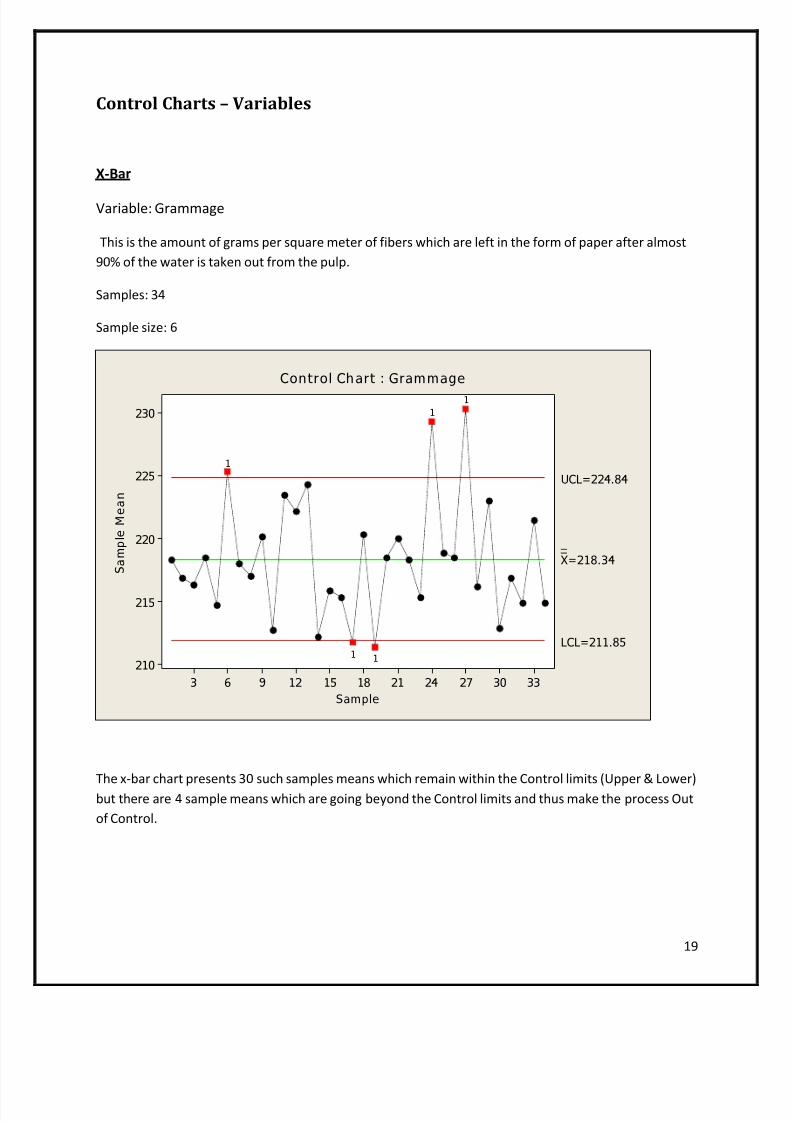
X-B ar
Variable: Grammage
This is the amount of grams per square meter of fibers which are left in the form of paper after almost90 % of the water is taken out from the pulp.
Samples: 3 4
Sample size: 6
S ample
S a m p
l e M e a n
3330272421181512963
230
225
220
215
210
_ _X=218.34
UCL=224.84
LCL=211.85
11
11
1
Control Ch art : Grammage
The x-bar chart presents 3 0 such samples means which remain within the Control limits (Upper & Lower)but there are 4 sample means which are going beyond the Control limits and thus make the process Outof Control.

8/6/2019 SQM Final Project
http://slidepdf.com/reader/full/sqm-final-project 20/32
20
R-Chart
Variable: Grammage
This is the amount of grams per square meter of fibers which are left in the form of paper after almost
90
% of the water is taken out from the pulp.Samples: 3 4
Sample size: 6
S a ple
S a
p l e
R a n g e
3330272421181512963
70
60
50
40
30
20
10
0
_R=13.44
UCL=26.94
LCL=0
1
Control Chart : Gra age
The representation of the R-Chart shows 2 distinct results, though the process is undoubtedly goes outof control once. The value which goes beyond the UCL is called assignable variation and is due to ashort-failure of the electricity for micro-seconds, this causes the range for the certain sample to be outof control. Apart from this detail, most of the samples come out to be below the Central line = R-bar.
This means that according to this feature, the process is again out of control.

8/6/2019 SQM Final Project
http://slidepdf.com/reader/full/sqm-final-project 21/32
21
Control Charts- Attri b utes
P-chart
Variable: Cut to Print
D epending on the job there could be 21 or 2 7 flats printed on one sheet, they need to be cut andseparated, but they need to be cut exactly on lines which divides each individual flats from the other, if the cut is along the wrong lines then one flats will contain parts of another and the design of the packwill not complement the shape once it is folded, Thus the print cut can only deviate 0 .5 mm from theideal center where the cut should ideally be.
Samples: 3 4
Sample size: 6
S a ple
P r o p o r
t i o n
3330272421181512963
0.5
0.4
0.3
0.2
0.1
0.0
_P=0.0980
UCL=0.4622
LCL=0
1
Control Chart : Cut to Print
The P-Chart clearly shows out of control process, with 1 7 samples on the LCL and 1 sample beyond theUCL.
8/6/2019 SQM Final Project
http://slidepdf.com/reader/full/sqm-final-project 22/32
22
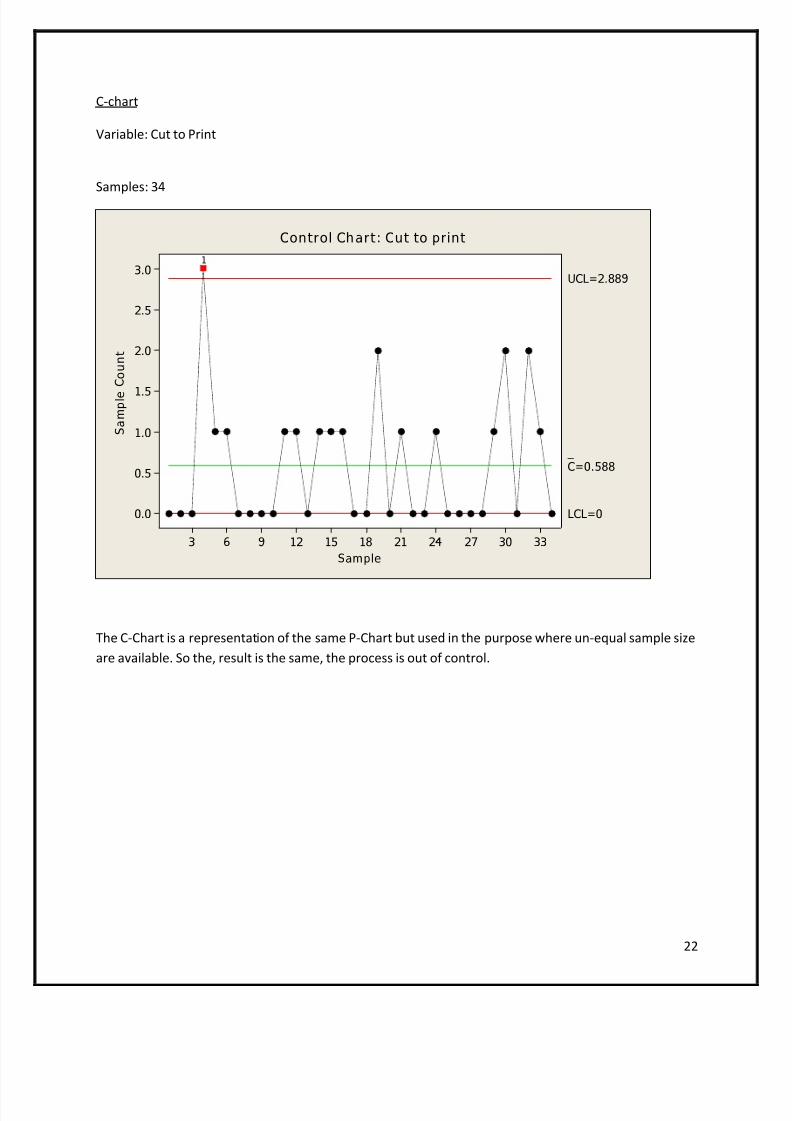
C-chart
Variable: Cut to Print
Samples: 3 4
S ample
S a m p
l e
C o u n
t
3330272421181512963
3.0
2.5
2.0
1.5
1.0
0.5
0.0
_C=0.588
UCL=2.889
LCL=0
1
Control Ch art: Cut to print
The C-Chart is a representation of the same P-Chart but used in the purpose where un-equal sample sizeare available. So the, result is the same, the process is out of control.
8/6/2019 SQM Final Project
http://slidepdf.com/reader/full/sqm-final-project 23/32
23
P rocess Capa b ility Analysis
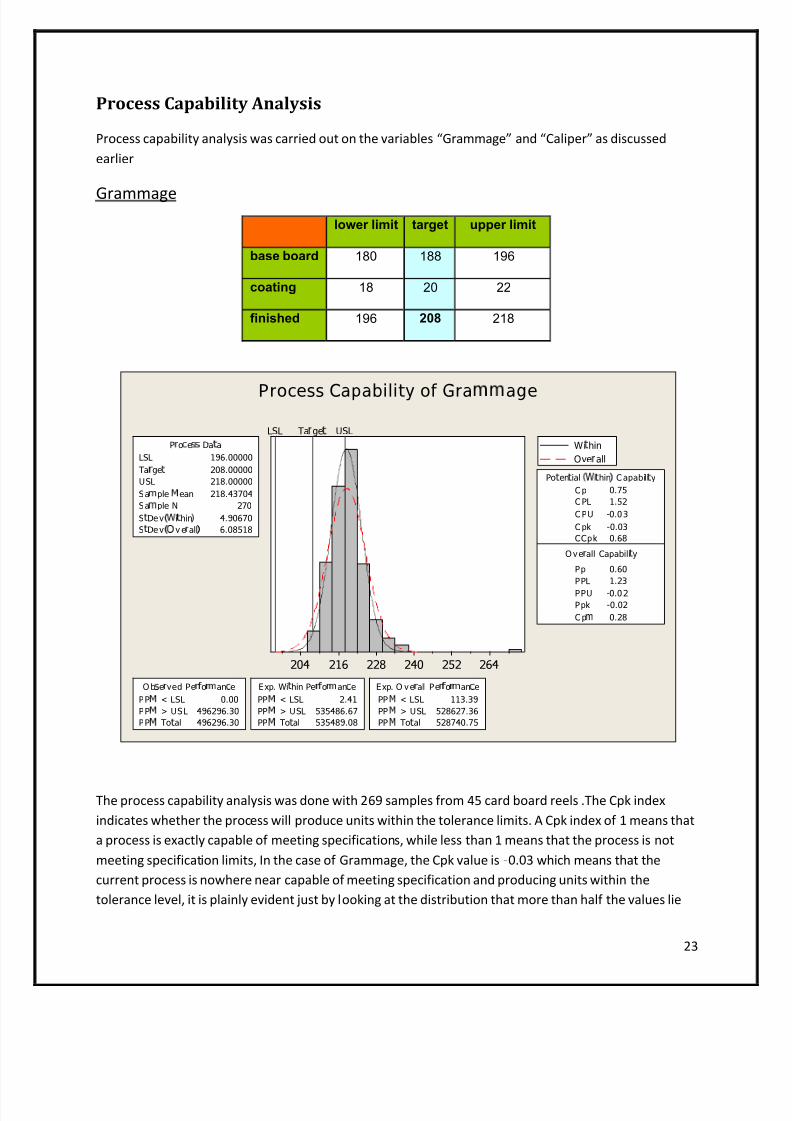
Process capability analysis was carried out on the variables Grammage and Caliper as discussedearlier
Grammage
264252240228216204
LSL Ta! ge " USL
P # o $ e % % Da & a
Sa ' ple N 270
S & De v ( ) i& hin 0 4.90670
S & De v ( 1 v e # all 0 6.08518
LSL 196.00000
Ta # ge & 208.00000
USL 218.00000
Sa ' ple 2 ean 218.43704
Po & en & ial ( ) i& hin 0 C apabili & y
CCpk 0.68
O v e # all Capabili & y
Pp 0.60PPL 1.23
PPU -0.0 2Ppk
C p
-0.02
C p' 0.28
0.75C PL 1.52
C PU -0.0 3
C pk -0.03
O b % e # ved Pe # 3 o # ' an $ ePP 2 < LSL 0.00PP 2 > USL 496296.30PP 2 To & al 496296.30
Exp. W i & hin Pe # 3 o # ' an $ ePP 2 < LSL 2.41PP 2 > USL 535486.67PP 2 To & al 535489.08
Exp. O v e # all Pe # 3 o # ' an $ ePP 2 < LSL 113.39PP 2 > USL 528627.36PP 2 To & al 528740.75
W i" hinO ve ! all
Process Capability of Gra 4 4 age
The process capability analysis was done with 2 6 9 samples from 45 card board reels .The Cpk indexindicates whether the process will produce units within the tolerance limits. A Cpk index of 1 means thata process is exactly capable of meeting specifications, while less than 1 means that the process is notmeeting specification limits, In the case of Grammage, the Cpk value is - 0 .0 3 which means that thecurrent process is nowhere near capable of meeting specification and producing units within thetolerance level, it is plainly evident just by looking at the distribution that more than half the values lie
lower limit target upper limit
base board 180 188 196
coating 18 20 22
finished 196 208 218
8/6/2019 SQM Final Project
http://slidepdf.com/reader/full/sqm-final-project 24/32
24
beyond the upper limit, there appears to be a strong need for improvement in the current processwhich shows a considerable amount of variability and inconformity with the desired specifications.
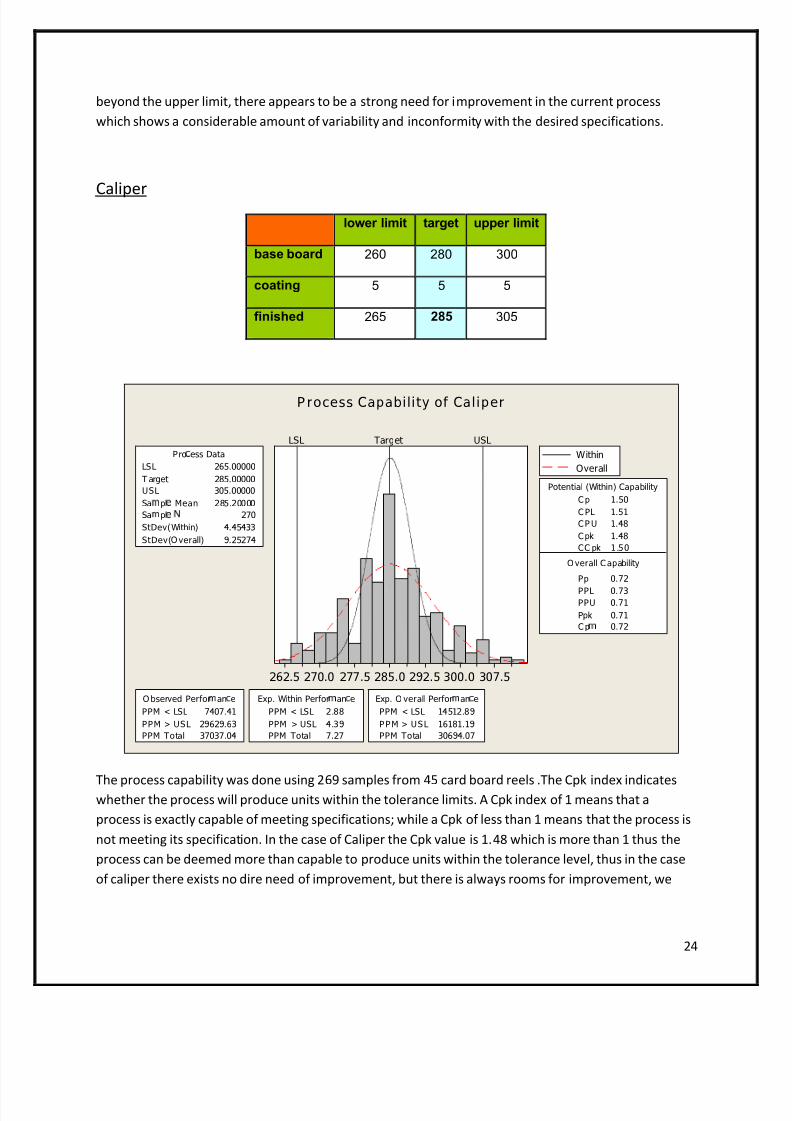
Caliper
30 7.5300.0292.5285.0277 .5270.0262.5
LSL Target USLPro 5 ess Data
Sa 6 pl7 8 270StDev(W ith in) 4.45433StDev( O vera ll) 9.252 74
LSL 265.00000Target 285.00000USL 305.00000Sa 6 pl7 Mean 285.20000
Potent ia l (With in) Capab ility
CC pk 1 .50
O vera ll C apab ility
Pp 0. 72
PPL 0. 73PPU 0. 71Ppk
C p
0. 71C p6 0. 72
1.50C PL 1.51C P U 1.48C pk 1.48
O bserved Perfor 6 an 5 ePPM < LSL 7407.41PPM > USL 29 629. 63PPM Tota l 37037.04
Exp. W ith in Perfor 6 an 5 ePPM < LSL 2.88PPM > USL 4.39PPM Tota l 7 .2 7
Exp. O vera ll Perfor 6 an 5 ePPM < LSL 14512.89P P M > U S L 1 6181.19PPM Tota l 30694.0 7
With inOvera ll
P rocess Capability of Caliper
The process capability was done using 26
9 samples from45
card board reels .The Cpk index indicateswhether the process will produce units within the tolerance limits. A Cpk index of 1 means that aprocess is exactly capable of meeting specifications; while a Cpk of less than 1 means that the process isnot meeting its specification. In the case of Caliper the Cpk value is 1. 48 which is more than 1 thus theprocess can be deemed more than capable to produce units within the tolerance level, thus in the caseof caliper there exists no dire need of improvement, but there is always rooms for improvement, we
lower limit target upper limit
base board 260 280 300
coating 5 5 5
finished 265 285 305
8/6/2019 SQM Final Project
http://slidepdf.com/reader/full/sqm-final-project 25/32
25
should not forget that sample values have exceeded limits from both sides, the process can be improveto produce all the units with the in wide range of 2 65 to 3 05 .
8/6/2019 SQM Final Project
http://slidepdf.com/reader/full/sqm-final-project 26/32
26
Acceptance sampling for Variable (Grammage)
Customer: P akistan T obacco Company
Sampling information
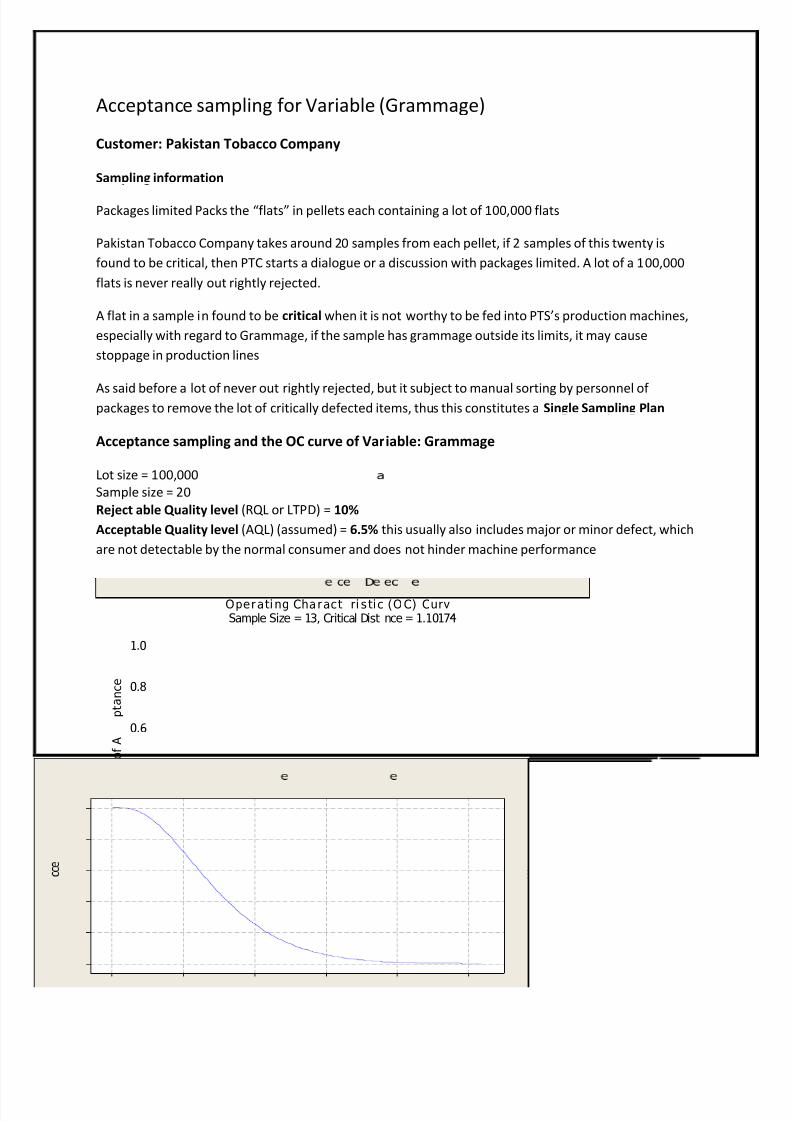
Packages limited Packs the flats in pellets each containing a lot of 1 00 ,000 flats
Pakistan Tobacco Company takes around 2 0 samples from each pellet, if 2 samples of this twenty isfound to be critical, then PTC starts a dialogue or a discussion with packages limited. A lot of a 1 00 ,000 flats is never really out rightly rejected.
A flat in a sample in found to be critical when it is not worthy to be fed into PTS s production machines,especially with regard to Grammage, if the sample has grammage outside its limits, it may causestoppage in production lines
As said before a lot of never out rightly rejected, but it subject to manual sorting by personnel of packages to remove the lot of critically defected items, thus this constitutes a Single Sampling P lan
Acceptance sampling and the OC curve of Variable: Grammage
Lot size = 1 00 ,000 Sample size = 2 0 Reject able Quality level (RQL or LTPD ) = 10%Acceptable Quality level (AQL) (assumed) = 6.5% this usually also includes major or minor defect, whichare not detectable by the normal consumer and does not hinder machine performance
50403020100
1.0
0.8
0.6
0.4
0.2
0.0
Lot P 9 r @ 9 nt A
9 f 9 @ tiv 9
P r o
b a b i l i t y o
f A
B
B
C
p t a n c e
O pe r a ti ng Cha r ac t 9 ri s ti c (O C) Cu rv 9
Samp le Size = 13, Critical Dist D nce = 1.10174
8/6/2019 SQM Final Project
http://slidepdf.com/reader/full/sqm-final-project 27/32
27
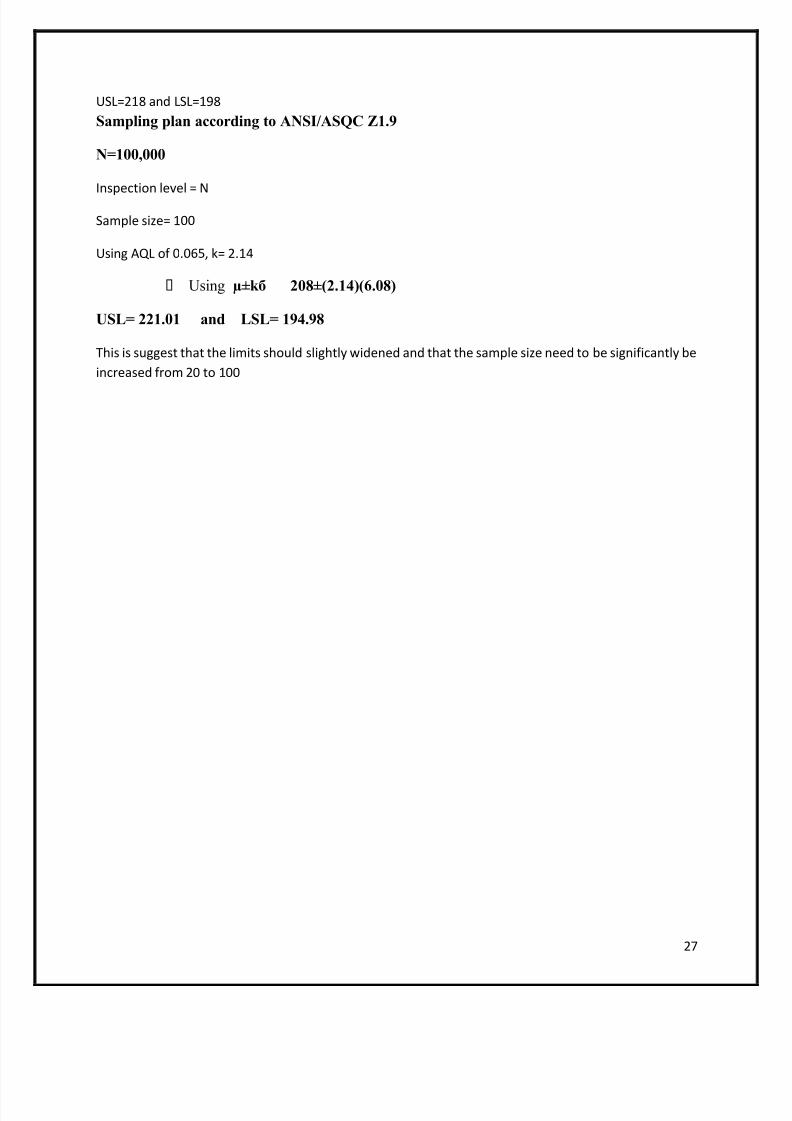
USL=218 and LSL=198 Sampling plan according to ANSI/ASQC Z1.9
N=100,000
Inspection level = N
Sample size= 1 00
Using AQL of 0 .065 , k= 2.1 4
Using µ±k 208 ±(2.14) (6 .08)
USL= 221.01 and LSL= 194.98
This is suggest that the limits should slightly widened and that the sample size need to be significantly beincreased from 2 0 to 1 00

8/6/2019 SQM Final Project
http://slidepdf.com/reader/full/sqm-final-project 28/32
28
Acceptance sampling for Attribute (Cut to Print)
Lot size = 1 00 ,000 n= 20
c=2AQL=0 .04 2Alpha= 0 .04 Beta= 0 .10 LTPD = 0 .26
Sampling plan according to ANSI/ASQC Z1.4, ISO 2859
At inspection level normal for N=1 00 ,000 , the code is N
For this lot size the sample size should have been n=500
At the AQL of 0 .04 Acceptance: 1 and Rejection: 2
According to the sampling plan, PTC needs to increase their samples to 500 and reject a lot of there aremore than 2 defect or developed a manual sort plan in line with packages personnel , PTC couldconsider revising their current sample size and rejection criterion
0
0 .1
0 .2
0 .3
0 .4
0 .5
0 .6
0 .70 .8
0 .91
0 0 .05 0 .1 0 .2 0 .3 0 .4 0 .5 0 .6 0 .7 0 .8 0 .9 0 .95
OC Attribute (Cut to P rint)

8/6/2019 SQM Final Project
http://slidepdf.com/reader/full/sqm-final-project 29/32
8/6/2019 SQM Final Project
http://slidepdf.com/reader/full/sqm-final-project 30/32
30
y Frequent cleaning and maintenance of machinery
Critique
D uring the course of our quality analysis of packages ltd we have learned a lot about the company andone of their major customer The Pakistan tobacco company. Throughout the project we have taken intoaccount 2 main variables namely grammage and caliper, as you might have read the process with regardto grammage is not capable and is out of control, even though grammage is something the operatorshave to vary to keep the caliper within range we urge that effort should also be directed towardsbringing grammage in control, especially taking into regard PTC s machines, which aim to fold the flatswith a prescribed strength. If the grammage of the flat will be too thick the folding process will be
interrupted and this is cause costly stops/starts of the manufacturing process.
Since packages limited deals with a lot of companies, they have a huge variety of orders; they need toorganize their orders in such a way that their machines can have longer operative runs, since it takes awhile for the machine to acquire its rhythm and start producing at the set standards. Constant changesin orders, resetting of specification and condition higher a achievable higher level of quality
Packages is a firm which acquired It s ISO certification in early nineties, and in recent times it has alsobeen working toward acquiring a ISO 1 4000 , and in line in that they have a installed a water treatmentplant in their new factory in Kasur (bullah shah paper mills) , water is taken from all processes of thefactory and collected at one location where it is brought to a constant temperature and then treatedbefore it is used again the process, this will also bring in a higher level of control and consistence inwater involved processes which are abundant in paper manufacturing. This is also a step towards socialcorporate responsibility for which packages limited can be applauded
Lastly we would advise PTC to reconsider their acceptance sampling, they should consider taking up alarger sample size regarding both variables and attributes, this although would come at a cost but whichwould further ensure that critically categorized flats do not enter their manufacturing process whichmight be a source of interruptions or costly stops
8/6/2019 SQM Final Project
http://slidepdf.com/reader/full/sqm-final-project 31/32
31
References
y www.packages.com.pk
Various handouts acquired from packages limited
Quality assurance ISO 9000 and ISO 1 4000
y Mini tab 1 5 (generation of OC curves)
y Packages Quality control department
y Packages Industrial Performance department

8/6/2019 SQM Final Project
http://slidepdf.com/reader/full/sqm-final-project 32/32


