Square-wave switching in vertical-cavity surface-emitting lasers with polarization-rotatedoptical feedback: Experiments and simulations
David W. Sukow,1 Taylor Gilfillan,1 Brenton Pope,1 Maria S. Torre,2 Athanasios Gavrielides,3 and Cristina Masoller4
1Department of Physics and Engineering, Washington and Lee University, Lexington, Virginia 24450, USA2Instituto de Fısica ‘Arroyo Seco’, UNCPBA, Pinto 399 (7000) Tandil, Argentina
3Air Force Research Laboratory AFRL/EOARD, 86 Blenheim Crescent, Ruislip Middlesex HA4 7HB, United Kingdom4Departament de Fısica i Enginyeria Nuclear, Universitat Politecnica de Catalunya, Colom 11, 08222 Terrassa, Barcelona, Spain
(Received 27 March 2012; revised manuscript received 24 July 2012; published 12 September 2012)
We study experimentally the dynamics of vertical-cavity surface-emitting lasers (VCSELs) with polarization-rotated (PR) optical feedback, such that the natural lasing polarization of a VCSEL is rotated by 90 deg and thenis reinjected into the laser. We observe noisy, square-wave-like polarization switchings with periodicity slightlylonger than twice the delay time, which degrade to (or alternate with) bursts of irregular oscillations. We presentresults of simulations that are in good agreement with the observations. The simulations demonstrate that closeto threshold the regular switching is very sensitive to noise, while well above threshold is less affected by thenoise strength. The frequency splitting between the two polarizations plays a key role in the switching regularity,and we identify wide parameter regions where deterministic and robust switching can be observed.
Optical feedback-induced phenomena in semiconductorlasers (SLs) is an active research field that attracts a lot ofattention, motivated, on one hand, by the many applications ofexternal-cavity SLs and, on the other hand, from a nonlinearscience point of view, for the rich variety of complex behaviorsthat are induced by the time-delayed feedback [1–4].
An optical feedback scheme that has received a lot ofattention has been referred to as polarization-rotated (PR)feedback or orthogonal feedback [5–14]. In this scheme a90-deg polarization-rotating device is placed in the externalcavity, and thus, the associated linear orthogonal polarizations(in the following referred to as x and y) are mutually fed back:x-polarized light is reinjected into the laser as y-polarized lightafter a delay time τ , and vice versa. This feedback schemehas attracted attention because it can generate all-opticallysquare-wave (SW) switching, with a periodicity slightly longerthan 2τ .
Several experiments have been performed in which only onepolarization, the natural lasing one, is selected and fed backinto the orthogonal one [15–18]. With this scheme, referred toas selective orthogonal feedback, it has been observed that thefeedback linearly shifts the laser emission frequency [15,16]and, under strong feedback, polarization SWs have also beenobserved [17,18]. Simulations based on the spin-flip model forvertical-cavity surface-emitting lasers (VCSELs) [17] and on atwo-mode model for edge-emitting lasers (EELs) [18] showeda good agreement with the observations. More complexwave forms were also observed, both experimentally andnumerically.
High-frequency, regular SWs are interesting for manyapplications and they have been studied in other optoelectronicsystems [19]. Selective orthogonal coupling, such that thedominant mode of one laser is rotated by 90 deg and theninjected into the naturally suppressed mode of another laser(and vice versa for mutual coupling), is also capable ofproducing all-optically square-wave switching [20]. Withdelays that are of a few nanoseconds, a main advantage of
the feedback or coupling schemes is that they are capable ofproducing SWs with a repetition rate in the gigahertz range,that is tuned by the delay time of the feedback or of thecoupling.
In this article we study experimentally and numericallySWs in VCSELs induced by selective orthogonal feedback.VCSELs are nowadays widely employed in photonics ap-plications as they have many advantages as compared toEELs [21]. A first goal of our work is to compare SWs inVCSELs with those in EELs [18]. Since VCSELs present apolarization behavior that strongly differs from that of EELs,it can be expected that the SWs in these lasers will presentdifferent features. For example, a few of us recently showednumerically [22] that in VCSELs with selective orthogonalcoupling the square waves are more irregular than those inEELs with selective orthogonal coupling [23,24]. Moreover,while in [23,24] the SWs were found to be stable in narrowparameter regions, in [22] they were just a transient dynamic.
A second goal of our work is to find parameters thatoptimize the regularity of the switchings. Our study extendsthe work of Mulet et al. [17] that studied experimentally andnumerically a VCSEL with orthogonal feedback. In [17] thelaser was pumped close to threshold and the simulations weredone with parameters that fitted the experimental situation.Here, the experiments are done with VCSELs biased wellabove threshold, and in the simulations, a wide region ofparameters is explored. In particular, we study two types offeedback: when the high-frequency polarization (referred toas y) is injected into the low-frequency one (referred to asx), and when the low-frequency polarization is injected intothe high-frequency one. These two feedback types will bereferred to as y → x and x → y, respectively. In [17] the laserparameters that fitted the experimental situation correspondedto y → x feedback.
Experimentally, we observe square-wave-like polarizationswitchings that degrade to (or alternate with) bursts of irregularand faster oscillations, and the simulations are found to be invery good agreement with the observations. The simulations
DAVID W. SUKOW et al. PHYSICAL REVIEW A 86, 033818 (2012)
also indicate that close to threshold the regularity of theswitchings is very sensitive to noise, while well above thethreshold is less affected by the noise strength. The frequencysplitting between the two polarizations plays a key role in theswitching regularity, and we identify wide parameter regionswhere deterministic and robust switching can be observed.
This article is organized as follows. The experimentalsetup and observations are presented in Sec. II. Section IIIpresents the spin-flip rate equation model often employedto describe the polarization dynamics of VCSELs, extendedto account for polarization-rotated time-delayed feedback.Section IV presents the results of the simulations, where wefind model parameters (pump current, birefringence) for whichthe switching regularity is optimal and most robust to noise.Our conclusions are presented in Sec. V.
II. EXPERIMENT
In our experiments we employ a VCSEL fabricated tooperate in a single longitudinal mode and single transversemode (Finisar SV3639-001, λ = 856 nm when stabilized intemperature at 18.00 ◦C, the threshold current Ith = 1.18 mA).The stand-alone VCSEL (in the absence of feedback) does notdisplay polarization switching or polarization instabilities.
The experimental setup is shown in Fig. 1. The dynamicalsystem with selective orthogonal optical feedback is formedby a linear external cavity of length 153 cm and photonround-trip time of τ = 10.2 ns. The laser (LD) emissionis collimated by a lens (CL, Newport F-L20, numericalaperture 0.50). A half-wave plate (λ/2) compensates for theinitially non-Cartesian orientation of the polarization, thusallowing for more accurate 90◦ feedback rotation and betterpolarization-resolved detection. The beam then passes througha nonpolarizing plate beamsplitter (BS) that transmits 70% ofthe incident power, and continues through a Faraday rotator(ROT), made of a Faraday isolator with the input polarizerremoved and output polarizer oriented 45◦ from horizontal.The beam, now linearly polarized at 45◦, passes through arotatable polarizer (POL) used to control feedback strength,then reflects from a high-reflectivity mirror (HR). On the returnpath, the beam first passes unchanged through the rotatablepolarizer and then reenters the Faraday through its outputpolarizer. The beam, again forced into a 45◦ linear polarization,now rotates to 90◦, and finally passes through the λ/2 plate so it
LD
PD
ROT POL HRBSCL
PBS
AMP
Oscilloscopeor
RF Analyzer
PD
AMP
HR
λ/2
FL
FL
FIG. 1. Experimental schematic diagram. Abbreviations are de-fined in text.
is reinjected into the VCSEL in a polarization state orthogonalto the natural mode of emission. This configuration createspolarization-selective feedback, since vertically polarized lightis extinguished by the Faraday rotator. This also assures thefeedback arises from only a single round trip in the externalcavity.
Polarization-resolved detection is needed to observe thedynamical effects most clearly. The reflected beam from theplate beamsplitter BS is steered to a polarizing beamsplittercube (PBS). Each of the two resulting beams passes througha focusing lens (FL) onto an ac-coupled photodetector (PD,Hamamatsu C4258-01, 8.75 GHz bandwidth). A widebandamplifier (AMP, 10 kHz to 12 GHz, 23-dB gain) strengthenseach signal, which then is captured and analyzed with a digitalstorage oscilloscope (LeCroy 8600, 6-GHz analog bandwidth)or microwave spectrum analyzer (Agilent E4405B).
Experimental results demonstrate that self-modulatedsquare waves produced by the VCSEL in this configurationtend to be noisy and disordered, but can be optimized by thepump current for a given feedback strength. Figure 2 displaystime series that illustrate the current dependence of the squarewaves. For all time series shown in Fig. 2, the delay time τ =10.2 ns and the round-trip power transmission is 30.6%. Eachgraph shows both polarization modes, captured simultaneouslyand deskewed to compensate for the 0.45-ns difference indetection path length. The horizontal polarization, which isthe natural lasing mode, is shown in dark gray (red coloronline) and the vertical polarization (the suppressed mode) inlight gray (blue color online). The switching regularity appearsto be optimal at I = 2.75 mA [Fig. 2(c)]. Below this currentvalue, the waves degrade by exhibiting rapid oscillations thatdisrupt the square-wave plateaus. Above the optimum value,
FIG. 2. (Color online) Experimental time series of the intensityof both polarization modes of a VCSEL with PR feedback at variouspump currents for fixed feedback strength. Pump currents are (a)2.20 mA, (b) 2.60 mA, (c) 2.75 mA, (d) 3.20 mA, and (e) 3.40 mA.The horizontal polarization (the natural lasing mode) is shown in darkgray (red color online) and the vertical polarization (the suppressedmode) in light gray (blue color online).
033818-2
SQUARE-WAVE SWITCHING IN VERTICAL-CAVITY . . . PHYSICAL REVIEW A 86, 033818 (2012)
FIG. 3. (Color online) Experimental time series of the intensityof both polarization modes of a VCSEL with PR feedback. Externalcavity transmission ratio is 30.6% and pump current I = 2.20 mA.All four graphs are close-up views of the data displayed in Fig. 2(a).
the regularity is also degraded, with longer intervals appearingirregularly between square pulses. For the optimal currentthe timing of the switchings is not perfectly regular. Othertime traces at this setting (not shown) indicate that there areoccasional interruptions similar to those in Fig. 2(b), but theyoccur less often.
Further experiments carried out at other feedback strengthssuggest that the optimum current for switching regularitydecreases as the feedback strength decreases. However, wealso find that the cleanest and most regular square waves occurwhen feedback is strong.
Figure 3 examines in greater detail the 1-μs time seriesshown in Fig. 2(a), with pump current I = 2.20 mA. Differentlevels of complex behavior are seen, such as almost regularswitching, regions where the plateaus become disordered withspikes or holes, and regions of rapid oscillation where the4L/c periodicity is not apparent. The transitions between theseshapes do not appear to be abrupt, and therefore are likely tobe a manifestation of noise-driven instability rather than abifurcation to different solutions.
Similar results (not shown) have been obtained with twoother VCSELs, one that displayed polarization monostabilitywithout feedback, and the other that exhibited, withoutfeedback, polarization bistability in a range of pump currents.To further demonstrate that the above observations are generic,in the next section we simulate the VCSEL behavior using asa framework the spin-flip model. We employ parameter valuesthat are typically used for modeling VCSEL dynamics, andonly the feedback delay time is chosen to fit the experimentalvalue.
III. RATE EQUATION MODEL
The spin-flip model equations [25], extended as in Refs. [11,17] to account for polarization-rotated time-delayed feedback,are:
dEx
dt= k(1 + jα)[(N − 1)Ex + jnEy]
− (γa + jγp)Ex + √βspξx + ηyEy(t − τ ), (1)
dEy
dt= k(1 + jα)[(N−1)Ey − jnEx]
+ (γa + jγp)Ey + √βspξy + ηxEx(t − τ ), (2)
dN
dt= γn[μ − N − NI − jn(EyE
∗x − ExE
∗y )], (3)
dn
dt= −γsn − γn[nI + jN (EyE
∗x − ExE
∗y )]. (4)
Here, Ex and Ey are orthogonal linearly polarized field am-plitudes, N and n are two carrier densities, I = |Ex |2 + |Ey |2,k is the field decay rate, γn is the carrier decay rate, γs is thespin-flip rate, α is the linewidth enhancement factor, and γa
and γp are the dichroism and birefringence parameters: forγa > 0 (γp > 0) the y polarization has a lower threshold (ahigher frequency) than the x polarization. μ is the injectioncurrent parameter, βsp is the strength of spontaneous emissionnoise, and ξx,y are uncorrelated Gaussian white noises.
The feedback parameters are the injection strength η andthe delay time τ . As discussed in the Introduction, we considertwo types of selective orthogonal feedback:
(i) x → y, for which ηx = η, ηy = 0 and(ii) y → x, for which ηx = 0, ηy = η.Because of the α factor, in the presence of a frequency
splitting between the two polarizations, these two types offeedback are not symmetric.
IV. NUMERICAL RESULTS
Unless otherwise specifically stated, the parameters used inthe simulations are k = 300 ns−1, γn = 2 ns−1, γs = 50 ns−1,
γp (rad GHz)
μ (a
rb. u
nits
)
0 10 20 30 40 50 60 701
1.5
2
2.5
3
3.5
4
FIG. 4. (Color online) Stability diagram of the x and y polariza-tions of the solitary VCSEL in the parameter space (birefringence,pump current). Red and blue indicate regions of polarization monos-tability (red, lower right region: only the x polarization is stable, blueregion on the left: only the y polarization is stable); white indicatesthe region of polarization bistability (both polarizations are stable);green indicates the region where cw output in x or y polarization isunstable. The model parameters are as indicated in the text, and thesymbols indicate the values of μ and γp used in Figs. 5, 6, and 11.
033818-3
DAVID W. SUKOW et al. PHYSICAL REVIEW A 86, 033818 (2012)
γa = 0.4 ns−1, α = 3, βsp = 10−4 ns−1, η = 50 ns−1, andτ = 10 ns. The pump current μ and the birefringence γp aretaken as control parameters. Because the experiments weredone well above threshold, we will mainly consider values ofμ � 2. However, to compare our results with those of Ref. [17],we will also discuss the dynamics near threshold (with μ ∼ 1).The parameter γp will be chosen such that the solitary laseris monomode and emits either the x or the y polarization.In Fig. 4, which displays the linear stability of the x and y
polarizations, one can observe that well above threshold thex polarization is stable for large γp, while the y polarizationis stable for low γp. Therefore, to analyze the dynamics withx → y feedback, we will choose γp large, and to analyzethe dynamics with y → x feedback, we will choose γp
small.
A. Square-wave switching with y → x feedback
The simulations reveal a wide variety of complex waveforms, depending on the parameters. There are parameterregions where almost regular polarization switchings occur,with periodicity slightly longer than 2τ , as shown in Fig. 5.With moderate feedback strength [Fig. 5(a)], the depressedpolarization (x) is either off or pulsating, while the naturalpolarization (y) is either off or constant in time. Figure 5(b)displays a detail of the transition from the cw to the pulsatingstate. The period of the pulsations is about 0.09 ns, which is halfthe relaxation oscillation period (Tro = 2π/
√2kγn(μ − 1) =
0.18 ns for the parameters of Fig. 5). Indeed, for lower
0 10 20 30 40 50 60 700
1
2
3 (a)
1 2 3 4 5 6 70
1
2
3
I x, Iy (
arb.
uni
ts)
(b)
1 2 3 4 5 6 70
2
4(c)
0 10 20 30 40 50 60 700
1
2
3
Time (ns)
(d)
FIG. 5. (Color online) Polarization switching dynamics with y →x feedback. The intensities of the x (red, thick line) and y (blue, thinline) polarizations are plotted vs time. In panel (a) the feedbackstrength is η = 50 ns−1; panel (b) displays a detail of the polarizationswitching in panel (a); panel (c) displays the switching for lowerfeedback (η = 28 ns−1) and panel (d), for stronger feedback (η =100 ns−1). The birefringence and pump current parameters are γp =6 rad GHz, μ = 2.0; other parameters are as indicated in the text.
feedback, the pulsations originate from a period-halvingbifurcation, as shown in Fig. 5(c). For stronger feedback thepulsations disappear and the intensities of both polarizationsdisplay regular square-wave switching, as shown in Fig. 5(d).
Given that the experimental detection bandwidth is 6GHz, these fast pulsations at frequency twice the relaxationfrequency fro (with fro ∼ 5.5 GHz) will leave behind onlynoisy fluctuations observed in the intensity plateaus. Thesedynamics were observed experimentally in EELs [18], andour simulations suggest that in VCSELs it occurs for y → x
feedback in a wide range of feedback strengths.
B. Square-wave switching with x → y feedback
For parameters where the x polarization is stable for thesolitary laser, with moderate x → y feedback strength, regularsquare-wave switching is observed, as shown in Fig. 6(a),and no fast oscillations have been seen in the depressedy polarization. This difference between x → y and y → x
feedback can be qualitatively understood with the help of ananalogy with an optically injected laser. Due to the α factor,the stable locking region is asymmetric with respect to thedetuning of the two lasers, which corresponds, for selectiveorthogonal feedback, to the frequency splitting between thetwo polarizations. With y → x feedback the positive detuningcorresponds to parameters in the unstable locking region(resulting in oscillations when the x mode is on), while withx → y feedback the detuning changes sign, corresponding tothe stable locking region (resulting in a cw intensity when they mode is on).
For parameters (γp, μ) close to the boundary of the region ofmonostability of the x polarization, in the absence of feedbackthere is emission in both polarizations, with Iy small. Thedynamics with x → y feedback is displayed in Figs. 6(b) and6(c), where one can observe that the y polarization lases allthe time, switching between two intensity plateaus, one higher
0 10 20 30 40 50 60 700
1
2
3(a)
0 10 20 30 40 50 60 700
1
2
3
I x, Iy (
arb.
uni
ts)
(b)
0 10 20 30 40 50 60 700
2
4
Time (ns)
(c)
FIG. 6. (Color online) Intensities of the x (red) and y (blue) polar-izations with x → y feedback. The parameters are γp = 60 rad GHzand μ = 2.6 (a), γp = 50 rad GHz and μ = 2.6 (b), γp = 60 rad GHzand μ = 3.3 (c); other parameters are as indicated in the text.
033818-4
SQUARE-WAVE SWITCHING IN VERTICAL-CAVITY . . . PHYSICAL REVIEW A 86, 033818 (2012)
0
1
2 (a)
0123 (b)
0
2
4
I x, Iy (
arb.
uni
ts)
(c)
0
2
4 (d)
0 0.1 0.2 0.3 0.4 0.5 0.6 0.7 0.8 0.9 1024
Time (μ s)
(e)
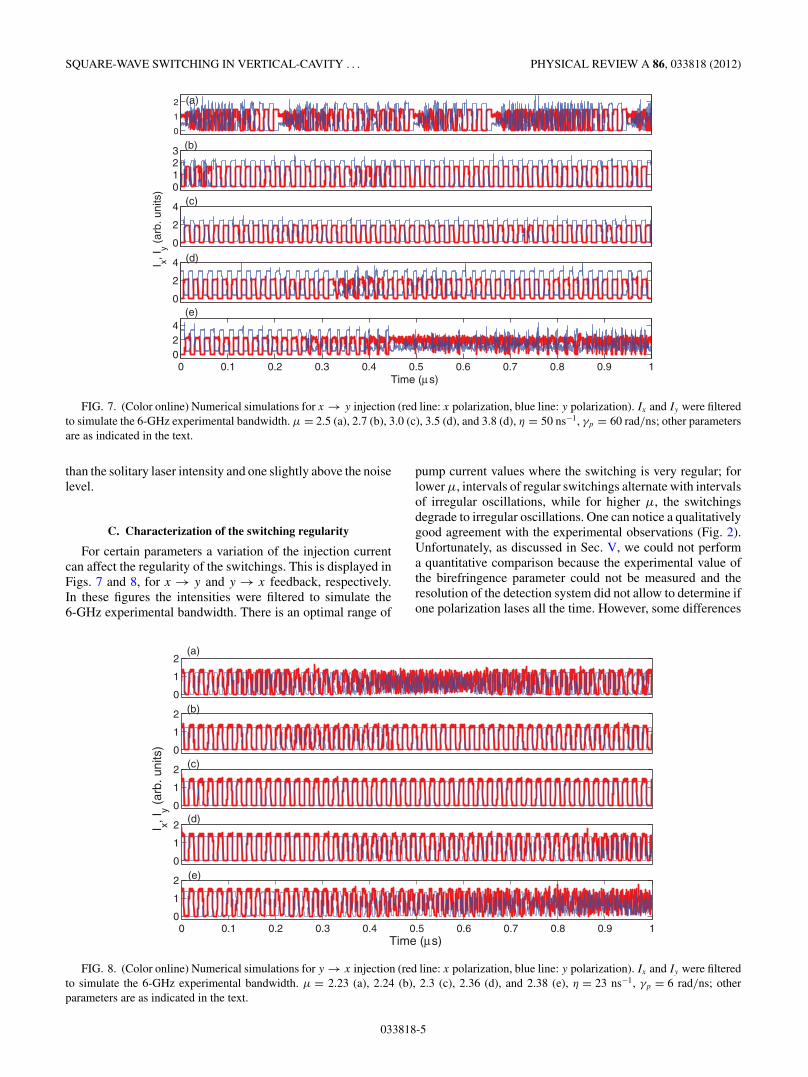
FIG. 7. (Color online) Numerical simulations for x → y injection (red line: x polarization, blue line: y polarization). Ix and Iy were filteredto simulate the 6-GHz experimental bandwidth. μ = 2.5 (a), 2.7 (b), 3.0 (c), 3.5 (d), and 3.8 (d), η = 50 ns−1, γp = 60 rad/ns; other parametersare as indicated in the text.
than the solitary laser intensity and one slightly above the noiselevel.
C. Characterization of the switching regularity
For certain parameters a variation of the injection currentcan affect the regularity of the switchings. This is displayed inFigs. 7 and 8, for x → y and y → x feedback, respectively.In these figures the intensities were filtered to simulate the6-GHz experimental bandwidth. There is an optimal range of
pump current values where the switching is very regular; forlower μ, intervals of regular switchings alternate with intervalsof irregular oscillations, while for higher μ, the switchingsdegrade to irregular oscillations. One can notice a qualitativelygood agreement with the experimental observations (Fig. 2).Unfortunately, as discussed in Sec. V, we could not performa quantitative comparison because the experimental value ofthe birefringence parameter could not be measured and theresolution of the detection system did not allow to determine ifone polarization lases all the time. However, some differences
0
1
2(a)
0
1
2 (b)
0
1
2
I x, Iy (
arb.
uni
ts)
(c)
0
1
2(d)
0 0.1 0.2 0.3 0.4 0.5 0.6 0.7 0.8 0.9 10
1
2
Time (μ s)
(e)
FIG. 8. (Color online) Numerical simulations for y → x injection (red line: x polarization, blue line: y polarization). Ix and Iy were filteredto simulate the 6-GHz experimental bandwidth. μ = 2.23 (a), 2.24 (b), 2.3 (c), 2.36 (d), and 2.38 (e), η = 23 ns−1, γp = 6 rad/ns; otherparameters are as indicated in the text.
033818-5
DAVID W. SUKOW et al. PHYSICAL REVIEW A 86, 033818 (2012)
γp
(rad GHz)
μ(a) ⟨ T ⟩ (ns)
0 20 401
2
3
4
0 10 20 30 40 50
γp
(rad GHz)
(b) σ /⟨ T ⟩
0 20 401
2
3
4
0 1 2
γp
(rad GHz)
μ
(c) ⟨ T ⟩ (ns)
0 20 40 601
2
3
4
0 10 20 30 40 50
γp
(rad GHz)
(d) σ /⟨ T ⟩
0 20 40 601
2
3
4
0 1 2 3
FIG. 9. (Color online) Mean switching time (a), (b) and itsnormalized standard deviation (c), (d) vs the birefringence and thepump current parameters for x → y feedback (a), (c) and for y → x
feedback (b), (d). The vertical lines in panels (b) and (d) indicatevariations of μ that affect the switching regularity as observed inthe experiments. η = 30 ns−1; other parameters as indicated in thetext. In the while regions no polarization switchings occur; in the redregions, 〈T 〉 > 50 ns.
can indeed be noticed, as in the experiments the amplitudeof the square-wave switching appears to be the same for bothmodes (Fig. 2), while in the simulations they are in generalslightly different (see Figs. 5 and 6).
To quantify the degree of switching regularity, in Fig. 9we plot the average switching time 〈T 〉 and its normalizeddispersion σ/〈T 〉 vs μ and γp. In this figure one can observethat there are parameter regions where increasing μ resultsin first a decrease, followed by an increase of the switchingregularity (σ/〈T 〉 reaching a minimum at specific currentvalues that depend on the value of γp), as observed inthe experiments. For parameters near the borders of themonostability regions of the solitary laser, the mean switchingtime becomes increasingly long until the switchings eventuallydisappear [the red color in Figs. 9(a) and 9(c) indicates 〈T 〉 >
50 ns].In Ref. [17] the degradation of the switching was under-
stood as the result of a change of stability of the solitary laserpolarizations. However, for parameters considered here (i.e.,well above threshold) the degradation of the square waves isnot related to a change of stability of the solitary laser modes.Specifically, for the parameters of Fig. 7, for the solitary laserthe y polarization remains stable as μ increases [see Fig. 4(a)]
and nevertheless, the square-wave regular switchings graduallytransform into irregular oscillations.
D. Influence of spontaneous emission noise
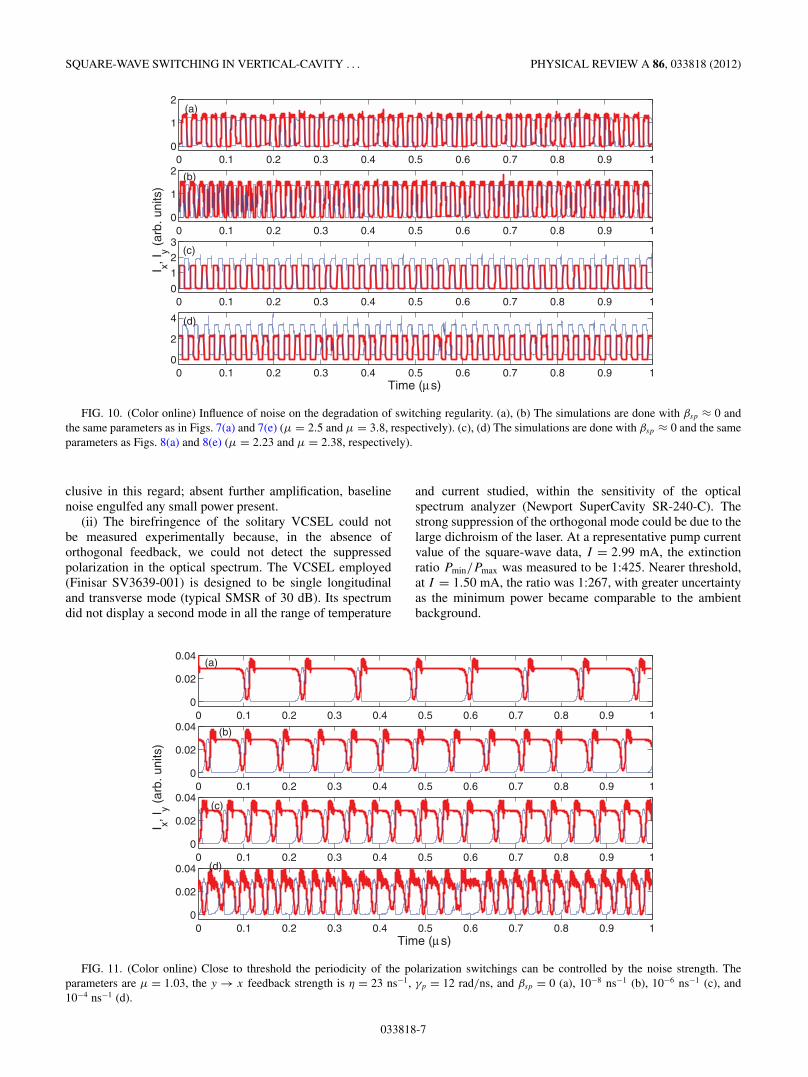
Our simulations also reveal that spontaneous emission noisecan play a crucial role on the degradation of the square-waveswitching. Figure 10 displays simulations done for the sameparameters as in Figs. 7 and 8, at low and high pump currents,but now with βsp ≈ 0. One can observe that for low pumpcurrent, without noise there is regular switching [Figs. 10(a)and 10(c)], while with noise, irregular oscillations alternatewith regular switching [Figs. 7(a) and 8(a)]. At higher pumpcurrent, without noise [Figs. 10(b) and 10(d)] the switchingis more regular than with noise [Figs. 7(e) and 8(e)], butnevertheless, the square waves are sporadically interrupted bya irregular oscillations.
These results suggest that at lower pumps spontaneousemission noise is crucial for the degradation of the squarewaves, while at higher pumps, not only the spontaneousemission noise but also the deterministic nonlinear dynamics(which plays the role of an “effective” noise as in Ref. [26])are at the origin of the square-wave degradation.
One can therefore conclude that the role of noise dependson the pump current, and then there could be parameterregions where spontaneous emission noise can enhance theswitching regularity. This indeed occurs at pump currents closeto threshold and is displayed in Fig. 11, which is done withparameters similar to those used in Ref. [17]. One can observethat the square-wave switching is largely noise-induced, andfor each polarization, the time intervals spent in the “on”and “off” states are controlled by the noise strength. Theseresults can be interpreted in terms of noise-induced escape ofan unstable fixed point (where x is on and y is off).
V. CONCLUSIONS AND DISCUSSIONS
We studied the experimental and numerical dynamics ofVCSELs with selective orthogonal feedback and we found thatthe switching dynamics is noisier than in EELs, but parameterscan be found where the switching regularity is optimized. Theresults of the simulations are in qualitatively good agreementwith the observations. The simulations also show that withx → y feedback:
(i) there is a wider parameter region where regular switchingcan be observed (as compared to y → x feedback as in [17])and
(ii) the two polarizations alternate between two cw intensityvalues; in contrast, with y → x feedback the x polarization candisplay self-pulsations in the “on” state that disappear withstronger feedback.
A quantitative comparison between experiments and simu-lations is limited by the capabilities of the experimental setupas follows:
(i) The ac coupling of the photodetectors and rf amplifiersremoves the cw component of the experimental wave forms.Therefore, we could not determine if one polarization does ordoes not lase all the time [as observed in the simulations, seeFig. 6(c) and Figs. 7(c)–7(e)]. Tests made with an availablelow-bandwidth (125 MHz) dc-coupled detector were incon-
033818-6
SQUARE-WAVE SWITCHING IN VERTICAL-CAVITY . . . PHYSICAL REVIEW A 86, 033818 (2012)
0 0.1 0.2 0.3 0.4 0.5 0.6 0.7 0.8 0.9 10
1
2(a)
0 0.1 0.2 0.3 0.4 0.5 0.6 0.7 0.8 0.9 10
1
2I x, I
y (ar
b. u
nits
)
(b)
0 0.1 0.2 0.3 0.4 0.5 0.6 0.7 0.8 0.9 10
1
2
3(c)
0 0.1 0.2 0.3 0.4 0.5 0.6 0.7 0.8 0.9 10
2
4
Time (μ s)
(d)
FIG. 10. (Color online) Influence of noise on the degradation of switching regularity. (a), (b) The simulations are done with βsp ≈ 0 andthe same parameters as in Figs. 7(a) and 7(e) (μ = 2.5 and μ = 3.8, respectively). (c), (d) The simulations are done with βsp ≈ 0 and the sameparameters as Figs. 8(a) and 8(e) (μ = 2.23 and μ = 2.38, respectively).
clusive in this regard; absent further amplification, baselinenoise engulfed any small power present.
(ii) The birefringence of the solitary VCSEL could notbe measured experimentally because, in the absence oforthogonal feedback, we could not detect the suppressedpolarization in the optical spectrum. The VCSEL employed(Finisar SV3639-001) is designed to be single longitudinaland transverse mode (typical SMSR of 30 dB). Its spectrumdid not display a second mode in all the range of temperature
and current studied, within the sensitivity of the opticalspectrum analyzer (Newport SuperCavity SR-240-C). Thestrong suppression of the orthogonal mode could be due to thelarge dichroism of the laser. At a representative pump currentvalue of the square-wave data, I = 2.99 mA, the extinctionratio Pmin/Pmax was measured to be 1:425. Nearer threshold,at I = 1.50 mA, the ratio was 1:267, with greater uncertaintyas the minimum power became comparable to the ambientbackground.
0 0.1 0.2 0.3 0.4 0.5 0.6 0.7 0.8 0.9 10
0.02
0.04(a)
0 0.1 0.2 0.3 0.4 0.5 0.6 0.7 0.8 0.9 10
0.02
0.04
I x, Iy (
arb.
uni
ts)
(b)
0 0.1 0.2 0.3 0.4 0.5 0.6 0.7 0.8 0.9 10
0.02
0.04(c)
0 0.1 0.2 0.3 0.4 0.5 0.6 0.7 0.8 0.9 10
0.02
0.04
Time (μ s)
(d)
FIG. 11. (Color online) Close to threshold the periodicity of the polarization switchings can be controlled by the noise strength. Theparameters are μ = 1.03, the y → x feedback strength is η = 23 ns−1, γp = 12 rad/ns, and βsp = 0 (a), 10−8 ns−1 (b), 10−6 ns−1 (c), and10−4 ns−1 (d).
033818-7
DAVID W. SUKOW et al. PHYSICAL REVIEW A 86, 033818 (2012)
The simulations also suggest that at high pump currents theswitching dynamics is less affected by the noise, as comparedto pump current values close to threshold [17]. In addition,at high pump currents the degradation of the regularity of theswitchings is not accompanied by a change of the stability ofthe solitary laser modes (as it occurs at lower pump current[17]), and thus, it will be interesting to investigate in a futurework which mechanisms are involved in the degradation of theswitching regularity.
ACKNOWLEDGMENTS
This research was supported in part by the AcademiaProgram of the ICREA foundation, Generalitat de Catalunya;the Air Force Office of Scientific Research through ProjectFA8655-12-1-2140; the Spanish Ministerio de Ciencia eInnovacion through Project FIS2009-13360-C03-02; by theAgencia de Gestio d’Ajuts Universitaris i de Recerca, Gener-alitat de Catalunya, through Project 2009 SGR 1168; and byArgentina CONICET, Grant No. PIP-114-200801-00163.
[1] Unlocking Dynamical Diversity: Optical Feedback Effects onSemiconductor Lasers, edited by D. Kane and A. Shore (Wiley& Sons, New York, 2005).