Page 1
SR-1021
APPLICATION OF BALANCED DETECTION TO ABSORPTION MEASUREMENTS OF TRACE GASES WITH ROOM-TEMPERATURE, QUASI-CW QC LASERS
David M. Sonnenfroh, W. Terry Rawlins, Mark G. Allen Physical Sciences Inc.
Claire Gmachl, Federico Capasso, Albert L. Hutchinson, Deborah L. Sivco, James N. Baillargeon, and Alfred Y. Cho Bell Laboratories, Lucent Technologies
Applied Optics 40(6), 812-820 (2001).
Copyright © 2001, Optical Society of America. All rights reserved. Reprinted by permission of the Optical Society of America.
Page 2
1
APPLICATION OF BALANCED DETECTION TO ABSORPTION MEASUREMENTS
OF TRACE GASES WITH ROOM-TEMPERATURE, QUASI-CW QC LASERS
David M. Sonnenfroh, W. Terry Rawlins, and Mark G. Allen
Physical Sciences Inc., 20 New England Business Center, Andover, MA 01810
Claire Gmachl, Federico Capasso, Albert L. Hutchinson, Deborah L. Sivco,
James N. Baillargeon, and Alfred Y. Cho
Bell Laboratories, Lucent Technologies, Murray Hill, NJ 07974
ABSTRACT
Distributed feedback quantum cascade (QC) lasers are expected to form the heart of the
next generation mid-IR laser absorption spectrometer, especially as applied to measurements of
trace gases in a variety of environments. Incorporation of room temperature-operable, single
mode QC lasers will result in very compact and rugged sensors for real world applications. We
report preliminary results on the performance of a laser absorption spectrometer using a QC laser
operating at room temperature in quasi-cw mode in conjunction with balanced ratiometric
detection. We have demonstrated sensitivities for N2O (10 parts in 106 for a 1 m path (ppmv-m))
and NO (520 parts in 109 for a 1 m path (ppbv-m)) at 5.4 µm. System improvements are described
which are expected to result in two orders of magnitude increase in sensitivity.
OCIS codes: 010.1120, 120.1740, 140.3070, 300.1030, 300.6260
Page 3
2
1. INTRODUCTION
The advent of quantum cascade (QC) lasers1 is expected to enable a new generation of
highly sensitive trace gas sensors that will be routinely operable in the field. QC lasers operate at
or near room temperature in quasi-cw mode with peak optical power in the 10 to 100 mW range.
Distributed feedback versions of these lasers operate on a single longitudinal mode. These lasers
have been fabricated throughout the midinfrared chemical fingerprint region from 4.6 to 13 µm.
Laser absorption spectrometers achieve the highest sensitivity by operating in this region. Thus,
sensors using QC laser sources offer the promise of compact and highly adapted devices for
routine field deployment, in contrast to sensors using alternative, existing mid-IR sources. In this
paper, we report on initial work we have undertaken to couple QC laser technology with highly
sensitive balanced ratiometric detection technology.
Over the past 15 years, semiconductor laser absorption spectrometers have been developed
for high sensitivity detection and monitoring of various trace species.2-8 Instruments with the
highest sensitivity operate in the midinfrared, the region in which molecular linestrengths are the
largest. To access this region, laser absorption spectrometers have been developed using lead salt
diode lasers. Although these sensors have achieved high sensitivity, several aspects of lead salt
lasers result in a complex instrument design or limit routine field use. Chief among these
characteristics are that these lasers operate cw at cryogenic temperatures and that these lasers are
available only as Fabry-Perot designs.
An alternate technique to access the midinfrared spectral region is to use difference
frequency generation (DFG). Sensors based on DFG sources have higher power demands and are
Page 4
3
more complex than single laser sensors. The output power is critically dependent on maintaining
phase matching or quasi phase matching conditions between the overlapping beams in the crystal.
Output powers are approaching the mW regime. Recent work has demonstrated integrated
spectrometers operating over the 3.0 to 5.5 µm region.9
Robust and field-worthy laser absorption spectrometers have been demonstrated using near
infrared diode lasers. These lasers operate at room temperature and are available in DFB
architecture, and have been matured by years of development by the telecommunications industry.
Many examples of field and airborne demonstrated sensors are available.10-12 Good sensitivity is
achieved when combined with ultrasensitive detection techniques such as frequency modulation
(FM) or balanced ratiometric detection (BRD). Ultimate chemical sensitivity can be limited
because combination and overtone bands are monitored which have concomitantly weaker
linestrengths than those corresponding to fundamental absorption bands.
Quantum cascade lasers achieve gain via the transition of electrons between two excited
states in the conduction band of a coupled quantum well structure.1 Inversion is created by
engineering the lifetimes of the states involved. The paired electron injection and active well
regions are replicated many times over (cascaded) to increase output power. QC lasers can be
operated in cw mode at temperatures up to 170 K and in quasi-cw mode (duty cycle of <1%) at
room temperature. The output wavelength is determined by the thickness of the active region and
is independent of band gap. QC lasers can be fabricated at any wavelength from 4 to 11 µm using
AlInAs/InGaAs lattices on InP. The advent of QC lasers enables a new generation of laser-based
Page 5
4
sensors which maintains the sensitivity of lead salt laser sensors and preserves the robustness and
ease of operation of near-IR diode laser sensors.
Several groups have recently reported applications of QC lasers to trace gas sensing.
Sensitive absorption spectroscopy using frequency modulation (FM) detection and a room
temperature, pulsed DFB QC laser has been reported.13 Sensitive absorption spectroscopy has also
been demonstrated with cryogenically cooled, cw QC lasers using either FM detection14 or
photoacoustic detection techniques.15 Detection of isotopic composition has also been
demonstrated using cryogenically cooled, cw QC lasers.16 In this paper, we report on our initial
efforts in developing a QC laser-based trace gas sensor suitable for routine field deployment. Our
work has focused on quasi-cw, room temperature operation of the laser source with high
sensitivity detection achieved using the balanced ratiometric technique. We have used a
breadboard spectrometer to investigate sensitivities for N2O and NO.
2. EXPERIMENTAL CONFIGURATION
Several quantum cascade lasers operating near 5.4 µm have been examined in this work.
These devices are similar to those described by Gmachl et al. in Ref. 17. In general, these lasers
tune with temperature at a rate of 0.13 cm-1/deg K (3.9 GHz/deg K). The tuning rate with injection
current is approximately 10-2 cm-1/mA (300 MHz/mA). These QC lasers have a current threshold
of approximately 1 A for room temperature operation. After a regime in which laser power
increases linearly with current, these devices exhibit a characteristic emission rolloff at higher
currents. These devices require a relatively high compliance voltage (~8 V), compared to other
Page 6
5
semiconductor diode lasers. For zero bias, the devices have an effective resistance of
approximately 1 kΩ which decreases to 1 Ω above threshold.
Each laser chip carrier is In-soldered onto a copper block, which serves as a heat sink and
as the ground contact for the laser. A typical chip carrier contains four to six lasers. Two lasers are
connected via thin wire bonds to Au-plated alumina plates bonded to either end of the copper
block. Only one laser is operated at a given time. We fabricated a mount for the laser chip carrier
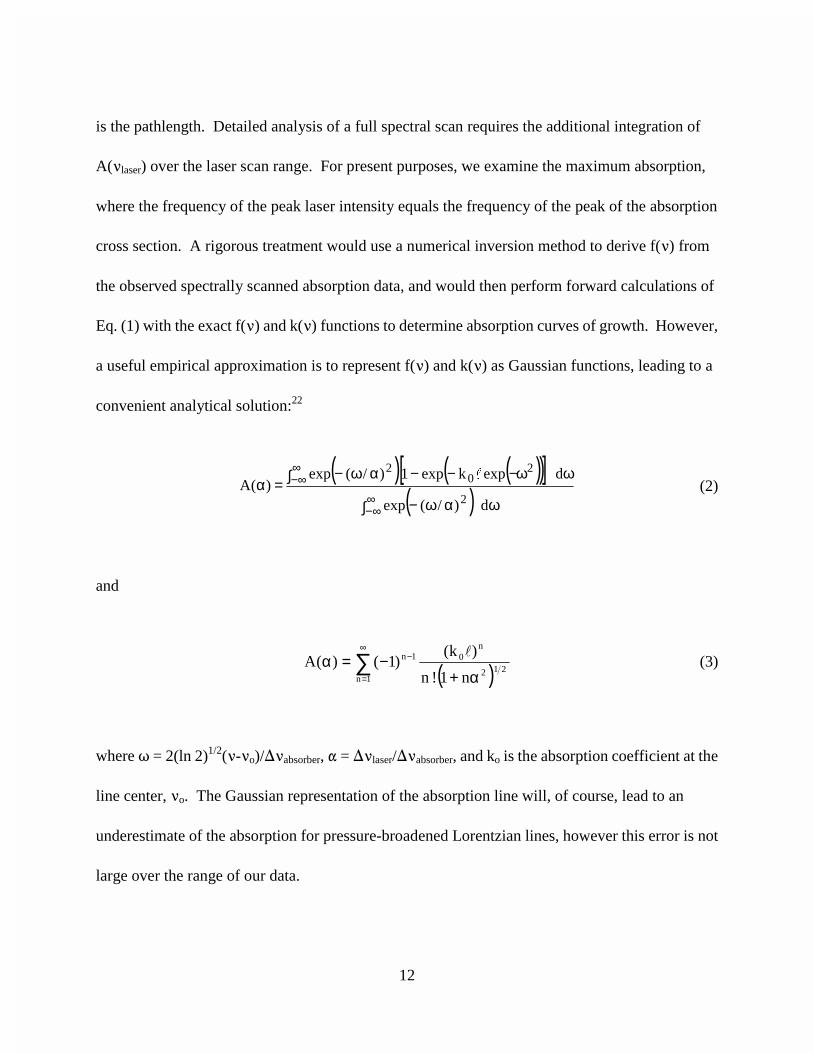
in order to provide a controlled operating environment (see Figure 1). The chip carrier is mounted
on a large thermoelectric cooler (TEC) to provide temperature control of the device. In between
the carrier and the TEC is a copper-beryllium alloy plate. A layer of silicone thermal heat sink
compound is used between the carrier and the plate. A thermistor is bonded to the large plate just
behind the carrier block. The single stage TEC provides 55 W of cooling and was sized to enable
cooling of the entire assembly to -30 C. The TEC is mounted on a water-cooled heat sink. The
assembly is housed in an aluminum box to allow for purging. An antireflection-coated, fast Ge
meniscus lens (12.5 mm diameter, f/0.8) is mounted on a precision five-axis translator at the front
of the box to collimate the output beam.
From the perspective of developing a practical field sensor, we are interested in room
temperature operation of the QC laser. This implies that the laser must be operated in pulsed
mode. Two issues, both related to thermal management, constrain the design of the injection
current pulse train. The pulse width is limited by the need to minimize the frequency chirp that
arises from internal heating during the pulse. Pulse widths of 10 to 50 ns have been used. The duty
cycle is also limited to < 1% by the need to manage the heating arising from the large current
Page 7
6
densities impressed on the device. Typical operation occurs with a negatively biased, < 1 MHz
pulse train with a 1% duty cycle (10 ns pulse width). In order to scan the laser wavelength across
an absorption transition, we added a small amplitude, low frequency sawtooth current ramp to the
pulse train. The two signals are combined using a bias tee.
A block diagram of the laser drive electronics is presented in Figure 2. We used a high
power, pulsed laser diode driver (DLD) to create the pulse train. The DLD draws operational
power from both low voltage and high voltage DC supplies. An external pulse generator supplied
the pulse train, which was amplified by the DLD. The DLD was capable of producing peak output
currents to 100 A. The pulse width was variable from 25 ns to 15 µs with rise and fall times of
20 ns. The pulse train frequency was variable up to 500 kHz. We typically operated with 50 ns
pulses at 5 kHz for a duty cycle of <0.1%. The output of the DLD is via a low impedance copper
strip transmission line. We used a precision current supply to provide the sawtooth ramp for
wavelength scanning. A waveform generator provided a voltage control ramp to the current
supply. This supply then produced a 50 mA current ramp at 10 Hz.
The general experimental arrangement for the spectroscopic absorption experiments is
illustrated in Figure 3. The collimated laser beam exits the mount and is split into a signal and a
reference beam using an Ar-coated Ge beamsplitter. The signal beam propagates through an 0.5 m
electropolished, stainless steel absorption cell having ar-coated, 30 min.- wedged Ge windows.
After exiting the cell, the beam is refocused onto an LN2-cooled InSb detector by a 25 mm
diameter, ar-coated Ge f/1 lens. Similarly, the reference beam is refocused onto a second InSb
detector using another Ge lens. Provision was made to purge the beam paths as shown. The
Page 8
7
detectors were 2 mm diameter devices. Each detector was fitted with a cold field-of-view
machined to match the f/1 collection optics. This was done to minimize the background current
arising from collection of ambient radiation. An InSb camera aided collimation and alignment,
and was used to image the beam in the far field.
Initial experiments were conducted by directing each detector output through a high gain
current preamplifier and then into a gated integrator. The gated integrator signals were sampled,
recorded and processed by a data acquisition system. The signal and reference outputs were
processed to create an absorption spectrum. Spectra were averaged and then integrated to produce
a real time history of the number density of the species under investigation. This dual beam
detection method allowed us to investigate spectral absorbances down to ~0.5%.
For higher sensitivity, we adapted our BRD technique for use with the pulsed QC lasers
and InSb detectors.18 The technique was originally designed by Hobbs at IBM;19-20 we have been
developing the BRD for operation with cw visible and near-infrared diode lasers. To enable
operation with pulsed photocurrents, we decreased the bandwidth of the BRD so that the detector
responded to the average input power rather than to individual pulses. We created mathematical
models of the temporal response of the BRD using the expected peak photocurrents, as the
bandwidth of the detector depends on photocurrent. We used this analysis to modify the
bandwidth of the integrating feedback loop of the circuit. We found a nominal bandwidth of a 5 to
10 kHz worked well with the 15 kHz pulse train.
We also modified the BRD for operation with the InSb detectors. The BRD has an internal
voltage reference for reverse biasing the photodiodes. While this marginally increases the dark
Page 9
8
current, it provides for an output current that is linear with respect to the incident photon flux. The
detectors were operated with 85 mV of reverse bias. For experiments utilizing the BRD, the circuit
output was amplified and bandpass filtered. Spectra were collected and averaged using a digital
oscilloscope.
3. RESULTS AND DISCUSSION
3.1 Single Beam Results
Before proceeding with absorption studies, we investigated the electrical and optical pulse
waveforms for our system. For the majority of the work performed here, the pulse generator was
set to produce pulses of 50 ns widths at a repetition rate of 5 kHz. We used a miniature inductive
pickup probe placed in the transmission line just prior to the laser to measure the actual current
waveform produced by the DLD. The rise time of the inductive probe was 3.5 ns. The optical
pulse was measured with a fast, high bandwidth HgCdTe detector (100 MHz) and preamplifier
(20 MHz). Figure 4a shows both the current and optical waveforms. The observed current
pulsewidth was 70 ns. Thus the pulse out of the DLD was somewhat broader than the input pulse.
This was the minimum pulse width achievable with the DLD. The inductive probe has a transfer
function of 1 V/A. The laser has a threshold of ~1 A. Thus, if we rescale the current pulse from
this threshold, and normalize and overlay it with the optical pulse, we get excellent agreement in
the pulse widths. These waveforms are compared in Figure 4b and illustrate that, above threshold,
the laser power envelope tracks the input current pulse waveform.
Page 10
9
3.2 Dual Beam, Direct Absorption Results
For initial absorption measurements, we used the dual beam (signal and reference
channels) geometry described earlier but without the BRD circuit. We chose to monitor the P24E
line of the 1110 band of N2O (1859.31 cm-1; 5.3783 µm). Given a current tuning parameter and the
linestrength of the monitored transition (along with the pathlength and temperature), the software
averages a specified number of laser sweeps, subtracts a linear baseline, integrates the lineshape,
and reports a number density in real time. We calibrated the current tuning rate of the laser using
an uncoated Ge flat (0.5 cm thick). The current tuning rate was measured to be 330 MHz/mA or
0.011 cm-1/mA.
In the first experiment, the cell was filled with 48 Torr N2O and the pressure was then
reduced in steps. A plot of the laser-determined N2O number density versus the
manometer-measured number density is presented in Figure 5. Example absorption spectra are
presented in Figures 6 and 7. The spectrum in Figure 6 was acquired for 48.4 Torr N2O and is an
average of 100 scans. The peak absorption is 0.157 and the rms signal-to-noise ratio (SNR) is 120
which implies a minimum detectable absorption of 1.3 x10⁻³. This minimum detectable absorption
corresponds in turn to a detectivity of approximately 260 ppmv-m. These results are typical of the
detectivity that can be achieved without any special noise reduction techniques.
We also demonstrated detection of NO by monitoring the closely spaced grouping of six
lines of the P branch of the fundamental: P5.5e at 1857.268 cm-1 (5.3843 µm) and P5.5f at
1857.280 cm-1 (5.3842 µm). We used a precision mixture of 95 ppmv NO in N2 for the majority of
our work. A plot of the laser-determined NO number density versus the manometer-measured
Page 11
10
number density is presented in Figure 7. The smallest peak absorption measured this way was
0.008 for a 10 Torr sample of the mix. The SNR was ~3 which implies a minimum detectable
absorption of 2 x10⁻³. The corresponding detectivity is approximately 200 ppbv-m. In computing
number density for this plot, we have used our measured absorptions with Beer’s Law. This
procedure is not correct and leads to the curvature observed in the plot at high number densities.
This arises because of the relative spectral widths of the laser and the absorption transition and the
concomitantly varying absorption efficiency as the sample partial pressure increases. At the
highest partial pressure used, the transitions become optically dense. We return to a discussion of
this behavior in the next section.
3.3 Dual Beam, BRD Absorption Results
We next incorporated the BRD into the pulsed QC laser spectrometer. We again monitored
N2O via the P24E line and measured the BRD output as a function of gas pressure in the cell. A
plot of BRD determined number density vs the manometer number density is presented in
Figure 8. The corresponding range of peak absorption varies from 0.0225 to 0.27. The response is
linear for low concentrations but then becomes nonlinear at higher concentrations. This behavior
is a direct consequence of the magnitude of the laser bandwidth compared to the absorber
linewidth.
It is important to realize that the laser bandwidth is greater than or equivalent to the
molecular absorption linewidth (depending on the pressure broadening) under the conditions used
for this work. The large currents and high compliance voltages required for normal pulsed
Page 12
11
operation lead to a large power dissipation within the active region. This power dissipation
directly impacts the bandwidth. During a pulse, several watts of power are impressed on the active
region. This results in a large temperature variation which evolves during the pulse, which induces
an accompanying tuning, or chirp, of the lasing frequency. The measured absorption linewidth is a
convolution of the molecular linewidth and effective laser bandwidth averaged over the pulse. The
effective laser bandwidth can be thought of as the instantaneous bandwidth averaged over the
pulse duration. Laser bandwidth thus depends on operating temperature, current, pulsewidth, and
to a lesser extent, pulse repetition rate. Bandwidths for cw operation at cryogenic temperatures
have been measured to be ~ 50 MHz.14 For operation at 4 C with a 1 MHz pulsetrain and 11 ns
pulsewidth, the bandwidth has been estimated to be 720 MHz.13 In the case of a source bandwidth
that is broader than the absorber, there can be a significant departure of the measured absorption
from Beer's Law behavior and it is essential to account for this in the quantitative treatment of the
absorption data.
The analytical treatment of overlapping emitter and absorber line shapes follows directly
from that applied to resonance absorption measurements.21,22 For a given laser peak frequency, the
observed fractional absorption is given by:
( ) [ ] ∫ νν
ν∫ ν−−ν=ν
d)(f
d)(kexp1)(fA laser
(1)
where f() describes the laser intensity as a function of frequency, k() is the absorption
coefficient (product of cross section and absorber concentration) as a function of frequency, and
Page 13
12
is the pathlength. Detailed analysis of a full spectral scan requires the additional integration of
A(laser) over the laser scan range. For present purposes, we examine the maximum absorption,
where the frequency of the peak laser intensity equals the frequency of the peak of the absorption
cross section. A rigorous treatment would use a numerical inversion method to derive f() from
the observed spectrally scanned absorption data, and would then perform forward calculations of
Eq. (1) with the exact f() and k() functions to determine absorption curves of growth. However,
a useful empirical approximation is to represent f() and k() as Gaussian functions, leading to a
convenient analytical solution:22
( ) ( )( )[ ]
( )∫ ωαω−
ω∫ ω−−−αω−=α
∞∞−
∞∞−
d)/(exp
dexpkexp1)/(exp)(A
2
20
2"
(2)
and
( ) 212
n0
1n
1n
n1!n
)k()1()(A
α+−=α ∑
∞
=
− (3)
where = 2(ln 2)1/2(-o)/absorber, = laser/absorber, and ko is the absorption coefficient at the
line center, o. The Gaussian representation of the absorption line will, of course, lead to an
underestimate of the absorption for pressure-broadened Lorentzian lines, however this error is not
large over the range of our data.
Page 14
13
The experimentally observed peak absorptions and N2O optical depths (ko) are plotted in
Figure 9. Here each N2O optical depth is determined from the N2O pressure, the peak absorption
cross section, and the path length. As is also illustrated in Figure 9, the observed values are well
below those expected for Beer's Law. The curve passing through the data points was determined
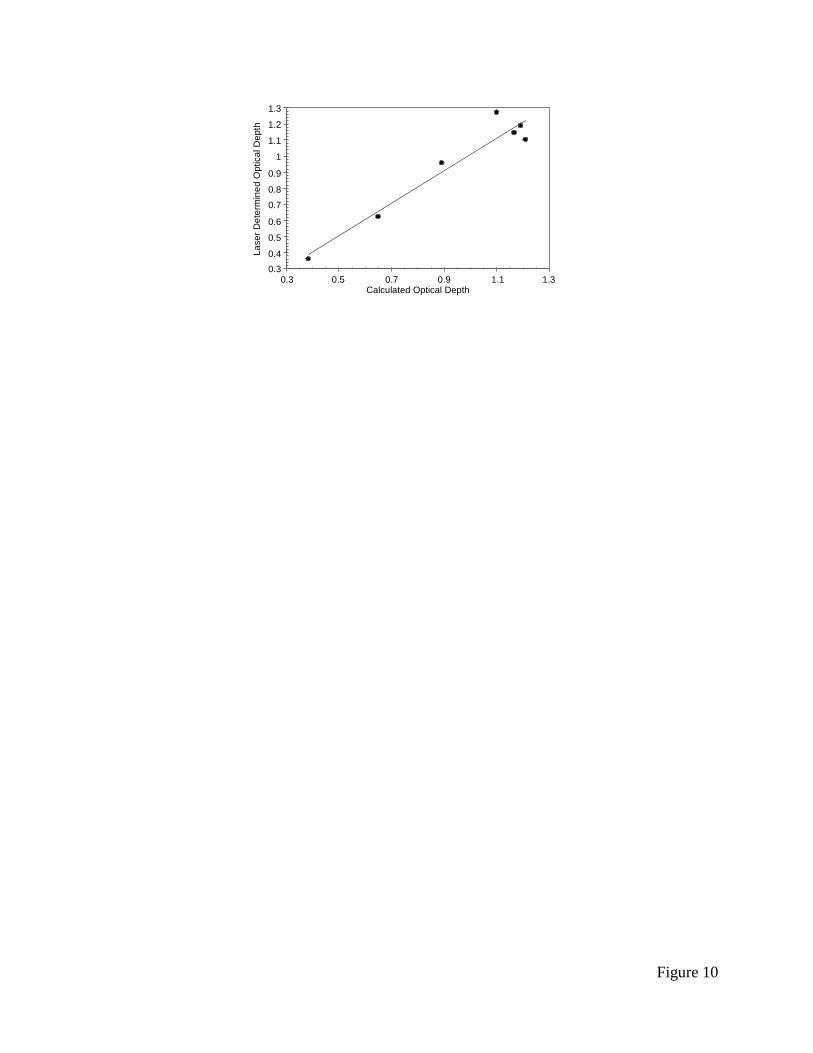
by solution of Eq. (3) using the calculated Voigt line width for each N2O optical depth and using
laser = 0.057 cm-1 (1.7 GHz). The only free parameter in the fit is the effective bandwidth of the
laser, which is determined to a tolerance of ±10%. Since the experiments were performed using
different pressures of pure N2O to obtain different optical depths, the predicted absorption value at
each optical depth represents a different absorber linewidth and hence a different A versus ko
curve of growth. Using these predicted curves of growth to determine the N2O optical depth
corresponding to each observed peak absorption, we find the optical depths determined from the
absorption data correlate well with the those determined from the N2O pressures, as shown in
Figure 10. The line in Figure 10 is a least squares fit with slope = 1.01 ± 0.03 and intercept =
0 ± 0.09. The increased scatter at large optical depth may be due in part to the increasing
importance of collisional line broadening at these N2O pressures (0.1 atm) and the consequent
departure of the absorber line shape from the Gaussian representation. However, the line shape
convolution model clearly provides a reliable method for determining the absorption curves of
growth for these laser operating characteristics.
We have used the experimental spectrum presented in Figure 6 to estimate the actual laser
bandwidth for our operating conditions. From modeling of the P24E line using HITRAN96,23 the
Doppler width of the line is 0.0035 cm-1 (0.11 GHz); the Lorentzian width due to collisional
Page 15
14
broadening (48.4 Torr) is 0.0093 cm-1 (0.28 GHz). The Voigt linewidth is 0.011 cm-1 (0.32 GHz).
The experimental observed linewidth is 0.099 cm-1 (3.0 GHz). To determine the laser spectral
intensity, we convolved an initial guess of the laser profile with a HITRAN-calculated absorption
profile and compared the result to the experimental spectrum of Figure 6. The difference in the
calculated and observed absorption spectra was minimized using a least squares algorithm by
iterating the laser profile. In this way, we calculated the laser spectral intensity, which is shown in
Figure 11 along with the HITRAN generated absorption profile. The laser spectral intensity is
indeed asymmetric, and has a FWHM of 0.093 cm-1 (2.8 GHz).
Quantitative analysis of the NO absorption data (cf. Figure 7) would follow a similar path
to that outlined above for the N2O data of Figure 8, but requires a detailed inclusion of all the
relevant, partially resolved absorption lines, which is beyond the scope of the present work. The
laser line-broadening effect clearly causes degradation in the measurement sensitivity, as it is
defined using the minimum measurable peak absorption, especially for low-temperature and/or
low-pressure applications where the absorber lines are narrow. This effect is a thermally-induced
characteristic of room temperature, pulsed operation, but can likely be mitigated by design
improvements in the thermal coupling of the active region to the heat sink and in the judicious
choice of the current pulse characteristics, including pulse width, pulse height, and repetition rate.
We are pursuing these design improvements, as well as more rigorous numerical treatments of the
line shape convolution analysis.
Our best sensitivity results with the BRD were obtained while monitoring NO on the P5.5
lines. A spectrum of the P5.5 lines for 0.032 Torr NO is presented in Figure 12. The spectrum was
Page 16
15
obtained for peak current of 1.02 A, 50 ns pulsewidth, 5 kHz pulse repetition rate, and a TEC
temperature of -1 C. The peak absorption is 0.0385. The rms noise on this spectrum yields a SNR
of 40, which implies a minimum measurable peak absorbance of 9 x 10⁻⁴. The corresponding
sensitivity for NO is on the order of 520 ppbv-m. We have used the BRD to record peak
absorbances as small as 5 x 10⁻⁸ Hz-1/2 under lab conditions and routinely in the range 1 x 10⁻⁵
under field conditions.18,24 It is likely that we did not achieve this same level of performance in
this work because of the relatively large background currents present from each detector and the
low average photocurrent produced by the laser power. The BRD cannot cancel the uncorrelated
noise present on the background photocurrents of the two detectors. We attempted to minimize the
background currents by equipping each detector with a cold field-of-view. To further minimize
background currents, cold bandpass filters could be used as well. In addition, improvements to the
pulse train electronics will allow us to operate with substantially more laser power on the detector.
For this initial work, available equipment restricted us to operate only slightly above threshold and
with pulse widths of ~70 ns. These conditions severely limited the available laser power. These
improvements will allow us to operate well above threshold, in the linear regime, thus producing
higher peak power. This, combined with a greater pulse repetition rate, will produce considerably
higher average laser power on the detector. For an injection current of 1.02 A, a pulsewidth of
50 ns and a repetition rate of 5 kHz, we estimate the actual average power on the detector was
250 nW. In contrast, the background power on the detector was estimated at 90 nW. With an
increase in pulse peak power to 10 mW and an increase in repetition rate to 100 kHz, the average
power on the detector will increase to 50 µW. Improvements to the pulse generation electronics
Page 17
16
will enable operation with narrower pulsewidths, which will decrease the thermally induced
frequency chirp and narrow the laser bandwidth. Improvements to the device packaging (with the
epitaxial side mounted downward, in close contact with the TEC, rather than upward as at present)
will also improve performance in that operation with higher peak currents and larger repetition
rates will be possible without sacrificing linewidth.25 We anticipate that the best overall sensor
performance will likely be a compromise between the need for higher laser average power and the
need to minimize the laser chirp. We are working to identify the optimal parameters needed to
achieve this compromise.
The breadboard apparatus was able to measure a minimum absorbance of 1 x 10⁻³ for a
2 second acquisition using the BRD. With the system improvements mentioned above, we expect
the minimum measurable absorption to improve to 1 x 10⁻⁵. Namjou and coworkers have reported
a minimum measurable peak absorption of 5 x 10⁻⁵ using a pulsed QC laser spectrometer and
frequency modulation detection.13 Implementation of these improvements will result in the level
of sensitivity necessary to monitor many important trace species with modest pathlengths. For
example, a minimum measurable absorption of 1 x 10⁻⁵ implies a sensitivity for NO of ~35 ppbv-m
and for N2O of ~1.5 ppmv-m. Background ambient atmospheric levels of both these species
(~100 pptv for NO and ~320 ppbv for N2O) will be measurable with good precision using
pathlengths on the order of 10 to 100 m.
Page 18
17
4. CONCLUSIONS
We have demonstrated a breadboard laser absorption spectrometer using a room-
temperature, quasi-cw mid-infrared quantum cascade laser as a source, in combination with high
sensitivity balanced ratiometric detection. We acquired spectra of NO and N2O and have
investigated the sensitivity of the QC laser-BRD coupled system. We have demonstrated
sensitivities for N2O of 10 ppmv-m and for NO of 520 ppbv-m @ 5.4 µm. From these
demonstration experiments, we have identified several system improvements that will increase the
sensitivity by an estimated two orders of magnitude. We expect the minimum measurable
absorption to improve to 1 x 10⁻⁵. This implies a sensitivity for NO of ~35 ppbv-m and for N2O of
1.5 ppmv-m. Implementation of these improvements will result in the sensitivity necessary to
monitor many important trace species in a variety of environments with modest pathlengths.
5. ACKNOWLEDGMENTS
We acknowledge helpful discussions with Michael Webber of Stanford University and
technical assistance from Michael Miller and Eric Wetjen of Physical Sciences Inc.
6. REFERENCES
1. J. Faist, F. Capasso, D.L. Sivco, C. Sirtori, A.L. Hutchinson, and A.Y. Cho, "Quantum
Cascade Laser," Science 264, 553-555 (1994).
Page 19
18
2. C.R. Webster, R.D. May, C.A. Trimble, R.G. Chave, and J. Kendall, "Aircraft (ER-2)
Laser Infrared Absorption Spectrometer (ALIAS) for in-situ stratospheric measurements
of HCl, N2O, CH4, NO2, HNO3," Appl. Opt. 33, 454-472 (1994).
3. J. Podolske and M. Loewenstein, "Airborne tunable diode laser spectrometer for trace-gas
measurement in the lower stratosphere," Appl. Opt. 32, 5324-5333 (1993).
4. H.I. Schiff, D.R. Karecki, G.W. Harris, D.R. Hastie, and G.I. Mackay, “A tunable diode
laser system for aircraft measurements of trace gases,” J. Geophys. Res. 95, 10147-10153
(1990).
5. G.W. Sachse, G.F. Hill, L.O. Wade, and M.G. Perry, “Fast response, high precision carbon
monoxide sensor using a tunable diode laser technique,” J. Geophys. Res. 92, 2071-2081
(1987).
6. J. Roths, T. Zenker, U. Parchatka, F.G. Wienhold, and G.W. Harris, “Four-laser airborne
infrared spectrometer for atmospheric trace gas measurements,” Appl. Opt. 35, 7075-7084
(1996).
7. F.G. Wienhold, H. Fischer, P. Hoor, V. Wagner, R. Konigstedt, G.W. Harris, J. Anders, R.
Grisar, M. Knothe, W.J. Riedel, F.J. Lubken, and T. Schilling, “TRISTAR- a tracer in situ
TDLAS for atmospheric research,” Appl. Phys. B 67, 411-417 (1998).
8. A.Fried, B. Henry, B. Wert, S. Sewell, and J.R. Drummond, “Laboratory, ground-based,
and airborne tunable diode laser systems: performance characteristics and applications in
atmospheric studies,” Appl. Phys. B 67, 317-330 (1998).
Page 20
19
9. K.P. Petrov, R.F.Curl, and F.K. Tittel, “Compact laser difference frequency spectrometer
for multicomponent trace gas detection,” Appl. Phys. B 66, 531-538 (1998).
10. J.A. Silver and D.C. Hovde, "Near-Infrared diode laser airborne hygrometer," Rev. Sci.
Instrum. 65, 1691-1694 (1994).
11. J.E. Collins, Jr, G.W. Sachse, L.G. Burney, and L.O. Wade, "A novel external path water
vapor sensor," NASA Atmospheric Effects of Aviation Project, 5th Annual Meeting,
Virginia Beach, VA, April 23-28, 1995.
12. D.M. Sonnenfroh, W.J. Kessler, J.C. Magill, B.L. Upschulte, M.G. Allen, and J.D.W.
Barrick, "In-Situ sensing of tropospheric water vapor using an airborne near-IR diode laser
hygrometer", Appl. Phys. B 67, 275-282 (1998).
13. K. Namjou, S. Cai, E.A. Whittaker, J. Faist, C. Gmachl, F. Capasso, D.L. Sivco, and A.Y.
Cho, “Sensitive absorption spectroscopy with a room-temperature distributed-feedback
quantum-cascade laser,” Opt. Letts. 23, 219-221 (1998).
14. S.W. Sharpe, J.F. Kelly, J.S. Hartman, C. Gmachl, F. Capasso, D.L. Sivco, J.N.
Baillargeon, and A.Y. Cho, “High resolution (Doppler limited) spectroscopy using
quantum-cascade distributed-feedback lasers,” Opt. Letts. 23, 1396-1398 (1998).
15. B.A. Paldus, T.G. Spence, R.N. Zare, J. Oomens, F.J.M. Harren, D.H. Parker, C. Gmachl,
F. Capasso, D.L. Sivco, J.N. Baillargeon, A.L. Hutchinson, and A.Y. Cho, “Photoacoustic
spectroscopy using quantum-cascade lasers,” Opt. Letts. 24, 178-180 (1999).
Page 21
20
16. A.A. Kosterev, R.F.Curl, F.K. Tittel, C. Gmachl, F. Capasso, D.L. Sivco, J.N. Baillargeon,
A.L. Hutchinson, and A.Y. Cho, “Methane concentration and isotopic composition
measurements with a mid-infrared quantum-cascade laser,” Opt. Letts. 24, 1762-1764
(1999).
17. C. Gmachl, J. Faist, J.N. Baillargeon, F. Capasso, C. Sartori, D.L. Sivco, S.N.G. Chu, and
A.Y. Cho, “Complex-coupled quantum cascade distributed-feedback laser,” IEEE
Photonics Tech. Letts. 9, 1090-1092 (1997).
18. M.G. Allen, K.L. Carleton, S.J. Davis, W.J. Kessler, C.E. Otis, D.A. Palombo, and D.M.
Sonnenfroh, "Ultra-sensitive dual-beam absorption and gain spectroscopy: Applications
for near-ir and visible diode laser sensors," Appl. Opt. 34, 3240-3249 (1995).
19. P.C.D. Hobbs, “Ultrasensitive laser measurements without tears,” Appl. Opt. 36, 903-920
(1997).
20. K.L. Haller and P.C.D. Hobbs, "Double beam laser absorption spectroscopy: shot noise-
limited performance at baseband with a novel electronic noise canceller," in Optical
Methods for Ultrasensitive Detection and Analysis: Technique and Applications, B.L.
Feurey, ed., Proc. SPIE 1435, 298-309 (1991).
21. A.C.G. Mitchell and M.W. Zemansky, Resonance Radiation and Excited Atoms,
Cambridge University Press, New York, 1934.
22. W.T. Rawlins and F. Kaufman, "Characteristics of O(I) and N(I) Resonance Line
Broadening in Low Pressure Helium Discharge Lamps," J. Quant. Spectrosc. Radiat.
Transfer 18, 561-572 (1977).
Page 22
21
23. L.S. Rothman, C.P. Rinsland, A. Goldman, S.T. Massie, D.P. Edwards, J.M. Flaud,
A. Perrin, C. Camy-Peyret, V. Dana, J.Y. Mandin, J. Schroeder, A. McCann, R.R.
Gamache, R.B. Wattson, K. Yoshino, K.V. Chance, K.W. Jucks, L.R. Brown,
V. Nemtchinov, and P. Varanasi, "The HITRAN molecular spectroscopic database and
HAWKS (HITRAN Atmospheric Workstation): 1996 Edition, J. Quant. Spectrosc. Radiat.
Transfer 60, 665-710 (1998).
24. D.M. Sonnenfroh and M.G. Allen, "Ultrasensitive visible tunable diode laser detection of
NO2," Appl. Opt. 35, 4053-4058 (1996).
25. C. Gmachl, A.M. Sergent, A. Tredicucci, F. Capasso, A.L. Hutchinson, D.L. Sivco, J.N.
Baillargeon, S.N.G. Chu, and A.Y. Cho, “Improved CW operation of quantum cascade
lasers with epitaxial-side heat-sinking,” IEEE Photonics Tech. Letts. 11, 1369-1371
(1999).
Page 23
22
Figure Captions
Figure 1. QC laser mount housing.
Figure 2. Schematic of electronics for driving QC lasers in pulsed mode.
Figure 3. General experimental arrangement of laser absorption spectrometer with BRD
detection.
Figure 4. (a) Current waveform from the inductive probe and optical waveform from the fast
HgCdTe detector; (b) rescaled current waveform overlain on the optical waveform.
Figure 5. N2O number density determined by the laser spectrometer versus manometer.
Figure 6. Spectrum of the P24E line of the 1110 band for 48.4 Torr of N2O. The spectrum is
an average of 100 scans.
Figure 7. NO number density determined by the laser spectrometer versus manometer.
Figure 8. BRD determined N2O number density versus manometer number density.
Page 24
23
Figure 9. Observed and predicted peak fractional absorption at 1859.3 cm-1 versus N2O
optical depth (data from Figure 8).
Figure 10. Model-corrected laser-determined optical depth versus calculated optical depth for
the sample. The line is a least squares fit as described in the text.
Figure 11. Experimental spectrum of Figure 6 compared with HITRAN absorption spectrum
and laser spectral intensity.
Figure 12. Spectrum of the P5.5e,f lines of the fundamental band for 0.032 Torr of NO. The
spectrum is an average of 200 scans.
Page 25
Figure 1
ElectricalConnections
TEC Heat SinkCooling Water
Heat Sink,TE Cooler, Laser
5 Axis Precision-Alignment Stage
AR-Coated GeCollimation Lens
Lens Holder
Page 26
Figure 2
DLD-55A-110A
Diode-Laser Driver
ILXDiode-Laser
Current Supply(0-500 mA)
AvtechTee
Copper-StripTransmission Line
Copper-StripTransmission Line
~50 ns
~67 µs(15 kHz)
500 mA
100 HzTo Laser Mount
WaveformGenerator
MicrontaSupply
(0-15V, 0-1A)
KepcoSupply
(0-125V, 0-1A)
PulseGenerator
Page 31
Figure 7
0.0
5.0x10¹⁴
1.0x10¹⁵
1.5x10¹⁵
2.0x10¹⁵
0.0 5.0x10¹⁴
Baratron Number Density (cm-3)La
ser
Num
ber
Den
sity
(cm
-3)
1.0x10¹⁵ 1.5x10¹⁵ 2.0x10¹⁵
Page 32
Figure 8
0
5
10
15
20
25
30
35
40
45
Manometer N2O Number Density (cm-3)
BR
DN
umbe
rD
ensi
ty(a
.u.)
1.0x10³
5.0x10171.0x1018
1.5x10182.0x1018
2.5x10183.0x1018
3.5x10184.0x1018
Page 34
Figure 10
0.4
0.5
0.6
0.7
0.8
0.9
1
1.1
1.2
1.3
0.3 0.5 0.7 0.9 1.1 1.3Calculated Optical Depth
Lase
rD
eter
min
edO
ptic
alD
epth
0.3
Page 36
Figure 12
-0.010
0.000
0.010
0.020
0.030
0.040
0.050
0 0.2 0.4 0.6 0.8 1Frequency (a.u.)
Abs
orp
tion