Page 1
SREE VAHINI INSTITUTE OF SCIENCE AND TECHNOLOGY,TIRUVURU
Department Of CIVIL Engineering Page 1
INDEX
S.NO NAME OF THE EXPERMENT PAGENO
1 TO DETERMINE IMPACT STRENGTH OF STEEL. (BY IZOD TEST ) 3
2 TO DETERMINE IMPACT STRENGTH OF STEEL.( BY CHARPY
TEST)
8
3 ROCK WELL HARDNESS TEST 15
4 BRINELL HARDNESS TEST 22
5 TO DETERMINE THE STIFFNESS OF SPRING AND MODULUS OF
RIGIDITY OF SPRING WIRE
31
6 TO DETERMINE COMPRESSIVE STRENGTH OF BRICK. 39
7 TORSION TEST ON MILD STEEL ROD. 43
8 SIMPLY SUPPORTED BEAM 48
9 CANTILEVER BEAM 54
10 TO STUDY THE UTM 60
11 TENSILE TEST ON UTM 72
12 COMPRESSION TEST ON UTM 82
13 BENDING TEST ON UTM 87
14 SHEAR TEST ON UTM 96
15 VERIFICATION OF MAXWELL’S RECIPROCAL THEOREM 100
16 USE OF ELECTRICAL RESISTANCE STRAIN GAUGES. 104
Page 2
SREE VAHINI INSTITUTE OF SCIENCE AND TECHNOLOGY,TIRUVURU
Department Of CIVIL Engineering Page 2
TO DETERMINE IMPACT STRENGTH OF STEEL BY IZOD TEST
AIM : To determined impact strength of steel.
OBJECT: To determine the impact strength of steel by Izod impact test
APPARATUS:
1. Impact testing machine
2. A steel specimen 75 mm X 10mm X 10mm
3. Vernier calipers
THEORY :
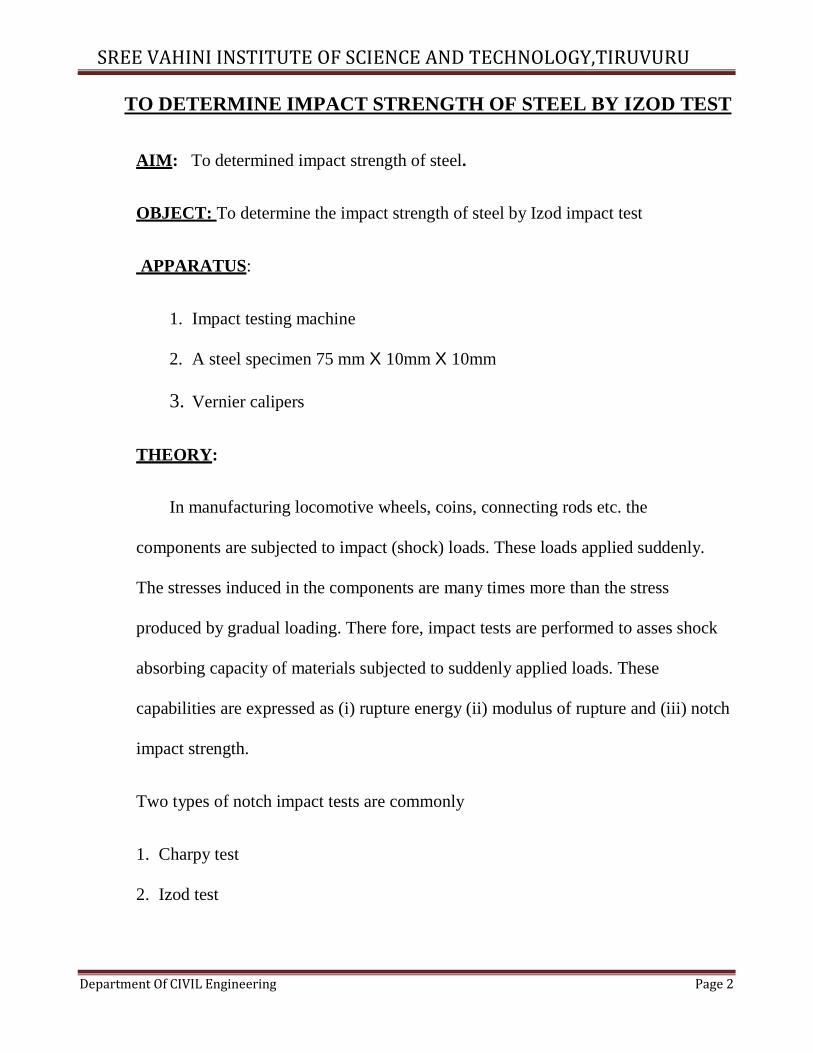
In manufacturing locomotive wheels, coins, connecting rods etc. the
components are subjected to impact (shock) loads. These loads applied suddenly.
The stresses induced in the components are many times more than the stress
produced by gradual loading. There fore, impact tests are performed to asses shock
absorbing capacity of materials subjected to suddenly applied loads. These
capabilities are expressed as (i) rupture energy (ii) modulus of rupture and (iii) notch
impact strength.
Two types of notch impact tests are commonly
1. Charpy test
2. Izod test
Page 3
SREE VAHINI INSTITUTE OF SCIENCE AND TECHNOLOGY,TIRUVURU
Department Of CIVIL Engineering Page 3
Page 4
SREE VAHINI INSTITUTE OF SCIENCE AND TECHNOLOGY,TIRUVURU
Department Of CIVIL Engineering Page 4
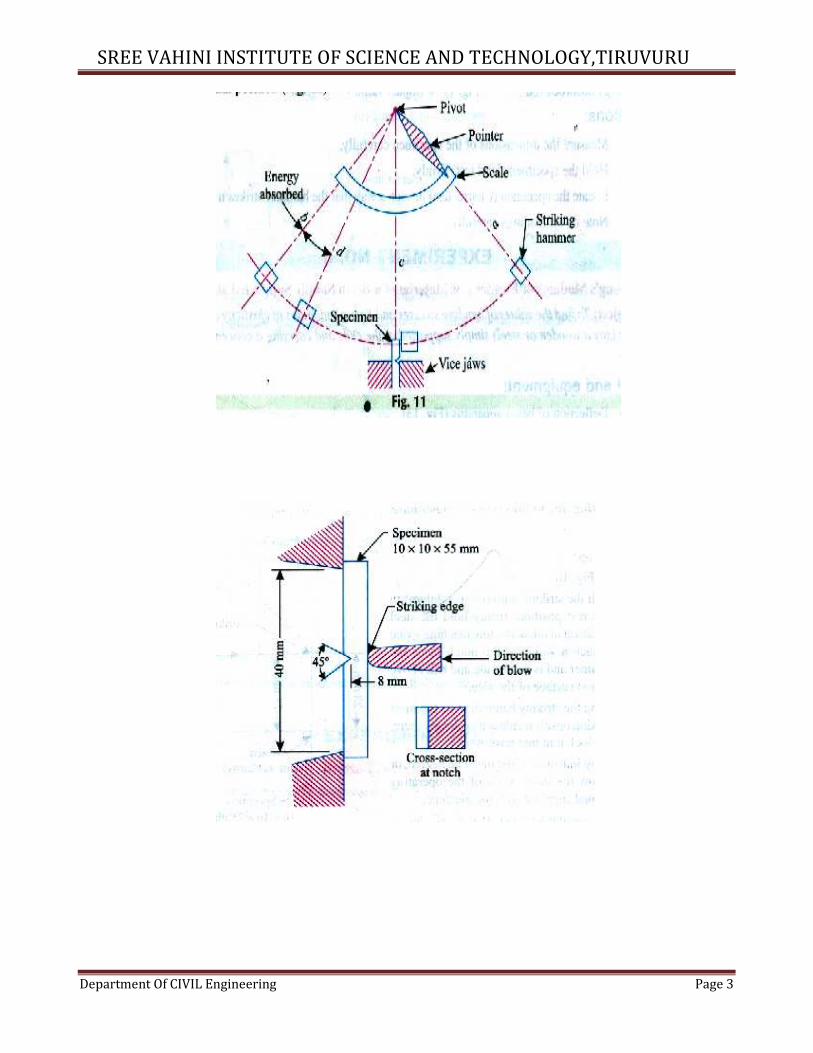
In Izod test, the specimen is placed as cantilever beam. The specimens have V-shaped
notch of 45o. U-shaped notch is also common. The notch is located on tension side of
Specimen during impact loading. Depth of notch is generally taken as �� to
�� where t is
thickness of the specimen.
SPECIFICATIONS OF M/C AND SPE CIMENT DETAILS:
� Impact capacity=164 joules
� Least count of capacity (dial) scale =2 joules
� Weight of striking hammer =18.7kg
� Swing diameter of striking hammer =1600mm
� Angle of hammer before striking=900
� Distance between supports=40mm
� Striking velocity of hammer=5.6m/sec
� Specimen size=75 mm X 10mm X 10mm
� Type of notch = V- notch
� Angle of notch =450
� Depth of notch=2mm
PROCEDURE:
� With the striking hammer (pendulum) in safe test position, firmly
Hold the steel specimen in impact testing machine’s vice in such away that the notch
face the hammer and is half inside and half above the top surface of the vice.
Page 5
SREE VAHINI INSTITUTE OF SCIENCE AND TECHNOLOGY,TIRUVURU
Department Of CIVIL Engineering Page 5
EVALUATION OF TEST:
The notch impact strength ‘I’ is calculated according to the following relation I = ��
Where,
I = impact strength N-m or J
K = impact energy absorbed on repute N-m or J
A = area of cross section of specimen below the notch before test m2
Area at V- notch, A=B X D …… m2
Breadth at V – notch =B …… m
Depth at V-notch =D ……. m
The notch impact strength depends largely on the shape of the specimen and the notch.
The values determined with other specimens, therefore may not be compared with each
other.
Impact strength of the given specimen is ……………N-m
Page 6
SREE VAHINI INSTITUTE OF SCIENCE AND TECHNOLOGY,TIRUVURU
Department Of CIVIL Engineering Page 6
� Bring the striking hammer to its top most striking position unless it is already
there, and lock it at that position.
� Bring indicator of the machine to zero, or follow the instructions ofthe operating
manual supplied with the machine.
� Release the hammer. It will fall due to gravity and break the specimen through
its momentum, the total energy is not absorbed by the specimen. Then it
continues to swing. At its topmost height after breaking the specimen, the
indicator stops moving, while the pendulum falls back. Note the indicator at that
topmost final position.
� Again bring back the hammer to its idle position and back.
PRECAUTIONS:
• The specimen should be prepared in proper dimensions
• Take reading more frequently
• Make the loose pointer in contact with the fixed pointer after the pendulum
• Do not stand infront of swimming hammer or releasing hammer
• Place the specimen proper position
RESULT:
i. The energy absorbed for Mild Steel is found out to be-------Joules.
Page 7
SREE VAHINI INSTITUTE OF SCIENCE AND TECHNOLOGY,TIRUVURU
Department Of CIVIL Engineering Page 7
TO DETERMINE IMPACT STRENGTH OF STEELBY CHARPY TEST
AIM : To determined impact strength of steel.
OBJECT: To determine the impact strength of steel by Charpy test
APPARATUS:
1. Impact testing machine
2. A steel specimen 10 mm X 10mm X 55mm
THEORY :
An impact test signifies toughness of material that is ability of material to
absorb energy during plastic deformation. Static tension tests of unmatched
specimens do not always reveal the susceptibility of a metal to brittle fracture
this important factor is determined by impact test. Toughness takes into account
both the strength and ductility of the material. Several engineering materials
have to withstand impact or suddenly applied loads while in service. Impact
strengths are generally lower as compared to strengths achieved under slowly
applied loads. Of all types of impact tests, the notch bar tests are most
extensively used. Therefore, the impact test measures the energy necessary to
fracture a standard notch bar by applying an impulse load. The test measures the
notch toughness of material under shock loading. Values obtained from these
Page 8
SREE VAHINI INSTITUTE OF SCIENCE AND TECHNOLOGY,TIRUVURU
Department Of CIVIL Engineering Page 8
tests are not of much utility to design problems directly and are highly arbitrary.
Still it is important to note that it provides a good way of comparing toughness
Page 9
SREE VAHINI INSTITUTE OF SCIENCE AND TECHNOLOGY,TIRUVURU
Department Of CIVIL Engineering Page 9
of various materials or toughness of the same material under different condition. This
test can also be used to assess the ductile brittle transition temperature of the material
occurring due to lowering of temperature.
SPECIFICATIONS OF M/C AND SPE CIMENT DETAILS:
� Impact capacity=300joules
� Least count of capacity (dial) scale =2 joules
� Weight of striking hammer =18.7kg
� Swing diameter of striking hammer =1600mm
� Angle of hammer before striking=1600
� Distance between supports=40mm
� Striking velocity of hammer=5.6m/sec
� Specimen size=55 mm X 10mm X 10mm
� Type of notch = V- notch
Page 10
SREE VAHINI INSTITUTE OF SCIENCE AND TECHNOLOGY,TIRUVURU
Department Of CIVIL Engineering Page 10
� Angle of notch =450
� Depth of notch=2mm
DESCRIPTION OF MACHINE :
The pendulum impact testing machine consists of the robust frame, the
pendulum, the specimen support and the measuring dial. The pendulum shaft is
attend in anti friction bearings. The pendulum is clamped to pendulum shaft.
The pendulum consists of the pendulum pipe and the pendulum hammer of U-
shaped design. Into this, the striker is mounted for conducting Charpy impact
Page 11
SREE VAHINI INSTITUTE OF SCIENCE AND TECHNOLOGY,TIRUVURU
Department Of CIVIL Engineering Page 11
test. The range, within which the pendulum is swinging, is partially protected by
the guard. A latch is provided which keeps the pendulum is elevated position.
A lever is provided for operating the latch and releasing the
pendulum. There is a dial attached concentrically with the pendulum shaft. The
scale is designed such that the impact energy absorbed in breaking the specimen
can be read directly in joules.
PROCEDURE:
1. With the striking hammer (pendulum) in safe test position, firmly hold the steel
specimen in impact testing machines vice in such a way that the notch faces s the
hammer and is half inside and half above the top surface of the vice.
2. Bring the striking hammer to its top most striking position unless it is already there,
and lock it at that position.
Page 12
SREE VAHINI INSTITUTE OF SCIENCE AND TECHNOLOGY,TIRUVURU
Department Of CIVIL Engineering Page 12
3. Bring indicator of the machine to zero, or follow the instructions of the operating
manual supplied with the machine.
EVALUTION OF TEST:
The notch impact strength ‘I’ is calculated according to the following relation
I = ��
Where,
I= impact strength N-m or J
K = Impact energy absorbed on repute N-m or J
A = area of cross section of specimen below the notch before test m2
Area at V- notch, A=B X D m2
Breadth at V- notch = B m
Depth at V- notch =D m
Page 13
SREE VAHINI INSTITUTE OF SCIENCE AND TECHNOLOGY,TIRUVURU
Department Of CIVIL Engineering Page 13
The notch impact strength depends largely on the shape of the specimen and the notch.
The values determined with other specimens, therefore may not be compared with each
other
4. Release the hammer. It will fall due to gravity and break the specimen through its
momentum, the total energy is not absorbed by the specimen. Then it continues to
swing. At its topmost height after breaking the specimen, the indicator stops
moving, while the pendulum falls back. Note the indicator at that topmost final
position.
5. The specimen is placed on supports or anvil so that the blow of hammer
is opposite to the notch.
PRECAUTIONS:
• The specimen should be prepared in proper dimensions
• Take reading more frequently
• Make the loose pointer in contact with the fixed pointer after the pendulum
• Do not stand infront of swimming hammer or releasing hammer
• Place the specimen proper position
Page 14
SREE VAHINI INSTITUTE OF SCIENCE AND TECHNOLOGY,TIRUVURU
Department Of CIVIL Engineering Page 14
RESULT:
i. The energy absorbed for Mild Steel is found out to be-------Joules.
ROCKWELL HARDNESS TEST
AIM : Hardness Test of Mild Steel.
OBJECT: To determine the hardness of the given specimen using Rockwell hardness test.
APPARATUS: 1. Rockwell hardness testing machine
2 . Specimen of hard steel
THEORY: Rockwell test is developed by the Wilson instrument co U.S.A in 1920.
This test is an indentation test used for smaller specimens and harder materials.
The test is subject of IS: 1586.In this test indenter is forced into the surface of a test piece in
two operations, measuring the permanent increase in depth of an indentation from the depth
increased from the depth reached under a datum load due to an additional load.
Measurement of indentation is made after removing the additional load.
Indenter used is the cone having an angle of 120 degrees made of black diamond.
Page 15
SREE VAHINI INSTITUTE OF SCIENCE
Department Of CIVIL Engineering
SPECIFICATION OF HARDNESS TESTING M/C AND INDENTORS
A hardness test can be conducted on Brinell testing m/c, Rockwell hardness m/c or
vicker testing m/c. the specimen may be a cylinder, cube,
A Brinell cum- Rockwell hardness testing m/c along with the specimen is shown in
figure.
SREE VAHINI INSTITUTE OF SCIENCE AND TECHNOLOGY,TIRUVURU
HARDNESS TESTING M/C AND INDENTORS
A hardness test can be conducted on Brinell testing m/c, Rockwell hardness m/c or
vicker testing m/c. the specimen may be a cylinder, cube, thick or thin metallic sheet
Rockwell hardness testing m/c along with the specimen is shown in
AND TECHNOLOGY,TIRUVURU
Page 15
HARDNESS TESTING M/C AND INDENTORS:
A hardness test can be conducted on Brinell testing m/c, Rockwell hardness m/c or
or thin metallic sheet.
Rockwell hardness testing m/c along with the specimen is shown in
Page 16
SREE VAHINI INSTITUTE OF SCIENCE AND TECHNOLOGY,TIRUVURU
Department Of CIVIL Engineering Page 16
TECHNICAL DATA:
Maximum test height: 295mm.
Depth of throat: 150mm.
Maximum depth of screw below base: 280mm.
Dimensions of machine: 210 X 470mm.
Height: 850mm.
Net weight: 125 kg
PROCEDURE:
For carrying out tests, the following procedure should be adopted very
carefully; any negligence may lead damage to the indenter.
Page 17
SREE VAHINI INSTITUTE OF SCIENCE AND TECHNOLOGY,TIRUVURU
Department Of CIVIL Engineering Page 17
1. Adjust the weight on plunger of dash-post according to the Rockwell scale required as
shown on chart.
2. Keep the lever at position A.
Page 18
SREE VAHINI INSTITUTE OF SCIENCE AND TECHNOLOGY,TIRUVURU
Department Of CIVIL Engineering Page 18
3. Place specimen securely on testing table. Turn the hand wheel clockwise, so that
specimen will push the indenter and show a reading on dial gauge as small pointer at ‘3’
(red spot ) and long pointer close to ‘0’ of outer scale.
4. Turn the lever from position A to B slowly so that, the total load is brought into action
without any jerks.
5. The long pointer dial gauge reaches a steady position when indentation is complete.
Then take back the lever to ‘A’ position slowly (Sudden return to lever from B to A my
show erratic reading). The weights are thereby lifted off, only the initial load remaining
active.
6. Read the figure against the long pointer that is the direct reading of the Rockwell
hardness of specimen. Use Block or Red scale as per selection of Rock well scale.
7. Turn back the hand wheel and remove the specimen piece. Carry on the same procedure
for further tests.
Page 19
SREE VAHINI INSTITUTE OF SCIENCE AND TECHNOLOGY,TIRUVURU
Department Of CIVIL Engineering Page 19
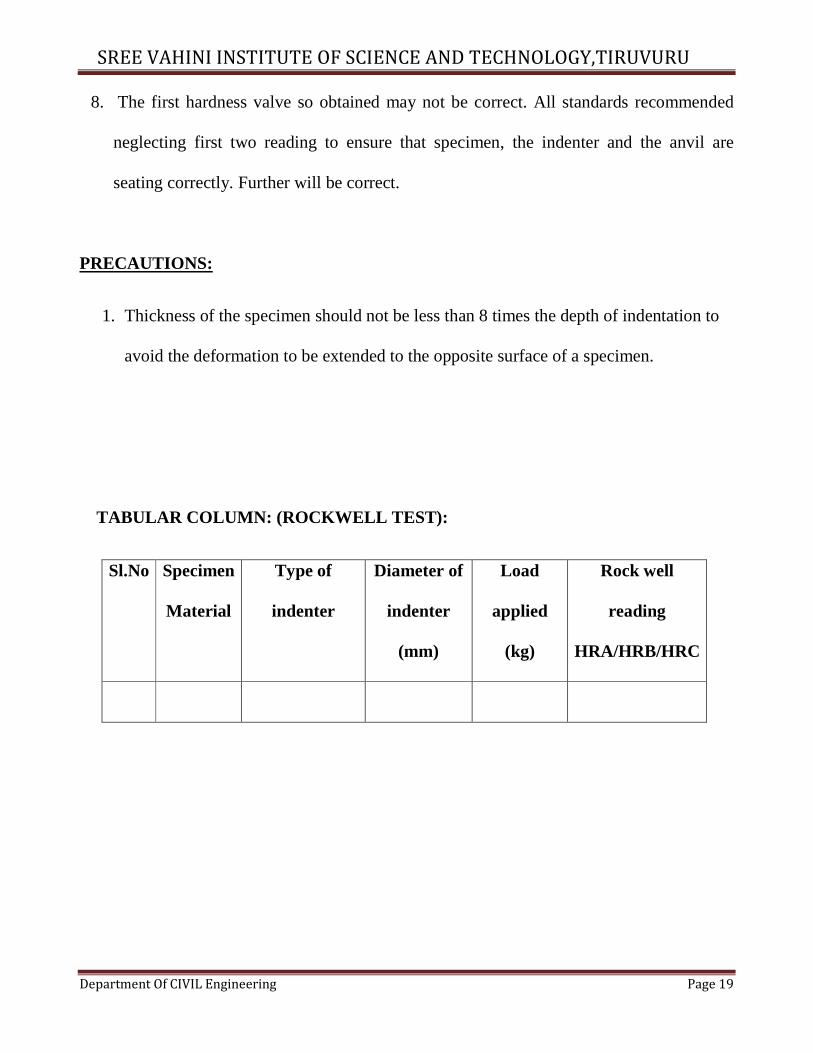
8. The first hardness valve so obtained may not be correct. All standards recommended
neglecting first two reading to ensure that specimen, the indenter and the anvil are
seating correctly. Further will be correct.
PRECAUTIONS:
1. Thickness of the specimen should not be less than 8 times the depth of indentation to
avoid the deformation to be extended to the opposite surface of a specimen.
TABULAR COLUMN: (ROCKWELL TEST):
Sl.No Specimen
Material
Type of
indenter
Diameter of
indenter
(mm)
Load
applied
(kg)
Rock well
reading
HRA/HRB/HRC
Page 20
SREE VAHINI INSTITUTE OF SCIENCE AND TECHNOLOGY,TIRUVURU
Department Of CIVIL Engineering Page 20
2. Indentation should not be made nearer to the edge of a specimen to avoid unnecessary
concentration of stresses. In such case distance from the edge to the center of
indentation should be greater than 2.5 times diameter of indentation.
3. Rapid rate of applying load should be avoided. Load applied on the ball may rise a
little because of its sudden action. Also rapidly applied load will restrict plastic flow of
a material, which produces effect on size of indentation.
CHART : Chart for most commonly used for Rockwell hardness test.
Total test force preliminary test force (10kgf)
60kgf 100kgf 150kgf
Indicator Diamond Cone 120o Ball 1/16 Diameter Diamond Cone 120o
Scale A B C Pointer position on dial at
Set Set Set
Dial to be read Black Red Black
Page 21
SREE VAHINI INSTITUTE OF SCIENCE AND TECHNOLOGY,TIRUVURU
Department Of CIVIL Engineering Page 21
Typical application Thin steel and shallow case hardened steel
Soft steel, malleable, copper and aluminum alloys
Steel, hard cast steel, deep case hardened steel, others metals
OBSERVATION:
1. Take average of five values of indentation of each specimen. Obtain the hardness
number from the dial of a machine.
2. Compare Brinell and Rockwell hardness tests obtained.
RESULT:
Rockwell Hardens Number of the given specimen, HRA/HRB/HRC =------------------------
BRINELL HARDNESS TEST
AIM:
To find hardness of the given specimen by Rockwell & Brinell testing Machine
APPARATUS:
1. Brinell Hardness testing machine
2. specimen of mild steel / cast iron/ non ferrous metals and
3. Brinell microscope.
PRINCIPLE BRINELL TESTING:
Brinell hardness test is an indentation hardness test using a calibrated machine to
force a hard steel ball indenter under specified conditions of load and name, into the
Page 22
SREE VAHINI INSTITUTE OF SCIENCE AND TECHNOLOGY,TIRUVURU
Department Of CIVIL Engineering Page 22
surface of the material under test and to measure the diameter of the resulting
impression after release of the load.
SPECIFICATION OF HARDNESS TESTING M/C AND INDENTOR S
A hardness test can be conducted on Brinell testing m/c, Rockwell hardness m/c or vicker
testing m/c. the specimen may be a cylinder, cube, think or thin metallic sheet. A
Brinellcum- Rockwell hardness testing m/c along with the specimen is shown in figure. Its
SPECIFICATION ARE AS FOLLOWS:
1. Ability to determine hardness upto 500BHN.
2. Diameter of ball (as indentor) used D = 2.5mm, 5mm, 10mm.
3. Maximum application load = 3000kgf.
Page 23
SREE VAHINI INSTITUTE OF SCIENCE AND TECHNOLOGY,TIRUVURU
Department Of CIVIL Engineering Page 23
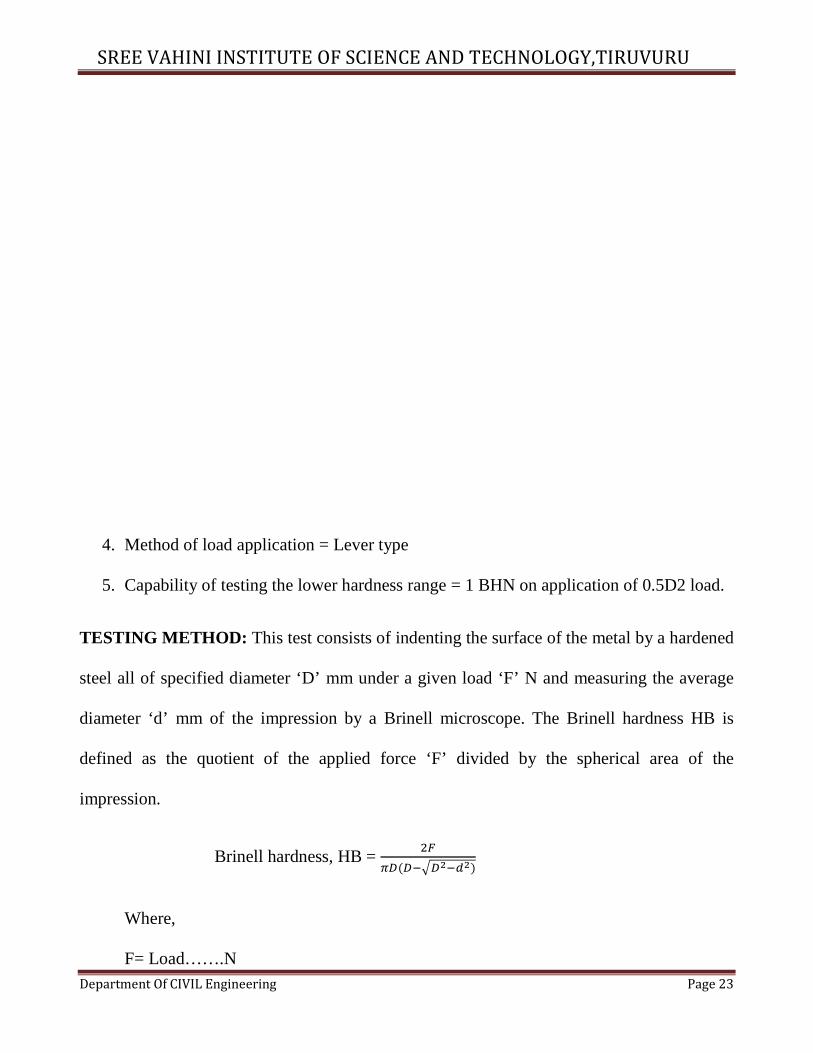
4. Method of load application = Lever type
5. Capability of testing the lower hardness range = 1 BHN on application of 0.5D2 load.
TESTING METHOD: This test consists of indenting the surface of the metal by a hardened
steel all of specified diameter ‘D’ mm under a given load ‘F’ N and measuring the average
diameter ‘d’ mm of the impression by a Brinell microscope. The Brinell hardness HB is
defined as the quotient of the applied force ‘F’ divided by the spherical area of the
impression.
Brinell hardness, HB = ��
(� ����)
Where,
F= Load…….N
Page 24
SREE VAHINI INSTITUTE OF SCIENCE AND TECHNOLOGY,TIRUVURU
Department Of CIVIL Engineering Page 24
D= Diameter of the indenter ……… mm
d= Diameter of the impression……… mm
DESCRIPTION :
The hardness test is of cast iron body. The enclosed design protects the internal
operating parts from determined dust and extraneous elements. The main screw is also
protected by a rubber below. The basic system is of weights and levers. The weights under
hydraulic dash – pot time control are applied on free end of lever, which transmits the
pressure. On plunger and there by on the work –piece for determination of hardness value.
A clamping device enable the tight clamping of work – piece during the test which at times
can not be checked under normal conditions.
Page 25
SREE VAHINI INSTITUTE OF SCIENCE AND TECHNOLOGY,TIRUVURU
Department Of CIVIL Engineering Page 25
TECHNICAL DATA:
Maximum test height: 295mm.
Depth of throat: 150
Maximum depth of screw below base: 280 mm.
Dimension of machine: 210 X 470 mm.
Page 26
SREE VAHINI INSTITUTE OF SCIENCE AND TECHNOLOGY,TIRUVURU
Department Of CIVIL Engineering Page 26
Height: 850 mm.
Net weight: 125 kg.
PROCEDURE:
For carrying out tests, the following procedure should be adopted very carefully; any
negligence may lead damage to the indenter.
1. Adjust the weights on plunger of dash – pot according to the Rockwell scale required as
shown on chart.
2. Keep the leaver at position A.
3. Place specimen securely on testing table. Tern the hand wheel clockwise, so that
specimen will push the indenter of diameter ‘D’ and show a reading on dial gauge as
small point at ‘3’(Red spot) and long pointer close to ‘0’ of outer scale.
4. Turn the lever from position A to B slowly so that, the total load is brought into action
with out any jerks.
TABULAR COLUMN: (BRINELL TEST)
Sl.No Specimen Material Type of
indenter
Diameter of
indenter (mm)
Load
applied
(Kg)
Brinell
hardness
Page 27
SREE VAHINI INSTITUTE OF SCIENCE AND TECHNOLOGY,TIRUVURU
Department Of CIVIL Engineering Page 27
Take,
If diameter of ball indenter ‘D’ is 2.5 mm, then F/D2 = 30
If diameter of ball indenter ‘D’ is 5 mm, then F/D2 = 10
5. The long pointer dial gauge reaches a steady position when indentation is complete.
Then take back the lever to ‘A’ position slowly. (Sudden return to lever from B to A
may show erratic reading. The weights are hereby lifted off, only the initial load
remaining active
Page 28
SREE VAHINI INSTITUTE OF SCIENCE AND TECHNOLOGY,TIRUVURU
Department Of CIVIL Engineering Page 28
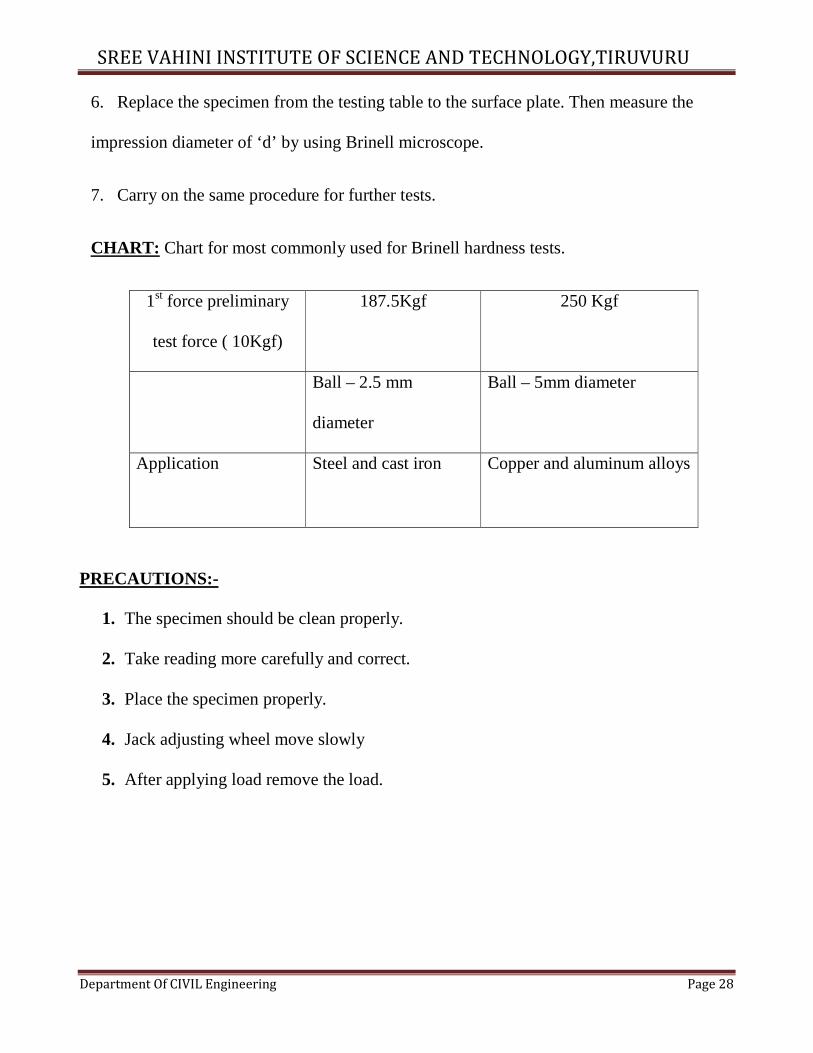
6. Replace the specimen from the testing table to the surface plate. Then measure the
impression diameter of ‘d’ by using Brinell microscope.
7. Carry on the same procedure for further tests.
CHART: Chart for most commonly used for Brinell hardness tests.
1st force preliminary
test force ( 10Kgf)
187.5Kgf 250 Kgf
Ball – 2.5 mm
diameter
Ball – 5mm diameter
Application Steel and cast iron Copper and aluminum alloys
PRECAUTIONS:-
1. The specimen should be clean properly.
2. Take reading more carefully and correct.
3. Place the specimen properly.
4. Jack adjusting wheel move slowly
5. After applying load remove the load.
Page 29
SREE VAHINI INSTITUTE OF SCIENCE AND TECHNOLOGY,TIRUVURU
Department Of CIVIL Engineering Page 29
RESULT:
Brinnel Hardness Number of the given specimen, HB =
Page 30
SREE VAHINI INSTITUTE OF SCIENCE AND TECHNOLOGY,TIRUVURU
Department Of CIVIL Engineering Page 30
Page 31
SREE VAHINI INSTITUTE OF SCIENCE AND TECHNOLOGY,TIRUVURU
Department Of CIVIL Engineering Page 31
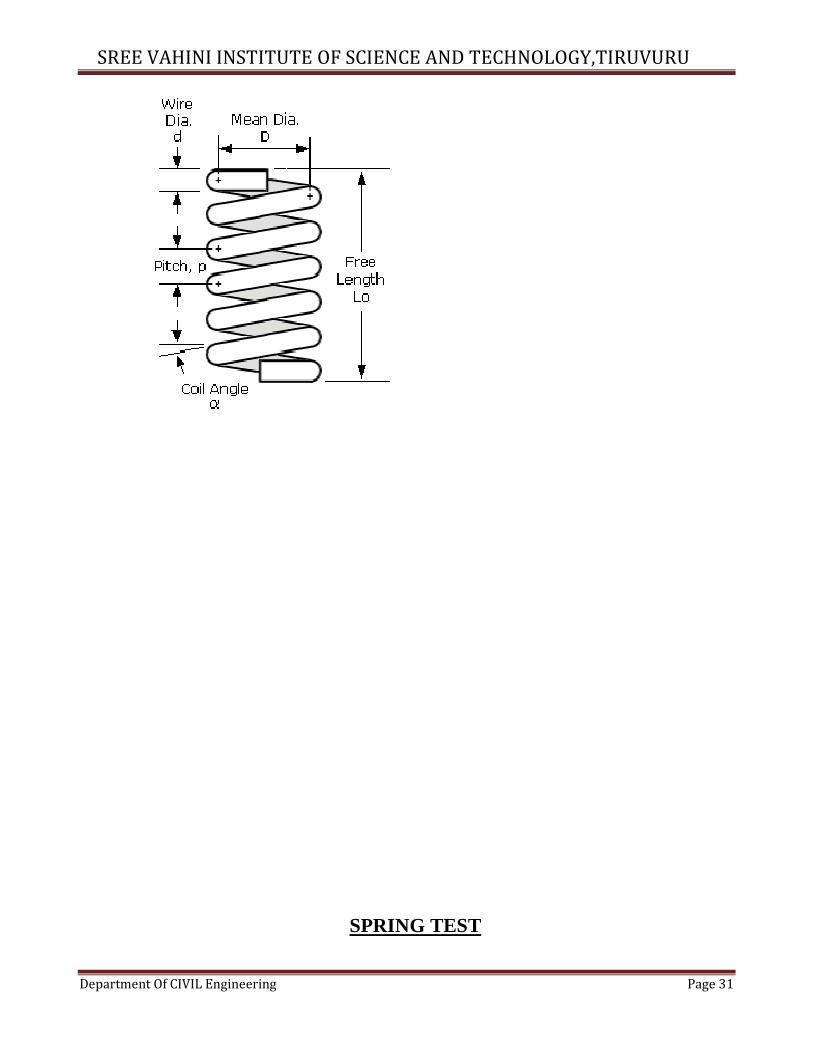
SPRING TEST
Page 32
SREE VAHINI INSTITUTE OF SCIENCE AND TECHNOLOGY,TIRUVURU
Department Of CIVIL Engineering Page 32
AIM:
To determine the stiffness and rigidity modulus of the given spring by conducting
impression test.
APPARATUS:
1. Closely coiled helical spring
2. Spring testing machine.
3. vernier caliper.
4. Micrometer
THEORY:
Springs are elastic member which distort under load and regain their original shape when
load is removed. They are used in railway carriages, motor cars, scooters, motorcycles,
rickshaws, governors etc. According to their uses the springs perform the following
Functions:
1. To absorb shock or impact loading as in carriage springs
2. To store energy as in clock springs.
3. To apply forces to and to control motions as in brakes and clutches.
4. To measure forces as in spring balances.
5. To change the variations characteristic of a member as in flexible mounting of
motors.
Page 33
SREE VAHINI INSTITUTE OF SCIENCE AND TECHNOLOGY,TIRUVURU
Department Of CIVIL Engineering Page 33
For spring wire diameter (d) :
S.NO M.S.R. V.C.R. M.S.R+(V.C.R.X L.C.)
Average=
Page 34
SREE VAHINI INSTITUTE OF SCIENCE AND TECHNOLOGY,TIRUVURU
Department Of CIVIL Engineering Page 34
Several types of spring are available for different application. Springs may classified as
helical springs, leaf springs and flat spring depending upon their shape. They are fabricated
of high shear strength materials such as high carbon alloy steels spring form elements of not
only mechanical system but also structural system. In several cases it is essential to idealise
complex structural systems by suitable spring.
PROCEDURE:
1) Measure the diameter of the wire of the spring by using the micrometer.
2) Measure the diameter of spring coils by using the vernier caliper
3) Count the number of turns.
4) Insert the spring in the spring testing machine and load the spring by a suitable
weight and note the corresponding axial deflection in tension or compression.
5) Increase the load and take the corresponding axial deflection readings.
6) Plot a curve between load and deflection. The shape of the curve gives the
stiffness of the spring.
Page 35
SREE VAHINI INSTITUTE OF SCIENCE AND TECHNOLOGY,TIRUVURU
Department Of CIVIL Engineering Page 35
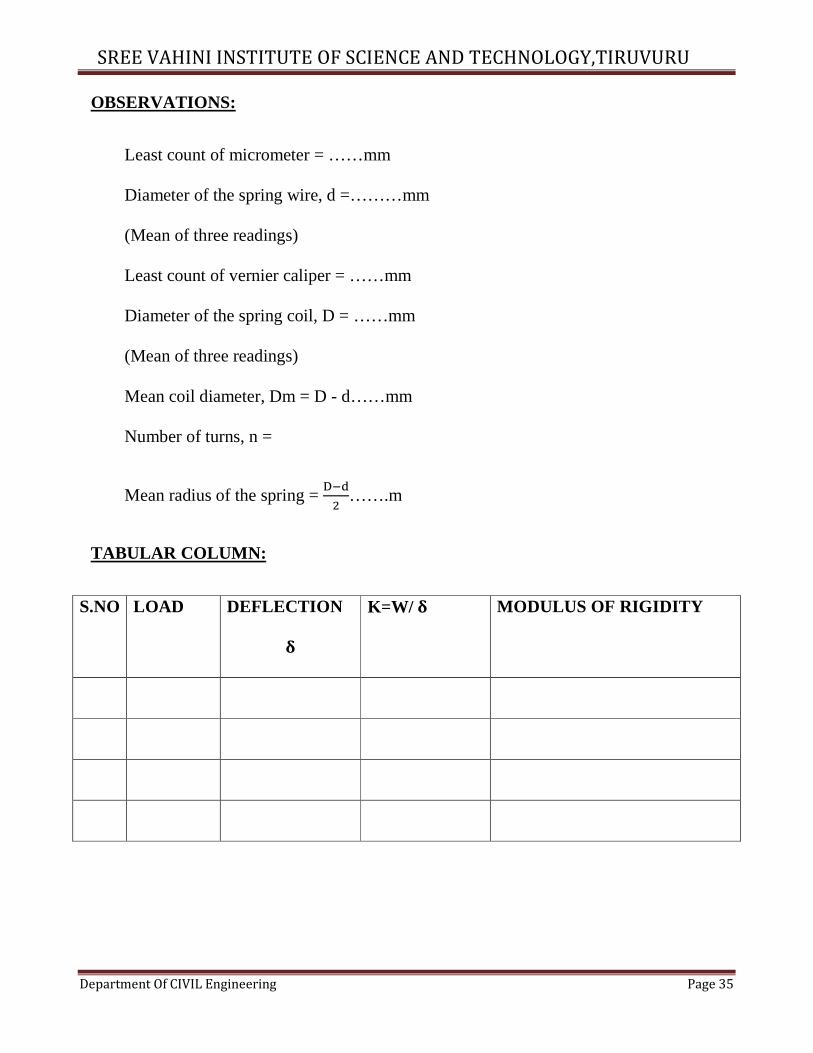
OBSERVATIONS:
Least count of micrometer = ……mm
Diameter of the spring wire, d =………mm
(Mean of three readings)
Least count of vernier caliper = ……mm
Diameter of the spring coil, D = ……mm
(Mean of three readings)
Mean coil diameter, Dm = D - d……mm
Number of turns, n =
Mean radius of the spring = ���
�…….m
TABULAR COLUMN:
S.NO LOAD DEFLECTION
�
K=W/ � MODULUS OF RIGIDITY
Page 36
SREE VAHINI INSTITUTE OF SCIENCE AND TECHNOLOGY,TIRUVURU
Department Of CIVIL Engineering Page 36
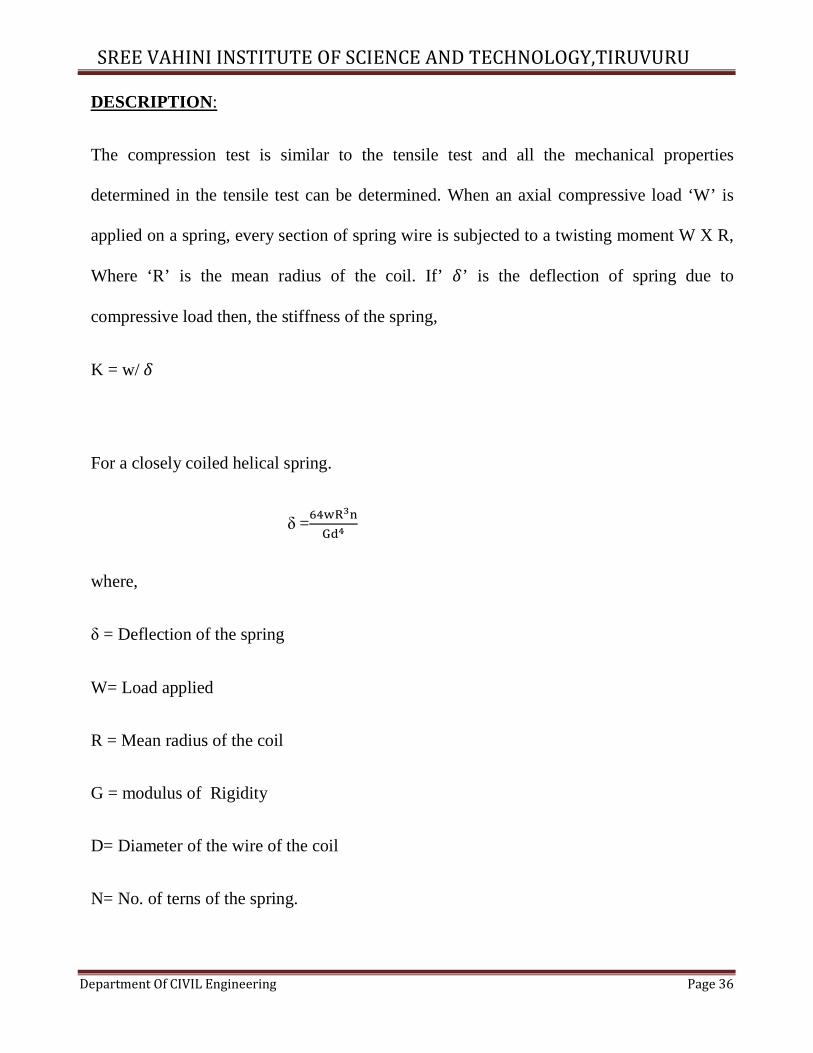
DESCRIPTION :
The compression test is similar to the tensile test and all the mechanical properties
determined in the tensile test can be determined. When an axial compressive load ‘W’ is
applied on a spring, every section of spring wire is subjected to a twisting moment W X R,
Where ‘R’ is the mean radius of the coil. If’ �’ is the deflection of spring due to
compressive load then, the stiffness of the spring,
K = w/ �
For a closely coiled helical spring.
δ =���������
where,
δ = Deflection of the spring
W= Load applied
R = Mean radius of the coil
G = modulus of Rigidity
D= Diameter of the wire of the coil
N= No. of terns of the spring.
Page 37
SREE VAHINI INSTITUTE OF SCIENCE AND TECHNOLOGY,TIRUVURU
Department Of CIVIL Engineering Page 37
From the above expression for a given spring, ‘G’ can be determined by measuring under a
particular load ‘W
GRAPH:
A graph between Load Vs deflection is drawn. From the graph at a particular value of W
the corresponding value of (δ)is noted. By using this values of G is calculated.
Load(w)
Deflection (δ)
RESULT:
Stiffness of the spring K = ……………N/mm
Modulus of rigidity, G = ………………N/mm2
Page 38
SREE VAHINI INSTITUTE OF SCIENCE AND TECHNOLOGY,TIRUVURU
Department Of CIVIL Engineering Page 38
Page 39
SREE VAHINI INSTITUTE OF SCIENCE AND TECHNOLOGY,TIRUVURU
Department Of CIVIL Engineering Page 39
COMPRESSIVE STRENGTH OF BRICK
AIM:
To determine the compressive strength of brick
OBJECT: - The specimen brick is immersed in water for 24 hours. The frog of
The Compressive Strength
APPARATUS:
Bricks, Oven Venire Caliper, Scale.
FORMULA: - Max. Load at failure
Compressive Strength = -----------------------------
Loaded Area of brick
THEORY: -
Bricks are used in construction of either load bearing walls or in portion walls incase of
frame structure. In bad bearing walls total weight from slab and upper floor comes directly
through brick and then it is transversed to the foundation. In case the bricks are
loaded with compressive nature of force on other hand in case of frame structure bricks are
used only for construction of portion walls, layers comes directly on the lower layers or wall.
In this case bricks are loaded with compressive nature of force. Hence for safely measures
before using the bricks in actual practice they have to be tested in laboratory for their
compressive strength.
PROCEDURE: -
Page 40
SREE VAHINI INSTITUTE OF SCIENCE AND TECHNOLOGY,TIRUVURU
Department Of CIVIL Engineering Page 40
OBSERVATION TABLE:
S.NO LXBXH cm3 Area LXB Cm2 Load (p) Compressive
strength(P/A)
Average Compressive strength=……….
CALCULATION:- - Max. Load at failure
Compressive Strength = ----------------------------- Loaded Area of brick
Page 41
SREE VAHINI INSTITUTE OF SCIENCE AND TECHNOLOGY,TIRUVURU
Department Of CIVIL Engineering Page 41
1. Select some brick with uniform shape and size.
2. Measure its all dimensions. (LXBXH)
3. Now fill the frog of the brick with fine sand. And
4. Place the brick on the lower platform of compression testing machine and lower the
spindle till the upper motion of ramis offered by a specimen the oil pressure start
incrising the pointer start returning to zero leaving the drug pointer that is maximum
reading which can be noted down.
PRECAUTION: -
1) Measure the dimensions of Brick accurately.
2) Specimen should be placed as for as possible in the of lower plate.
3) The range of the gauge fitted on the machine should not be more than double the
breaking load of specimen for reliable results.
RESULT: -
The average compressive strength of new brick sample is found to be ………. Kg/sq.cm.
Page 42
SREE VAHINI INSTITUTE OF SCIENCE AND TECHNOLOGY,TIRUVURU
Department Of CIVIL Engineering Page 42
FOR DIAMETER (d):
S.NO M.S.R. V.C.R. M.S.R+(V.C.R.X L.C.)
Average=
Page 43
SREE VAHINI INSTITUTE OF SCIENCE AND TECHNOLOGY,TIRUVURU
Department Of CIVIL Engineering Page 43
TORSION TEST ON MILD STEEL
AIM:- Torsion test on mild steel rod
OBJECTIVE:
To conduct torsion test on mild steel or cast iron specimens to find out
modulus of rigidity
APPARATUS:-
1. A torsion testing machine
2. Vernier Caliper
3. mild steel specimen
THEORY:- when two equal opposite torques applied on a shaft, the shaft is said to
be in pure torsion. When the shaft is subjected to torsion, shear stresses and shear
strains are produced in the material. A torsion test is quite instrumental in determining
the value of modulus of rigidity of a metallic specimen. The value of modulus of
rigidity can be found out by using torsion equation
���
= !"
= #$
Where,
T= Torque applied
J = Polar moment of inertia
G = Modulus of rigidity
Page 44
SREE VAHINI INSTITUTE OF SCIENCE AND TECHNOLOGY,TIRUVURU
Department Of CIVIL Engineering Page 44
θ = Angle of twist (radians)
L = Length of rod
OBESERVATION
a. Gauge length of the specimen, l = ……… b. Diameter of the specimen, d = ………
c. Polar moment of inertia,
% = &'(
)*
SI.NO 1 2 3 4 5 6 7 8 9 10
Torque(T)
Angle of twist (θ) in
degrees
Modulus of rigidity
(G) N/mm2
Page 45
SREE VAHINI INSTITUTE OF SCIENCE AND TECHNOLOGY,TIRUVURU
Department Of CIVIL Engineering Page 45
q = shear stress
R = radius of rod
PROCEDURE:-
1. Select the driving dogs to suit the size of the specimen and clamp it in the
Machine by adjusting the length of the specimen by means of a sliding spindle
2. Measure the diameter at about three places and take the average value
3. Choose the appropriate range by capacity change lever
4. Set the maximum load pointer to zero
5. Set the protector to zero for convenience and clamp it by means of knurled
Screw
6. Carry out straining by rotating the hand wheel in either direction
7. Load the machine in suitable increments
8. Then load out to failure as to cause equal increments of strain reading
9. Plot a torque- twist (T- θ) graph
10. Read off co-ordinates of a convenient point from the straight line portion
Straight line portion of the torque twist (T- θ) graph and calculate the value
of ‘G’ by using relation
+ = !�"�
Page 46
SREE VAHINI INSTITUTE OF SCIENCE AND TECHNOLOGY,TIRUVURU
Department Of CIVIL Engineering Page 46
PRECAUTIONS: -
1) Measure the dimensions of the specimen carefully
2) Measure the Angle of twist accurately for the corresponding value of Torque
Page 47
SREE VAHINI INSTITUTE OF SCIENCE AND TECHNOLOGY,TIRUVURU
Department Of CIVIL Engineering Page 47
3) Maintain the distance from torsion machine when it is working
4) The cross section and the along the shaft is same
RESULT:-
Modulus of rigidity of mild steel rod is ------------- N/mm2
Page 48
SREE VAHINI INSTITUTE OF SCIENCE AND TECHNOLOGY,TIRUVURU
Department Of CIVIL Engineering Page 48
Page 49
SREE VAHINI INSTITUTE OF SCIENCE AND TECHNOLOGY,TIRUVURU
Department Of CIVIL Engineering Page 49
SIMPLY SUPPORTED BEAM
AIM: -To determined young’s modulus of elasticity of material of beam simply
supported at ends.
OBJECT:-To find the values of bending stresses and young’s modulus of elasticity of the
material of a beam simply supported at the ends and carrying a concentrated load at the
centre.
APPARATERS:
1. Deflection of beam apparatus
2. Pan
3. Weights
4. Beam of different cross-sections and material (say wooden and Steel beams)
THEORY:-
If the beam is supports at the two ends, the beam is known simply supported beam. When
a beam is subjected to load the beam goes under deformation. The difference between the
elastic curve to original position of the beam is called deflection. When a simply
supported beam subjected to point load at the midpoint, the beam bends concave
upwards.
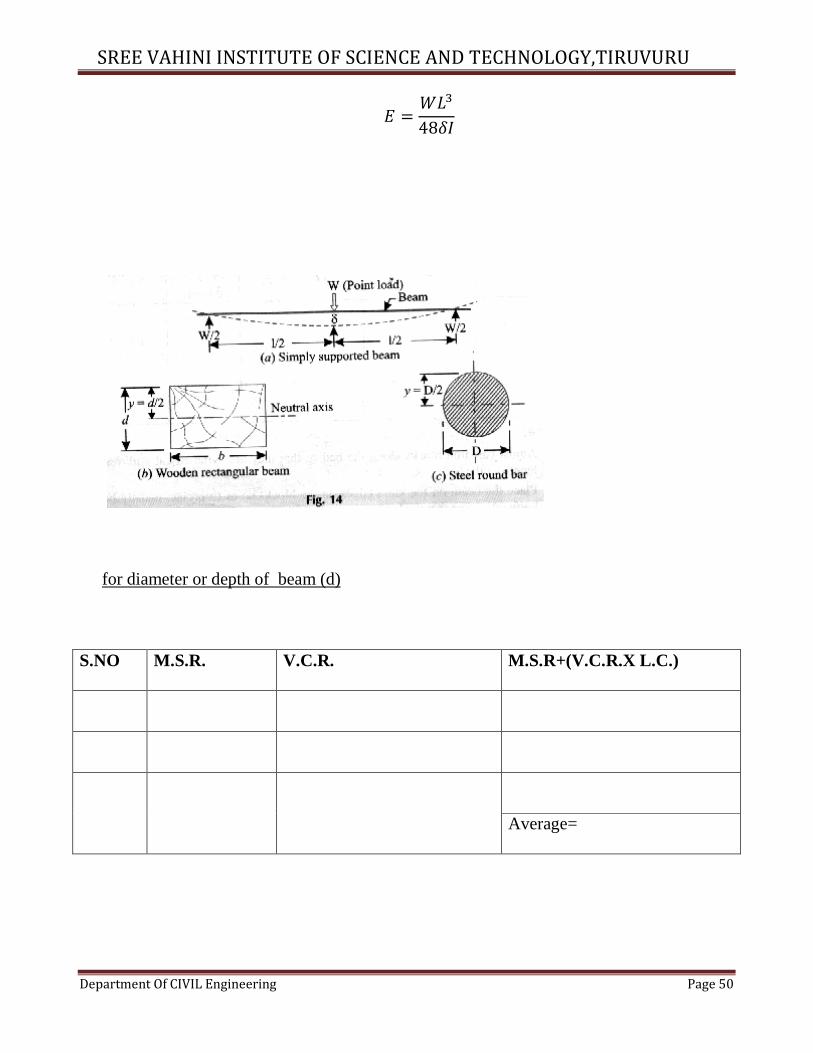
The deflection at mid point is given by
� =,-�
4801
From above equation
Page 50
SREE VAHINI INSTITUTE OF SCIENCE AND TECHNOLOGY,TIRUVURU
Department Of CIVIL Engineering Page 50
0 =,-�
48�1
for diameter or depth of beam (d)
S.NO M.S.R. V.C.R. M.S.R+(V.C.R.X L.C.)
Average=
Page 51
SREE VAHINI INSTITUTE OF SCIENCE AND TECHNOLOGY,TIRUVURU
Department Of CIVIL Engineering Page 51
Where
W =Load acting at the center, N
L =Length of the beam between the supports mm
E =Young’s modulus of material of the beam, N/mm2
I =Second moment of area of the cross- section (i.e, moment of Inertia) of the
beam, about the neutral axis, mm4
1 = 2��
3� for rectangular beam
where
b= width of beam and d= depth of the beam
1 = ��
�� for cirucular section
Where
d= diameter of the beam
BENDING STRESS:
When the stress produced to due to bending moment, the stress is known as bending
stress. The bending stress can be obtained by bending equation
04
=51
=67
Where E =Young’s modulus of material of the beam, N/mm2
R= radius of curvature
Page 52
SREE VAHINI INSTITUTE OF SCIENCE AND TECHNOLOGY,TIRUVURU
Department Of CIVIL Engineering Page 52
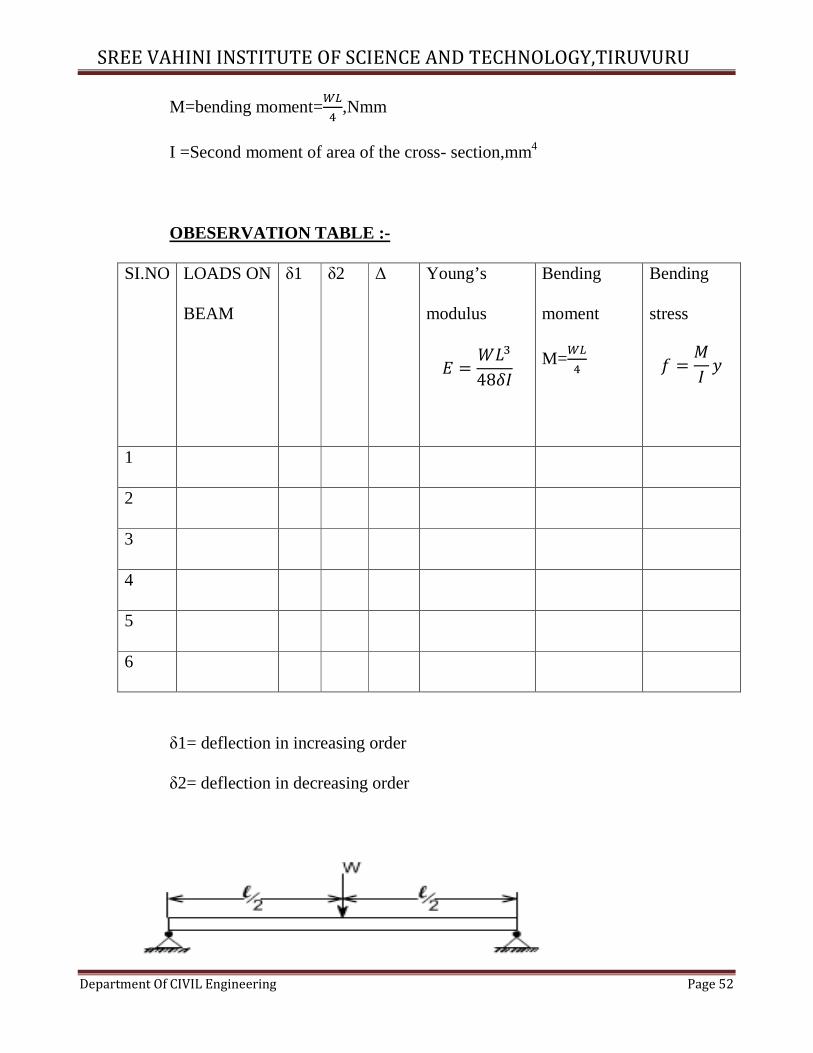
M=bending moment=8�
�,Nmm
I =Second moment of area of the cross- section,mm4
OBESERVATION TABLE :-
SI.NO LOADS ON
BEAM
δ1 δ2 Δ Young’s
modulus
0 =,-�
48�1
Bending
moment
M=8�
�
Bending
stress
6 =51
7
1
2
3
4
5
6
δ1= deflection in increasing order
δ2= deflection in decreasing order
Page 53
SREE VAHINI INSTITUTE OF SCIENCE AND TECHNOLOGY,TIRUVURU
Department Of CIVIL Engineering Page 53
f= bending stress, N/mm2
y=distance from N.A. ,mm
For simply supported beam bending moment is zero at supports and maximum at mid point
when the load is symmetrical
PROCEDURE:
1. place the simply supported beam, Take dimension i.e., Length, Width, Thickness of
the specimen
2. check the flatness of given beam with the help of dial gauge
3. Place the dial gauge under the beam where the deflection is to be measured.
4. place the hanger at the midpoints of the beam
5. now place the weights in span in increasing order at mid point
6. calculate the deflections in dial gauge for different weights
7. repeat the experiment with various loads of the beams
8. calculate deflections in decreasing order also
9. using the equation calculate the bending stress
PRECAUTIONS:
1. Make sure that beam and load are placed a proper position.
2. The cross- section of the beam should be large.
3. Note down the readings of the vernier scale carefully
RESULT:
1. The young’s modulus for steel beam is found to be----- N/mm2.
Page 54
SREE VAHINI INSTITUTE OF SCIENCE AND TECHNOLOGY,TIRUVURU
Department Of CIVIL Engineering Page 54
(OR)
2. The young’s modulus for wooden beam is found to be----- N/mm2
Page 55
SREE VAHINI INSTITUTE OF SCIENCE AND TECHNOLOGY,TIRUVURU
Department Of CIVIL Engineering Page 55
CANTILEVER BEAM
AIM: -To determined young’s modulus of elasticity of material of cantilever beam
OBJECT:-To find the values of bending stresses and young’s modulus of elasticity of the
material of a cantilever beam and carrying a concentrated load at the end.
APPARATERS:
1. Deflection of beam apparatus
2. Pan
3. Weights
4. Beam of different cross-sections and material (say wooden and Steel beams)
THEORY:
The beam which has one end is fixed and another end is free is called cantilever beam.
For the cantilever beam the bending moment is zero at free end and maximum at fixed end.
When the cantilever beam is subjected to a load at free end the beam will bend in convexity
downwards. The deflection at free end is maximum and at fixed end is zero.
When the cantilever beam is subjected to a load at free end then the maximum
bending moment is given by
`M= WL
Where W =Load acting on the beam
L= length of the beam
Page 56
SREE VAHINI INSTITUTE OF SCIENCE AND TECHNOLOGY,TIRUVURU
Department Of CIVIL Engineering Page 56
When the cantilever beam is subjected to a load at free end then the deflection is given by
� =,-�
301
for diameter or depth of beam (d)
S.NO M.S.R. V.C.R. M.S.R+(V.C.R.X L.C.)
Average=
Page 57
SREE VAHINI INSTITUTE OF SCIENCE AND TECHNOLOGY,TIRUVURU
Department Of CIVIL Engineering Page 57
From above equation
0 =,-�
3�1
Where
W =Load acting at the free end , N
L =Length of the beam mm
E =Young’s modulus of material of the beam, N/mm2
I =Second moment of area of the cross- section (i.e, moment of Inertia) of the
beam, about the neutral axis, mm4
1 = 2��
3� for rectangular beam
where
b= width of beam and d= depth of the beam
1 = ��
�� for cirucular section
Where
d= diameter of the beam
BENDING STRESS:
When the stress produced to due to bending moment, the stress is known as bending
stress. The bending stress can be obtained by bending equation
Page 58
SREE VAHINI INSTITUTE OF SCIENCE AND TECHNOLOGY,TIRUVURU
Department Of CIVIL Engineering Page 58
04
=51
=67
Where
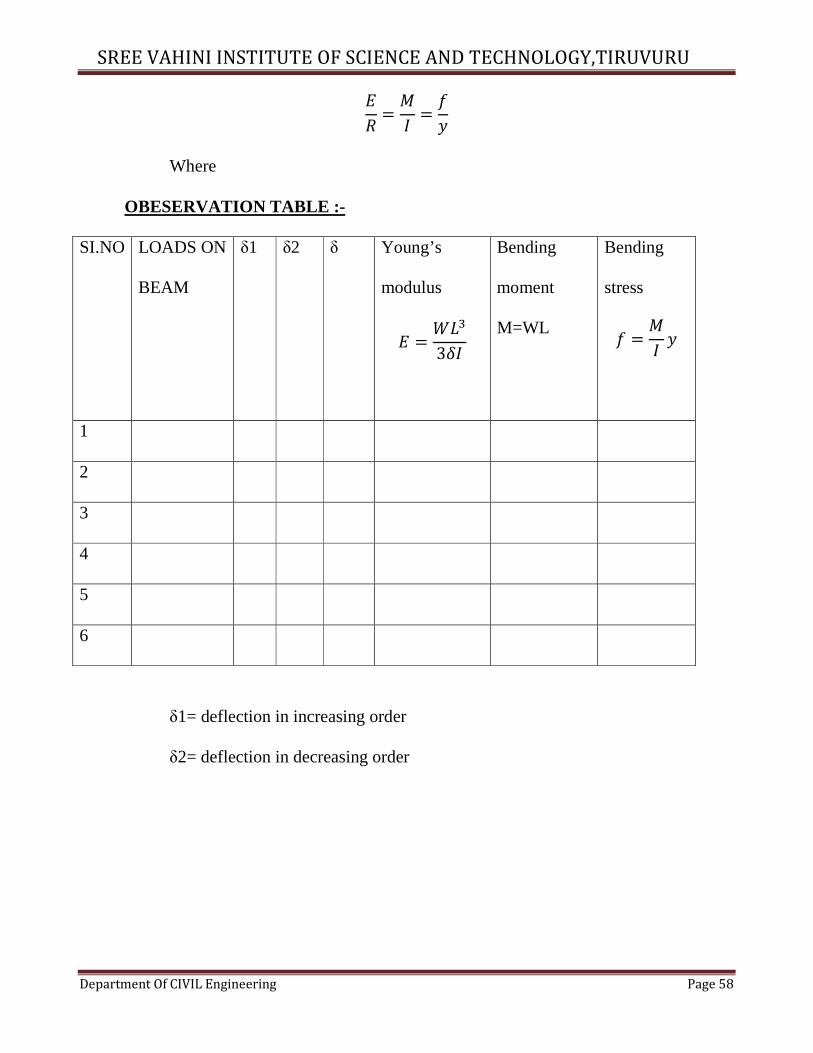
OBESERVATION TABLE :-
SI.NO LOADS ON
BEAM
δ1 δ2 δ Young’s
modulus
0 =,-�
3�1
Bending
moment
M=WL
Bending
stress
6 =51
7
1
2
3
4
5
6
δ1= deflection in increasing order
δ2= deflection in decreasing order
Page 59
SREE VAHINI INSTITUTE OF SCIENCE AND TECHNOLOGY,TIRUVURU
Department Of CIVIL Engineering Page 59
E =Young’s modulus of material of the beam, N/mm2
R= radius of curvature
M=bending moment= WL Nmm
I =Second moment of area of the cross- section,mm4
f= bending stress, N/mm2
y=distance from N.A. ,mm
PROCEDURE:
1. place the cantilever beam, Take dimension i.e., Length, Width, Thickness of the
specimen
2. check the flatness of given beam with the help of dial gauge
3. Place the dial gauge under the beam where the deflection is to be measured.
4. place the hanger at the end point of the beam
5. now place the weights in span in increasing order at free end
6. calculate the deflections in dial gauge for different weights
7. repeat the experiment with various loads of the beams
8. calculate deflections in decreasing order also
9. using the equation calculate the bending stress
PRECAUTIONS:
1. Make sure that beam and load are placed a proper position.
2. The cross- section of the beam should be large.
3. Note down the readings of the vernier scale carefully
Page 60
SREE VAHINI INSTITUTE OF SCIENCE AND TECHNOLOGY,TIRUVURU
Department Of CIVIL Engineering Page 60
RESULT:
1. The young’s modulus for steel beam is found to be----- N/mm2.
Page 61
SREE VAHINI INSTITUTE OF SCIENCE AND TECHNOLOGY,TIRUVURU
Department Of CIVIL Engineering Page 61
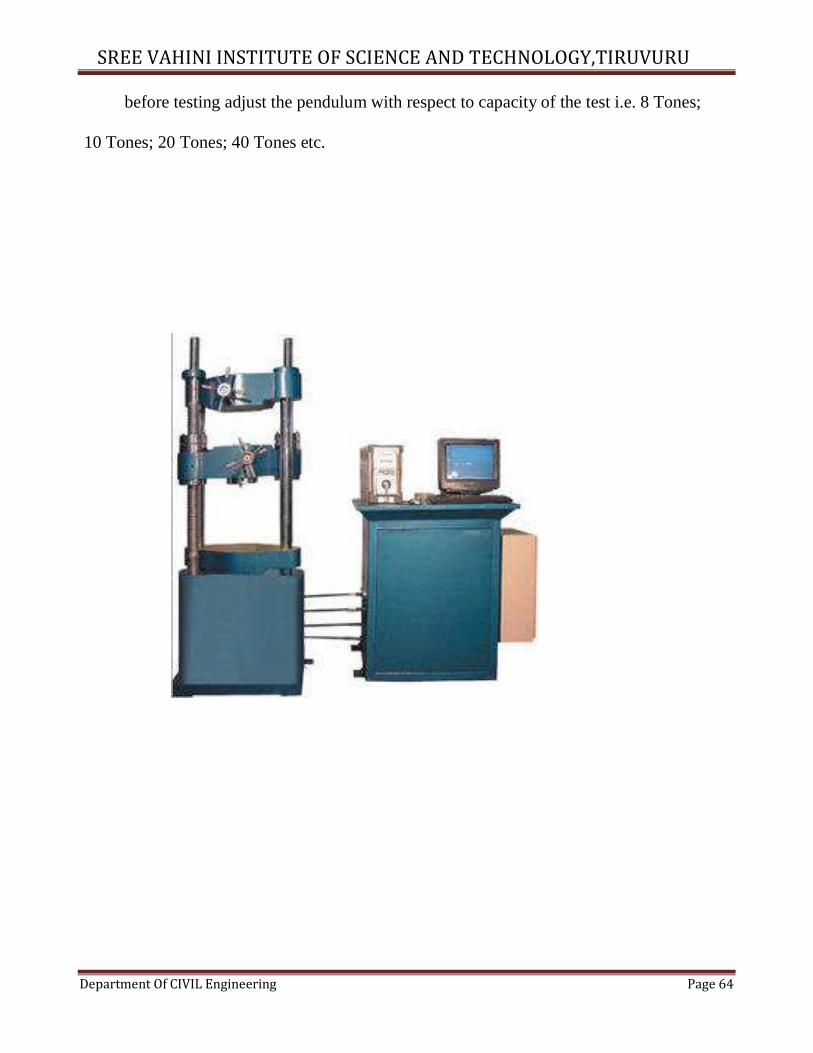
STUDY OF UNIVERSAL TESTING MACHINE
AIM: -
Study of Universal Testing Machine (U.T.M.)
OBJECT: -
To Study the various component parts of the Universal Testing Machine (U.T.M.) &
test procedures of various practical’s to be performed
APPARATUS:
Universal Testing Machine with all attachment i.e. shears test attachment, bending
attachment, tension grips, compression test attachment etc
THEORY : - The Universal Testing Machine consists of two units.
1) Loading unit,
2) Control panel.
LOADING UNIT:-
It consists of main hydraulic cylinder with robust base inside. The piston which moves
up and down. The chain driven by electric motor which is fitted on left hand side. The screw
column maintained in the base can be rotated using above arrangement of chain. Each
column passes through the main nut which is fitted in the lower cross head.
The lower table connected to main piston through a ball & the ball seat is joined to
ensure axial loading. There is a connection between lower table and upper head assembly
Page 62
SREE VAHINI INSTITUTE OF SCIENCE AND TECHNOLOGY,TIRUVURU
Department Of CIVIL Engineering Page 62
that moves up and down with main piston. The measurement of this assembly is carried out
by number of bearings which slides over the columns.
Page 63
SREE VAHINI INSTITUTE OF SCIENCE AND TECHNOLOGY,TIRUVURU
Department Of CIVIL Engineering Page 63
The test specimen each fixed in the job is known as ‘Jack Job’. To fix up the specimen
tightly, the movement of jack job is achieved helically by handle.
CONTROL PANEL:-
It consists of oil tank having a hydraulic oil level sight glass for checking the oil level.
The pump is displacement type piston pump having free plungers those ensure for
continuation of high pressure. The pump is fixed to the tank from bottom. The suction &
delivery valve are fitted to the pump near tank Electric motor driven the pump is mounted on
four studs which is fitted on the right side of the tank. There is an arrangement for loosing or
tightening of the valve. The four valves on control panel control the oil stroke in the
hydraulic system. The loading system works as described below.
The return valve is close, oil delivered by the pump through the flow control valves to
the cylinder & the piston goes up. Pressure starts developing & either the specimen breaks or
the load having maximum value is controlled with the base dynameters consisting in a
cylinder in which the piston reciprocates. The switches have upper and lower push at the
control panel for the downward & upward movement of the movable head. The on & off
switch provided on the control panel & the pilot lamp shows the transmission of main
supply.
METHOD OF TESTING:-
Initial Adjustment:
Page 64
SREE VAHINI INSTITUTE OF SCIENCE AND TECHNOLOGY,TIRUVURU
Department Of CIVIL Engineering Page 64
before testing adjust the pendulum with respect to capacity of the test i.e. 8 Tones;
10 Tones; 20 Tones; 40 Tones etc.
Page 65
SREE VAHINI INSTITUTE OF SCIENCE AND TECHNOLOGY,TIRUVURU
Department Of CIVIL Engineering Page 65
For ex: - A specimen of 6 tones capacity gives more accurate result of 10 Tones capacity
range instead of 20 Tones capacity range. These ranges of capacity are adjusted on the dial
with the help of range selector knob. The control weights of the pendulum are adjusted
correctly. The ink should be inserted in pen holder of recording paper around the drum & the
testing process is started depending upon the types of test as mentioned below.
TENSION TEST:-
Select the proper job and complete upper and lower check adjustment. Apply some
Greece to the tapered surface of specimen or groove. Then operate the upper cross head grip
operation handle & grip the upper end of test specimen fully in to the groove. Keep the lower
left valve in fully close position. Open the right valve & close it after lower table is slightly
lifted. Adjust the lower points to zero with the help of adjusting knob. This is necessary to
remove the dead weight of the lower table. Then lock the jobs in this position by operating
job working handle. Then open the left control valve. The printer on dial gauge at which the
specimen breaks slightly return back & corresponding load is known as breaking load &
maximum load is known as the ultimate load.
COMPRESSION TEST:-
Fix upper and lower pressure plates to the upper stationary head & lower table
respectively. Place the specimen on the lower plate in order to grip. Then adjust zero by
lifting the lower table. Then perform the test in the same manner as described in tensio
Page 66
SREE VAHINI INSTITUTE OF SCIENCE AND TECHNOLOGY,TIRUVURU
Department Of CIVIL Engineering Page 66
FLEXURAL OR BENDING TEST:-
Keep the bending table on the lower table in such a way that the central position of the
bending table is fixed in the central location value of the lower table. The bending supports
Page 67
SREE VAHINI INSTITUTE OF SCIENCE AND TECHNOLOGY,TIRUVURU
Department Of CIVIL Engineering Page 67
are adjusted to required distance.
Stuffers at the back of the bending table at different positions. Then place the
specimen on bending table & apply the load by bending attachment at the upper stationary
head. Then perform the test in the same manner as described in tension test.
BRINELL HARDNESS TEST:-
Place the specimen on the lower table & lift it up slightly. Adjust the zero fixed value
at the bottom side of the lower cross head. Increase the load slowly ultimate load value is
obtained. Then release the load slowly with left control valve. Get the impression of a
suitable value of five to ten millimeter on the specimen & measure the diameter of the
impression correctly by microscope & calculate Brinell hardness.
SHEAR TEST:-
Place the shear test attachment on the lower table, this attachment consists of cutter.
The specimen is inserted in roles of shear test attachment & lift the lower table so that the
zero is adjusted, then apply the load such that the specimen breaks in two or three pieces. If
the specimen breaks in two pieces then it will be in angle shear, & if it breaks in three pieces
then it will be in double shear.
STUDY OF EXTENSOMETER:-
This instrument is an attachment to Universal / Tensile Testing Machines. This
measures the elongation of a test place on load for the set gauge length. The least count of
Page 68
SREE VAHINI INSTITUTE OF SCIENCE AND TECHNOLOGY,TIRUVURU
Department Of CIVIL Engineering Page 68
Measurement being 0.01 mm and maximum elongation measurement up to 3 mm. This
elongation measurement helps in finding out the proof stress at the required percentage
elongation.
A) STRESS-STRAIN GRAPH OF MILD STEEL
Page 69
SREE VAHINI INSTITUTE OF SCIENCE AND TECHNOLOGY,TIRUVURU
Department Of CIVIL Engineering Page 69
WORKING OF THE INSTRUMENT:
The required gauge length(between 30to 120 ) is set by adjusting the upper knife
edges ( 3 ) A scale ( 2 ) is provided for this purpose . Hold the specimen in the upper and
lower jaws of Tensile / Universal Testing Machine. Position the extensometer on the
specimen. Position upper clamp (4) To press upper knife edges on the specimen. The
extensometer will be now fixed to the specimen by spring pressure. Set zero on both the dial
gauges by zero adjust screws (7 ). Start loading the specimen and take the reading of load on
the machine at required elongation or the elongation at required load. Force setter accuracies
mean of both the dial gauge ( 8) readings should be taken as elongation. It is very important
to note & follow the practice of removing the extensometer from the specimen before the
specimen breaks otherwise the instrument will be totally damaged. As a safety, while testing
the instrument may be kept hanging from a fixed support by a slightly loose thread.
TECHNICAL DATA:-
Measuring Range: 0 – 3 mm.
Least Count: 0. 01 mm.
Gauge Length adjustable from: 30 – 120 mm
Specimen Size: 1 to 20mm Round or Flats up to 20 x 20 mm
Page 70
SREE VAHINI INSTITUTE OF SCIENCE AND TECHNOLOGY,TIRUVURU
Department Of CIVIL Engineering Page 70
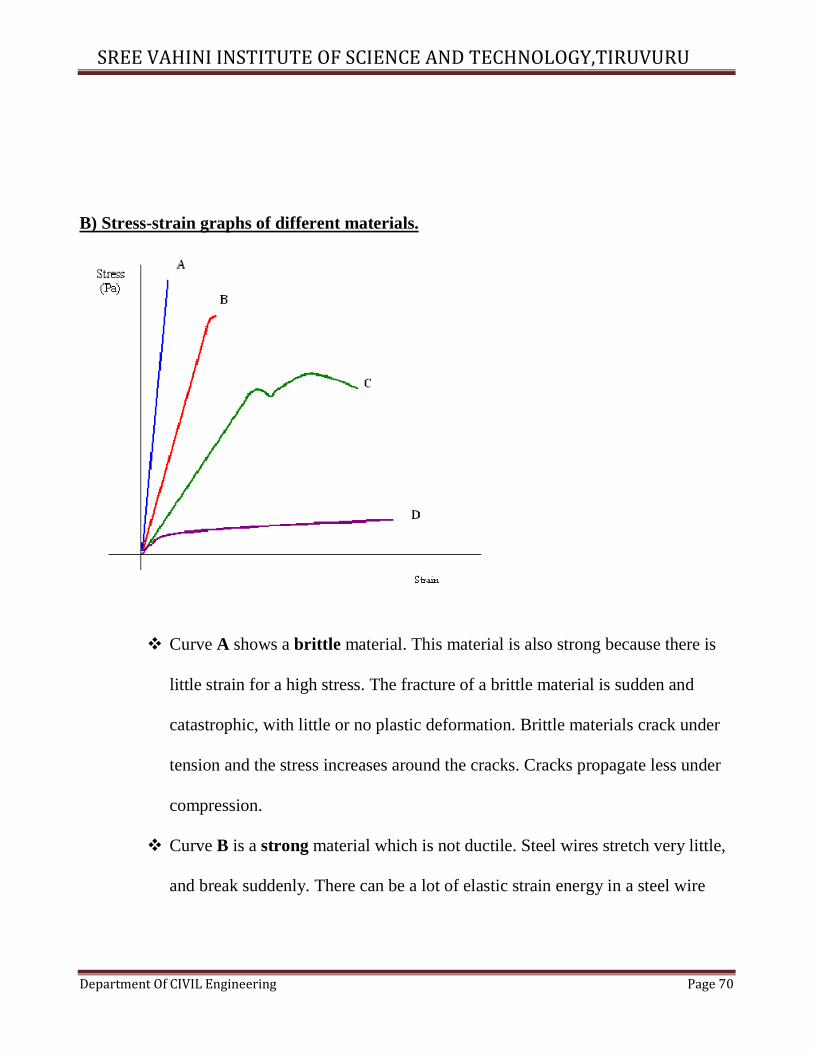
B) Stress-strain graphs of different materials.
� Curve A shows a brittle material. This material is also strong because there is
little strain for a high stress. The fracture of a brittle material is sudden and
catastrophic, with little or no plastic deformation. Brittle materials crack under
tension and the stress increases around the cracks. Cracks propagate less under
compression.
� Curve B is a strong material which is not ductile. Steel wires stretch very little,
and break suddenly. There can be a lot of elastic strain energy in a steel wire
Page 71
SREE VAHINI INSTITUTE OF SCIENCE AND TECHNOLOGY,TIRUVURU
Department Of CIVIL Engineering Page 71
under tension and it will “whiplash” if it breaks. The ends are razor sharp and
such a failure is very dangerous indeed.
� Curve C is a ductile material
� Curve D is a plastic material. Notice a very large strain for a small stress. The
material will not go back to its original length.
Page 72
SREE VAHINI INSTITUTE OF SCIENCE AND TECHNOLOGY,TIRUVURU
Department Of CIVIL Engineering Page 72
TENSILE TEST ON UTM
AIM: - To determine tensile test on a metal
OBJECT: -
To conduct a tensile test on a mild steel specimen and determine the following
(i) Limit of proportionality (ii) Elastic limit
(iii) Yield strength (iv) Ultimate strength
(v) Young’s modulus of elasticity (vi) Percentage elongation
(vii) Percentage reduction in area.
APPARATUS:
1. UTM
2. Mild steel specimens
3. Graph paper
4. Scale
5. Vernier Caliper
THEORY:-
The tensile test is most applied one, of all mechanical tests. In this test ends of test
piece are fixed into grips connected to a straining device and to a load measuring device. If
Page 73
SREE VAHINI INSTITUTE OF SCIENCE AND TECHNOLOGY,TIRUVURU
Department Of CIVIL Engineering Page 73
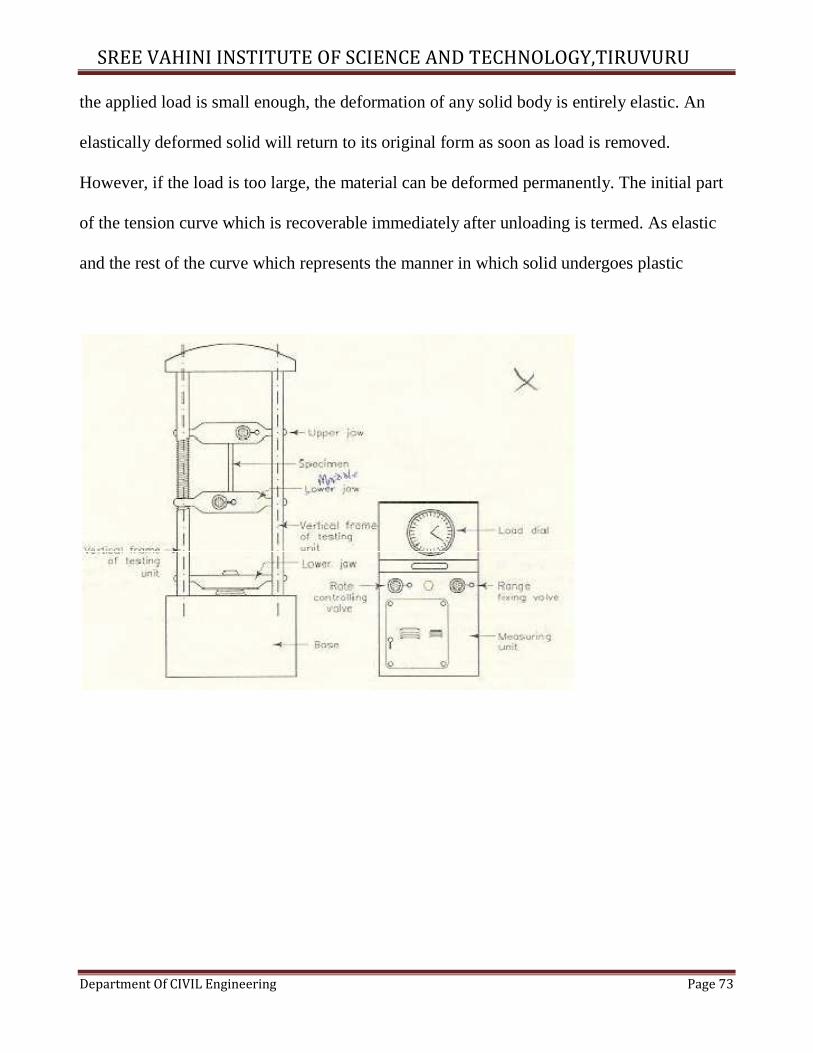
the applied load is small enough, the deformation of any solid body is entirely elastic. An
elastically deformed solid will return to its original form as soon as load is removed.
However, if the load is too large, the material can be deformed permanently. The initial part
of the tension curve which is recoverable immediately after unloading is termed. As elastic
and the rest of the curve which represents the manner in which solid undergoes plastic
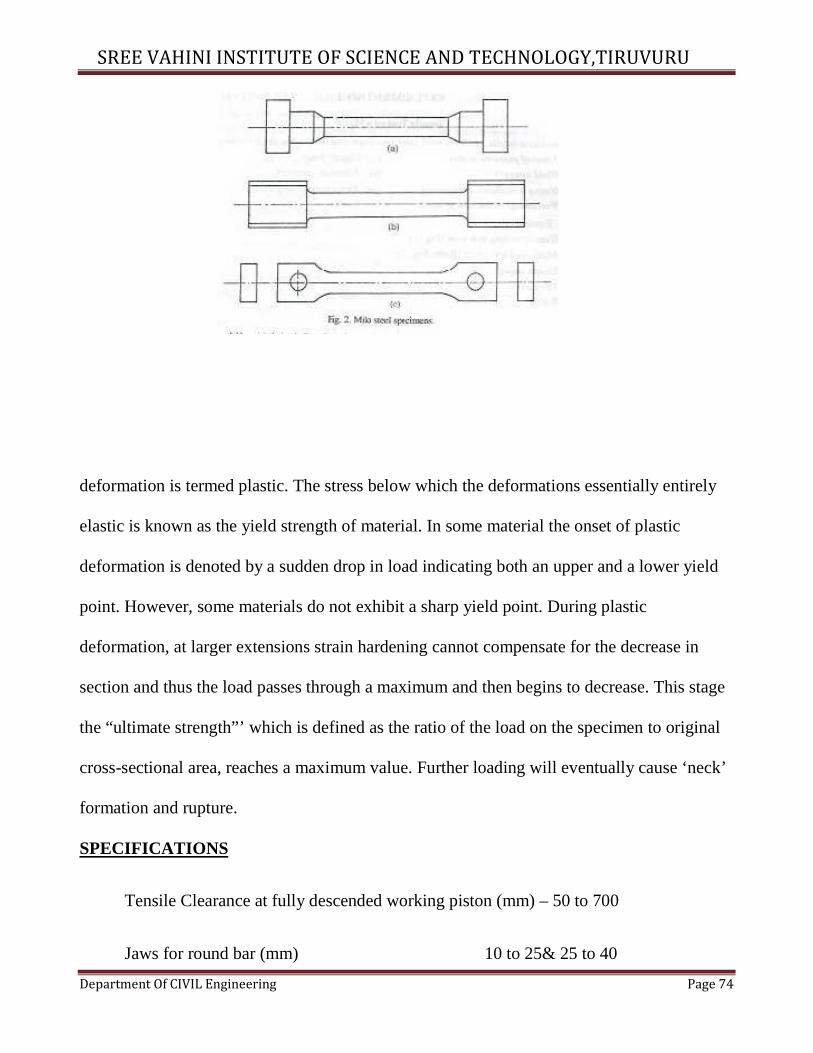
Page 74
SREE VAHINI INSTITUTE OF SCIENCE AND TECHNOLOGY,TIRUVURU
Department Of CIVIL Engineering Page 74
deformation is termed plastic. The stress below which the deformations essentially entirely
elastic is known as the yield strength of material. In some material the onset of plastic
deformation is denoted by a sudden drop in load indicating both an upper and a lower yield
point. However, some materials do not exhibit a sharp yield point. During plastic
deformation, at larger extensions strain hardening cannot compensate for the decrease in
section and thus the load passes through a maximum and then begins to decrease. This stage
the “ultimate strength”’ which is defined as the ratio of the load on the specimen to original
cross-sectional area, reaches a maximum value. Further loading will eventually cause ‘neck’
formation and rupture.
SPECIFICATIONS
Tensile Clearance at fully descended working piston (mm) – 50 to 700
Jaws for round bar (mm) 10 to 25& 25 to 40
Page 75
SREE VAHINI INSTITUTE OF SCIENCE AND TECHNOLOGY,TIRUVURU
Department Of CIVIL Engineering Page 75
Jaws for sheets metals (mm) 0 to 15 and 15 to 30
Width (mm) 65
DESCRIPTION
Select the proper jaw inserts and complete the upper and lower chuck
assemblies as described. Apply some graphite grease to the tapered surface of the grip
for the smooth motion then operate the upper cross head grip operation handle and
grip fully the upper and of the test piece. The left valve is kept in fully closed position
OBSERVATIONS
1. Initial diameter of specimen d1 = ------
2. Initial gauge length of specimen L1 = -----
3. Initial cross-section area of specimen A1 = ----
4. Load of yield point Ft. = -----
5. Ultimate load after specimen breaking F = -----
6. Final length after specimen breaking L2 = ------
7. Dia. Of specimen at breaking place d2 = -------
8. Cross section area at breaking place A2 = ---
Page 76
SREE VAHINI INSTITUTE OF SCIENCE AND TECHNOLOGY,TIRUVURU
Department Of CIVIL Engineering Page 76
DIAMETER OF SPECIMEN :(INTIAL DIA d1)
Sl.No MSR VC Total reading Average diameter
m m m m
NECK DIAMETER AFTER BREAKING (d2)
Sl.No MSR VC Total reading Average diameter
m m m m
and the right valve normal open position. Open the right valve and close at after
the lower table is slightly lifted. Now adjust the load to zero to TARE push button
(this is necessary to remove the head weight of the lower table, upper crossed and
other connecting parts from the load.
Operate the lower grip operation handle left the lower head up and grip fully the
lower part of the specimen. The the lock the jaws in this position by operating the jaw
locking handle. Then turn the right control valve slowly to open the position, (anti
clock wise) until you get a desired loading rate. After this you will find that the
specimen is under load and looser unclamp the locking handle. Now the jaws will not
slide down due to their own weight then go on increasing the load. When the test piece
Page 77
SREE VAHINI INSTITUTE OF SCIENCE AND TECHNOLOGY,TIRUVURU
Department Of CIVIL Engineering Page 77
is broken, close the right control valve and take out the broken test pieces. Then open
the test control valve to take the position down
A1= Area of the specimen = = �3�
� ………………..mm2
A2 = Area of the Neck = ���
� ………………..mm2
Original length between selecting points, l = … m
Length between points after elongation, lo = …….. m
Percentage of elongation, (:;�:)
: X 100 =
Load at limit of proportionaliy
(i) Limit of proportion= ------------------------------------------
Original area of cross-section
Page 78
SREE VAHINI INSTITUTE OF SCIENCE AND TECHNOLOGY,TIRUVURU
Department Of CIVIL Engineering Page 78
load at elastic limit
(ii) Stress at elastic limit= ------------------------------------- N/mm2
Original area of c/s
Yield load
(iii) Yield strength = ------------------------------- N/mm2 Original area of c/s
Maximum tensile load
(iv) Ultimate strength= ------------------------------------ N/mm2 Original area of c/s
Stress at below proportionality
(v) Young’s modulus= --------------------------------------- N/mm2
Corresponding strain
PROCEDURE:-
1. Measure the original length and diameter of the specimen. The length may either be
length of gauge section which is marked on the specimen with a preset punch or the
total length of the specimen.
2. Insert the specimen into grips of the test machine and attach strain-measuring device
to it.
3. Begin the load application and record load versus elongation data
4. Take readings more frequently as yield point is approached.
5. Measure elongation values with the help of dividers and a ruler.
6. Continue the test till Fracture occurs.
Page 79
SREE VAHINI INSTITUTE OF SCIENCE AND TECHNOLOGY,TIRUVURU
Department Of CIVIL Engineering Page 79
7. By joining the two broken halves of the specimen together, measure the final length
and diameter of specimen.
PRECAUTIONS:-
1. Measure deflection on scale accurately & carefully
2. Maintain distance from while the experiment is processing
3. The specimen should be prepared in proper dimentions.
4. The specimen should be properly to get between the jaws.
5. Take reading carefully.
6. After breaking specimen stop to m/c.
Final length (at fracture) – original length
(vi) Percentage elongation= ------------------------------------------------------ % Original length
Original area-area at fracture
(vii) Percentage reduction in area = ----------------------------------------------= %
Original area
Page 80
SREE VAHINI INSTITUTE OF SCIENCE AND TECHNOLOGY,TIRUVURU
Department Of CIVIL Engineering Page 80
RESULT;
1. Braking stress = <
�= …………. N/mm2
2. Ultimate stress = >��
………………. N/mm2
3. Average % Elongation =………………%
Page 81
SREE VAHINI INSTITUTE OF SCIENCE AND TECHNOLOGY,TIRUVURU
Department Of CIVIL Engineering Page 81
Page 82
SREE VAHINI INSTITUTE OF SCIENCE AND TECHNOLOGY,TIRUVURU
Department Of CIVIL Engineering Page 82
COMPRESSION TEST ON UTM
AIM: - compressive test on a given specimen
OBJECT:
To conduct compressive test of given specimen to determine the compressive
strength
APPARATUS:
1. Universal testing machine,
2. Compression pads,
3. Given specimen(clay brick)
THEORY:
Page 83
SREE VAHINI INSTITUTE OF SCIENCE AND TECHNOLOGY,TIRUVURU
Department Of CIVIL Engineering Page 83
Several m/c and structure components such as columns and struts are subjected
to compressive load in applications. These components are made of high compressive
strength materials. Not all the materials are strong in compression. Several materials, which
are good in tension, are poor in compression. Contrary to this, many materials poor in
tension but very strong in compression. Cast iron is one such example. That is why
determine of ultimate compressive strength is essential before using a material. This strength
is determined by conduct of a compression test.
Compression test is just opposite in nature to tensile test. Nature of deformation and
fracture is quite different from that in tensile test. Compressive load tends to squeeze the
specimen. Brittle materials are generally weak in tension but strong in compression. Hence
this test is normally performed on cast iron, cement concrete etc. But ductile materials like
aluminum and mild steel which are strong in tension, are also tested in compression.
COMPRESSION TEST ON BRICK
Breadth of the Brick, B = m
Length of the Brick, L = m
Formulae:
Compression stress = >�
=…………… N/mm2
Where,
Page 84
SREE VAHINI INSTITUTE OF SCIENCE AND TECHNOLOGY,TIRUVURU
Department Of CIVIL Engineering Page 84
W = Maximum Load N
A = Area of the specimen = L×B mm2
L = Length of the Brick m
B = Breadth of Brick m
Graph: Load Vs Elongation
DESCRIPTION:
Fix upper and lower pressure plates on the lower cross – head and lower table respectively.
Place the specimen on lower compression plate. The specimen must be aligned exactly
according to the marking on the compression plate order to give the complete cross-section
the specimen a change to participate equally in the acceptance of load. Then adjusted to by
lifting the lower table and perform the test in the same way as the tension test.
TEST SET-UP, SPECIFICATION OF M/C AND SPECIMEN DETA ILS:
A compression test can be performed on UTM by keeping the test-piece on base block and
Page 85
SREE VAHINI INSTITUTE OF SCIENCE AND TECHNOLOGY,TIRUVURU
Department Of CIVIL Engineering Page 85
moving down the central grip to apply load. It can also be performed on a compression
testing machine. A compression testing machine shown in fig. it has two compression
plates/heads. The upper head moveable while the lower head is stationary. One of the two
heads is equipped with a hemispherical bearing to obtain.
Uniform distribution of load over the test-piece ends. A load gauge is fitted for recording the
applied load.
SPECIMEN :-
In cylindrical specimen, it is essential to keep h/d ≤ 2 to avoid lateral instability due to
bucking action. Specimen size = h ≤ 2d.
for clay brick the specimen size should be 190 X 90 X 90 mm
PROCEDURE
1. Place the specimen in position between the compression pads
2. Switch on the UTM
For compression test we can also:
� Draw stress-strain (σ-ε) curve in compression,
� Determine Young’s modulus in compression,
� Determine ultimate (max.) compressive strength, and
� Determine percentage reduction in length ( or height) to the specimen
Page 86
SREE VAHINI INSTITUTE OF SCIENCE AND TECHNOLOGY,TIRUVURU
Department Of CIVIL Engineering Page 86
3. Bring the drag indicator in contact with the main indicator.
4. Select the suitable range of loads and space the corresponding weight in the pendulum
and balance it if necessary with the help of small balancing weights
5. Operate (push) the button for driving the motor to drive the pump.
6. Gradually move the head control ever in left hand direction till the specimen fails.
7. Note down the load at which the specimen shears
8. Stop the machine and remove the specimen.
9. Repeat the experiment with other specimens
Page 87
SREE VAHINI INSTITUTE OF SCIENCE AND TECHNOLOGY,TIRUVURU
Department Of CIVIL Engineering Page 87
PRECAUTIONS
1. Place the specimen at center of compression pads
2. The specimen should be prepared in proper dimensions
3. Stop the UTM as soon as the specimen fails
4. Cross sectional area of specimen for compression test should be kept large as
compared to the specimen for tension test: to obtain the proper degree of stability.
5. Take reading carefully.
RESULT :-
The compressive strength of given specimen = -------N/mm2
BENDING TEST ON UTM
AIM:
To perform the bending test on UTM
OBJECT:
Page 88
SREE VAHINI INSTITUTE OF SCIENCE AND TECHNOLOGY,TIRUVURU
Department Of CIVIL Engineering Page 88
To determine the values of bending stresses and young’s modulus of the material of a
beam (say a wooden or steel) simply supported at the ends and carrying a concentrated load
at the center.
APPARATUS:
1. UTM or Beam apparatus
2. Bending fixture
3. vernier caliper
4. meter rod
5. test piece
THEORY:-
If the beam is supports at the two ends, the beam is known simply supported beam. When
a beam is subjected to load the beam goes under deformation. The difference between the
elastic curve to original position of the beam is called deflection. When a simply
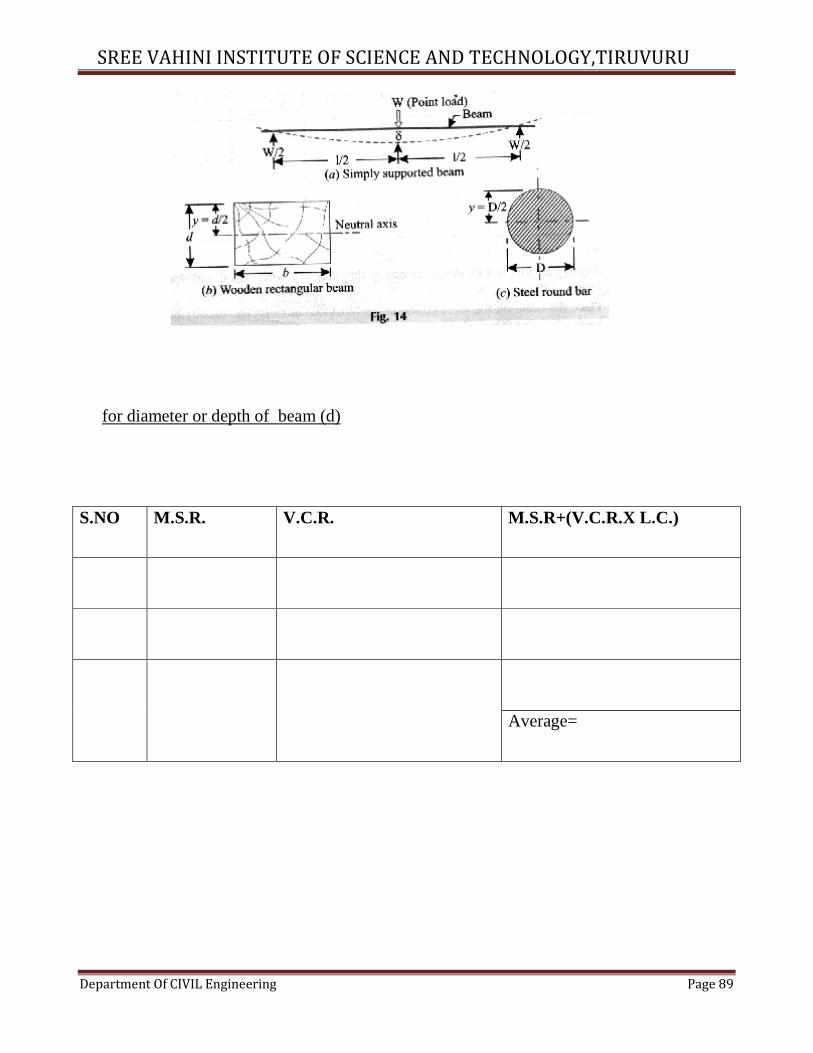
Page 89
SREE VAHINI INSTITUTE OF SCIENCE AND TECHNOLOGY,TIRUVURU
Department Of CIVIL Engineering Page 89
for diameter or depth of beam (d)
S.NO M.S.R. V.C.R. M.S.R+(V.C.R.X L.C.)
Average=
Page 90
SREE VAHINI INSTITUTE OF SCIENCE AND TECHNOLOGY,TIRUVURU
Department Of CIVIL Engineering Page 90
supported beam subjected to point load at the midpoint, the beam bends concave
upwards.
The deflection at mid point is given by
� =,-�
4801
From above equation
0 =,-�
48�1
Where
W =Load acting at the center, N
L =Length of the beam between the supports mm
E =Young’s modulus of material of the beam, N/mm2
I =Second moment of area of the cross- section (i.e, moment of Inertia) of the
beam, about the neutral axis, mm4
1 = 2��
3� for rectangular beam
where
b= width of beam and d= depth of the beam
Page 91
SREE VAHINI INSTITUTE OF SCIENCE AND TECHNOLOGY,TIRUVURU
Department Of CIVIL Engineering Page 91
OBESERVATION TABLE :-
SI.NO LOADS ON
BEAM
δ1 δ2 δ Young’s
modulus
0 =,-�
48�1
Bending
moment
M=8�
�
Bending
stress
6 =51
7
1
2
3
4
5
6
δ1= deflection in increasing order
δ2= deflection in decreasing order
1 = ��
�� for cirucular section
Where
d= diameter of the beam
Page 92
SREE VAHINI INSTITUTE OF SCIENCE AND TECHNOLOGY,TIRUVURU
Department Of CIVIL Engineering Page 92
BENDING STRESS:
When the stress produced to due to bending moment, the stress is known as bending
stress. The bending stress can be obtained by bending equation
04
=51
=67
Where E =Young’s modulus of material of the beam, N/mm2
R= radius of curvature
M=bending moment=8�
�,Nmm
I =Second moment of area of the cross- section,mm4
f= bending stress, N/mm2
y=distance from N.A. ,mm
For simply supported beam bending moment is zero at supports and maximum at mid point
when the load is symmetrical
Page 93
SREE VAHINI INSTITUTE OF SCIENCE AND TECHNOLOGY,TIRUVURU
Department Of CIVIL Engineering Page 93
PROCEDURE:
1. Adjust the supports alone the UTM bed so that they are symmetrically with respect to
the length of the bed
2. Place the beam on the knife-edges on the blocks so as to project equally beyond each
knife-edge. See that the load is applied at the center of the beam.
3. Note the initial reading of vernier scale.
4. Apply a load and again note the reading of the vernier scale.
5. Go on taking reading applying load in steps each time till you have minimum 6
readings.
6. Find the deflection (d) in each time by subtracting the initial reading of vernier scale
7. Draw a graph between load (W) and deflection (δ). On the graph choose any two
convenient points and between these points find the corresponding values of W and
(δ).
8. Calculate youngs modulus and bending equaion using relation
9. Repeat the experiment for different beams.
Page 94
SREE VAHINI INSTITUTE OF SCIENCE AND TECHNOLOGY,TIRUVURU
Department Of CIVIL Engineering Page 94
Page 95
SREE VAHINI INSTITUTE OF SCIENCE AND TECHNOLOGY,TIRUVURU
Department Of CIVIL Engineering Page 95
PRECAUTIONS:
1. Test piece should be properly touch the fixture.
2. Test piece should be straight.
3. Take reading carefully.
4. Elastic limit of the beam should not be exceeded.
RESULT:
1. The young’s modulus for steel beam/wooden beam is found to be----- N/mm2.
2. The bending stress for steel beam/wooden beam is found to be----- N/mm2
Page 96
SREE VAHINI INSTITUTE OF SCIENCE AND TECHNOLOGY,TIRUVURU
Department Of CIVIL Engineering Page 96
Page 97
SREE VAHINI INSTITUTE OF SCIENCE AND TECHNOLOGY,TIRUVURU
Department Of CIVIL Engineering Page 97
SHEAR TEST ON UTM
AIM: -
To determined Shear Test of Steel.
OBJECT: -
To conduct shear test on specimens under double shear:
APPARATUS: -
1. Universal testing machine.
2. Shear test attachment.
3. Specimens.
THEORY:
A type of force which causes or tends to cause two contiguous parts of the body to
slide relative to each other in a direction parallel to their plane of contact is called the shear
force. The stress required to produce fracture in the plane of cross-section, acted on by the
shear force is called shear strength.
Place the shear test attachment on the lower table, this attachment consists of cutter.
The specimen is inserted in shear test attachment & lift the lower table so that the zero is
adjusted, then apply the load such that the specimen breaks in two or three pieces. If the
specimen breaks in two pieces then it will be in single shear & if it breaks in three pieces
then it will be in double shear.
PROCEDURE:
1. Insert the specimen in position and grip one end of the attachment in the upper
portion and one end in the lower portion.
Page 98
SREE VAHINI INSTITUTE OF SCIENCE AND TECHNOLOGY,TIRUVURU
Department Of CIVIL Engineering Page 98
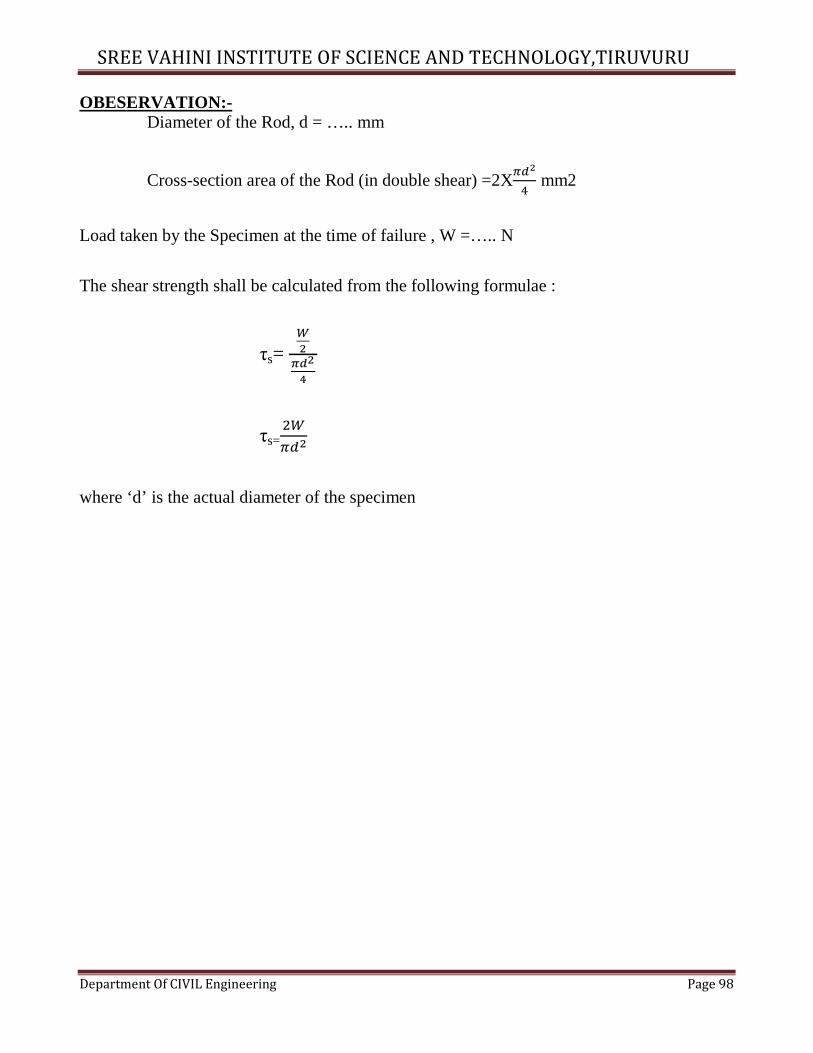
OBESERVATION:- Diameter of the Rod, d = ….. mm
Cross-section area of the Rod (in double shear) =2X��
� mm2
Load taken by the Specimen at the time of failure , W =….. N
The shear strength shall be calculated from the following formulae :
τs= @�
AB�
�
τs=�8��
where ‘d’ is the actual diameter of the specimen
Page 99
SREE VAHINI INSTITUTE OF SCIENCE AND TECHNOLOGY,TIRUVURU
Department Of CIVIL Engineering Page 99
2. Switch on the main switch of universal testing machine machine.
3. The drag indicator in contact with the main indicator.
4. Select the suitable range of loads and space the corresponding weight in the
pendulum and balance it if necessary with the help of small balancing weights.
5. Operate (push) buttons for driving the motor to drive the pump.
6. Gradually move the head control level in left-hand direction till the specimen
shears.
7. Down the load at which the specimen shears.
8. Stop the machine and remove the specimen
9. Repeat the experiment with other specimens
PRECAUTIONS :-
1. 1 The measuring range should not be changed at any stage during the test.
2. The inner diameter of the hole in the shear stress attachment should be slightly
greater than that of the specimen.
3. Measure the diameter of the specimen accurately.
4. The specimen should be all place equal dia.
5. After shearing specimen stop to m/c.
RESULT:
The Shear strength of mild steel specimen is found to be = ……………… N/mm2
Page 100
SREE VAHINI INSTITUTE OF SCIENCE AND TECHNOLOGY,TIRUVURU
Department Of CIVIL Engineering Page 100
Page 101
SREE VAHINI INSTITUTE OF SCIENCE AND TECHNOLOGY,TIRUVURU
Department Of CIVIL Engineering Page 101
VERIFICATION OF MAXWELL’S RECIPROCAL THEOREM
AIM:
To verify Maxwell reciprocal theorem
APPARATUS:
Weights, hanger, dial gauge, scale and vernier calipers
THEORY:
Maxwell’s theorem in its simplest form states the deflection of any point A of
Any elastic structure due to load P at any point B is same as the deflection of the
beam due to same load applied at A.
It is, therefore easily verified that the deflection curve for a point in a
structure is same as the deflected curve of the structure when unit load is applied at
point for which the influence curve was obtained.
PROCEDURE:
1. Apply the load either at centre of simply supported span or at the free end of the beam.
The deflected form can be obtained
2. Measure the height of the beam at certain distance by means of dial gauge before and
after loading and determine the deflection before and after at each point separately
3. Now move a load along the beam at certain distance and for each position of the load,
the deflection of the point was noted where the load is applied in step1 this deflection
should be measured at each such point before and after loading, separately
Page 102
SREE VAHINI INSTITUTE OF SCIENCE AND TECHNOLOGY,TIRUVURU
Department Of CIVIL Engineering Page 102
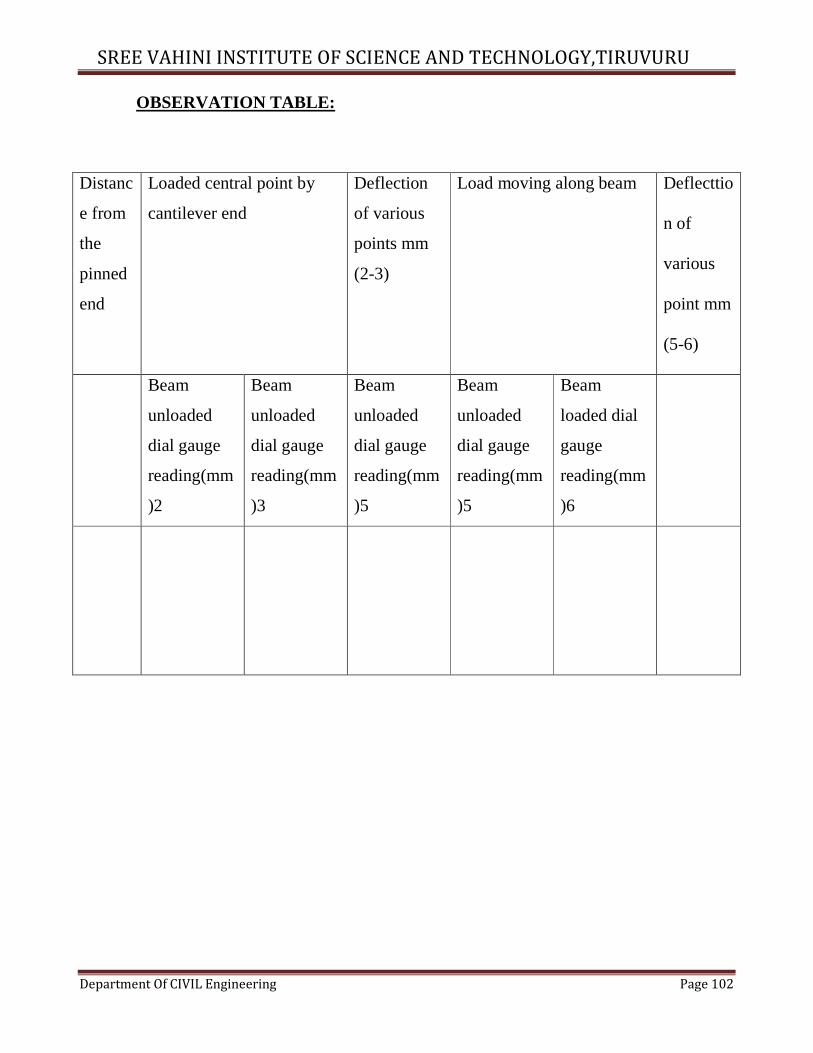
OBSERVATION TABLE:
Distanc
e from
the
pinned
end
Loaded central point by
cantilever end
Deflection
of various
points mm
(2-3)
Load moving along beam Deflecttio
n of
various
point mm
(5-6)
Beam
unloaded
dial gauge
reading(mm
)2
Beam
unloaded
dial gauge
reading(mm
)3
Beam
unloaded
dial gauge
reading(mm
)5
Beam
unloaded
dial gauge
reading(mm
)5
Beam
loaded dial
gauge
reading(mm
)6
Page 103
SREE VAHINI INSTITUTE OF SCIENCE AND TECHNOLOGY,TIRUVURU
Department Of CIVIL Engineering Page 103
4. Plot the graph between deflection as ordinate and position of point abssica the plot
graph drawn in step 2 and step 3. These are the influence line ordinates for deflection
of the beam
PRECAUTIONS:
1. Apply the load without any jerk
2. Perform the experiment at a location which away from any
3. Avoid external disturbance
4. Ensure that the supports or rigid
RESULT:
The Maxwell’s reciprocal theorem is verified experimentally and analytically
Page 104
SREE VAHINI INSTITUTE OF SCIENCE AND TECHNOLOGY,TIRUVURU
Department Of CIVIL Engineering Page 104
Page 105
SREE VAHINI INSTITUTE OF SCIENCE AND TECHNOLOGY,TIRUVURU
Department Of CIVIL Engineering Page 105
USE OF ELECTRICAL RESISTANCE STAIN GAUGES
AIM:
To determine the Strain of the cantilever beam subjected to Point load at the free
end and to plot the characteristic curves.
APPARATUS:
1. Cantilever Beam Strain gauge Trainer Kit
2. Weights and Millimeter
FORMULA USED:
Strain, S = �C�DE!�
Where,
P=Load applied in Kg.
L = Effective length of the beam in cm.
B = Width of the beam in cm.
T = thickness of the beam in cm.
E = young’s modulus = 2x10⁵N/mm2.
S = Micro strain
THEORY:
When the material is subjected to any external load, there will be small change in the
Mechanical properties like thickness of the material or change in the length
Page 106
SREE VAHINI INSTITUTE OF SCIENCE AND TECHNOLOGY,TIRUVURU
Department Of CIVIL Engineering Page 106
OBSERVATION:
Si.no Weight (gms)
Actual readings (using formula) micro strains
Display readings Error( %) While loading micro strains
While un loading micro strains
1 100
2 200
3 300
4 400
5 500
6 600
7 700
8 800
9 900
10 1000
Actual reading - display reading
% ERROR = ----------------------------------------- X 100
Maximum weight
Page 107
SREE VAHINI INSTITUTE OF SCIENCE AND TECHNOLOGY,TIRUVURU
Department Of CIVIL Engineering Page 107
Depending upon the nature of load applied to the material. The change in mechanical
properties will remain till the load is released. The change in the property is called
Strain (or) material gets strained.
Strain S = ∂L/L
Since the change in length is very small, it is difficult to
measure ∂L, so the strain is measured in micro strain. Since it is difficult to measure
the length, Resistance strain gauge are used to measure strain in the material directly.
Strain gauges are bonded directly on the material using special adhesive s. As the
material get strained due to load applied the resistance of the strain gauge changes
proportional to the load applied. This change in resistance is used to convert
mechanical property into electrical signal which can be easily measured and stored
for analysis.
The change in the resistance of the strain gauge depends on the
sensitivity of the strain gauge which is expressed in terms of a gauge factor, Sg
Sg = ∆GG
The output ΔR/R of a strain gauge is usually converted into voltage signal with a
Wheatstone bridge. If a single gauge is used in one arm of Wheatstone bridge and equal but
fixed resistors is used in the other arm, the output voltage is
EO = HI
�∆JKJK
EO= 3�HILM∆
Page 108
SREE VAHINI INSTITUTE OF SCIENCE AND TECHNOLOGY,TIRUVURU
Department Of CIVIL Engineering Page 108
Page 109
SREE VAHINI INSTITUTE OF SCIENCE AND TECHNOLOGY,TIRUVURU
Department Of CIVIL Engineering Page 109
The input voltage is controlled by the gauge size and the initial resistance of the gauge. As a
result, the output voltage Eo usually ranges between 1 to 10 ΔV / micro units of strain.
PROCEDURE:
1. The instrument is switched on ( i.e.,). The display glows to indicate the
instrument is ON.
2. The Instrument is allowed to be in ON position for 10 minutes for initial
worm-up.
3. From the selector switch, FULL or HALF bridge configuration is
selected.
5. The potentiometer is adjusted for ZERO till the displays reads ' 000’
6. 1 Kg load is applied on the pan of the cantilever the CAL Potentiometer is adjusted till
the display reads 377 micro strains. When the weights are removed the display should
come to ZERO, in case of any variation, ZERO Potentiometer is adjusted again and
the procedure is repeated again. Now the instrument is calibrated to read micro strains.
7. Then the loads are applied on the pan in steps of 100 gm up to 1kg. When the
cantilever is strained, instrument displays exact micro strain.
8. The readings are noted down in the tabular column. Percentages error in readings,
hysteresis and accuracy of the instrument can be calculated by comparing with the
theoretical results.
Page 110
SREE VAHINI INSTITUTE OF SCIENCE AND TECHNOLOGY,TIRUVURU
Department Of CIVIL Engineering Page 110
Page 111
SREE VAHINI INSTITUTE OF SCIENCE AND TECHNOLOGY,TIRUVURU
Department Of CIVIL Engineering Page 111
RESULT:
Thus the strain of the cantilever beam subjected to free end loading, is obtained in micro
strains and the characteristics curves – Load Vs Strain, Output Voltage Vs Strain and Actual
Vs Display readings are plotted.