64
Star-formation in the (Early) Universe a.k.a. My Decade-long Quest to Learn about SMGs Attila Kovács University of Minnesota Groningen, 28 Feb 2011
| Date post: | 08-Aug-2015 |
| Category: |
Documents |
| Upload: | attila-kovacs |
| View: | 15 times |
| Download: | 0 times |

Star-formation in the (Early) Universea.k.a.
My Decade-long Quest to Learn about SMGs
Attila KovácsUniversity of Minnesota
Groningen, 28 Feb 2011

Appetizer
Submillimeter Galaxies
Mezze
Innovations
Entree
Interperting SMG SurveysDisentangling Multiplets
FIR CharacterizationsDust SED Models
Dessert
Looking to the Future...

SHARC-2
Groningen, 28 Feb 2011

Submillimeter Galaxies (SMGs)
Hughes et al. 1998
1998
SCUBA Groningen, 28 Feb 2011
~300,000 SMGs
2011
The First Detections

Submillimeter Galaxies (SMGs)
Hughes et al. 1998
The First Detections
SCUBA
Too many optical counterpartsOr none at al...
Groningen, 28 Feb 2011
in Nature!!!

~35 K (dust)
Arp 220The Energy Spectrum of a Luminous Galaxy
Milky Way FIR fraction is about 50%, T~16K
Groningen, 28 Feb 2011

Arp 220 at z=2.3The Energy Spectrum of a Distant Luminous Galaxy?
FIR/submm is great for studying distant populations!
Groningen, 28 Feb 2011

The Cosmic Background
Hasinger 2000
Infrared background is due to such star-forming galaxies....
SMGs account for the bulk of the star-formation in the Universe
Groningen, 28 Feb 2011

Essential Technologies
Totalpower bolometers
Scanning strategies
Data reduction
Groningen, 28 Feb 2011

A Galaxy far far away...(10 Gly, 35K)
atmosphere(300K)
The challenges of ground-based observing
1/f noise
Unstable gain/noise
Microphonics
EM pickup
Groningen, 28 Feb 2011

Total-power Bolometer Arrays
Groningen, 28 Feb 2011
Kovács et al. 2010, ApJ, 717, 29
SHARC-2 (350um)
LABOCA (870um)
GISMO (2mm)ASZCA (2mm)

Scanning Patterns for ImagingPattern Gallery
http://www.submm.caltech.edu/~sharc/scanning/
DREAM OTFOTF
(cross-linked) Lissajous
Billiard (closed) Billiard (open) spiral raster-spiral
random
... and otherpatterns...
What is your favourite?
Groningen, 28 Feb 2011
Kovács, 2008, Proc. SPIE 7020, 5

Narrow-band Resonance(isotropic)
Correlated Noise(atmosphere, T-fluctiation)
1/f Noise
Sky Noise
Wide-band Resonance(oriented)
Groningen, 28 Feb 2011
Scanning PatternsSpectral Dispersion (noise resistance)
Kovács, 2008, Proc. SPIE 7020, 5
http://www.submm.caltech.edu/~sharc/scanning/

OTF(cross-linked) Billiard (open) Lissajous raster-spiral
LABOCAGISMO
SHARC-2SCUBA-2
SHARC-2GISMO
LABOCA, SABOCA
LABOCA, SABOCA
Groningen, 28 Feb 2011
Scanning Patterns Kovács, 2008, Proc. SPIE 7020, 5

1/f noise
Unstable gain/noise
Microphonics
EM pickup
Glitches
www.submm.caltech.edu/~sharc/crush
Groningen, 28 Feb 2011
Kovács, 2008, Proc. SPIE 7020, 45
SHARC-2 (350um)

Groningen, 28 Feb 2011
SHARC-2
350um
CSO(2003)
LABOCA
870um
APEX(2007)
SABOCA
350um
APEX(2008)
ASZCA
2mm
APEX(2006)
p-ArTeMiS
200um350um450um
APEX(2011)
PolKa
870umpolarimetry
APEX(2010)
GISMO
2mm
IRAM(2008+)
SCUBA-2
450um850um
JCMT(2010+)
Easily expandable to more instruments...
... and different data types(e.g. spectral scanning, heterodyne arrays, interferometry?)
sharcsolve BoA SMURF

Entree
Interpreting SMG Surveys
Disentangling Multiplets
Groningen, 28 Feb 2011

A Larger, Deeper Survey of Submillimeter Galaxies
Attila Kovács
Axel Weiss
I. Smail, K. Coppin, F. Walter, T. Greve et al.
University of Minnesota
MPIfR
2010 JPLWeiss et al., ApJ, 707, 42 (2009)

T. Greve
K-Correction Benefits...
850 micron is equally sensitive to the same galaxy at z ~ 1 ̶8...(the shorter wavelengths less so...)
Groningen, 28 Feb 2011

LABOCA(Large Bolometer Camera)
Siringo et al. 2009
295 pixels
(870um)
Groningen, 28 Feb 2011

mJy/beam
300 hours
19” beam(27” smoothed)
1.2 mJy/beam
125 sources(5 false)
The CDFS at 870 microns
Groningen, 28 Feb 2011
Weiss et al. 2009, ApJ, 707, 42

30'
Groningen, 28 Feb 2011

1. Bin your source brightnesses
2. Deboost with
3. Completeness correction
4. Get dN/dS
How (Not) to Get Source Counts...The “Direct” Method...
Hidden caveat: one source per detection is typically assumed (i.e. no blending)
Groningen, 28 Feb 2011
Coppin et al. 2006
Stellar Analogy:
IMF
Luminosity Function
Evolution (color)
(z-Distribution)

P(D) Analysis
Many faint sourceswiden distribution(confusion noise)
Bright sourcesProduce tail
P(D) analysis
Observed distribution is a product of the source distribution and the underlying noise...
dete
ctio
n li
mit
dete
ctio
n li
mit
Groningen, 28 Feb 2011
Weiss et al. 2009, ApJ, 707, 42

Schechter Barger
P(D) Analysis: Parameters
Groningen, 28 Feb 2011
Weiss et al. 2009, ApJ, 707, 42

P(D) ResultsPower Law:
Smin
= 0.5 mJy
N0 = 92.7 mJy-1 deg-2
p = 3.178
Groningen, 28 Feb 2011
Weiss et al. 2009, ApJ, 707, 42

Source Counts from the CDFS
Integrated 870um Background: 29-33 Jy/deg2
COBE: 45 +- 5
CDFS SHADES
unbroken power law
Groningen, 28 Feb 2011
Coppin et al. 2006
Weiss et al. 2009, ApJ, 707, 42

Cosmic Variance?
Z > 2 K-band selected galaxies are under-abundant by ~60%.(Dokkum et al. 2006)
Z > 2.5 DRGs(Marchesini et al. 2006)
High-z optically bright AGNs (Dwelly & Page 2006)
UnderdensitiesIn the CDFS:
Groningen, 28 Feb 2011
Weiss et al. 2009, ApJ, 707, 42

Cosmic Variance?
Seems more a variation in steepness rather than density
Groningen, 28 Feb 2011
Weiss et al. 2009, ApJ, 707, 42

LABOCA vs Herschel Confusion
mJy/beam
12K source inserted(no clustering assumed)
The 870um sky from a 12-m telescope Herschel Deep Field
Groningen, 28 Feb 2011
Weiss et al. 2009, ApJ, 707, 42
Dominated by z<2 sources

15”
Do we know how to count?...
Groningen, 28 Feb 2011
Kovács et al. 2010, ApJ, 717, 29

15”
Groningen, 28 Feb 2011
Kovács et al. 2010, ApJ, 717, 29

15”Groningen, 28 Feb 2011
Kovács et al. 2010, ApJ, 717, 29

Weiss et al. (2009)
850-13
Pope et al. (2006)
Wang et al. (2010)
SMM J123707+6214SMM J123549+6215
Ivison et al. (2010)
Groningen, 28 Feb 2011
Kovács et al. 2010, ApJ, 717, 29

Source Counts: Conclusions
P(D) is a reliable way to get counts (and background!)
BUT
Need to know clustering to get it right....

Entree
FIR Characterization
Dust SED Models

Lifecycle of Dust and Stars
Star Formation
Active Stars(esp. High Mass)
Dying Stars(Planetary Nebulae)
(Supernovae)
DustProduction
Dust Heatingand Evaporation
Cooling & Collapsevia Dust
Md
L Td
Groningen, 28 Feb 2011

Md
Td
LFIR
Mgas
Tkin
SFR(κ
d, M
gas/M
d)
(perhaps...)
(heat source,IMF,
stellar evolution)
ß α
AGN/SBD(line contamination,cross-calibration)
(high density)
Groningen, 28 Feb 2011
Treasures in the Dust

Caltech Submillimeter Observatory
10.4 m Gregorian Telescope
12um RMS surface (DSOS Melanie Leong)
4,000m (13,000ft) Elevation
Groningen, 28 Feb 2011

SHARC-2 350um Image Gallery (2007-2009)
Groningen, 28 Feb 2011
Kovács et al. 2010, ApJ, 717, 29

Temperatures & Luminosities Radio-FIR Correlation
Kovács et al. 2006, ApJ, 650, 592
T ~ 35K, L ~ 1013 Lsun
Characterization of SMGs
Groningen, 28 Feb 2011
3 years of data...

Spitzer SMGsLocal IRAS galaxies Classical SMGs
Yun et al. (2001) Kovács et al. (2006) Kovács et al. (2010)
radio loud?
Groningen, 28 Feb 2011
Kovács et al. 2006, ApJ, 650, 592Radio—FIR Correlation
SMG Luminosities fueled by star-formation.

NGC 253
Groningen, 28 Feb 2011
Weiss et al. 2008, A&A, 490, 77

Flux data between12 um and 2 mm
(source: NED)
SED Case Study: Arp 220
Groningen, 28 Feb 2011

SED Case Study: Arp 220
parameters:
Md T
c β γ (d)
κd ~ νβ
dM(T) ~ μ0 T-γ
Mass-tempetature index γ is related to mass-FUV index α (Dale 2001)
T = 34.6 K
Analytic expressions forIntegrated luminosity(including optical depth)
β = D – 1
Emissivity index isrelated to the fractaldimension of dust:
Thus it is expected in the range 1 – 2. Typical values are~1.5.
Groningen, 28 Feb 2011
T = 75 KT = 44 K

Dale et al. (2001)
The SED Flavour of the Day...
3 type of grains2um – 2mm
dM(U)α ~ 1 – 2.5
libraries
1 grain type12um – 2mm
dM(T)γ ~ 5 – 9.25?
parametric
*
*
(heating also by shocks or infall)
β
γ
Td
(radiative heating only)
Groningen, 28 Feb 2011

T = 36.4±1.2 KL = (1.5±0.1) 1012
γ = 7.7±0.2
T = 35.8±2.0 KL = (6.6±0.3) 1010
γ = 7.1±0.3
T = 37.9±2.4 KL = (1.2±0.1) 1012
γ = 7.2±0.3
T = 28.0±1.9 KL = (4.5±0.2) 1011
γ = 6.9±0.3
T = 39.0±2.0 KL = (1.5±0.1) 1012
γ = 7.6±0.3
T = 32.2±1.1 KL = (8.7±0.4) 1011
γ = 7.1±0.1
Groningen, 28 Feb 2011
Kovács et al. 2010, ApJ, 717, 29

Local Starburts Spitzer SMGs
β = 1.54 ± 0.04 (D~2.5)
γ = 7.21 ± 0.09 γ = 6.6 ± 0.1
Dusty Starbursts Near and Far...
Groningen, 28 Feb 2011
Kovács et al. 2010, ApJ, 717, 29

z ~ 1—3(radio cutoff)
Hughes et al. 1998 Chapman et al. 2003 & 2005 Kovács et al. 2006
T ~ 35 KL ~ 1013 L
sun
The Issues: 10+ years of SMGs on 1 Slide...
Detections Redshifts via radio ID Characterizations~300,000 ~150 ~40
Groningen, 28 Feb 2011

Photometric Redshifts
Characterization (starburst vs AGN)
Stellar Masses
The Spitzer (mid-IR) Hope...
Only IRAC bands (and sometimes MIPS 24um) can see SMGs
Pope et al. 2006
Groningen, 28 Feb 2011
ACS 8um 24um VLA ACS 8um 24um VLA

?
Formation epochsStar-formation history
Mass-assembly
luminosity functionclustering
The Million-Dollar Questions
Groningen, 28 Feb 2011

ALMA +
EVLA
multibeamR~700
spectro-scopy
CCAT
Groningen, 28 Feb 2011
Solutions
Bradford et al. 2010

Groningen, 28 Feb 2011
Fits “Z-spec” on an Fλ pixel
100 pixel arraysfor CCAT?
Over 100 redshifts per night
Over 100,000 redshifts in 3 years....
Transmission Line Spectrometers Kovács & Zmuidzinas 2011

THE END

ROSAT LABOCA (870um) magnification(Johan Richard)
Candy: AC 114
De Fillipis et al. (2010)

ROSAT LABOCA (870um) magnification(Johan Richard)
Candy: AC 114

ROSAT LABOCA (870um) magnification(Johan Richard)
Candy: AC 114

26
0.5 31 2
z
0 1000
SMGs(z~13)

Classical SMGs Spitzer SMGs
z 2.2 ± 0.7 2.04 ± 0.3
Tc [K] 32 ± 8 32.4 ± 2.4
log L [L ]⊙ 12.9 ± 0.6 13.0 ± 0.15
log Md [M ]⊙ 9.0 ± 0.3 8.9 ± 0.1
q 2.12 ± 0.12 2.08 ± 0.09
evolution 0.85 ± 0.29 0.87 ± 0.14
Mean Properties and Sample Scatter

Cosmic Variance?
Sparse Dense
22-28 Jy/deg2 30-38 Jy/deg2
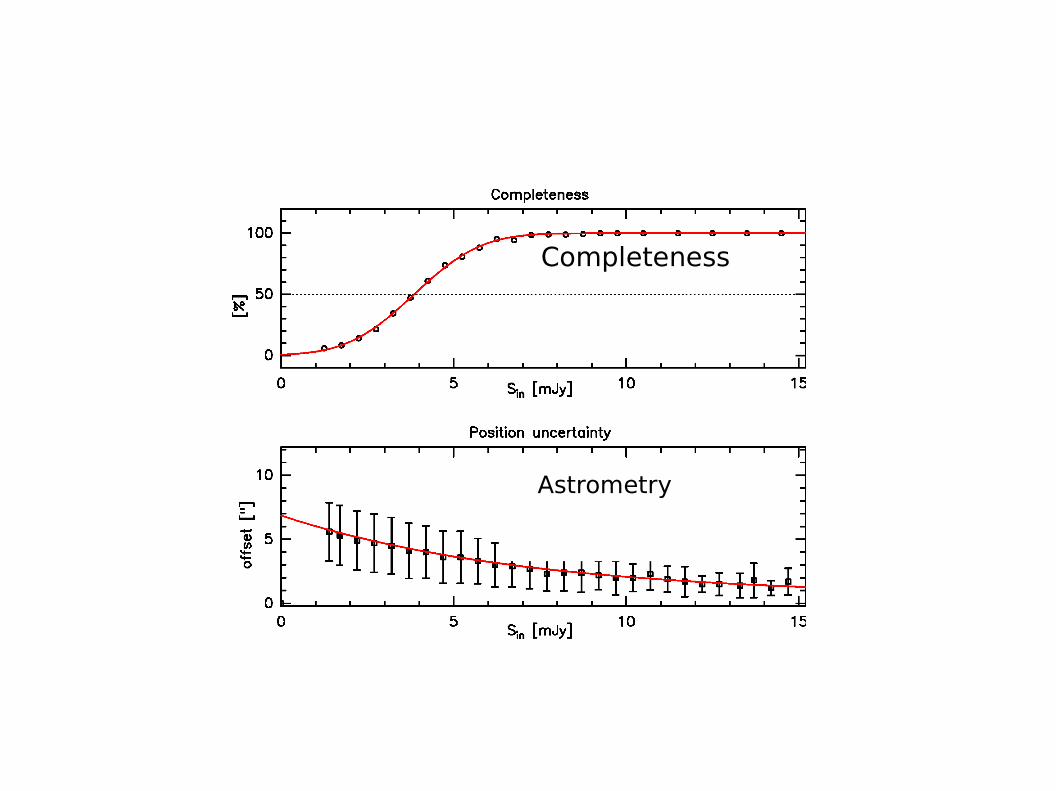
Completeness
Astrometry

mJy/beam
The CDFS at 870 microns
300 hours
19” beam(27” smoothed)
1.2 mJy/beam
125 sources(5 false)

Yun et al. (2001)
Where To? --- Get Radio Data...Refining the Radio to Far-Infrared Correlation
Local IRAS Galaxies SMGs
q ~ L(FIR) / L(1.4 GHz)
Kovács et al. (2006)
Intrisinc scatter ~ 0.3 dex Intrinsic scatter ~ 0.12 dex

Caveats...Line Contamination &Cross Calibration...
Z-spec (M. Bradford)


![S5P Mission Performance Centre Methane [L2 CH4 ] Readme · S5P MPC Product Readme Methane V01.03.02 S5P-MPC-SRON-PRF-CH4 issue 1.4, 2020-03-11 - Released Page 4 of 15 1 Summary This](https://static.documents.pub/doc/80x56/5f5f17a0ec35ef1b6d1e3267/s5p-mission-performance-centre-methane-l2-ch4-s5p-mpc-product-readme-methane.jpg)
![S5P Mission Performance Centre Methane [L2 CH4 ] Readme · 2019-09-25 · S5P Mission Performance Centre Methane [L2__CH4___] Readme document number S5P-MPC-SRON-PRF-CH4 Issue 1.2](https://static.documents.pub/doc/80x56/5e5ba7bee692361c8466afa3/s5p-mission-performance-centre-methane-l2-ch4-2019-09-25-s5p-mission-performance.jpg)


